A REVIEW OF THE TECHNIQUES FOR THE FORENSIC INVESTIGATION AND DIFFERENTIATION OF HUMAN BLOOD AND DECOMPOSITION FLUID STAINS By Rachel Lee Anderson A thesis submitted in fulfilment of the requirements for the degree of Master of Forensic Science (Professional Practice) in The School of Veterinary and Life Sciences Murdoch University Principle Supervisor: Dr Gavin Turbett Academic Supervisor: Associate Professor James Speers Semester 2, 2016
Transcript
A REVIEW OF THE TECHNIQUES FOR THE FORENSIC INVESTIGATION AND DIFFERENTIATION OF HUMAN BLOOD AND DECOMPOSITION FLUID STAINS
By
Rachel Lee Anderson
A thesis submitted in fulfilment of the requirements for the degree of
Master of Forensic Science (Professional Practice)
in
The School of Veterinary and Life Sciences
Murdoch University
Principle Supervisor: Dr Gavin Turbett
Academic Supervisor: Associate Professor James Speers
Semester 2, 2016
ii
Declaration
I declare that this thesis does not contain any material submitted previously for the award
of any other degree or diploma at any university or other tertiary institution. Furthermore,
to the best of my knowledge, it does not contain any material previously published or
written by another individual, except where due reference has been made in the text.
Finally, I declare that all reported experimentations performed in this research were
carried out by myself, except that any contribution by others, with whom I have worked is
explicitly acknowledged.
Signed: Rachel Lee Anderson
iii
Acknowledgements
First and foremost, I would like to thank Dr Gavin Turbett and Associate Professor James
Speers for their support, guidance, mentorship, and constructive feedback offered
throughout this process. I sincerely appreciate the generosity with which you have shared
your time.
I would like to extend my thanks and gratitude to Dr Paola Magni for her willingness to
assist with the experimental design of this topic and to Brendan Chapman for providing a
possible method for differentiation.
To Associate Professor Bob Mead, thank you for the time you shared with me during the
initial stages of this thesis. Your approachable nature is very much appreciated.
To the other Master’s students, I am grateful to have shared this experience with you.
Lastly, I would like to thank my family and friends for their constant support, guidance,
patience, and encouragement. Your contributions throughout this process have been
invaluable.
iv
Table of Contents
Title Page ................................................................................................................................... i
Declaration ............................................................................................................................... ii
Acknowledgements ................................................................................................................ iii
Table of Contents .................................................................................................................... iv
Table 7.1. Potential methods for the differentiation of blood and decomposition fluid
and the associated limitations ....................................................................... 68
viii
L ist of Abbreviations
ADD Accumulated Degree Days
ALS Alternative Light Source
ATP Adenosine Triphosphate
ATR-‐IR Attenuated Total Reflectance Infrared Spectroscopy
CDI Cadaver Decomposition Island
CE Capillary Electrophoresis
ESI Electrospray Ionisation
ESI Q-‐TOF Electrospray Ionisation Time of Flight
FAME Fatty Acid Methyl Ester
FID Flame Ionisation Detection
GC Gas Chromatography
GC-‐MS Gas Chromatography Mass Spectrometry
Hb Deoxyhaemoglobin
HbO2 Oxyhaemoglobin
HC Hemichrome
HPLC High Performance Liquid Chromatography
kDA Kilodalton
LC Liquid Chromatography
MALDI Matrix Assisted Laser Desorption/Ionisation
Met-‐Hb Met-‐haemoglobin
miRNA Micro Ribonucleic Acid
mRNA Messenger Ribonucleic Acid
MS Mass Spectrometry
MS/MS Tandem Mass Spectrometry
NRN Ninhydrin Reactive Nitrogen
PCR Polymerase Chain Reaction
RBC Red Blood Cell
SPE Solid Phase Extraction
SPME Solid Phase Microextraction
STR Short Tandem Repeat
TD-‐GCMS Thermal Desorption Gas Chromatography Mass Spectrometry
UV-‐Vis Ultraviolet-‐Visible
VFA Volatile Fatty Acid
VOC Volatile Organic Compound
WBC White Blood Cell
1
CHAPTER ONE ·∙ INTRODUCTION
An important aspect of forensic investigations is the detection and identification of
biological fluids (Virkler and Lednev 2009). The determination of the type and origin of a
biological sample can yield valuable information that may support a link between the
criminal act and donor, which in turn may assist in the reconstruction and sequencing of a
crime scene (An et al. 2012). Blood is one of the most frequently encountered and
significant types of physical evidence associated with the forensic investigation of violent
crime and death (James, Kish and Sutton 2005). Blood identification is central to many
forensic investigations including sexual assault, aggravated assault, burglary, and homicide.
The presence and evaluation of blood evidence can be crucial in establishing identity and
the manner of deposition, as well as confirming or refuting statements from the person or
persons of interest (Gefrides and Welch 2011).
A body and therefore any associated biological stains may not be located for days or weeks
after death, during which time the decedent will begin to decompose. A thorough forensic
examination of a decedent is required in part for the exclusion or documentation of
injuries that may have contributed to or caused death. However, the examination of
putrefied remains can be technically difficult to conduct and the interpretation of findings
can be complicated by the modification and loss of tissue (Byard et al. 2006). In addition to
the degenerative changes occurring throughout the process of decomposition, remains
may also be subjected to animal and insect activity, environmental factors, and elements
of the weather, all of which will further complicate post-‐mortem examinations.
Putrefactive changes may obliterate markers of identity or create artificial lesions that
2
mimic or distort the features of actual ante-‐mortem injury (Dolinak, Matshes and Lew
2005). Furthermore, suspicions of inflicted injury may arise due to the purging of fluids
both in the early and later stages of decomposition (Byard 2014). The presence of blood
would suggest that an injury has occurred before or shortly after death, whereas
decomposition fluid is generated from the naturally occurring process of decomposition.
Subsequently, ante-‐mortem injury should be recognised and differentiated from artefacts
of putrefactive decay (Dolinak, Matshes and Lew 2005). Despite the development of
advanced adjuncts to traditional autopsies, such as magnetic resonance imaging and
computerised tomography, the artefacts induced by autolysis and putrefaction may still
require interpretation. As such, it must be recognised that the process of decomposition
and its associated changes may confuse or complicate post-‐mortem evaluations (Byard
and Tsokos 2013).
Biological stains can be detected and identified by a number of physical and chemical
methods, which utilise the inherent properties of the biological evidence (Gefrides and
Welch 2011). Chemical, immunological and protein catalytic activity tests, microscopy, and
spectroscopic methods are current techniques used for forensic biological fluid
identification (An et al. 2012). Decomposition fluid is a complex chemical mixture with
associated microbial organisms, insect life, and other debris, consequently making it a
challenging matrix to study (Swann, Forbes and Lewis 2010a). However, the presence of
specific components and the unique composition of each biological fluid form the basis of
its identification (Virkler and Lednev 2009). An experimental design that investigates the
decomposition process in the presence and absence of blood evidence, or provides a
comparison between the properties of aged decomposition fluid and blood may assist in
3
determining whether these fluids can be differentiated. This, in turn, may offer
supplementary information to the post-‐mortem examination of highly decomposed
remains, and provide probative information so that investigative processes are not
misinformed and that resources and expenditure are not misallocated.
4
CHAPTER TWO ·∙ POST-‐MORTEM DECOMPOSITION
Death results from the accumulation of foreign substances or from the reduction of living
matter due to the dissolution of organic tissues (Forbes and Carter 2016). Perper (1993)
defined death as the irreversible cessation of the brain, circulatory, and respiratory
abilities. ‘Dying’ and ‘being killed’ are the two broad classifications of the cause of death
for vertebrates. Death that results from old age or illness is referred to as dying, whereas
death that results from predators, enemies, external forces, or accidents relates to the
process of being killed (Forbes and Carter 2016). This chapter discusses the process of
mammalian decomposition that ensues following the cessation of life, irrespective of the
cause of death.
2.1 Early Post-‐mortem Changes
Soon after the cessation of heart function, the body goes through the ‘mortis triad,’ which
includes algor mortis, livor mortis, and rigor mortis (Janaway, Percival and Wilson 2009).
Algor mortis is the post-‐mortem cooling of the body (Bardale 2011). The internal body
temperature will begin to approximate the ambient temperature following death, as the
body ceases to regulate its internal temperature (Goff 2009). The gravitational settling of
blood due to the cessation of the heart circulating oxygenated blood is referred to as livor
mortis (Forbes and Carter 2016). A reddish-‐purple discolouration will result in the
dependent areas of the body due to the settling of the blood. Rigor mortis causes a rigidity
or stiffening of the muscles, which results primarily due to the depletion of adenosine
triphosphate (ATP). After death, the consumption of ATP continues, however, the
production of this molecule ceases. The myosin and actin filaments in the muscles become
5
complexed in the absence ATP, which represents the onset of rigor mortis. The gradual
release of rigor will occur due to the process of decomposition (DiMaio and DiMaio 2001).
2.2 Mammalian Decomposition
Decomposition of mammalian soft tissue is a continuous post-‐mortem process in which
the soft tissues of the body disintegrate, eventually leading to partial or complete
skeletonisation (Stuart 2013; Goff 2009). The process of decomposition is often divided
into a series of stages and depending on the geographic region and the author, the
number of stages has varied between one and nine (Goff 2009). Decomposition is
commonly categorised into stages to aid investigators in estimating the post-‐mortem
interval and to assist in describing the decomposition process (Comstock 2014). Despite
differences in the number of stages, the process of decomposition is often broadly
categorised into pre-‐ and post-‐skeletonisation. The pre-‐skeletonisation classification can
be subcategorised into four additional stages including fresh, bloated, decay, and dry
(Stuart 2013). According to Goff (2009), the division of the decay stage into active and
advanced decay stages is the most common modification to the classification of death. The
rate at which decomposition occurs is highly variable between all carcasses, however the
sequence of decay remains relatively consistent (Comstock 2014). Table 2.1 illustrates the
common stages, features, and intervals of the decomposition process and provides a visual
reference for each stage.
The process of decomposition may be evident microscopically soon after the cessation of
life as the cellular chemistry begins to fail, yet may not be visible macroscopically (Forbes
and Carter 2016; Dix and Graham 2000). Decomposition involves the two parallel
6
processes of autolysis and putrefaction (DiMaio and DiMaio 2001). The first identifiable
process occurring during the fresh stage of decay is autolysis, which is the enzymatic
destruction of the soft tissues of the body (Forbes and Carter 2016; Swann, Forbes, and
Lewis 2010a). Autolysis is a chemical process that is slowed by cooler conditions,
accelerated by heat, and stopped by the inactivation of enzymes or by freezing (DiMaio
and DiMaio 2001). This process occurs first in the tissues that have a high enzyme and
water content and can be observed macroscopically by loosening of the epidermis from
the dermis, which is referred to as skin slippage and post-‐mortem blisters known as bullae
(Spencer 2013; Bardale 2011). The superficial vessels become stained by intravascular
haemolysis, which produces a visible reticulated pattern under the skin, commonly
referred to as ‘marbling’ (Spencer 2013; Dix and Graham 2000). Autolysis is thought to
occur due to decreased oxygen levels, which results in a decrease in the intracellular pH
(Bardale 2011). Cell membrane integrity is compromised by changes in the pH and
nutrient-‐rich fluids are released as a result of cellular membrane destruction. The released
nutrient-‐rich fluids serve as energy and food sources for micro-‐organisms, facilitating
putrefaction (Zhou and Byard 2011; Vass 2001).
Putrefaction is the destruction of the soft tissues caused by the action of fungi, bacteria,
and protozoa (Vass et al. 2002). The release of lipid, carbohydrate, and protein by-‐
products during autolytic degradation fuels the proliferation of these organisms (Forbes
and Carter 2016). The beginnings of putrefaction can be observed during the bloated stage
of decomposition (Swann, Forbes and Lewis 2010a). Greenish discolouration of the skin,
which results due to the formation of sulphaemoglobin in the settled blood, is often the
first visible sign of putrefaction (Vass et al. 2002). The breakdown of host cells by both
7
aerobic and anaerobic endosymbionts, as well as the subsequent production of gases
including carbon dioxide, sulphur dioxide, hydrogen, hydrogen sulphide, methane, and
ammonia cause the anatomically spacious body parts, such as the abdomen, genitals, and
face to expand. An increase in the internal pressure due to the build-‐up of volatile gases
and other products of catabolism, eventually results in the purging of fluid and gases from
the natural orifices of the body (Bemelmans 2015; Vass et al. 2002). Tracheobronchial
foam and bloody fluid may be discharged from the nostrils and mouth as air is expelled as
a result of increasing pressure in the chest, caused by the formation of gases in the
abdomen (Saukko and Knight 2016; Pinheiro 2006). Putrefactive changes are dependent
predominantly on the prior state of health of the decedent and the environmental
conditions (Perper 1993).
The active decay stage begins following the purging of gases and fluids (Vass 2001).
Chemical constituents will continue to be degraded and released and as such, putrefaction
continues throughout the active stage of decomposition (Swann, Forbes and Lewis 2010a).
At this point in the decay cycle, insect activity is prominent, there are a significant number
of anaerobic and aerobic bacteria present, and electrolytes are rapidly leaching out of the
body (Vass et al. 2002). The rupturing of the skin accelerates degradation by allowing
additional access to the corpse by arthropods, micro-‐organisms, and scavengers (Hau et al.
2014). Ultimately, the process of decomposition will result in liquefaction of the soft
tissues (Rust and Buis 2015). A cadaver decomposition island (CDI) may form due to the
release of cadaveric material (Carter, Yellowlees and Tibbett 2007).
8
The final stage of the decomposition process is the dry stage (Swann, Forbes and Lewis
2010a). The surface tissues will collapse, dry, and darken to assume a leathery texture and
residual tissues and organs will shrink and desiccate following the ‘wet’ stages of
decomposition. The body may eventually progress to skeletonisation depending on the
post-‐mortem interval and the environmental conditions in which decomposition has
occurred (Dix and Graham 2000).
The process of death is dynamic and the timeframe in which death occurs can be highly
variable (Forbes and Carter 2016). There are a variety of intrinsic and extrinsic factors that
govern the process of decomposition. Intrinsic factors include the weight and age of the
decedent, mechanical injury, drugs and toxins, and ante-‐mortem medical conditions,
whereas extrinsic factors include weather conditions such as humidity, temperature and
sun exposure, animal predation and insect accessibility, the substrate on which
decomposition took place, and protective coverings (Hau et al. 2014). Pinheiro (2006)
stated that no two decomposition processes are alike, as no two individuals are alike. As
such, it is important to note that the process of decomposition occurring under varying
conditions cannot always be accurately described by the classifications currently published
in the literature. The characterisation of stages is complicated by conditions that cause
differential decomposition or by those that alter the process and rate of decomposition
(Comstock 2014).
9
Table 2.1. Stages, features, and visual references of the common decomposition stages adapted
from Comstock (2014). Intervals adapted from Pless, Worrell and Clark (1997). Note: All stages are
highly variable and intervals are approximate.
Stage Characterist ic Features Visual Reference Intervals Fresh Macroscopic changes are
minimal Associated with the mortis triad (Algor, livor, and rigor mortis)
Zero to seven days
Bloated Accumulation of gases and inflation of the anatomically spacious body parts, such as the abdomen Marbling is visible in the limbs and ventral areas Post-‐mortem bullae Purging of fluids from the natural orifices
Initiated generally within 48 hours of death Generally lost by the seventh day but has been recorded as late as day 13
Act ive Decay Prominent insect activity Strong odours and release of cadaveric material Exposed bone becomes discoloured and leathery
Occurs between the second and eighth day after death
Advanced Decay
Minimal soft tissue remains Skin discolouration Skin exhibits rigidity and thickness decreases Fluids are no longer purging and begin to dry out Odours become less intense
Initiated at least one week after death
Dry/Skeleton Small patches of skin, bones, and teeth remain
Several weeks to months after death
10
2.2.1 Inhibitory Effects on Decomposition
Certain environmental conditions can halt the chemical processes of decomposition that
result in the dissolution of soft tissue (Forbes and Carter 2016). Outlined below are the
preservation processes of saponification and mummification.
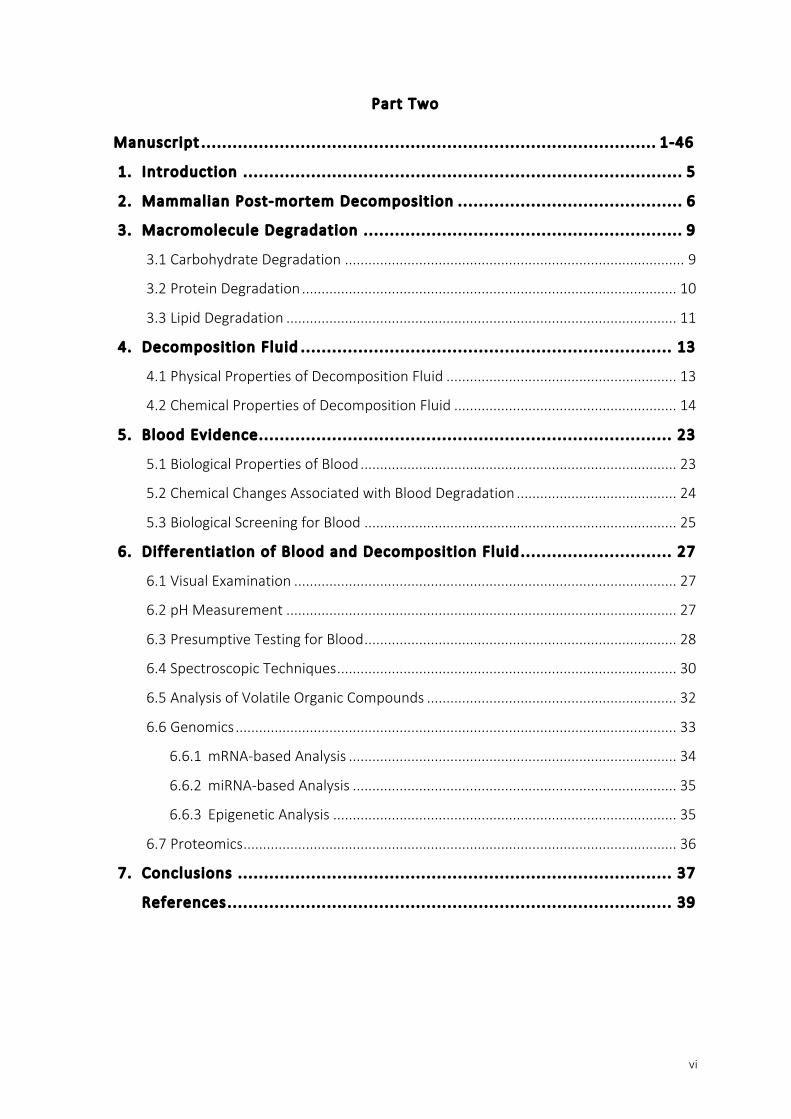
2.2.2 Saponification
Saponification is process of adipocere formation, which results from the hydrogenation
and hydrolysis of adipose tissue (Figure 2.1) (Pinheiro 2006). Adipocere is characterised as
deposits of a greasy wax-‐like substance that are yellow-‐white in colour. When adipocere
binds with sodium from interstitial fluids, a hard and crumbly composition will form. In
contrast, when adipocere binds with potassium from the breakdown of cell membranes, a
soft, paste-‐like complex will be evident (Vass 2001). The formation of adipocere is
influenced by multiple factors including temperature, air flow, moisture, the place and
media of disposal, and the presence of clothing (Bardale 2011). Adipocere formation can
be variable, as it may be present in discrete regions of the cadaver or may form over the
entire body (Forbes and Carter 2016). Once formed, adipocere can preserve remains for
extended periods of time (Dent, Forbes and Stuart 2004). It has been suggested that a
reduced pH in conjunction with the altered microbial environment is the primary reason
for tissue preservation (Forbes and Carter 2016).
11
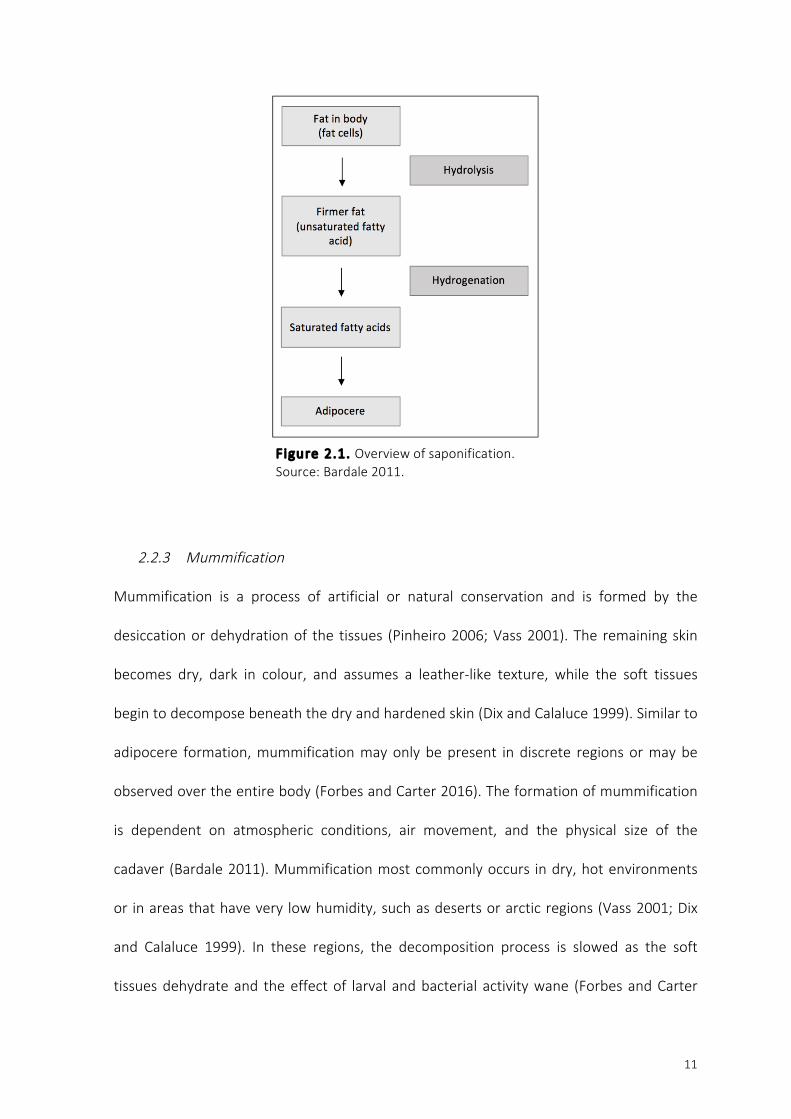
2.2.3 Mummification
Mummification is a process of artificial or natural conservation and is formed by the
desiccation or dehydration of the tissues (Pinheiro 2006; Vass 2001). The remaining skin
becomes dry, dark in colour, and assumes a leather-‐like texture, while the soft tissues
begin to decompose beneath the dry and hardened skin (Dix and Calaluce 1999). Similar to
adipocere formation, mummification may only be present in discrete regions or may be
observed over the entire body (Forbes and Carter 2016). The formation of mummification
is dependent on atmospheric conditions, air movement, and the physical size of the
cadaver (Bardale 2011). Mummification most commonly occurs in dry, hot environments
or in areas that have very low humidity, such as deserts or arctic regions (Vass 2001; Dix
and Calaluce 1999). In these regions, the decomposition process is slowed as the soft
tissues dehydrate and the effect of larval and bacterial activity wane (Forbes and Carter
F igure 2.1. Overview of saponification. Source: Bardale 2011.
12
2016). The body may remain preserved for many years once in a state of mummification
(Dix and Calaluce 1999). Figure 2.2 illustrates an overview of the mummification process.
2.3 Summary
The chemical processes of autolysis and putrefaction will typically occur in a predictable
order, yet within a variable timeframe. The impact of the surrounding environment on the
biological and chemical processes of decay, as well as the location in which death occurred
will strongly influence the post-‐mortem process of decomposition. When biological activity
is suppressed or eliminated, the degree of decay or preservation will be dictated by
environmental conditions. To better understand the complex biological and chemical
processes of decomposition, continued research across different ecozones is required
(Forbes and Carter 2016).
F igure 2.2. Overview of mummification. Source: Bardale 2011.
13
CHAPTER THREE ·∙ MACROMOLECULE DEGRADATION
The building blocks of biological specimens are the four main macromolecules: nucleic
acids, carbohydrates, proteins, and lipids. These macromolecules are broken down into
their structural components including amino acids, phosphate, fatty acids, glucose, and
sugars by complex reactions associated with the process of decomposition (Vass et al.
2002).
3.1 Carbohydrate Degradation
Polysaccharides are broken down into component sugars during early decomposition by
the action of micro-‐organisms. Fungi can decompose sugars into organic acids including
citric, glucuronic, and oxalic acids. Bacteria are responsible for the degradation of sugars
into organic acids, such as pyruvic and lactic acids under aerobic conditions. The sugars
may then be further degraded into water and carbon dioxide. Under anaerobic conditions,
bacteria can breakdown sugars into acetic, butyric, and lactic acid. Bacterial carbohydrate
fermentation may produce hydrogen, hydrogen sulphide, and methane gases, as well as
butanol and ethanol (Stuart 2013). Figure 3.1 illustrates the process of carbohydrate
degradation that occurs during decomposition.
14
3.2 Protein Degradation
The degradation of proteins into their component amino acids occurs as a result of
bacterial enzyme activity, and is referred to as proteolysis (Stuart 2013). The rate of
proteolysis varies depending on bacterial action, environmental conditions, such as
moisture and temperature (Dent, Forbes and Stuart 2004), and on the protein type (Stuart
2013). Proteins of epithelial and neuronal tissues typically degrade first, while hard tissue
proteins, such as keratin and collagen are more resistant to degradation. The process of
decomposition results in the breakdown of proteins into amino acids, peptones,
polypeptides, and proteoses (Dent, Forbes and Stuart 2004). Continuing proteolysis can
result in the production of gases including ammonia, carbon dioxide, hydrogen sulphide,
F igure 3.1. Overview of carbohydrate degradation. Adapted from: Dent, Forbes and Stuart 2004.
15
and methane, as well as phenolic compounds, such as indole and skatole (Figure 3.2). The
amino acids produced as a result of protein degradation can undergo: deamination, which
produces ammonia; decarboxylation, which results in the formation of cadaverine, indole,
putrescine, tryptamine and tyramine, and the production of carbon dioxide; and
desulphurhydralation, which can yield ammonia, hydrogen sulphide, pyruvic acid, and
thiols (Stuart 2013).
F igure 3.2. Overview of protein degradation. Source: Dent, Forbes and Stuart 2004.
16
3.3 Lipid Degradation
Adipose tissue is comprised of approximately 60 to 85% lipids. Triglycerides make up 90 to
99% of the lipid composition of adipose tissue, with cholesterol esters, diglycerides, and
phospholipids present in smaller amounts. Lineoleic, oleic, palmitic, and palmitoleic acids
are the major fatty acids present in adipose tissue (Stuart 2013). Hydrolysis of the neutral
fat of decomposing remains can yield fatty acids, which may subsequently undergo
oxidation or hydrogenation (Dent, Forbes and Stuart 2004). Following death, saturated and
unsaturated fatty acids are produced as intrinsic tissue lipases hydrolyse lipids. The
environmental conditions in which decomposition occurs will govern the nature of the
reaction. In an anaerobic environment, the mixture of saturated and unsaturated fatty
acids will undergo hydrogenation and further hydrolysis, yet in an aerobic environment,
oxidation of the unsaturated fatty acids can occur due to atmospheric oxygen, fungi, and
bacteria (Stuart 2013). Hydrogenation of linoleic, oleic, and palmitoleic acids yields oleic,
stearic, and palmitic acids, respectively (Dent, Forbes and Stuart 2004). Oxidation will
produce peroxide bonds initially, with ketones and aldehydes the final products of this
process. As the decomposition process continues, the concentration of fatty acids
increases, whereas the concentration of neutral lipids decreases (Stuart 2013). At this
stage, small amounts of hydroxy-‐fatty acids may also be formed. The process will continue,
provided there is sufficient enzymes and water available, until the original adipose tissue is
reduced to a mass of fatty acids or until no neutral fat remains (Dent, Forbes and Stuart
2004).
Fatty acids and glycerol breakdown yielding shorter-‐chain saturated fatty acids and
eventually water and carbon dioxide (Dent, Forbes and Stuart 2004). Volatile fatty acids
17
(VFAs) are short-‐chain fatty acids (C2–C5), which may be useful products of decomposition
as the concentration of particular VFAs, such as butyric, isobutyric, isovaleric, valeric, and
propionic acids may be correlated with the rate of decomposition (Stuart 2013). Figure 3.3
illustrates the process of lipid degradation that occurs during decomposition.
F igure 3.3. Overview of lipid degradation. Adapted from: Dent, Forbes and Stuart 2004.
18
3.4 Summary
The chemical processes of decomposition are complex and result in the dissolution of soft
tissues and identifiable changes to carbohydrates, proteins, and lipids. An understanding of
the changes to the biological macromolecules that occur during decomposition can
provide potentially valuable information concerning the post-‐mortem interval and the
nature of death (Stuart 2013).
19
CHAPTER FOUR ·∙ DECOMPOSITION FLUID
Cellular compounds and structures are broken down and liquefied as the processes of
autolysis and putrefaction take place (Janaway, Percival and Wilson 2009). Decomposition
fluid is the liquid produced by the degradation of the organs and soft tissues of the body
(Rust and Buis 2015). The fluid released as a result of decomposition is chemically complex
and is often associated with microbial organisms, insect life, and other debris.
Consequently, decomposition fluid is a challenging matrix to study (Swann, Forbes and
Lewis 2010a). It is important to note that much research investigating the physical and
chemical properties of decomposition fluid has been conducted using domestic pig (Sus
domesticus) carcasses due to ethical issues associated with the use of human cadavers
(Schoenly et al. 2006). Pig carcasses are considered an acceptable analogue for human
cadavers because of their similarity to human torsos in hair coverage, weight, fat to muscle
ratio, physiology, and biochemistry (France et al. 1992).
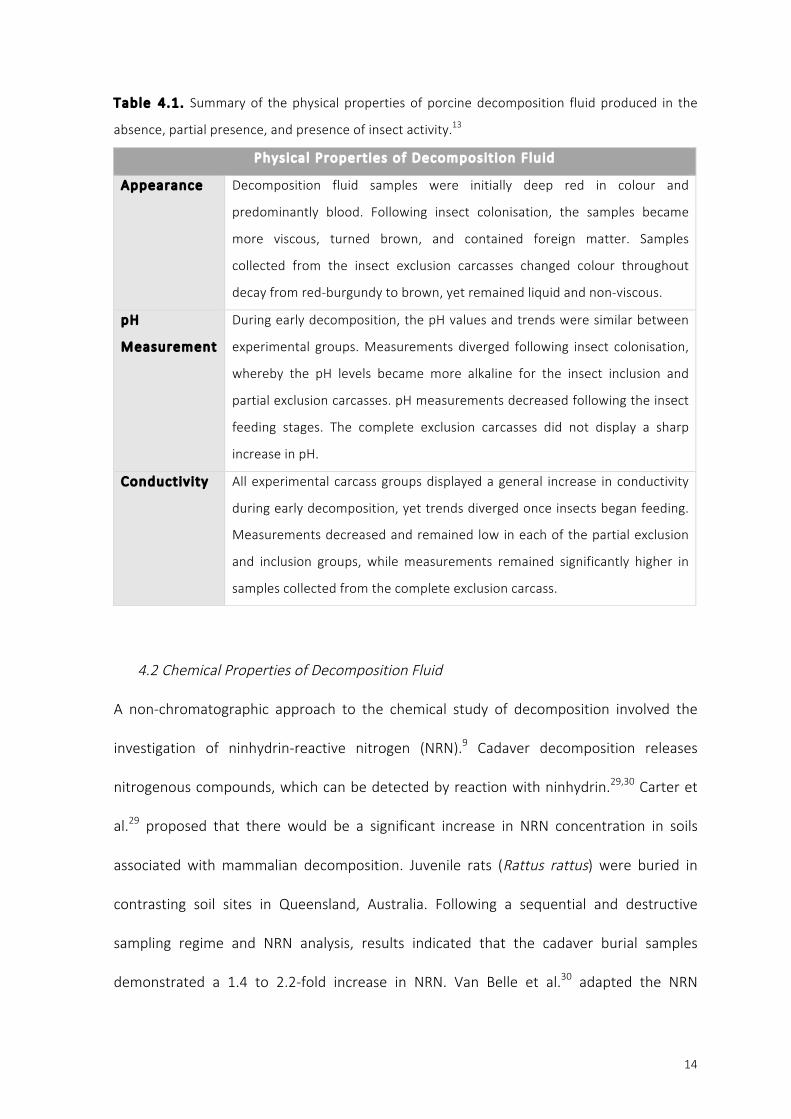
4.1 Research Investigating the Physical Properties of Decomposition Fluid
Comstock (2014) conducted outdoor research trials in Ontario, Canada in the spring-‐
summer months to investigate the physical and chemical properties of decomposition
fluid. Trial 1 served as a preliminary study, whereas Trials 2, 3, and 4 were conducted with
the purpose of carrying out the research objectives. In each replicate trial, three carcasses
were exposed to, and three were protected from insect activity. The carcasses in the insect
exclusion group were further subdivided into ‘partially excluded’ and ‘completely
excluded’ based on whether insects gained localised access to the carcasses. Prior to
laboratory analyses, observations were made on the overall consistency and colour of the
20
collected samples. For all carcass groups, the decomposition fluid was initially deep red in
colour and predominantly blood. Once insects gained access to the inclusion and partial
exclusion carcasses, the decomposition fluid samples became more viscous, turned brown,
and contained sediment and other debris. Samples collected from the complete exclusion
carcasses changed colour throughout decay from red-‐burgundy to brown, yet remained
liquid and non-‐viscous. The colour changes observed in the fluid samples collected from
the inclusion and partial exclusion carcasses may have been attributed to maggot waste
and liquefied organic material. However, micro-‐organism induced breakdown of cadaveric
material may have been responsible for the colour change exhibited in the samples
collected from the complete exclusion carcasses. It is unknown whether different
experimental parameters would alter the appearance of the samples, as there is limited
published research that explicitly examines the physical appearance of decomposition fluid
(Comstock 2014).
pH measurements of collected decomposition fluid samples indicated that prior to insect
colonisation, the pH values and trends were similar during early decomposition between
each of the carcass groups. However, significant differences were observed following
insect colonisation. During Trial 2, only partial results were obtained as maggot masses
inhibited sample collection and as such, a trend in pH could not be established. Following
the onset of the active decay stage during Trial 3, the pH from the inclusion group rapidly
became more alkaline. However, on the final collection day the pH of the fluid from all
experimental groups was approximately 7.7. Between days three and seven of Trial 4, the
pH from the inclusion group was significantly greater (p < 0.05) than each of the exclusion
groups. Comstock (2014) attributed the diverging pH trends to maggot activity. As maggots
21
feed, they release high levels of ammonia in their exudates (Turner 2005), which can raise
the pH if converted to ammonium. The lack of maggot activity and subsequent lack of
ammonium ions may have accounted for the why the completely excluded carcasses did
not display a sharp increase in pH (Comstock 2014).
In addition to visual examination and pH measurements, Comstock analysed the
conductivity in decomposition fluid samples. During the fresh and bloated stages, all
experimental carcass groups displayed a general increase in conductivity, yet trends
diverged between the groups once insects began feeding on the carcasses. Measurements
decreased and remained low for the remainder of the collection period in each of the
partial exclusion and inclusion groups, while measurements remained significantly higher
in samples collected from the complete exclusion carcass. Comstock (2014) opined that
the low levels observed in the inclusion and partial exclusion groups may have been
attributed to maggot activity, which either allowed the inherent bacteria access to the
released ions or contributed bacteria. In summary, the differences observed in the
decomposition fluid properties between each experimental carcass group were attributed
to insect colonisation and the feeding activity of the insects.
4.2 Research Investigating the Chemical Properties of Decomposition Fluid
Identifying the compounds present in decomposition fluid and determining the timing of
their production are the first steps to understanding decomposition chemistry. A non-‐
chromatographic approach to the chemical studies of decomposition involved the
investigation of ninhydrin-‐reactive nitrogen (NRN) (Swann, Forbes and Lewis 2010a). In
2008, Carter, Yellowlees and Tibbett proposed that there would be a significant increase in
22
NRN concentrations in soils associated with cadaver decomposition. Juvenile rats (Rattus
rattus) were used as model cadavers and were buried in one of three contrasting soil sites
in Queensland, Australia. Following a sequential and destructive sampling regime,
nitrogenous compounds were removed from the soil samples that were collected from
beneath the decomposing remains. Ninhydrin reagent was added to the samples and
absorbance was read at 570 nanometres using visible spectrophotometry. When
compared to the control samples, the cadaver burial samples demonstrated a 1.4 to 2.2-‐
fold increase in NRN. Despite results suggesting that the decomposition process of non-‐
human cadavers released a significant concentration of NRN, the authors noted that the
study lacked species specificity and that elevated concentrations of NRN may have been
associated with other organic resources, such as plant litter and faecal matter. In addition,
the authors identified that further research investigating the effect of burial depth,
cadaver mass, time, clothing, and the diffusion of NRN in soils was needed.
Van Belle, Carter and Forbes (2009) examined surface and burial decomposition scenarios
of porcine remains using the NRN methodology proposed by Carter, Yellowlees and
Tibbett (2008). In addition, the study also investigated the lateral diffusion of NRN. It was
hypothesised that there would be a positive correlation between decomposition
progression and grave soil NRN concentrations and an inverse relationship between
sampling distance and the concentration of NRN. The study followed a sequential
destructive collection regime, whereby two carcasses were exhumed after a period of
three, six, or 12 months’ burial. Soil samples were collected once a month for six months
from the edge and centre of the gravesites and from the walls and base of the graves at
the time of exhumation. To investigate surface decomposition scenarios, five swine
23
carcasses were placed on the soil surface. Soil samples were collected from different
regions beneath the carcasses and from the control site over a period of 97 days. Results
indicated that during the initial two months of burial, soil collected from the centre of the
graves contained significantly greater (p < 0.05) concentrations of NRN and that this period
corresponded with the liquefactive stages of decomposition. The surface trial results
indicated that the highest concentrations of NRN were detected during the early to later
post-‐mortem period. In addition, it was determined that the lateral influx of NRN was
minimal. The authors identified that the vertical and lateral extent of decomposition fluids
was dependent on the soil texture and size of the cadaver.
Further research by Carter et al. (2009) investigated the use of the NRN technique in the
reconstruction of a disturbed outdoor death scene. Soil samples were collected from
seven sampling sites, including a control site. The determination of NRN concentrations
followed the methodology outlined by Carter, Yellowlees and Tibbett (2008). Results
indicated that the presumptive primary decomposition area had significantly greater
concentrations (p < 0.001) of NRN when compared to the other sampling sites, thus
providing a strong indicator as to the area where most of the body had decomposed.
However, NRN may be released from other sources including plant material and as such,
an elevated level of NRN in soils is not necessarily indicative of human decomposition
(Carter et al. 2009).
The above research has demonstrated that various nitrogen-‐containing compounds are
released into the surrounding environment during the process of decomposition. The
results highlighted the potential for NRN to be used for the detection of clandestine burial
24
sites and for determining the original site of decomposition for surface deposited remains
subject to animal predation or post-‐mortem relocation (Van Belle, Carter and Forbes
2009). However, to provide the level of chemical knowledge needed to understand the
fundamentals of decomposition chemistry, more selective analytical techniques are
required. Separation science techniques are currently being researched with the aim of
providing quantitative data that will supplement and expand the knowledge base
concerning decomposition chemistry (Swann, Forbes and Lewis 2010a).
Individual decomposition products may be separated by analytical techniques including
gas chromatography (GC), capillary electrophoresis (CE), and liquid chromatography (LC)
(Stuart 2013). Early studies researching the chemistry of decomposition focused on small
organic molecules, such as volatile fatty acids (C2 – C5) (Swann, Forbes and Lewis 2010a),
which are short-‐chained carboxylic acids produced by microbial-‐induced reductive and
oxidative reactions of lipids. Volatile fatty acids (VFAs) can remain biologically active and
detectable in crime scene soil samples for considerable lengths of time (Tuller 1991).
An early application to the investigation of VFAs was by Tuller (1991), who used a field
portable gas chromatograph (microFast GC2) and mass spectrometer (MS) to identify VFAs
in soil samples collected from cemetery graves in Duz, Kosovo and a mass grave in Knin,
Croatia. Only one of the seven soil samples collected from the Duz village cemetery
contained detectable levels of VFAs, which included isobutyric and valeric acid. From the
Knin mass grave, isovaleric acid was present in Sample 2, while isobutyric and isovaleric
acids were detected in Sample 3. Tuller identified that similar to the Duz sample, co-‐
elution with the solvent prevented the detection of the targeted fatty acids (butyric,
25
propionic, and valeric acid). However, several other fatty acids including capric, lauric,
myristic, oleic, palmitic, and stearic acids were identified in Samples 1, 2, and 3 from the
Knin mass grave. These fatty acids were not detected in the soil controls and as such, it
was likely that these fatty acids were associated with decomposing remains. Tuller
proposed that prior to discovery, the VFAs produced during decomposition leached from
the remains, thus accounting for the lack of detectable VFAs in the samples collected from
the Duz cemetery. Moreover, VFA detection may have been affected by the time between
burial, exhumation and sampling, differences in the rate of decomposition, the soil
structure and content, exposure to the environmental elements, or the process of air
drying the samples (Tuller 1991).
Research conducted by Vass et al. (1992) analysed five microbially produced VFAs
(isobutyric, n-‐butyric, isovaleric, n-‐valeric, and propionic acid), as well as various anions
and cations (ammonium, calcium, chloride, magnesium, potassium, and sulphate) using
GC. Gas chromatography has typically been used to analyse VFAs (Swann, Forbes and
Lewis 2010a), as this technique enables the separation of mixtures and quantification of
individual components (Stuart 2013). Volatile fatty acids were acidified with formic acid
and analysed using packed column GC with flame ionisation detection (FID). Soil samples
were collected from randomly selected areas beneath seven unclothed, unautopsied, and
unembalmed cadavers. The sampling area was defined between the shoulders and pelvis
and each area was sampled only once. The initial results of the study indicated that ante-‐
mortem body weight was an important variable, as ratios of fat and muscle tissue and in
turn, the concentration of VFAs is unique to each individual. In addition, the moisture
content of the soil was also considered an important variable in the determination of VFA
26
concentrations. Once an individual’s weight and the moisture content of the soil were
taken into account, the VFA concentrations were the same for any given total of
accumulated degree days (ADD), regardless of the season in which the cadaver began to
decompose or the physical features of the cadaver. Only seven of the 16 ions investigated
(C1-‐, Ca2, K+, Mg2+, Na+, NH4, and SO42) were reproducible between subjects and stable in
the environment. As with VFA concentrations, the anion/cation concentrations were the
same for any given total ADD, irrespective of the subject or season. The authors
recognised that there was a correlation between VFA production and specific stages of
decomposition, which was in part attributed to the sequential decomposition of proteins
and carbohydrates.
In 2013, von der Lühe et al. investigated the suitability of cholesterol and coprostanol as
biomarkers of decomposition fluid within a soil matrix. According to the authors,
cholesterol and coprostanol are potentially valuable compounds for the detection of
decomposition fluid in soils because of their origin and chemical structure, which provides
stability against degradation over time. A total of four domestic pig carcasses were buried
in shallow graves; two of which were exhumed after three months and the remaining two
exhumed after six months. Cholesterol and coprostanol were extracted from soil samples
that had been collected from seven different sampling positions and solid phase extraction
(SPE) was used to purify the samples before analysis using gas chromatography-‐mass
spectrometry (GC-‐MS). The control in the study was the phytosterol β-‐sitosterol, as it was
assumed to remain stable between the treated and control soils. Results indicated that the
three-‐month-‐old graves had higher concentrations of cholesterol and coprostanol relative
to the control. It was proposed that the cholesterol was derived from the soft tissue of the
27
pig carcasses and that the release of decomposition fluid contributed to the
concentrations of coprostanol in the soil samples collected from beneath the pig carcasses.
There was no significant difference in sterol concentrations between the control and
treatment soils after six months’ burial. The most likely explanations for this observation
according to von der Lühe et al. included aerobic degradation, sorption, transformation,
and transport away from the depositional source. However, further research investigating
the potential influence of soil properties on these sterols is required.
A preliminary study conducted by Swann et al. (2010) aimed to advance the knowledge
and understanding of the chemical components of decomposition fluid in the absence of a
soil matrix. The preparation phase involved simple aqueous dilution and filtration of
decomposition fluid samples collected from pork rashers (belly pork), stillborn piglets, and
adult pig carcasses followed by GC-‐MS analysis. To provide a comparison between
compounds detected in decomposition fluid samples, the study was conducted using a
similar experimental design in two distinct locations, Ontario, Canada and Perth, Western
Australia. Method development identified that an increase in final column temperature
improved detection and resolution. Subsequently, several previously unreported
compounds that were eluting at the later stages of analysis were identified. The first trial
of the study examined pork rashers (belly pork) in eight collection cups, of which four were
covered by muslin wrap and the remaining four exposed. The rashers were placed in the
ambient environment during early autumn. For the duration of the study, no
decomposition fluid was produced from the covered samples. However, decomposition
fluid samples were collected between days three and 24 of the trial from the exposed
rashers. Compounds produced during the pork rasher trial, as indicated by chromatogram
28
(Figure 4.1), included the following acids: 2-‐piperidone, acetic, butyric, isovaleric, linoleic,
myristic, palmitic, palmitoleic, phenylacetic, phenylpropanoic, propionic, oleic, stearic, and
trimethylacetic acid (internal standard).
To represent a more realistic model of decomposition, further trials were conducted with
four stillborn piglets and two adult pig carcasses. As with the pork rasher trial, the piglets
were both protected and exposed, yet the trial was conducted in winter. The first
decomposition fluid samples were collected from the exposed piglets on day 14. According
to the authors, the delay in fluid production may have been attributed to the daily
temperature variations. For the piglets exposed to insect activity, sampling continued until
day 47. Decomposition fluid was only produced from the protected piglets between days
F igure 4.1. Chromatogram showing compounds produced on day 24 of the pork rasher trial. Numeric order of compounds: 1: acetic acid, 2: propionic acid, 3: trimethylacetic acid (internal standard), 4: butyric acid, 5: isovaleric acid, 6: 2-‐piperidone, 7: phenylacetic acid, 8: phenylpropanoic acid, 9: myristic acid, 10: palmitic acid, 11: palmitoleic acid, 12: stearic acid, 13: oleic acid, and 14: linoleic acid. Source: Swann et al. 2010.
29
42 and 54. Variability in fluid production between the piglets highlighted the complex
nature of the decomposition process and the need for a larger sample set. Compounds
produced from Piglet 3 on day 26, as indicated by chromatogram (Figure 4.2), included the
following acids: acetic, propanoic, isobutyric, trimethylacetic (internal standard), butyric,
isovaleric, valeric, isocaproic, and 2-‐piperidone.
Two whole pig carcasses were studied in Ontario, Canada during summer (July, 2007).
Fluid collection commenced on day five of the trial and concluded on day 14 when maggot
and insect activity had ceased and only skeletal remains and mummified skin were evident.
Similar compounds ranging from short chain acids to long chain acids and cyclic
compounds were detected in the pork rasher and adult pig trials. Previously undetected
indole and phenol compounds were also identified (Figure 4.3). Long chain fatty acids in
F igure 4.2. Chromatogram showing compounds produced on day 26 from Piglet 3. Numeric order of compounds: 1: acetic acid, 2: propanoic acid, 3: isobutyric acid, 4: trimethylacetic acid (internal control), 5: butyric acid, 6: isovaleric acid, 7: valeric acid, 8: isocaproic acid, and 9: 2-‐piperidone. Source: Swann et al. 2010.
30
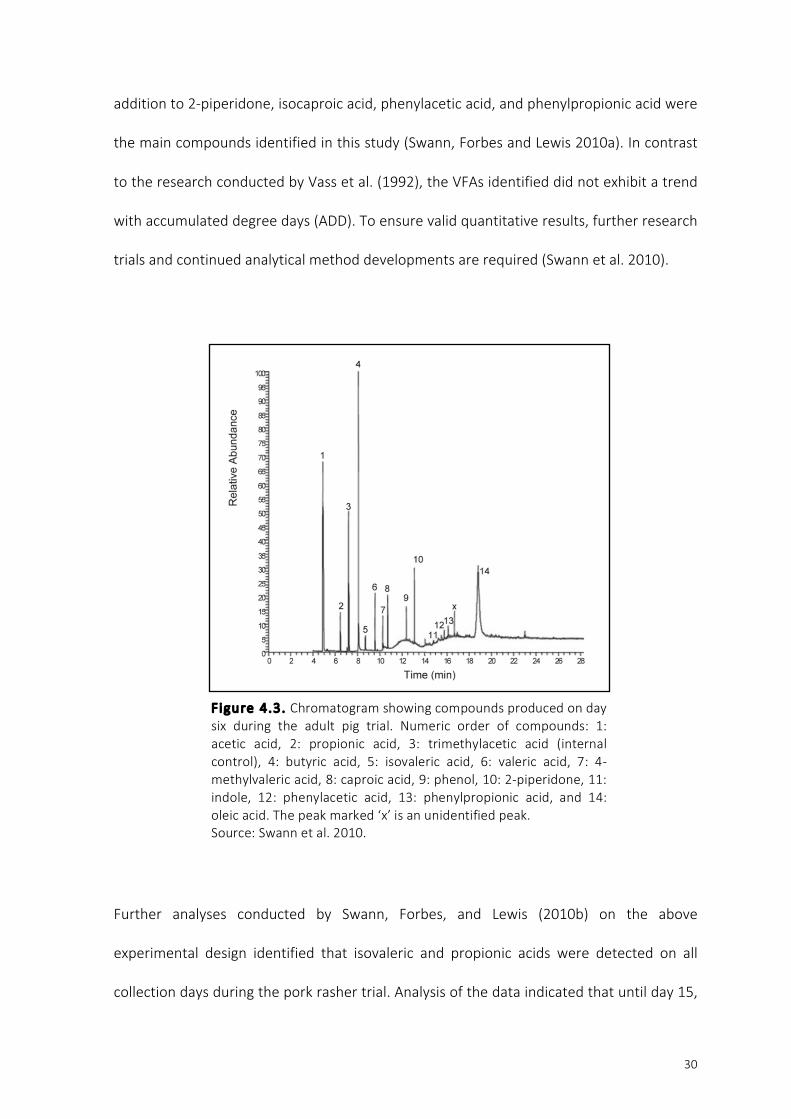
addition to 2-‐piperidone, isocaproic acid, phenylacetic acid, and phenylpropionic acid were
the main compounds identified in this study (Swann, Forbes and Lewis 2010a). In contrast
to the research conducted by Vass et al. (1992), the VFAs identified did not exhibit a trend
with accumulated degree days (ADD). To ensure valid quantitative results, further research
trials and continued analytical method developments are required (Swann et al. 2010).
Further analyses conducted by Swann, Forbes, and Lewis (2010b) on the above
experimental design identified that isovaleric and propionic acids were detected on all
collection days during the pork rasher trial. Analysis of the data indicated that until day 15,
F igure 4.3. Chromatogram showing compounds produced on day six during the adult pig trial. Numeric order of compounds: 1: acetic acid, 2: propionic acid, 3: trimethylacetic acid (internal control), 4: butyric acid, 5: isovaleric acid, 6: valeric acid, 7: 4-‐methylvaleric acid, 8: caproic acid, 9: phenol, 10: 2-‐piperidone, 11: indole, 12: phenylacetic acid, 13: phenylpropionic acid, and 14: oleic acid. The peak marked ‘x’ is an unidentified peak. Source: Swann et al. 2010.
31
acetic, isobutyric, and propionic acids demonstrated an increasing trend, however, a
decreasing trend followed until the trial was complete. Similarly, isovaleric and butyric
acids followed an increasing trend, reaching a maximum at day 15, yet appeared to have a
cyclic nature. The acids tended toward a second minimum value on day 16 and then
increased again until the end of the trial on day 24. It was proposed that a common source
produced the short chain acids, thus accounting for the initial increasing trend. However,
the cyclic trends of isovaleric and butyric acid may be indicative of a new source of
production during decomposition. During this trial, six long chain fatty acids including 9-‐
hexadeconoic, linoleic, myristic, oleic, palmitic, and stearic acids were also identified.
These long chain fatty acids appeared to follow an eight-‐day cycle and as with the target
short chain acids, reached a maximum on day 15. The authors tentatively related these
observations to the adipose content of the pork rashers, the feeding cycle of the maggots,
and the level of fly activity.
Analysis of the piglet trial data conveyed that there were no clear trends in the compounds
found in decomposition fluid for Piglets 2 and 3. There was an increasing trend in acetic
acid over an eight to 10-‐day period exhibited by Piglet 1; however, there was a decrease in
the level of acetic acid produced during the trial. It was documented that the validity of the
trends observed in the fluid samples collected from Piglet 4 was difficult to justify because
of inconsistencies in sample collection. Results from the pig trial indicated that the target
short chain acids, with the exception of isobutyric acid, passed through a maximum on day
six. A second minimum was noted on day 10, which was followed by an increase until the
end of the trial on day 14, thus suggesting the acids appeared to follow a cyclic trend.
However, the theory was not confirmed as fluid was not collected on day 16, which would
32
have allowed for the completion of a second cycle. The long chain fatty acids (linoleic,
oleic, palmitic, and stearic) detected in this trial demonstrated an increasing trend, with
each acid reaching a maximum on day 14. This study identified considerable variation in
the abundance and type of compounds present in decomposition fluid, thereby
highlighting chemical complexity of this sample.
In 2014, Comstock conducted three replicate trials analysing decomposition fluid samples
produced from six domestic pig carcasses. In each replicate trial three carcasses were
exposed to, and three carcasses were protected from insect activity. The insect exclusion
group was further subdivided into ‘partially excluded’ and ‘completely excluded’ based on
whether insects gained access. Samples were analysed using GC-‐MS following a fatty acid
methyl ester (FAME) extraction method. Fluid collection during Trial 2 was inhibited during
the active and advanced stages of decomposition for the inclusion carcasses.
Consequently, overall trends could not be accurately deduced, as samples were not
collected on all days. Results from the partial exclusion carcasses indicated that the
amount of linoleic acid decreased, while the amount of cis-‐oleic, myristic, palmitoleic, and
stearic acids exhibited an overall increase, thus suggesting that hydrogenation may have
occurred. During the later stages of decomposition, the differences in fatty acid
concentrations between the carcass groups indicated that the short chain fatty acids may
have been degraded or consumed faster than the longer chain fatty acids. During Trial 3,
differences were observed during the insect activity stages between the inclusion and
exclusion carcasses in the amount of linoleic, myristic, palmitic, and palmitoleic acids.
During the late stages of decay, differences in the amount of linoleic, myristic, and palmitic
acids were observed between the carcass groups. In Trial 4, the amount of myristic and
33
stearic acids from the inclusion group decreased overall, yet exhibited an increase in
samples collected from the partial and complete exclusion carcasses. The amount of
palmitic acid increased at various stages of decomposition for all carcasses groups, while
the amount of linoleic acid decreased. Differences in the amount of myristic, stearic, and
trans-‐oleic acids differed between the exclusion groups during the localised tissue removal
stage.
The dominant fatty acids present in porcine and human soft tissue including linoleic,
myristic, oleic, palmitic, palmitoleic, and stearic acids were detected in all decomposition
fluid samples. However, the fatty acids detected in each trial did not display consistent
trends and inconsistencies were observed in the amount of fatty acids detected
throughout the stages of decomposition. During the active decay stages, there were
significant differences in the concentration of fatty acids between all carcass groups. When
compared to the exclusion groups, the amount of linoleic, myristic, and palmitoleic acids
was greater in the samples collected from the inclusion group, yet there was a decrease in
the amount of palmitic acid. The results from Comstock’s study suggested that insects may
consume fatty acids or accelerate the rate of degradation, thereby decreasing or
increasing the amount of fatty acids detected in decomposition fluid samples.
Compounds that are not suitable for GC analysis because of thermal instability can be
analysed using capillary electrophoresis (CE) (Stuart 2013). This technique offers the
potential for rapid and highly efficient separations of complex chemical mixtures (Stuart
2013; Swann, Forbes and Lewis 2010c). Swann, Forbes and Lewis (2010c) used a simple
capillary zone electrophoresis method for the determination of amino acids and biogenic
34
amines in decomposition fluid collected from porcine remains. The authors expected that
amino acids and biogenic amines would be present in decomposition fluid, due to the
biodegradation pathways of carbohydrates, proteins and lipids. To optimise separation, a
multivariate chemometric approach was used to improve total analysis time and
resolution. Subsequent to a screening design, a central composite design using total
analysis time and peak resolution as response factors was employed. Phenylalanine,
tryptamine, tryptophan, tyramine, and tyrosine were all identified by spiking and migration
time. However, further research is required to elucidate the identity of a number of
unidentified peaks observed in the electropherogram (Figure 4.4).
As with CE, high performance liquid chromatography (HPLC) can be used to study
thermally unstable or potentially non-‐volatile decomposition products (Stuart 2013).
Swann, Busetti and Lewis (2012) utilised liquid chromatography-‐electrospray ionisation-‐
Figure 4.4. Electropherogram at optimised running conditions identifying in numeric order: 1: tryptamine, 2: tyramine, 3: neutral, 4: tryptophan, 5: tyrosine, and 6: phenylalanine. Peaks marked with an asterisk are unidentified components. Source: Swann, Forbes and Lewis (2010c).
35
tandem mass spectrometry (LC-‐ESI-‐MS/MS) operated in multiple reaction monitoring
mode to analyse porcine decomposition fluid. This selective and sensitive analytical
method assisted in the semi-‐quantitative determination of 19 amino acids and biogenic
amines. Infusion experiments enabled refinement of the MS tuning parameters and an
optimised LC method was applied to decomposition fluid samples. It was concluded that
direct injection of 1:10 diluted samples or small volumes (0.1 to 1 μl) of undiluted samples
provided the best sample introduction onto the LC-‐MS/MS. This approach reduced
preparation time, conserved samples for future analyses, and lead to minimal matrix
effect. The selected analytical approach enabled the identification of compounds that had
previously lacked detection using alternative techniques and allowed potential trends to
be identified. Results indicated that over the course of the field trial, tyramine, indole, and
putrescine displayed a general increasing trend and that both tryptophan and L-‐
phenylalanine compounds were present in all fluid samples. Despite not indicating
potential trends individually, together the compounds displayed a cyclic trend. The sum of
amino acid concentrations appeared to follow a 14-‐day cyclic trend, in which the amino
acids passed through maximums on days 13 and 33. As these results have been tentatively
established, further investigation exploring different experimental parameters, such as soil
matrices and a larger sample set is required (Swann, Busetti and Lewis 2012).
4.3 Summary
Analytical separation techniques have enabled the study of mammalian soft tissue
decomposition and various by-‐products, including decomposition fluid (Swann, Forbes and
Lewis, 2010a). The above studies have primarily focused on providing various
methodologies and techniques for estimating post-‐mortem intervals. However,
36
determining what compounds are present in decomposition fluid will assist in providing a
greater understanding of decomposition chemistry and in turn, provide important
information needed for the differentiation of this sample and blood evidence.
37
CHAPTER FIVE ·∙ BLOOD EVIDENCE
Blood is one of the most frequently encountered and significant types of physical evidence
associated with the forensic investigation of violent crime and death. The nature and
circumstances of violent crimes often produce a variety of bloodstains that, when carefully
evaluated and studied with respect to their distribution and geometry, can provide
important information, which may assist with determining the sequence of events. The
accurate interpretation of blood evidence has proved critical in a number of cases where
the manner of death must be resolved. An understanding of the properties of blood is
necessary for the interpretation and study of bloodstain evidence (James and Eckert 1998).
This chapter will introduce the biological properties of blood, explain the degradation of
blood outside of the human body, and discuss possible biological screening processes.
5.1 Biological Properties of Blood
Blood is a liquid form of connective tissue, comprised of 55% intercellular material
(plasma) and 45% formed cellular elements. The plasma portion of blood consists mostly
of water, as well as inorganic salts, proteins, and other substances, whereas the cellular
component consists of erythrocytes, leucocytes, and platelets (Figure 5.1). The primary
functions of blood as it circulates through the body include defence against foreign
material and infection, transport of carbon dioxide, oxygen, waste products, nutrients and
hormones, and heat distribution (James, Kish and Sutton 2005).
38
5.1.1 Blood Components
Erythrocytes, also called red blood cells (RBC), comprise approximately 98.5% of the total
cellular portion of liquid blood (Reynolds 2008). The small size (approximately 7.5 μm in
diameter) and geometric shape of RBCs makes them efficient in their transportation role.
Normal RBCs take the shape of a biconcave disc, which simultaneously increases the
surface-‐to-‐volume ratio to maximise carbon dioxide and oxygen transport and allows the
cell to be small enough to pass through the capillaries (James, Kish and Sutton 2005). A
plasma membrane provides a mature RBC with resilience and flexibility (Reynolds 2008).
Mature human RBCs do not have a nucleus and as such, lack nuclear DNA. An important
source of DNA for forensic analyses is the nucleated leukocyte or white blood cell (WBC).
Leukocytes are the second population of component cellular material and can be divided
into granulocytes, which include basophils, eosinophils and neutrophils, or agranulocytes,
F igure 5.1. Composition of blood. Liquid blood is comprised of 55% intercellular material (plasma) and 45% formed cellular elements (erythrocytes, leucocytes, and platelets). Source: Li 2015.
39
which consist of monocytes and lymphocytes. The primary function of leukocytes is to
digest pathogens and fight infection, aiding in the regulation of the immune system. The
smallest cellular constituents of blood are platelets, which are approximately 2 to 4 μm in
diameter (Saladin 2007). Platelets assist in haemostasis through thrombus formation and
coagulation (Reynolds 2008). The remaining 55% of blood is comprised of plasma, which is
a transparent, pale yellow fluid. The constituents of plasma include 90% water, 7% plasma
proteins, mainly albumin, globulin and fibrinogen, 2% nutrients and 1% inorganic salts.
Plasma is responsible for transporting electrolytes, hormones and nutrients, (James, Kish
and Sutton 2005), as well as maintaining fluid balance and regulating pH and body
temperature (Brown and Davenport 2012).
5.2 Chemical Changes Associated with Blood Degradation
Many forensic presumptive tests for blood rely on the peroxidase-‐like properties of
haemoglobin (Vincini 2010). This oxygen carrying protein is the main component of RBCs.
Haemoglobin consists of four haem subunits, each of which having one iron atom that can
bind an oxygen molecule. There are differences in the conversion kinetics between various
haemoglobin derivatives when comparing in vivo and in vitro environments. Haemoglobin
molecules are mainly present in two forms inside a healthy human body: saturated with
oxygen, oxy-‐haemoglobin (HbO2) or without oxygen, de-‐oxyhaemoglobin (Hb) (Bremmer et
al. 2012). HbO2 can be oxidised into met-‐haemoglobin (met-‐Hb), which is incapable of
binding oxygen. HbO2 contains the ferrous (Fe2+) form of iron, whereas met-‐Hb contains
the ferric (Fe3+) form of iron (Doty, McLaughlin and Lednev 2016). When met-‐Hb is formed
inside the body, the NADH-‐dependent enzyme cytochrome-‐b5 reductase can reduce met-‐
Hb back to Hb. Conversely, the transition of HbO2 into met-‐Hb will no longer be reversed
40
when outside of the body due to the absence of cytochrome-‐b5 (Smith, Marks and
Lieberman 2005). Over time, met-‐Hb will denature to hemichrome (HC) (Marrone and
Ballantyne 2009). Figure 5.2 provides a schematic representation of the oxidative
processes in haemoglobin.
5.3 Biological Screening for Blood
The development of multiple screening techniques has enabled forensic investigators to
determine the type of biological material that may be present within a potential crime
scene or on items that pertain to a criminal investigation. Bloodstains at a crime scene may
be aged, degraded, or diluted and subsequently no longer characteristic of blood. Blood
identification involves a series of steps including visual examination, presumptive and
confirmatory testing, species determination, and individualisation testing. Visual
examination and presumptive testing better enables the identification and collection of
stains that may offer probative value to forensic investigations (Sutton 1999).
F igure 5.2. Oxidative processes in haemoglobin. A) Oxidative processes occurring in vivo. B) Oxidative processes occurring in vitro. Adapted from: Bremmer et al. 2011.
41
5.3.1 Presumptive Testing
Presumptive tests are a vital and viable component of scene analysis and evidence
collection, particularly when the physical properties and context do not clearly indicate
blood (Bevel and Gardner 2008). Upon visual identification, presumptive tests may be used
to provide an indication as to what the stain may be (An et al. 2012). A positive
presumptive reaction implies that the sample should be collected for further analyses, as
the material tested is most likely blood (Bevel and Gardner 2008). In most presumptive
assays, a colourless substrate will be oxidised in the presence of haem, typically by
hydrogen peroxide (H2O2), causing a colour change, fluorescence, or chemiluminescence.
The most common presumptive agents include benzidine derivatives, phenolphthalein, or
leucomalachite green (Li 2015). These tests are classified as catalytic tests and are based
on the peroxidase-‐like activity of haemoglobin and its derivatives (Sutton 1999).
Benzidine was a commonly used presumptive assay, which indicated the possible presence
of blood by a blue to dark blue colour change. However, benzidine and other test reagents
including o-‐toluidine are seldom used in forensic laboratories today, as they are recognised
carcinogens. The 3,3’,5,5’-‐tetramethyl derivative of benzidine was studied as a potential
replacement and continues to be utilised as a presumptive assay. Tetramethylbenzidine is
the active dye in Hemastix®. Many laboratories have adopted the Hemastix® test for field
use, which has a reagent treated filter paper tab at one end of a plastic strip that turns
from yellow to green or blue-‐green in the possible presence of blood. Phenolphthalein is a
simple acid-‐base indicator that is used in many forensic laboratories and is commonly
referred to as the Kastle-‐Meyer test. The reaction shows a bright pink colour change as the
colourless phenolphthalin is oxidised to phenolphthalein (Greenfield, Sloan and Spaulding
42
2014). As with phenolphthalein, leucomalachite green involves a haem-‐catalysed reaction
and is performed under acidic conditions. In the presence of possible blood, a green colour
change will result (Li 2015).
Presumptive tests may also be performed utilising organic compounds whose oxidation
products have fluorescent or chemiluminescent properties. A fluorescence assay exposes
an oxidised product to an alternative light source (ALS). The fluorescence is then emitted
at a wavelength that is longer than the wavelength of the ALS (Li 2015). Fluorescin is an
example of a fluorescence assay, in which fluorescin is oxidised to fluorescein by hydrogen
peroxide. The oxidation process is accelerated by the catalytic activity of haem (Greenfield,
Sloan and Spaulding 2014). A yellow-‐green fluorescent light may be emitted when a
fluorescin-‐sprayed stain is exposed to a light range of 425 to 485 nanometres, thus
indicating the possible presence of blood. In contrast, light is emitted as a product of a
chemical reaction in a chemiluminescence assay. A common chemiluminescent reagent is
Luminol, which will emit a blue-‐white light in the presence of possible blood. Luminol is
highly sensitive, yet the chemiluminescence is short lasting and the testing must be viewed
in a darkened room (Li 2015).
The above assays can cross-‐react with other materials and as such, are only considered
presumptive for blood and not confirmatory (Bevel and Gardner 2008). Certain household
cleaners and bleaches that contain hypochlorite ions, products that contain hydrogen
peroxide, certain metal salts, and some plant peroxidases can catalyse the oxidation
reaction, even in the absence of haem, thus producing a false-‐positive result. If a strong
43
reductant such as zinc or lithium is present in a sample, it may inhibit the oxidation
reaction and produce a false-‐negative result (Li 2015).
5.3.2 Confirmatory Testing
Several techniques can be utilised to confirm the presence of blood including crystal,
microscopic, and immunological tests, as well as spectroscopic and chromatographic
methods (Virkler and Lednev 2009). Crystal assays result in the formation of distinctive
crystals of haem derivatives by chemically treating a possible bloodstain. Two common
crystal assays include the Takayama and Teichmann tests. A microscope can then be used
to visualise the resultant crystal morphologies (Li 2015).
5.3.3 Species Determination
The aforementioned presumptive assays and microscopic examinations lack species
specificity. Species determination of a stain presumptively identified as blood is necessary
for determining whether the stain is of human origin. Serological techniques, including
primary and secondary binding assays, form the basis of most species identification assays
(Li 2015). Hexagon OBTI® and ABAcard® HemaTrace® are commercially available kits that
screen for the presence of human haemoglobin by making use of the binding between an
antigen and its homologous antibody (Bevel and Gardner 2008). The ABAcard®
HemaTrace® test strip works by combining a mobile monoclonal anti-‐human haemoglobin
antibody with human haemoglobin that may be present in a stain. The formation of an
antibody-‐antigen complex will then migrate to the test area ‘T’ through an absorbent
membrane (An et al. 2012). This complex will then bind to an immobile polyclonal
antihuman haemoglobin antibody. The control area ‘C’ contains the immobile anti-‐
44
immunoglobulin (Ig)-‐antibody (Johnston, Newman and Frappier 2003). An antibody-‐
antigen-‐antibody sandwich is formed when the immobilised antibody captures the mobile
antibody-‐antigen complex. A pink precipitin line can be visualised when the human
haemoglobin concentration exceeds the minimum detection level of 0.05 μg/mL. Human
haemoglobin antibody-‐dye conjugates cannot bind to the antibody in the test area, thus
providing an internal control (Reynolds 2004). Two bands will appear in the test and
control areas of the assay if the test is positive for human haemoglobin (Johnston,
Newman and Frappier 2003) (Figure 5.3), whereas a negative result is indicated by the
visualisation of only one band in the control area (Reynolds 2004). The RSID™ test is
another blood detection assay, which detects the glycophorin-‐A protein present in the
membrane of red blood cells (Harbison and Fleming 2016). In summary,
immunochromatographic assays are sensitive, specific, rapid, and practicable for field and
laboratory testing (Li 2015).
45
F igure 5.3 . Sequence of steps involved in the ABAcard® HemaTrace®
immunochromatographic assay
1. Combining of a mobile monoclonal anti-‐human haemoglobin antibody with
human haemoglobin
2. Migration of the mobile antibody-‐antigen complex
3. Formation of antibody-‐antigen-‐antibody sandwich
4. Positive result indicated by a pink precipitin line in the test and control
areas of the assay
Source: Johnston, Newman and Frappier 2003.
46
CHAPTER SIX ·∙ DIFFERENTIATION OF BLOOD AND DECOMPOSITION FLUID
Determining the origin and type of biological crime scene samples can provide valuable
information that may assist with supporting a link between sample donors and the criminal
act and reconstructing the sequence of events surrounding the commission of a crime. For
example, a bloodstain may indicate assault, physical struggle, or murder (An et al. 2012),
whereas a decomposition fluid stain is essentially an artefact of the decomposition
process.
6.1 Visual Examination
Sutton (1999) detailed that visual examination was the first step in bloodstain
identification. Alterations in the haemoglobin as the bloodstain ages results in a visible
colour change from red to reddish-‐brown to green and finally dark brown. The duration
and sequence of the colour changes are affected by extrinsic factors including
environmental conditions and the presence of micro-‐organisms and bacteria (James and
Eckert 1998). Comstock (2014) identified that decomposition fluid also progresses through
a series of colour changes from red-‐burgundy to brown. The similar colour changes
exhibited by both fluids over time do not permit visual identification as a method of
biological fluid determination and differentiation.
6.2 pH Measurement
Ante-‐mortem blood pH is highly regulated to remain between 7.35 and 7.45 (Donaldson
and Lamont 2013). The pH of blood drops following death due to the accumulation of CO2
from glycolysis and glycogenolysis, and the accumulation of phosphoric and lactic acid
47
from the breakdown of fatty acids and amino acids. With the onset of putrefaction, muscle
proteins degrade, which results in the accumulation of ammonia and in turn causes the
blood pH to become more alkaline (Karmakar 2010). Similarly, alkaline pH measurements
of decomposition fluid samples were reported by Comstock (2014). Results indicated that
prior to insect colonisation the pH values and trends were similar during early
decomposition. However, significant differences in pH measurements were observed
following insect colonisation, whereby pH levels became more alkaline for insect inclusion
and partial insect exclusion samples. The carcasses that were completely excluded from
insect activity did not display a sharp increase in pH. Despite this research focusing on the
liquid form of these samples, the results still highlight the variability of pH measurements
due to the influence of extrinsic factors. In addition, Karmakar (2010) noted that post-‐
mortem blood pH does not follow a definite sequence. Consequently, pH analyses would
lack the specificity required to definitively differentiate blood and decomposition fluid
stains.
6.3 Presumptive Testing for Blood
In 2006, Cranstoun researched in part the effect of decomposition on presumptive
biological fluid identification. Undyed fabric strips were separated into three 5 cm sections.
Each section was doped with four drops of either blood, saliva, or semen and left to dry
overnight. The strips were attached to the flanks of a t-‐shirt with 14 samples on top of and
beneath three medium-‐sized pig carcasses, totalling 28 samples per carcass. The carcasses
were placed in an open coastal sand dune area to decompose. Seven control strips were
created using the same protocol and attached to a sheet of fabric, which was then
connected to the weather station pole. This placement was chosen as it provided a
48
reasonable distance between the decomposing pig carcasses and the control strips.
Samples were collected at varying intervals over an eight-‐week period. Post collection, the
blood section of each strip was removed and tested using the Combur3 Test®E and Kastle-‐
Meyer presumptive tests for blood. Over the 56-‐day collection period, four negative
results were obtained using the Combur® test strips in the area of the original bloodstain
and three samples tested negative using the Kastle-‐Meyer reagent. The control samples
returned a positive result for 25 days using the Combur® test strips. In contrast, positive
results could be obtained for 42 days using the Kastle-‐Meyer reagent, suggesting that this
presumptive test was more sensitive and in turn would be a preferable technique for
compromised samples.
Cranstoun identified that breakdown products of blood would be present in
decomposition fluid and consequently all areas of the blood section would test positive if
they had been in contact with the fluids released during decomposition. To provide a
result for comparison, an area outside of the original bloodstain referred to as ‘Other’ was
tested using the presumptive reagents. The samples tested from the upper side of the pig
carcasses produced a stronger reaction with the original bloodstain area using the
Combur® test strips, yet equally strong reactions were recorded from samples collected
from the lower side of the pig carcasses. Most samples produced an equally strong
reaction between the ‘Other’ test areas and the original bloodstain when using the Kastle-‐
Meyer reagent, thus confirming the presence of blood products in decomposition fluid.
An additional 28 strips were prepared for pattern analysis using Luminol. Seven strips
doped with 0.5 mL of blood were placed on top of and beneath two large-‐sized pig
49
carcasses, totalling 14 samples per pig. A cross pattern was assigned to Pig 4, whereas Pig
5 was allocated a triangular pattern. In comparison to Pig 4, visual identification of the
patterns on Pig 5 was possible for a longer period of time. These results were reflected
when examining the samples using Luminol, as no patterns were identified from Pig 4, yet
Luminol testing was able to detect the triangular patterns attached to Pig 5 for six days
after initial contact with the carcass. Subsequent to the six-‐day period, results had an
indiscriminate chemiluminescence appearance, suggesting a reaction was occurring with
the decomposition fluid (Cranstoun 2006).
In 2015, Bemelmans also assessed in part how the process of decomposition may affect
presumptive screening for biological fluids. A porcine model was used to simulate human
decomposition to ensure the biological fluid samples were correctly being identified as
originating from the deposited stains, as opposed to the decomposing remains. Thirty
microlitres of human blood was deposited on to 88 squares that had been sectioned from
two cotton t-‐shirts. The blood samples were placed directly on top of or beneath a pig
carcass or a bag of sand, which was comparable in weight and served as the control. One
bloodstain was collected daily from each segment from both the cadaver and the control,
yielding a total of four blood samples per day. Subsequent to visual examination at the
laboratory, presumptive testing using the Kastle-‐Meyer reagent and ABAcard®
HemaTrace® confirmatory testing were performed on any areas of red-‐brown staining.
Positive presumptive and confirmatory results were obtained for all samples collected
from the top of the pig carcass and control through day 21. Similarly, positive presumptive
results were returned for all samples collected from beneath the pig carcass and the
control. Positive confirmatory results were obtained from beneath the pig carcass through
50
day 10, however results were negative thereafter. Bemelmans attributed the dilution and
degradation of the biological fluid samples to the compounding effects of rainfall, varying
temperatures, soil type and condition, and the products of decomposition. Positive
confirmatory results were returned on days 1 to 11, 13 and 16 from samples beneath the
control. Negative results were obtained for control samples collected on the remaining
days.
Despite exposure to decomposition products and adverse environmental surroundings, all
samples returned positive presumptive results, thus suggesting biological testing may still
be possible despite exposure to harsh environmental conditions. However, it is unknown if
blood products present in the decomposition fluid produced from the porcine remains
contributed to the positive results. Negative results were obtained from ABAcard®
HemaTrace® confirmatory testing after day 10. This data identified the potential
detrimental effects of the surrounding environment on the recoverability of biological
evidence. It is unknown what adverse effect blood products present in the decomposition
fluid would have on confirmatory testing, as any haemoglobin present in the
decomposition fluid produced by the decaying porcine remains would not have reacted
with the human specific test. Had this research been conducted using human cadavers, it
is possible more positive confirmatory results would have been returned. The sensitivity of
ABAcard® HemaTrace® confirmatory testing may detect blood breakdown products
present in human decomposition fluid samples and as such, may not be a viable option in
the differentiation of blood and decomposition fluid stains. The research conducted by
Cranstoun (2006) and Bemelmans (2015) highlights that conventional presumptive and
confirmatory testing currently employed in the field of forensic science may not be
51
sufficient in conclusively determining if blood evidence is present. Differentiation of blood
and decomposition fluid may require more selective analytical techniques that allow
comparison of the constituents within these fluids.
In recent years, several approaches have been researched to overcome the limitations of
current methods and to develop more reliable and sensitive techniques for identifying
human biological fluids and thereby stains (Legg et al. 2014). Emerging approaches that
may be utilised for the differentiation of blood and decomposition fluid stains include
spectroscopic techniques, the analysis of volatile organic compounds, messenger-‐ and
micro-‐RNA expression profiles, epigenomic modifications of DNA markers, and protein
biomarker detection.
6.4 Spectroscopic Techniques
Spectroscopic techniques are being researched in the field of forensic science for the
detection and identification of human biological fluids. These techniques can enable
identification based on the characteristic spectral signatures and are reported to be easy
to use, solvents free, fast, and cost-‐effective. When irradiated by ultraviolet light, most
biological fluids undergo absorption processes or fluorescence, which allows for the rapid
and widespread detection of biological fluids. Ultraviolet-‐visible (UV-‐Vis) spectroscopy has
been applied to the detection of sweat, saliva, semen, urine, and blood stains (Zapata,
Gregorio and García-‐Ruiz 2015). Within the forensic field, UV-‐Vis lamps are currently
known as forensic light sources or alternate light sources (ALS) (Zapata, Fernández de la
Ossa and García-‐Ruiz 2015). However, UV-‐Vis spectroscopy presents several limitations
including substrate interference, a lack of body fluid specificity, and false positives. As
52
such, this technique is more applicable for presumptive identification and exploratory
purposes (Zapata, Gregorio and García-‐Ruiz 2015).
Promising results have been obtained from research investigating the application of
infrared and Raman spectroscopy to the identification of biological fluids (Zapata, Gregorio
and García-‐Ruiz 2015). Spectroscopic techniques utilise the characteristic spectral
signatures of haemoglobin and its derivatives for blood identification (Li 2015). The
infrared wavelengths and the chemical vibrations in molecules are correlated, which
establishes the characteristic bands observed in Raman or infrared spectra. Both mid-‐
wavelength and near infrared ranges are being explored and different instrumentation
including attenuated total reflectance, diffuse reflectance, hyperspectral imaging, and
transmittance are being investigated. Instrumentation that combines infrared
spectroscopy and photography, such as hyperspectral imaging, may assist in the detection
of biological stains, as this technique provides both spectral and spatial information
(Zapata, Gregorio and García-‐Ruiz 2015).
Mathematical methods of multivariate analysis, chemometrics, and advanced statistics
allow researchers to extract useful information and interpret complex spectral data, thus
allowing for more accurate and comprehensive results (Muro et al. 2014). Using statistical
procedures, the Raman spectral signatures of saliva, sweat, semen, vaginal fluid, and blood
have been established (Zapata, Fernández de la Ossa and García-‐Ruiz 2015). Zapata,
Gregorio and García-‐Ruiz (2015) concluded that both infrared and Raman spectroscopy are
rapid, selective, and non-‐destructive techniques and as such, these methods overcome the
limitations associated with UV-‐Vis and provide a suitable method for biological fluid
53
discrimination. However, to establish the spectral signature, and in turn, identify and
characterise each biological fluid, further analyses and research is required (Zapata,
Fernández de la Ossa and García-‐Ruiz 2015).
Spectroscopic techniques have also been employed for the study of decomposition
products. Infrared spectroscopy can be used to identify carbohydrates, proteins, and lipids,
as well as the compounds that result from macromolecule degradation. In addition,
spectroscopy may be used to identify the compounds present within a sample and to
observe how these compounds change with time (Stuart 2013). Comstock (2014) analysed
porcine decomposition fluid samples using attenuated total-‐reflectance-‐infrared
spectroscopy (ATR-‐IR) and GC-‐MS. The aim of Comstock’s research was to examine fatty
acid degradation trends and to identify potential biomarkers for the estimation of post-‐
mortem intervals. The trends observed from the spectroscopic data between the
decomposition trials yielded inconsistent results. The effect of insect activity on the levels
of unsaturated fatty acid C=C and saturated fatty acid C=O stretching bands is unclear and
as such, it is possible that insect activity may have contributed to the inconsistent results
(Comstock 2014).
There are a number of limitations associated with the use of spectroscopic techniques, for
example, biological fluids do not appear as isolated substances and the substrate on which
the stain is formed or absorbed can contribute to the vibrational spectra (Zapata, Gregorio
and García-‐Ruiz 2015). The spectroscopic signal of biological fluids may also be completely
masked by contaminants. This issue is further complicated by the varied composition of
possible contaminants (Sikirzhytskaya et al. 2013). Moreover, decomposition fluid is a
54
chemically complex matrix that is thus far not completely understood. Additional
comprehensive research focusing on the validation and optimisation of spectroscopic
techniques for the identification of biological fluids is needed. Furthermore, research
investigating substrate effect, body fluid mixtures, and test samples that more closely
resemble evidence from forensic cases is required (Zapata, Gregorio and García-‐Ruiz
2015). Thus far, various spectroscopic methods may provide useful trend information,
however to gain a more thorough understanding of decomposition chemistry and in turn
to differentiate between blood and decomposition fluid stains, more selective analytical
techniques may be required (Swann, Forbes and Lewis 2010a).
6.5 Analysis of Volatile Organic Compounds
Over the last several years, there has been an increase in the study of biological volatile
organic compounds (VOCs), their correlation to human odour, and their practical
application to the fields of health science, forensic science, and policing. To understand
what attracts carrion insects to decomposing remains and what elicits a response in
cadaver dogs, research has focused on identifying the chemical compounds produced by
decomposition (Stadler 2013). During the process of decay, different biological and
chemical processes contribute to the evolution VOCs, which are odour chemicals (Perrault,
Stuart and Forbes 2014). Volatile organic compounds are a focus of decomposition
chemistry, as they arise from the catabolism of the main biological macromolecules.
Carbohydrates produce a range of oxygenated compounds including esters, ethers,
alcohols, aldehydes, and ketones, whereas proteins give rise to phosphorous and nitrogen
compounds, and lipids yield oxygenated compounds, hydrocarbons, phosphorus and
nitrogen (Stuart 2013). Research by Rust and Buis (2015) proposed that the scent profiles
55
of decomposition fluid and decomposed remains should be similar, as decomposition fluid
is a liquefied version of the body. To date, results from chemical examination and
comparison have indicated that the scent profiles produced from human remains and
decomposition fluid are similar, with decomposition fluid training aids having
approximately 70% of the compounds produced by decomposed remains (Rust and Buis
2015).
Several studies have been conducted to elucidate the VOC profile of decomposed remains.
Research by Vass et al. established a Decomposition Odour Analysis (DOA) Database in
2004, which identifies and details chemicals that are released during the process of
decomposition from buried human remains. Vass et al. (2004) identified eight separate
classes of chemicals containing a total of 424 specific volatile compounds using thermal
desorption gas chromatography mass spectrometry (TD-‐GC-‐MS). The eight classes
included: acids/esters, cyclic and non-‐cyclic hydrocarbons, halogen, nitrogen, oxygen and
sulphur containing compounds, and other/miscellaneous compounds that were thought to
be related to the burial process but may have been products of decomposing vegetation
(Vass et al. 2004). Continued research by Vass et al. in 2008 aimed to define the chemical
fingerprint produced by volatile compounds associated with burial decomposition. Results
identified eight major classes of chemicals, which now contained 478 compounds
identified as semi-‐volatile or volatile components of the burial decomposition process.
A total of 104 VOCs were identified by TD-‐GC-‐MS in a study conducted Dekeirsschieter et
al. (2009), which aimed to examine the VOC profile produced from the surface
decomposition of pig carcasses in three different biotopes. The decomposition process
56
was categorised into five stages including fresh, bloated, active decay, advanced decay,
and dry remains. In addition to identifying various VOCs, it was noted that there was a
transition in the compounds produced as decomposition progressed. The fresh
decomposition stage exhibited no cadaveric VOCs, however, alcohols, sulphur compounds
including sulphur dioxide, dimethyldisulphide and dimethyltrisulphide, and the nitrogen
containing compound, trimethylamine, were detected during the bloated stage. The active
stage of decomposition produced the strongest olfactive signature and was characterised
by cyclic compounds including 4-‐methylphenol, indole, and phenol. In addition,
dimethyldisulphide and dimethyltrisulphide, and organic acids including 2-‐ and 3-‐
methylbutanoic acid and butanoic acid were also present. The final stage of decomposition
exhibited an increase in aldehydes.
Inconsistencies in the VOC profile are evident across the published literature, which
reflects variation in the sample collection and preparation, the analytical technique and
instrumentation, the decomposition variables including the physical size of the cadaver,
geographical location, soil type, and weather conditions, as well as the dynamicity of the
VOC profile (Forbes and Perrault 2014; Perrault, Stuart and Forbes 2014; Vass 2012).
Consequently, a consistent VOC profile of decomposition is still being investigated.
However, research concerning the VOC profile of decomposition has provided a guideline
for determining what compounds will be produced and their concentration ranges (Vass
2012).
A newly specialised unit of blood-‐detection canines has been introduced by law
enforcement agencies in Italy, the United Kingdom, and Australia. The canines are trained
57
specifically to detect and locate blood evidence based on the VOC profile produced from
fresh and aged blood training aids (Rust, Nizio and Forbes 2016). However, research
conducted by Forbes et al. (2014) identified that distinctive VOC profiles were produced
from fresh and aged blood samples and that as time passed, the VOC profile became more
complex. As with decomposition odour profiling, there are inconsistencies in the type and
number of compounds reported in the literature and as such, a consistent blood odour
profile is lacking (Rust, Nizio and Forbes 2016). Inconsistencies in blood odour profiling
may be attributed physiological differences between blood donors, which is influenced by
an individual’s medication history, lifestyle, and diet, as well as sampling method, or
analytical technique (Rust, Nizio and Forbes 2016; Rust and Buis 2015). Irrespective of the
observed variations in the scent profiles, Rust and Buis (2015) concluded that detection
dogs are still capable of detecting blood samples.
The training of blood and cadaver detection dogs using VOC profiling may assist in the
location of remains and identification of blood evidence. Decomposed remains and blood
have distinct scent profiles that do not closely resemble each other (Rust and Buis 2015)
and as such, VOC profiling may be employed to differentiate between decomposition fluid
and blood. However, this technique may not be applicable for stain identification and
differentiation in the presence of human remains, as VOC profiling is predominantly
utilised for detection dog training and the location of clandestine burial sites. In addition,
an odour profile will consist of several chemical signatures that change with time (Vass et
al. 2004) and the exact profile of either fluid is yet to be determined (Rust, Nizio and
Forbes 2016; Forbes and Perrault, 2014).
58
6.6 Genomics
Advancements in forensic genetics have led to the development of new techniques that
involve the detection of messenger RNA (mRNA), micro-‐RNA (miRNA), and differential DNA
methylation patterns. The identification and differentiation of biological fluids can be
achieved due to tissue-‐specific RNA expression (An et al. 2012). The most frequently
proposed RNA markers for blood are generally divided into proteins associated with
haemoglobin and the haem biosynthesis pathway, or proteins associated with the
erythrocyte membrane (Harbison and Fleming 2016). Research investigating RNA
techniques has indicated that RNA is still useful for biological stain identification despite
being considered less stable than DNA due to rapid destruction from digesting enzymes
and its single stranded structure (Butler 2012; Juusola and Ballantyne 2003).
Biological fluids of forensic interest typically contain multiple cell types, each of which
expresses a distinctive pattern of mRNA transcripts. The development and implementation
of mRNA profiling is based on harnessing these multicellular transcriptomes. The
identification of mRNA transcripts is related to the stability and abundance of each
transcript in the cell (Harbison and Fleming 2016). Multiple RNA transcripts have been
detected using real time polymerase chain reaction (PCR) (Haas et al. 2009; Nussbaumer,
Gharehbaghi-‐Schnell and Korschineck 2006) or reverse-‐transcriptase-‐PCR (Haas et al.
2009; Juusola and Ballantyne 2007). Figure 6.1 illustrates the approaches taken for RNA
profiling. Some RNA techniques have simultaneously identified semen, vaginal secretions,
menstrual blood, venous blood, and saliva (Haas et al. 2009). Within the last five years, the
European DNA Profiling Group organised a collaborative exercise to evaluate the
reproducibility and robustness of mRNA profiling for the identification of blood. The results
59
indicated that 15 of the 16 participating laboratories were able to detect and isolate blood
specific mRNA from dried bloodstains, thus highlighting the potential for mRNA profiling in
forensic casework (Haas et al. 2011).
The advantages of using mRNA based identification methods include the possibility of
detecting multiple biological fluids in one multiplex reaction, simultaneous extraction of
DNA and mRNA from the same stain (Figure 6.2), a greater specificity, and the potential for
automation, all of which can preserve the sample and save time (Li 2015; An et al. 2012).
Despite several mRNA markers having been proposed as specific, sensitive, and stable
methods for forensic biological fluid determination (An et al. 2012), it is still possible that
mRNA stability will be influenced by UV radiation, humidity, moisture, and heat (Zubakov
et al. 2010; Zubakov et al. 2009). Other limitations associated with mRNA analysis include
Figure 6.1. Approaches taken for RNA profiling. Source: Lee n.d.
60
difficulties in profile interpretation, the destructiveness of the technique, and that there
are no validated guidelines in place for mRNA profiling interpretation (Orphanou 2015).
An alternative option to mRNA for the identification of forensically relevant samples is
miRNAs, which are a class of small non-‐protein coding RNA molecules (Harbison and
Fleming 2016). The size and stability of miRNA highlight their potential applicability to the
identification of degraded evidential samples. The use of miRNA may also be considered
advantageous, as analysis can be performed using the same methodology employed in
traditional RNA and DNA analysis, thereby reducing additional consumables and
equipment (Orphanou 2015). However, a key limitation to the use of miRNA analysis is
their specificity for both species and biological fluids, as any given target may have multiple
miRNAs and a single miRNA may have multiple mRNA targets (Harbison and Fleming 2016).
F igure 6.2. Co-‐extraction of RNA and DNA from a crime scene stain enables body fluid identification and STR profiling. Source: Butler 2012.
61
According to Orphanou (2015), there has been a lack of reproducible and consistent
results, which reflects the need for further research.
Epigenetic differences have been identified between biological fluids of forensic interest
and as such, DNA methylation, which is an epigenetic modification, has been explored for
biological fluid identification (Harbison and Fleming 2016). DNA methylation is the addition
of methyl (CH3) to the 5’-‐position of the pyrimidine ring of cytosine in CpG dinucleotides
(Orphanou 2015; An et al. 2012). Bisulphite sequencing or the use of a methylation-‐
sensitive/dependent restriction enzyme followed by PCR are the predominant methods for
detecting methylation (Harbison and Fleming 2016). Research conducted by Frumkin et al.
(2011) identified the benefits of DNA methylation as a method of forensic biological fluid
identification. The research demonstrated that DNA methylation can be multiplexed with
existing DNA protocols, thereby reducing the need for specialist training or additional
equipment and reagents, and that the assay requires small amounts of input DNA. An et al.
(2012) also identified that for the characterisation of biological fluids, DNA methylation
based methods could be a valuable technique, yet for forensic casework application
further validation studies with more markers would be required. In concordance,
Orphanou (2015) detailed that to ensure the validity of the techniques, further research is
required and that until all key body fluids have tissue specific methylated DNA loci and
differential methylation patterns that do not overlap, DNA methylation is not an
appropriate tool for routinely identifying biological fluids.
A complexity of forensic analyses is that many tissues and body fluids are mixtures of
different cell types. The presence of other cell types has the potential to dilute marker
62
responses and in turn reduce signal strength. With DNA methylation markers, the
presence of other cell types will level out the hyper-‐ or hypo-‐ methylation status in a cell
type, thus reducing the discriminatory value of the methylation status. In addition,
biological stain characterisation poses interpretational challenges when employing the
above assays (Sijen 2015). At present, the application of these techniques may not be
possible for the differentiation of blood and decomposition fluid stains, however, these
particular assays should be considered when developing new approaches.
6.7 Proteomics
Among the promising approaches to biological stain identification is the use of protein
biomarkers (Legg et al. 2014). Each biological fluid has a unique protein signature, which is
attributed to the different proteins within the sample, or to the different combinations and
relative abundance of proteins (Prinz et al. 2011). Protein analysis of biological samples
involves the separation, identification, and characterisation of proteins (Kennedy 2001).
Post-‐translational modification in different tissues allows for the diversity of potential
targets. This, in conjunction with the stability of many proteins, highlights the advantage of
protein biomarkers for the identification of biological stains (Legg et al. 2014).
Yang et al. (2013) and Van Steendam et al. (2013) aimed to identify protein biomarkers for
biological fluid identification using mass spectrometry (MS) based technology. Research
conducted by Yang et al. (2013) attempted to define multiple markers for saliva, semen,
and blood using liquid chromatography matrix-‐assisted laser desorption/ionisation (MALDI)
mass spectrometry. At a greater than, or equal to 95% confidence interval, results
identified 59 unique proteins in blood. Relative to each body fluid, the alpha (α) and beta
63
(β) subunits of haemoglobin were considered the most abundant and distinct markers for
blood. Van Steendam et al. (2013) analysed cotton-‐tipped swabs of nasal secretions, saliva,
urine, faeces, semen, vaginal secretions, menstrual blood, and venous blood using
electrospray ionisation time of flight (ESI Q-‐TOF) mass spectroscopy. A decision tree based
on the most prominent and specific proteins present in biological matrices was
constructed to validate the use of MS for the determination of the samples. In
concordance with research conducted by Yang et al. (2013), Van Steendam et al. (2013)
identified the same specific proteins within blood. It is important to note however, that the
procedure utilised by Van Steendam et al. was time-‐consuming and that not all
laboratories may be equipped with the required technology and as such, this approach
may not yet be appropriate for routine analyses.
Research conducted by Legg et al. (2014) aimed to identify and isolate candidate high-‐
specificity protein biomarkers for the reliable identification of trace quantities of urine,
seminal fluid, vaginal fluid, menstrual fluid, peripheral blood, and saliva. Samples were
obtained from five unrelated females and five unrelated males. All samples were extracted
and analysed using a three-‐phase 2D high performance liquid chromatography (HPLC)-‐
based biomarker discovery initiative. A list of 29 candidate protein biomarkers was
proposed for the target fluids being investigated based on the three-‐pronged comparative
proteomic strategy. The proposition that these proteins would have utility as reliable
biomarkers of their target body fluids was supported by: the combination of consistent
identification by multiple strategies within the current research, information on tissue
functionality and expression from the proteomic literature, and confirmation in
independently compiled proteomic databases. The authors detailed that although larger-‐
64
scale validation studies are still required and that comprehensive forensic validation was
beyond the scope of the research, the potential utility of the candidate biomarkers
identified was still encouraging. The identification of reliable protein biomarkers commonly
encountered in evidentiary stains has the potential to assist in the development of a
unified multiplexed approach to forensic biological fluid identification (Legg et al. 2014).
6.8 Summary
Several approaches have been investigated in recent years with the primary aim of
developing more reliable and sensitive strategies for the identification of biological fluids,
which in turn will assist in overcoming the limitations associated with current identification
techniques (Legg et al. 2014). These approaches include spectroscopic techniques, volatile
organic compound analysis, genomics, and proteomics. These techniques have the
potential to expand the field of biological fluid identification and with time and
development, to assist in the differentiation of blood and decomposition fluid stains.
65
CHAPTER SEVEN ·∙ STUDY OBJECTIVES
This dissertation detailed the physical and chemical properties of decomposition fluid and
blood. However, research pertaining to the explicit differentiation of these fluids is
currently lacking. Several techniques and methodologies have been evaluated for their
potential use and effectiveness in the differentiation of blood and decomposition fluid
stains. Table 7.1 outlines the potential techniques discussed and the associated limitations.
The following research proposal is a proof-‐of-‐concept study outline, which aims to assess if
the technique of microfluidic proteomics by protein electrophoresis can identify a
potential biosignature that will enable the differentiation of blood and decomposition
fluid. The results obtained from the proposed study design may assist in enhancing the
knowledge base surrounding the differentiation of these fluids. The objectives for this
research design are four-‐fold. The first objective is to document the stages of
decomposition for all carcasses. The second objective is to examine the physical properties
of decomposition fluid produced by non-‐injured and injured carcasses. The third objective
is to analyse the fluids produced during decomposition using the presumptive Kastle-‐
Meyer reagent. The final objective is to analyse the protein profiles of the fluids to
determine if there are differences between blood and decomposition fluid stains and to
compare these results with the results obtained from the Kastle-‐Meyer testing.
One can draw conclusions from the literature on potential techniques that may enable the
identification of a stain next to a decomposing body as blood or decomposition fluid,
however much remains to be investigated. For example, Comstock (2014) hypothesised
that decomposition fluid would consist of released plasma, intra-‐ and extracellular, and
66
interstitial fluids. This information, in conjunction with the fact that blood is comprised of
55% plasma, suggests that it is plausible that differences in the protein profiles may be
observed between blood and decomposition fluid stains. Research by Ebah (2012)
supports the hypothesis that the protein profiles of decomposition fluid and blood will
vary. Ebah (2012) in part, analysed the proteomic and metabolomic profiles of samples
collected from uremic subjects. For proteomic analysis, paired plasma and interstitial fluid
samples were obtained from two patients with renal dysfunction. The samples were
analysed using GC-‐MS and liquid chromatography with tandem mass spectrometry (LC-‐
MS/MS) after electrospray ionisation (ESI) for small metabolites. LC-‐MS/MS was also used
to digest and analyse protein samples. In all samples, 357 protein peaks were identified
with molecular weights between 5 and 527 kDA. Results identified 44 proteins in all
interstitial fluid samples, yet these proteins were not present in the plasma samples. Based
on peak spectral counts, several other proteins were found to be more abundant in
interstitial fluid samples than the plasma samples. Irrespective of the subjects, the results
from this study are promising for the research aims, given that decomposition fluid is a
liquefied version of the body (Rust and Buis 2015) and that the largest constituent of blood
is plasma (Reynolds 2008).
Chapter 6 identified possible methods that may be used for the differentiation of blood
and decomposition fluid stains. However, the associated limitations of these techniques
suggest that they are not currently viable options for the application of differentiation. As
such, the proposed study design will utilise the techniques of proteomics through protein
electrophoresis by microfluidics. Microfluidic devices can perform biochemical reactions
and analyses and when compared to conventional techniques, offer many advantages such
67
as improved efficiency, which is attributed to the high surface area to volume ratio of the
system, and automation. Also, sample and reagent consumption is decreased due to the
required nanolitre reaction volume range (Li 2015). Some methods that may allow for the
differentiation of blood and decomposition fluid are binary, however, protein analysis of
the samples does not require that the identity of target molecule(s) are known in advance.
This is advantageous as a certain combination of molecules and the relative abundance of
those target molecules may provide the biosignature required for the differentiation of the
samples. If differences between the protein biosignatures of blood and decomposition
fluid can be demonstrated, then the identity of these proteins could then be investigated.
68
Table 7.1 Potential methods for the differentiation of blood and decomposition fluid and the
associated limitations.
Potentia l Methods for the
Differentiat ion of Blood and
Decomposit ion Fluid Stains
Associated L imitat ions
Visual Examination A similar colour change exhibited by both fluids does not
permit visual identification as a reliable method of
differentiation.
pH Measurement Insect colonisation has a variable effect on the pH
measurements of decomposition fluid samples. In addition,
post-‐mortem blood pH does not follow a definite sequence.
Consequently, pH analyses would lack the specificity
required to definitively differentiate these fluids.
Presumptive Tests for Blood Decomposition fluid does not exist in isolation and is likely
to contain blood products, thus compromising the
interpretation of results.
Spectroscopic Techniques
There is a need for comprehensive research focusing on the
validation and optimisation of spectroscopic techniques for
the identification of biological fluids. Further research
investigating spectral interference from the substrate and
contaminants, body fluid mixtures, and test samples that
more closely resemble forensic samples is required.
Volat i le Organic Compounds
The exact odour profile of each fluid is yet to be elucidated
and volatile organic compound profiling is predominantly
utilised for detection dog training and the location of
clandestine burial sites. As such, this method may not be
applicable for stain identification when remains are
present.
Genomics The presence of other cell types has the potential to dilute
marker responses, thereby reducing signal strength, and to
reduce the discriminatory value of the methylation status.
Proteomics Further validation studies are required and the technique
may not currently be appropriate for routine analysis.
69
7.1 Proposed Experimental Design, Sampling, and Analysis
A minimum of four medium-‐sized pig carcasses will be utilised for the research objectives.
Vass (2001) identified that fluids and gases will be released from the natural orifices of the
body during decomposition. To provide a focal point for sample collection and to observe
the diffusion of the released fluids, each pig carcass will be suspended within a small
animal cage (Figure 7.1). At the bottom of the cage will be a plain white tile that has been
washed with neutral soap to avoid possible cross-‐reactions with the Kastle-‐Meyer reagent.
The tile will be placed within a removable tray for ease of sampling and documentation. An
alternative methodology is to lay the pig carcasses on top of a galvanised mesh platform
within the small animal cages (Figure 7.2). The galvanised mesh platform will allow the
decomposition fluids to drain away from the carcasses and will limit possible false-‐positive
Kastle-‐Meyer reactions by reducing the potential for rust.
When examining the stages and rates of decomposition, the cumulative effects of
temperature and insect activity must be a significant consideration. At various stages of
decomposition, insects and flies will be attracted to the decaying remains depending on
the volatile compounds produced and the associated odours that are emitted (Comstock,
2014). Comstock (2014) identified that the physical and chemical composition of
decomposition fluid is affected by insect activity. To reduce the number of variables,
access by insects will be limited by encasing the carcasses in protective netting. To avoid
an increase in humidity and temperature, the protecting netting will permit airflow. Access
to the carcasses by crawling insects may also be minimised by applying petroleum jelly
around the base of the cages.
70
Once the pig carcasses are in position, post-‐mortem stab wounds will be inflicted to
generate blood flow for half of the experimental carcasses. Observations will be
documented and photographically recorded on each experimental day. Observations are
to note the physical appearance of the carcass and any fluids produced. In addition, all
fluid sampling days will be documented and recorded. Kastle-‐Meyer testing will be
performed on the fluids produced by all carcasses, as per the reagent protocol. At the
laboratory, all swabs will be analysed using protein electrophoresis by microfluidics.
71
F igure 7.1. Experimental design sketch in which the decomposing carcasses are suspended.
F igure 7.2. Experimental design sketch in which the decomposing carcasses are placed on top of a galvanised mesh platform.
72
7.2 Decomposition Research Facility
The field trial area will be located at the Murdoch Veterinary Farm, 90 South St, Murdoch,
Western Australia, Australia, 6150. Within the field trial area are two caged structures
(Figure 7.3). The study will be performed in the east caged structure, as it will protect the
carcasses from larger predators and scavengers. In addition, this structure has a covered
section that will protect the pig carcasses from direct sunlight, which may dry the
carcasses and the fluids, and from potential rainfall, which may dilute the fluids and alter
the decomposition process. While extrinsic factors, such as rainfall, direct sunlight or
predation could realistically be encountered at an outdoor crime scene, a key goal of this
present study is to limit such variables.
F igure 7.3. Overview sketch of the decomposition research site and approximate measurements.
73
7.3 Experimental Subjects
Decomposition fluid samples will be collected from four pig carcasses. As outlined
previously, pig carcasses are considered an acceptable analogue for human cadavers
because of their similarity to human torsos in hair coverage, weight, fat to muscle ratio,
physiology and biochemistry, and they avoid the ethical issues associated with the use of
human cadavers (Schoenly et al. 2006; France et al. 1992). The pig carcasses will be
obtained from Nambeelup Piggery, Mandurah and euthanised humanly in accordance with
animal ethics. The carcasses will be received fresh and wrapped in plastic for
transportation to the research facility. In attempt to decrease variability in results, all
carcasses will be of the same gender and approximate weight. As previously mentioned,
post-‐mortem stab wounds will be inflicted on two of the four carcasses to generate blood
flow. Raymond, Smith and Liesegang (1996) compared fresh human blood with fresh and
aged porcine blood and concluded that it was valid to use porcine blood in place of human
blood for educational and research purposes, as the human and porcine blood showed
remarkable similarity. At the completion of the research, the pig carcasses will be disposed
of in a manner that complies with ethics approval.
7.4 Weather Data
Weather loggers will be placed within the research site and will be set to record the
temperature at five-‐minute intervals. Data from the Murdoch University Weather Station
will also be recorded for comparative purposes. To account for temperature data, elapsed
time will be documented as accumulated degree days (ADD), which represent heat energy
units available to sustain chemical and biological processes required for decomposition.
Using ADD allows research that scores the decomposition process to be more reliably
74
compared between environments, seasons, and years, as the temperature data is
accounted for (Megyesi, Nawrocki and Haskell 2005). At the completion of the fieldwork,
the weather data will be transferred to a computer for analysis.
7.5 Adaptations to Study Design
The two primary factors affecting the rate of decay include temperature and insect
activity. Continued and more extensive research within this field may attempt to utilise the
above experimental design in different environmental conditions and in the presence and
absence of insect activity, to determine more thoroughly how these factors impact the
differentiation of blood and decomposition fluid. Other factors that influence the rate of
decomposition include trauma to the body, body size and weight, and the substrate on
which decomposition takes place (Hau et al. 2014). The above experimental design can
again be adapted to study how age, gender, or various other methods of inflicted trauma
potentially influence the physical and chemical properties of decomposition fluid and in
turn, the differentiation of this fluid and blood. In addition, different substrates such as
soil, carpet, bedding material, or linoleum may be used to assess potential substrate
interference.
75
CHAPTER EIGHT ·∙ DISCUSSION AND CONCLUSIONS
Determining the type and origin of a biological sample can yield valuable information that
will supplement forensic casework (An et al. 2012). As previously detailed, blood is one of
the most frequently encountered and significant types of physical evidence associated
with the forensic investigation of violent crime and death (James, Kish and Sutton 2005).
The identification of possible blood evidence is a critical component to an investigation in
which the ante-‐mortem events of the decedent are unknown. A body and therefore any
associated biological stains may not be located for a period of time after death, during
which the decedent will begin to decompose, thereby limiting information available
concerning the events prior to death (Cranstoun 2006). It is important to determine
whether a stain observed next to decomposing remains is blood or decomposition fluid, as
blood would suggest an injury has occurred before or shortly after death, whereas
decomposition fluid is naturally released during decomposition.
Continued research conducted by a number of authors including Vass et al. and Swann,
Forbes, and Lewis in the field of decomposition chemistry has attempted to elucidate the
physical and chemical properties of decomposition fluid. However, inconsistencies are
evident across the literature concerning the compounds present throughout the various
stages of decay and the potential trends exhibited by these compounds, thus highlighting
the chemical complexity of decomposition fluid. This, in conjunction with literature
suggesting that decomposition fluid stains closely resemble the physical characteristics of
bloodstains and the presence of blood breakdown products in decomposition fluid
76
(Cranstoun 2006), complicates the interpretation and determination of stains located next
to decomposed remains and poses significant challenges for the forensic investigators.
Despite their usefulness, current visual, enzymatic, immunological, and catalytic
presumptive and confirmatory assays are substantially impacted by environmental insults,
may suffer limitations associated with specificity and sensitivity, and may only be
applicable to a subset of samples (Frumkin et al. 2011). Several approaches have been
investigated in recent years with the primary aim of developing more reliable and sensitive
strategies for the identification of biological fluids (Legg et al. 2014). However, research
that pertains to the explicit differentiation of blood and decomposition stains is currently
lacking. It is possible to draw conclusions from the literature on potential techniques that
may enable identification and differentiation, however, much work remains to be
completed the area of biological fluid identification and in the field of decomposition
chemistry. For complete characterisation of fluid produced in both the presence and
absence of soil matrices under field and controlled conditions, further validation studies
and development of analytical methodologies is required. To enable direct comparison of
results, there is also a need to establish harmonised analytical protocols (Swann, Forbes
and Lewis 2010a).
In the field of forensic science, there is a need for an unbiased, universal, and specific
method that can identify and differentiate biological fluids (Van Steendam et al. 2013).
Continued research into the differentiation of blood and decomposition fluid stains will
assist in the development of a technique that meets these requirements and will also
provide valuable information to determine the series of events prior to death. This will
77
better enable post-‐mortem investigations of remains that are in the advanced stages of
decomposition, and may provide probative information so that investigative processes are
not misinformed and that resources and expenditure are not misallocated.
78
CHAPTER NINE ·∙ FUTURE RESEARCH DIRECTIONS
Future analyses may seek to focus more comprehensively on the known properties of
decomposition fluid. For example, further studies may aim to identify the presence or
absence and relative proportions of fatty acids, amino acids, and various metabolites in
both blood and decomposition fluid. These elements have been addressed in the literature
and thereby provide an opportunity for development and advancement. In addition,
development and alteration of the proposed experimental parameters with regard to
season, location or technological platform may provide additional information concerning
the composition and degradation of these fluids and may assist in determining how these
factors potentially influence differentiation.
However, it is important to first further investigate the physical and chemical properties of
decomposition fluid and blood and how these properties change with time. Collaborative
research within the forensic disciplines and a more comprehensive understanding of the
basic properties of these fluids and how they degrade will better enable their
differentiation and application to stain identification. With enhancements in technology, it
may be possible with time that blood and decomposition fluid stains can be differentiated
by volatile organic compounds for casework involving outdoor scenarios or by
spectroscopic, genomic, and proteomic techniques. Once a more thorough understanding
has been established, future research should seek to conduct analyses using human
samples. This will help to ensure that any differences identified in porcine samples
accurately reflect those that would be observed in human cadavers and in turn forensic
investigations.
79
References
An, Ja Hyun., Kyoung-‐Jin Shin, Woo Ick Yang, and Hwan Young Lee. 2012. "Body Fluid Identification
in Forensics". BMB Reports 45 (10): 545-‐553. doi:10.5483/bmbrep.2012.45.10.206.
Bardale, Rajesh. 2011. Principles of Forensic Medicine and Toxicology. Ebook. 1st ed. New Delhi:
ATR-‐IR Attenuated Total Reflectance Infrared Spectroscopy
CDI Cadaver Decomposition Island
CE Capillary Electrophoresis
ESI Electrospray Ionisation
FAME Fatty Acid Methyl Ester
GC Gas Chromatography
GC-‐MS Gas Chromatography-‐Mass Spectrometry
Hb Deoxyhaemoglobin
HbO2 Oxyhaemoglobin
HC Hemichrome
HPLC High-‐Performance Liquid Chromatography
LC Liquid Chromatography
MALDI Matrix Assisted Laser Desorption/Ionisation
Met-‐Hb Met-‐haemoglobin
miRNA Micro Ribonucleic Acid
mRNA Messenger Ribonucleic Acid
MS Mass Spectrometry
MS/MS Tandem Mass Spectrometry
NRN Ninhydrin Reactive Nitrogen
PCR Polymerase Chain Reaction
RBC Red Blood Cell
STR Short Tandem Repeat
UV-‐Vis Ultraviolet-‐Visible
VFA Volatile Fatty Acid
VOC Volatile Organic Compound
WBC White Blood Cell
5
1. Introduction
An important aspect of forensic investigations is the detection and identification of
biological fluids at a crime scene.1 Blood is one of the most frequently encountered and
significant types of physical evidence associated with the forensic investigation of violent
crime and death.2 The presence and evaluation of blood evidence can be crucial in the
reconstruction and sequencing of a crime scene, supporting a link between the criminal
act and sample donor, and confirming or refuting statements from the person or persons
of interest.3,4
A body and therefore any associated biological staining may not be located for days or
weeks after death, during which time the decedent will begin to decompose. A thorough
forensic examination of a decedent is required in part for the exclusion or documentation
of injuries that may have contributed to or caused death.5 However, the examination of
putrefied remains can be technically challenging, and the interpretation of findings can be
complicated by the modification and loss of tissue.6 In addition to the degenerative
changes occurring throughout putrefactive decay, remains may be subject to insect
activity, animal predation, and varying environmental factors, all of which will further
complicate post-‐mortem examinations. Putrefactive changes may obliterate markers of
identity or create lesions that mimic or distort the features of actual ante-‐mortem injury.7
Furthermore, suspicions of inflicted injury may arise due to the purging of decomposition
fluids.8 The presence of blood would suggest that an injury has occurred before or shortly
after death, whereas decomposition fluid is released during the naturally occurring process
of decomposition. Consequently, ante-‐mortem injury should be recognised and
differentiated from artefacts of putrefactive decay.7 Despite the development of advanced
6
adjuncts to traditional autopsies, such as magnetic resonance imaging and computerised
tomography, the artefacts induced by putrefaction may still require interpretation and can
complicate post-‐mortem evaluations.6
Current techniques used for forensic biological fluid identification include immunological,
chemical and protein catalytic activity tests, microscopy, and spectroscopic methods.1,3
Decomposition fluid is a chemically complex mixture with associated micro-‐organisms,
insect life, and other debris, thus making it a challenging matrix to study.9 However, the
presence and relative abundance of specific compounds, and the unique composition of
each biological fluid can form the basis of its identification.1 The following review
summarises the properties of decomposition fluid and blood and evaluates the potential
use and effectiveness of various techniques for the differentiation of these fluids.
Identifying the source of a stain as decomposition fluid or blood may offer supplementary
information to the post-‐mortem examination of highly decomposed remains, and provide
probative information so that investigative processes are not misinformed and that
resources and expenditure are not misallocated.
2. Mammalian Post-‐mortem Decomposition
Decomposition of mammalian soft tissue is a continuous post-‐mortem process.10
Circulatory stasis and the ensuing anoxic environment give rise to a series of biochemical
reactions, which lead to the failure of homeostatic mechanisms and the gross
morphological changes associated with the observable stages of decay.11 Decomposition is
often broadly categorised into pre-‐ and post-‐skeletonisation. The pre-‐skeletonisation
classification can be subdivided into four stages including fresh, bloated, decay, and dry.12
7
Defining the process of decomposition into stages can assist investigators in estimating the
post-‐mortem interval, and in describing the complex biochemical reactions associated with
death.13
Decomposition involves the two parallel processes of autolysis and putrefaction.14 The first
identifiable process occurring during the fresh stage of decay is autolysis, which is the
enzymatic breakdown of the soft tissues.9,15 Autolysis is a chemical process that is slowed
by cooler conditions, accelerated by heat, and stopped by the inactivation of enzymes or
by freezing.14 This process progresses more rapidly in tissues that have a high water and
enzyme content, and can be observed macroscopically by epidermal sloughing and
subcutaneous blisters.16 The superficial vessels become stained by intravascular
haemolysis, which produces a visible reticulated pattern under the skin, commonly
referred to as ‘marbling’.17,18 Autolysis is thought to occur due to reduced oxygen levels,
which causes a decrease in the intracellular pH.19 The anoxic and acidic environment, in
conjunction with unregulated enzyme activity, results in cellular membrane dissolution and
the release of nutrient-‐rich fluids, which facilitates putrefaction.20
The beginnings of putrefaction can be observed during the bloated stage of
decomposition. Putrefaction is the breakdown of the soft tissues caused by the action of
fungi, bacteria, and protozoa.9 The release of lipid, carbohydrate, and protein by-‐products
during autolytic degradation encourage the proliferation of these micro-‐organisms, and
the increasingly fluid state of the tissues facilitates bacterial transmigration.15,21 The
formation of sulphaemoglobin in the settled blood results in a greenish discolouration of
the skin, which is often the first visible sign of putrefaction.16 Micro-‐organisms produce
8
various gases including hydrogen sulphide, methane, and more complex volatile organic
compounds, which accumulate within the respiratory and intestinal tracts causing tissue
distension.15 An increase in the internal pressure due to the build-‐up of volatile gases and
other products of catabolism eventually results in the purging of fluid and gases from the
natural orifices of the body.16,22 Putrefactive changes are dependent primarily on the prior
state of health of the decedent and the environmental temperature.23
Active decay begins following the purging of gases and fluids.20 Chemical constituents will
continue to be degraded and released and as such, putrefaction continues throughout
active decay.9 At this point in the decomposition process, insect activity is prominent,
there is a significant number of anaerobic and aerobic bacteria present, and electrolytes
are rapidly leached out of the body.16 Liquefaction of the soft tissues will result from
continued decomposition,18 and a cadaver decomposition island (CDI) may form due to the
release of cadaveric material.24 The final stage of decomposition is the dry stage.9
Following the phases of ‘wet decay’ the surface tissues collapse, dry, and darken to assume
a leathery texture and residual organs shrink and desiccate. The body may eventually
progress to skeletonisation depending on the post-‐mortem interval and the surrounding
environmental conditions.18
The process of decomposition is dynamic and the timeframe in which it occurs can be
highly variable.15 Intrinsic factors that govern decomposition include ante-‐mortem medical
conditions, the weight and age of the decedent, and the nature and extent of trauma.
Extrinsic factors including moisture, temperature, animal predation and insect accessibility,
the manner of disposition, and protective coverings also influence the sequence and
9
duration of decomposition.19,25 It is important to note that the process of decomposition
occurring under varying conditions cannot always be accurately described by the
classifications currently published in the literature. The characterisation of
decompositional stages is complicated by conditions that cause differential decay or by
those that alter the process and rate of decomposition.13
3. Macromolecule Degradation
The four major classes of biological macromolecules include nucleic acids, carbohydrates,
proteins, and lipids. These macromolecules are broken down into their structural
components by the complex reactions associated with the process of decomposition.16
3.1. Carbohydrate Degradation
Polysaccharides are broken down into component sugars during early decomposition by
the action of micro-‐organisms. Fungi can breakdown sugars into organic acids including
citric, glucuronic, and oxalic acids. Bacteria are responsible for the degradation of sugars
into pyruvic and lactic acids under aerobic conditions, which can be further degraded into
water and carbon dioxide. Under anaerobic conditions, bacteria can breakdown sugars
into acetic, butyric, and lactic acid. Bacterial carbohydrate fermentation may produce
hydrogen, hydrogen sulphide, and methane gases, as well as butanol and ethanol12 (Figure
3.1).
10
3.2. Protein Degradation
The degradation of proteins into their component amino acids occurs as a result of
bacterial enzyme activity and is referred to as proteolysis.12 The rate of proteolysis varies
depending on bacterial action, moisture, temperature, and on the protein type. Proteins of
epithelial and neuronal tissues typically degrade first, while hard tissue proteins, such as
keratin and collagen, are more resistant to degradation. The process of decomposition
results in the breakdown of proteins into amino acids, peptones, polypeptides, and
proteoses. Continuing proteolysis can lead to the evolution of gases including ammonia,
carbon dioxide, hydrogen sulphide, and methane, and the production of the phenolic
compounds, indole and skatole21 (Figure 3.2). The amino acids produced as a result of
protein degradation can undergo: deamination, which produces ammonia;
F igure 3.1. Overview of carbohydrate degradation (adapted).26
11
decarboxylation, which results in the formation of cadaverine, indole, putrescine,
tryptamine, tyramine, and carbon dioxide; and desulphurhydralation, which can yield
ammonia, hydrogen sulphide, pyruvic acid, and thiols.12
3.3. Lipid Degradation
Following death, saturated and unsaturated fatty acids are produced as intrinsic tissue
lipases hydrolyse lipids.12,26 As decomposition continues, the concentration of fatty acids
increases, whereas the concentration of neutral lipids decreases. In an anaerobic
environment, saturated and unsaturated fatty acids will undergo hydrogenation and
Figure 3.2. Overview of protein degradation.26
12
further hydrolysis. In an aerobic environment, oxidation of the unsaturated fatty acids can
occur due to atmospheric oxygen, bacteria, or fungi. Oxidation of lipids will initially yield
peroxide bonds, with ketones and aldehydes the final products of this process.12 Fatty
acids and glycerol degrade yielding shorter chain saturated fatty acids and eventually
water and carbon dioxide.26 Figure 3.3 illustrates the process of lipid degradation that
occurs during decomposition.
F igure 3.3. Overview of lipid degradation (adapted).26
13
4. Decomposition Fluid
Decomposition fluid is the chemically complex liquid produced by the degradation of the
organs and soft tissues of the body.27 The released fluid is often associated with micro-‐
organisms, insects, and other debris, thereby making it a challenging matrix to study.9
Much research investigating the physical and chemical properties of decomposition fluid
has been conducted using domestic pig (Sus domesticus) carcasses due to ethical
restrictions associated with the use of human cadavers. Pig carcasses are considered an
acceptable analogue for human cadavers because of their similarity to human torsos in
hair coverage, weight, fat to muscle ratio, physiology, and biochemistry.28
4.1. Physical Properties of Decomposition Fluid
Table 4.1 summarises the physical properties of porcine decomposition fluid as reported
from outdoor research trials conducted in Ontario, Canada during the spring-‐summer
months.13 In each replicate trial, three carcasses were exposed to, and three carcasses
were protected from insect activity. The insect exclusion group was subdivided into
‘partially excluded’ and ‘completely excluded’ based on whether insects gained access.
14
Table 4.1. Summary of the physical properties of porcine decomposition fluid produced in the
absence, partial presence, and presence of insect activity.13
4.2 Chemical Properties of Decomposition Fluid
A non-‐chromatographic approach to the chemical study of decomposition involved the
investigation of ninhydrin-‐reactive nitrogen (NRN).9 Cadaver decomposition releases
nitrogenous compounds, which can be detected by reaction with ninhydrin.29,30 Carter et
al.29 proposed that there would be a significant increase in NRN concentration in soils
associated with mammalian decomposition. Juvenile rats (Rattus rattus) were buried in
contrasting soil sites in Queensland, Australia. Following a sequential and destructive
sampling regime and NRN analysis, results indicated that the cadaver burial samples
demonstrated a 1.4 to 2.2-‐fold increase in NRN. Van Belle et al.30 adapted the NRN
Physical Propert ies of Decomposit ion Fluid
Appearance Decomposition fluid samples were initially deep red in colour and
predominantly blood. Following insect colonisation, the samples became
more viscous, turned brown, and contained foreign matter. Samples
collected from the insect exclusion carcasses changed colour throughout
decay from red-‐burgundy to brown, yet remained liquid and non-‐viscous.
pH
Measurement
During early decomposition, the pH values and trends were similar between
experimental groups. Measurements diverged following insect colonisation,
whereby the pH levels became more alkaline for the insect inclusion and
partial exclusion carcasses. pH measurements decreased following the insect
feeding stages. The complete exclusion carcasses did not display a sharp
increase in pH.
Conductiv ity All experimental carcass groups displayed a general increase in conductivity
during early decomposition, yet trends diverged once insects began feeding.
Measurements decreased and remained low in each of the partial exclusion
and inclusion groups, while measurements remained significantly higher in
samples collected from the complete exclusion carcass.
15
technique to examine surface and burial decomposition scenarios of porcine remains, and
to investigate the lateral diffusion of NRN. The burial trial results corresponded with the
surface trial results, whereby increased concentrations of NRN were associated with the
most active stages of decomposition. The lateral influx of NRN was determined to be
minimal. A case study investigated the use of the NRN technique in the reconstruction of a
disturbed outdoor death scene.31 The presumptive decomposition site had significantly
greater concentrations (p < 0.001) of NRN when compared to the other sampling sites and
as such, was concluded to represent the area in which the majority of decomposition had
occurred.
This research highlights the potential for NRN to be used for the detection of clandestine
burial sites, and for determining the original site of decomposition for surface deposited
remains subject to post-‐mortem relocation or animal scavenging.30 However, it was noted
that other organic sources release NRN and as such, an elevated concentration of NRN is
not necessarily indicative of human decomposition.29,31
Non-‐chromatographic methods have provided a qualitative profile of decomposition fluid,
however more selective analytical techniques are required to provide quantitative data,
and to offer the level of specificity needed to understand the fundamentals of
decomposition chemistry.9 Separation science techniques including gas chromatography
(GC), capillary electrophoresis (CE), and liquid chromatography (LC) may be used to
analyse the products of decomposition.12 Early decomposition chemistry studies focused
on short chain volatile fatty acids (C2 – C5),9 which are produced during active
decomposition by a series of microbially-‐induced reductive and oxidative reactions of
16
lipids.32 Tuller32 analysed volatile fatty acids (VFAs) in soil samples collected from known
grave and execution sites in the former Yugoslavia using a field portable gas
chromatograph (microFast GC2) and mass spectrometer (MS). Only three of the collected
soil samples contained detectable levels of the targeted VFAs. However, several other fatty
acids including capric, lauric, myristic, oleic, palmitic, and stearic acids were identified in
the mass grave soil samples. These fatty acids were not detected in the control samples
and as such, were likely to be associated with decomposing remains. It was proposed that
detection of the targeted VFAs may have been affected by experimental design, co-‐elution
with the solvent, decomposition rate, soil structure or environmental conditions. Despite
these factors, the author concluded that VFAs could remain detectable in crime scene soil
samples for a considerable length of time.
Vass et al.33 studied soil solutions from beneath decomposing human cadavers using GC
analysis to collect data on microbially-‐produced VFAs and various anions and cations. Gas
chromatography can be used to analyse VFAs, as the technique enables quantification of
individual components and the separation of mixtures.12 Once ante-‐mortem weight was
standardised and the moisture of the soil taken into account, the VFA and anion/cation
concentrations were the same for any given total of accumulated degree days (ADD),
irrespective of the subject or season in which decomposition occurred. The authors
recognised that there appeared to be a correlation between VFA production and the
stages of decomposition, which was attributed in part to the sequential degradation of
carbohydrates and proteins.
17
In 2013, von der Lühe et al.34 investigated the suitability of cholesterol and coprostanol as
biomarkers for decomposition fluid within a soil matrix. These sterols were considered
valuable compounds for the detection of decomposition fluid due to their origin and
stability against degradation over time. The phytosterol, β-‐sitosterol, was also examined as
it was assumed to remain stable between the control and treated soils. Domestic pig
carcasses were buried in shallow graves and exhumed after three and six months. Soil
samples were analysed using gas chromatography-‐mass spectrometry (GC-‐MS). When
compared with the control and six-‐month old graves, higher concentrations of the
investigated sterols were detected in the three-‐month old graves. The detection of
cholesterol and coprostanol was attributed to soft tissue decomposition and the release of
decomposition fluid. Aerobic degradation, sorption, transformation, and transport away
from the depositional source were proposed as likely explanations for the results obtained
after six months of burial. The results highlight the need to investigate the influence of soil
properties on the detection of decomposition products.
Preliminary research by Swann et al.35 aimed to determine the chemical composition of
decomposition fluid in the absence of a soil matrix. The preparation phase involved
dilution and filtration of decomposition fluid samples followed by GC-‐MS analysis. The first
trial examined the fluids produced from pork rashers (belly pork) that were either exposed
to or protected from insect activity. For the duration of the study, no decomposition fluid
was produced from the protected samples. However, fluid was collected between days
three and 24 of the trial for samples exposed to insect activity. Compounds detected
during the pork rasher trial, as indicated by chromatogram are illustrated in Figure 4.1.
18
Additional trials were conducted with stillborn piglets and adult pig carcasses to represent
a more realistic model of decomposition. For the piglets exposed to insect activity, fluid
was produced between days 14 and 47, whereas the protected piglets produced
decomposition fluid between days 42 and 54. Compounds produced from Piglet 3 on day
26, as indicated by chromatogram, are illustrated in Figure 4.2. Fluid collection
commenced on day five of the pig carcass trial and concluded on day 14 when maggot and
insect activity had ceased and only skeletal remains and mummified skin were evident.
Similar compounds including short and long chain acids and cyclic compounds were
detected in the pork rasher and adult pig trials. Previously undetected indole and phenol
compounds were also identified (Figure 4.3). Variability in fluid production and the
complex nature of the decomposition process highlighted the need for a larger sample set
in both the piglet and adult pig trials.
F igure 4.1. Chromatogram showing compounds produced on day 24 of the pork rasher trial. Numeric order of compounds: 1: acetic acid, 2: propionic acid, 3: trimethylacetic acid (internal standard), 4: butyric acid, 5: isovaleric acid, 6: 2-‐piperidone, 7: phenylacetic acid, 8: phenylpropanoic acid, 9: myristic acid, 10: palmitic acid, 11: palmitoleic acid, 12: stearic acid, 13: oleic acid, 14: linoleic acid.35
19
F igure 4.2. Chromatogram showing compounds produced on day 26 from Piglet 3. Numeric order of compounds: 1: acetic acid, 2: propanoic acid, 3: isobutyric acid, 4: trimethylacetic acid (internal control), 5: butyric acid, 6: isovaleric acid, 7: valeric acid, 8: isocaproic acid, 9: 2-‐piperidone.35
F igure 4.3. Chromatogram showing compounds produced on day six during the adult pig trial. Numeric order of compounds: 1: acetic acid, 2: propionic acid, 3: trimethylacetic acid (internal control), 4: butyric acid, 5: isovaleric acid, 6: valeric acid, 7: 4-‐methylvaleric acid, 8: caproic acid, 9: phenol, 10: 2-‐piperidone, 11: indole, 12: phenylacetic acid, 13: phenylpropionic acid, 14: oleic acid. The peak marked ‘x’ is an unidentified peak.35
20
Further analyses conducted by Swann et al.36 on the above experimental design identified
that isovaleric and propionic acids were detected on all collection days during the pork
rasher trial. The data indicated that until day 15, acetic, isobutyric, and propionic acid
followed an increasing trend and then a decreasing trend until the completion of the trial.
Similarly, isovaleric and butyric acid followed an upward trend, reaching a maximum at day
15, yet the trend appeared to be cyclic. The long chain fatty acids detected in this trial (9-‐
hexadeconoic, linoleic, myristic, oleic, palmitic, and stearic acid) passed through a
maximum on day 15 and appeared to follow an eight-‐day cycle. The authors tentatively
related these observations to the adipose tissue content of the pork rashers, the feeding
cycle of the maggots, and the level of fly activity. Analysis of the piglet trial data conveyed
that there were no clear trends in the compounds identified. Results from the pig trial
demonstrated that the target short chain acids, with the exception of isobutyric acid,
appeared to follow a cyclic trend, while the long chain fatty acids (linoleic, oleic, palmitic,
and stearic acid) showed an increasing trend. However, continuation and confirmation of
the trends could not be demonstrated due to disruptions in sampling. This study identified
considerable variation in the abundance and type of compounds present in decomposition
fluid, thereby highlighting the chemical complexity of this sample.
To characterise decomposition fluid produced from porcine remains in the presence,
partial presence, and absence of insect activity, fluid samples were analysed using GC-‐MS
following fatty acid methyl ester (FAME) extraction.13 The dominant fatty acids present in
porcine and human soft tissue including linoleic, myristic, oleic, palmitic, palmitoleic, and
stearic acids were detected in all samples. However, the fatty acids did not display
consistent trends, and there was variation in the compounds produced throughout the
21
decay stages. These results suggest that insect activity influences the degradation and
concentration of fatty acids.
Compounds that are not suitable for GC analysis because of thermal instability can be
analysed using capillary electrophoresis (CE). This technique offers the potential for rapid
and efficient separations of complex chemical mixtures.12 A capillary electrophoresis
method was adapted for the determination of amino acids and biogenic amines in porcine
decomposition fluid samples.37 There was an expectation that amino acids and biogenic
amines would be present in decomposition fluid, due to the biodegradation pathways of
the main macromolecules. Method optimisation was achieved using a screening design
followed by a central composite design, in which total analysis time and peak resolution
were response factors. Phenylalanine, tryptamine, tryptophan, tyramine, and tyrosine
were all identified by spiking and migration time. However, further research is required to
elucidate the identity of a number of unidentified peaks observed in the electropherogram
(Figure 4.4).
F igure 4.4. Electropherogram at optimised running conditions identifying in numeric order: 1: tryptamine, 2: tyramine, 3: neutral, 4: tryptophan, 5: tyrosine, 6: phenylalanine. Peaks marked with an asterisk are unidentified compounds.37
22
As with CE, high-‐performance liquid chromatography (HPLC) can be used to study
thermally unstable or potentially non-‐volatile decomposition products.12 Liquid
chromatography-‐electrospray ionisation-‐tandem mass spectrometry (LC-‐ESI-‐MS/MS),
operated in multiple reaction monitoring mode, was used to analyse porcine
decomposition fluid for the detection of amino acids and biogenic amines.38 Infusion
experiments enabled refinement of the tuning parameters and an optimised LC method
was applied to the samples. Over the course of the trial, tyramine, putrescine, and indole
displayed a general increasing trend with respect to time and temperature. Tryptophan
and phenylalanine compounds were detected in all fluid samples, and despite not
indicating potential trends individually, together the compounds displayed a 14-‐day cyclic
trend. The sum of amino acid concentrations, with the exception of two sampling days,
also appeared to follow this trend. However, further investigation is required to ensure the
proposed method can be used for quantitative assessment.
Analytical separation techniques have enabled the study of mammalian decomposition
and the associated by-‐products including decomposition fluid.9 The above studies have
primarily focused on providing more reliable techniques for estimating post-‐mortem
intervals. However, determining what compounds are present in decomposition fluid will
assist in providing a greater understanding of decomposition chemistry, and in turn
provide valuable information needed for the differentiation of this sample and blood
evidence.
23
5. Blood Evidence
Blood is one of the most frequently encountered and significant types of physical evidence
associated with the forensic investigation of violent crime and death. The nature and
circumstances of violent crimes often produce various bloodstains that, when carefully
studied with respect to their distribution and geometry, may assist with the reconstruction
of a potential crime scene. The accurate interpretation of blood evidence has proved
critical in a number of cases where the manner of death must be resolved. An
understanding of the properties of blood is necessary for the interpretation of bloodstain
evidence.39
5.1. Biological Properties of Blood
Blood is a liquid form of connective tissue comprising 55% intercellular material (plasma)
and 45% formed cellular elements (erythrocytes, leukocytes, and platelets).2,40 The most
abundant cellular component in blood are erythrocytes or red blood cells (RBCs). The small
size (approximately 7.5 μm in diameter) and biconcave shape of erythrocytes makes them
efficient in their transportation of oxygen and carbon dioxide. Erythrocytes do not have a
nucleus and as such, lack nuclear DNA. An important source of DNA for forensic analyses is
the nucleated leukocyte or white blood cell (WBC). Leukocytes can be divided into
granulocytes (basophils, eosinophils, and neutrophils) or agranulocytes (monocytes and
lymphocytes), all of which protect against pathogens and infectious micro-‐organisms. The
smallest constituent of blood are platelets, which assist in haemostasis through platelet
plug formation and coagulation.2,41 The formed cellular elements are suspended in plasma,
which is responsible for transporting electrolytes, hormones and nutrients, removing
waste products,2 regulating pH and temperature, and maintaining fluid balance.42
24
5.2. Chemical Changes Associated with Blood Degradation
Many forensic presumptive tests for blood rely on the peroxidase-‐like properties of
haemoglobin, which is an oxygen transporting protein in erythrocytes.43 Haemoglobin
consists of two alpha (α) and two beta (β) chains that are conjugated with a haem
moiety.41 Inside a healthy human body, haemoglobin may be saturated with oxygen, oxy-‐
haemoglobin (HbO2) or without oxygen, de-‐oxyhaemoglobin (Hb).44 Oxy-‐haemoglobin is a
low-‐spin ferrous (Fe2+) compound that can be oxidised into met-‐haemoglobin (met-‐Hb),
which is a high-‐spin ferric (Fe3+) protein incapable of binding oxygen.45 When formed inside
the body, the NADH-‐dependent enzyme cytochrome-‐b5 reductase can reduce met-‐Hb
back to Hb. Upon exiting the body, haemoglobin saturates with oxygen, and the transition
of HbO2 into met-‐Hb will no longer be reversed due to the decreasing availability of
cytochrome-‐b5.44,46 Over time, met-‐Hb will denature to hemichrome (HC).45 Figure 5.2
provides a schematic representation of the oxidative processes in haemoglobin.
F igure 5.2. Oxidative processes in haemoglobin. A) Oxidative process occurring in vivo. B) Oxidative process occurring in vitro (adapted).46
25
5.3. Biological Screening for Blood
The development of multiple screening techniques has enabled forensic investigators to
determine the type of biological material that may be present within a potential crime
scene, or on items that pertain to a criminal investigation. Bloodstains at a crime scene
may be aged, degraded, or diluted and subsequently no longer characteristic of blood.
Blood identification involves a series of steps including visual examination, presumptive
and confirmatory testing, species determination, and individualisation testing.47 Table 5.1
details the presumptive, confirmatory, and species determination assays available for
blood identification and details the associated limitations.
26
Table 5.1. Presumptive, confirmatory, and species determination assays available for blood
identification and the associated limitations.43,48,49
C lass if icat ion Assay Reaction L imitat ion
Presumptive
Tetramethylbenzidine
(Hemastix®)
Produces a yellow to green
or blue-‐green colour change
as tetramethylbenzidine is
oxidised.
Products containing
hypochlorite ions or
hydrogen peroxide,
certain metal salts,
and some plant
peroxidases can
catalyse the
oxidation reaction,
producing false-‐
positive results.
Strong reductants
such as zinc or
lithium may inhibit
the oxidation
reaction and
produce false-‐
negative results.
Phenolphthalein
(Kastle-‐Meyer test)
Shows a pink colour change
as the colourless
phenolphthalin is oxidised
to phenolphthalein.
Leucomalachite Green Shows a green colour
change as the colourless
leuco base form of
malachite green is oxidised.
Fluorescence
(Fluorescin)
Fluorescin is oxidised to
fluorescein, which emits a
yellow-‐green light when
exposed to a light range of
425 to 485 nm.
Chemiluminescence
(Luminol)
The oxidation reaction of
luminol produces a blue-‐
white light.
Confirmatory Microcrystal
(Takayama and
Teichmann tests)
Bloodstains are chemically
treated forming crystals of
haemochromagen or
haematin. The crystal
morphologies are compared
to a standard using
microscopy.
Confirmatory assays
lack species
specificity and are
considered less
sensitive than
presumptive assays.
Species
Determination
Immunochromatographic:
Identification of human
haemoglobin.
(Hexagon OBTI® and
ABAcard® HemaTrace®)
Immunochromatographic:
Identification of Human
Glycophorin A Protein
(RSID™ test)
Utilises the binding
between an antigen and its
homologous antibody. A
pink precipitin line in the
test and control areas
indicates a positive result.
Detects the glycophorin-‐A
protein present in the
erythrocyte membrane.
High concentrations
of haemoglobin may
produce false-‐
negative results,
while higher primate
and ferret blood may
produce false-‐
positive results.
Requires the epitope
to be undamaged.
27
6. Differentiation of Blood and Decomposition Fluid Stains
Determining the origin and type of biological evidence can yield valuable information that
will supplement forensic casework. A bloodstain may indicate assault, physical struggle, or
murder,3 whereas a decomposition fluid stain is essentially an artefact of the naturally
occurring decomposition process. Possible techniques for the differentiation of these fluids
are evaluated below.
6.1. Visual Examination
Sutton47 detailed that visual examination was the first step in bloodstain identification.
Alterations in the haemoglobin as a bloodstain ages results in a progressive colour change
from red to reddish-‐brown to green and finally dark brown. The duration and sequence of
the colour changes are affected by environmental conditions and the presence of micro-‐
organisms and bacteria.39 Decomposition fluid also progresses through a series of colour
changes from red-‐burgundy to brown.13 The similar colour changes exhibited by both fluids
over time does not permit visual identification as a method of biological fluid
determination and differentiation.
6.2. pH Measurement
Ante-‐mortem blood has a pH of between 7.35 and 7.45.50 After death, the pH of blood
drops due to the accumulation of phosphoric and lactic acid from the breakdown of fatty
acids and amino acids, and the accumulation of CO2 from glycolysis and glycogenolysis.
With the onset of putrefaction, muscle proteins degrade resulting in the build-‐up of
ammonia, which in turn causes the blood pH to become more alkaline.51 Similarly, alkaline
pH measurements of decomposition fluid samples were reported by Comstock.13 Prior to
28
insect colonisation pH measurements were neutral and the trends were similar between
experimental groups. Measurements diverged following insect colonisation, whereby the
pH levels became more alkaline. The carcasses completely excluded from insect activity did
not display a sharp increase in pH. Despite this research focusing on the liquid form of
these samples, the results still highlight the variability of pH measurements due to the
influence of extrinsic factors. In addition, Karmakar51 noted that post-‐mortem changes in
blood pH do not follow a definite sequence. Consequently, pH analyses would lack the
specificity required to definitively differentiate blood and decomposition fluid stains.
6.3. Presumptive Testing for Blood
Cranstoun52 researched in part the effect of decomposition on the presumptive detection
of biological fluids. Strips of fabric stained with saliva, semen or blood were attached to a t-‐
shirt and placed on top of and beneath pig carcasses. The carcasses were left to
decompose over an eight-‐week period in an open coastal dune area. Post collection, the
blood section of each strip was removed and tested using the Combur3 Test®E and Kastle-‐
Meyer presumptive tests for blood. The author noted that decomposition fluid contains
blood breakdown products and consequently, all areas of the bloodstain would test
positive if they had been in contact with the fluids released during decomposition. As such,
an area outside of the original bloodstain referred to as ‘Other’ was tested for comparative
purposes. Samples from the upper side of the carcasses produced a stronger reaction with
the original bloodstain area using the Combur® test strips. Equally strong reactions were
recorded for samples collected from beneath the carcasses using the Combur® test strips,
and for most samples using the Kastle-‐Meyer reagent. Additional strips were analysed
using Luminol to determine whether a pattern of body fluid staining could be identified
29
and distinguished from decomposition fluid staining. Pattern recognition was only possible
for six days, after which results produced an indiscriminate chemiluminescence
appearance, suggesting a reaction was occurring with the decomposition fluid.
Bemelmans22 also assessed in part how screening for biological fluids may be affected by
the process of decomposition. A porcine model was used to simulate human
decomposition to ensure the samples were correctly being identified as originating from
the deposited stains, as opposed to the decomposing remains. Blood samples were placed
on top of or beneath a pig carcass or a similarly weighted bag of sand, which served as the
control. Presumptive testing using the Kastle-‐Meyer reagent and ABAcard® HemaTrace®
confirmatory testing were performed on any areas of red-‐brown staining. Positive
presumptive and confirmatory results were obtained for all samples collected from the top
of the pig carcass and control. Samples from beneath the pig carcass returned positive
presumptive results, and positive confirmatory results through day 10, however, results
were negative thereafter. Positive confirmatory results were only returned on days 1 to 11,
13 and 16 for samples beneath the control. The dilution and degradation of the samples
was attributed to the compounding effects of rainfall, varying temperatures, soil
properties, and the products of decomposition.
All samples returned positive presumptive results, thus suggesting that biological testing
may still be possible despite exposure to decomposition products and environmental
insults. However, it is unknown if blood breakdown products present in the decomposition
fluid influenced these results. Furthermore, it is unknown what effect the constituents of
decomposition fluid would have on confirmatory testing, as any haemoglobin present in
30
the fluids produced by the decaying porcine remains would not have reacted with the
human-‐specific test. Had this research been conducted using human cadavers, it is
possible more positive confirmatory results would have been returned. However, the
sensitivity of the assay may detect the blood breakdown products present in human
decomposition fluid, thereby producing false-‐positive results. The above research
highlights that conventional biological screening may not be sufficient to conclusively
determine if blood evidence is present.
In recent years, several approaches have been researched with the aim of developing
more reliable and sensitive techniques that overcome the limitations of current human
biological fluid identification methods.53 Emerging approaches that may be utilised for the
differentiation of blood and decomposition fluid stains include spectroscopy, the analysis
of volatile organic compounds, messenger-‐ and micro-‐RNA expression profiles, epigenetic
modifications of DNA markers, and protein biomarker detection.
6.4. Spectroscopic Techniques
When irradiated by ultraviolet light, most biological fluids will undergo absorption
processes or fluorescence, which enables their rapid and widespread detection.
Ultraviolet-‐visible (UV-‐Vis) spectroscopy has been applied to the detection of sweat, saliva,
semen, urine, and blood stains. However, this technique is more applicable for
presumptive identification and exploratory purposes, due to the associated limitations
including substrate interference, poor selectivity and specificity, and false-‐positive results.
Vibrational spectroscopies, such as Raman and infrared spectroscopy appear to overcome
the low specificity of UV-‐Vis.54 These techniques report on the molecular vibrational
31
characteristics within a sample and are rapid, selective, and non-‐destructive.54,55 However,
variability between donors and the heterogeneity of dried biological fluids contribute to
the complexity of the Raman spectra and as such, advanced statistical analyses are
required to build a unique spectroscopic signature.56 Mathematical methods of
multivariate analysis and chemometrics allow researchers to extract useful information
and interpret complex spectral data, thus allowing for more accurate and comprehensive
results.55 Using statistical analyses, the Raman spectral signatures of saliva, semen, vaginal
fluid, and blood have been established and species determination achieved.57-‐61
Decomposition products may also be studied using spectroscopic methods. Infrared
spectroscopy can be used to identify carbohydrates, proteins and lipids, and the
compounds that result from the degradation of these macromolecules. In addition,
spectroscopy may be used to determine the compounds within a sample and to observe
how these compounds change with time.12 Porcine decomposition fluid samples were
analysed using attenuated total-‐reflectance-‐infrared spectroscopy (ATR-‐IR) and GC-‐MS.13
However, the trends observed from the spectroscopic data between decomposition trials
yielded inconsistent results.
Spectroscopic techniques are limited in that biological fluids do not appear as isolated
substances, and the substrate on which the stain is formed or absorbed can contribute to
the vibrational spectra.54 The spectroscopic signal of biological fluids may also be
completely masked by contaminants, an issue further complicated by the varied
composition of possible contaminants.62 Moreover, decomposition fluid is a chemically
complex matrix that is thus far not completely understood. Additional comprehensive
32
research investigating the validation and optimisation of spectroscopic techniques is
needed. To demonstrate the capabilities of spectroscopy, it is necessary to test samples
that more closely resemble evidential samples from forensic casework.54 Various
spectroscopic methods may provide useful trend information, however to gain a more
thorough understanding of decomposition chemistry and in turn to differentiate between
blood and decomposition fluid stains, more selective analytical techniques may be
required.9
6.5. Analysis of Volatile Organic Compounds
The complex series of biological processes and chemical reactions that occur during
decomposition contribute to the evolution of odorous chemicals, referred to as volatile
organic compounds (VOCs).63 These compounds arise from the catabolism of the main
biological macromolecules.12 To date, results from chemical examination and comparison
have shown that decomposition fluid and human remains produce similar odour profiles.27
In 2004, Vass et al.64 established the Decomposition Odour Analysis (DOA) Database, which
identifies and details chemicals associated with human burial decomposition. Analysis by
GC-‐MS identified eight major classes of chemicals containing 424 specific volatile
compounds. Continued research aimed to define the volatile chemical signature released
during human burial decomposition.65 Of the 478 semi-‐volatile or volatile compounds
detected, 30 were identified as important indicators of human decomposition. However, it
was acknowledged that the selected compounds were also detected in various
environmental VOC profiles. Further research demonstrated that the decomposition odour
profile is dynamic and that there is a transition in the compounds produced as
decomposition progresses.66-‐68
33
Decomposed remains and blood have distinct scent profiles that do not closely resemble
each other27 and as such, VOC profiling may be employed to differentiate between
decomposition fluid and blood. Forbes et al.69 chemically profiled human blood and
identified that aged and fresh blood samples demonstrated different VOC profiles, with
aged samples exhibiting increased complexity. However, further research indicated that
after ageing for up to one year, the complexity was lost.70
Variability in environmental conditions, substrate, insect activity, and the physical
characteristics of the remains contribute to changes in the evolution and liberation of
VOCs.64 Decomposition odour research has provided a guideline for determining what
chemicals will be produced and their concentration ranges.71 However, a consistent
decomposition VOC profile is still lacking, which may reflect variation in analytical
methodology or decomposition variables.63 There are also inconsistencies in the type and
number of volatile compounds observed in blood odour profiles, which may be attributed
to physiological differences between donors, the analytical technique, or differences in the
targeted compounds.70 This method may not be applicable for stain identification and
differentiation, as much research remains to be conducted in the field of decomposition
chemistry and VOC profiling. Moreover, VOC profiling is predominantly utilised for
detection dog training and the location of clandestine burial sites.71
6.6. Genomics
Advancements in forensic genetics have led to the development of new techniques that
involve the detection and analysis of messenger RNA (mRNA), microRNA (miRNA), and
differential DNA methylation patterns.3 These tissue-‐specific approaches to biological fluid
34
identification can supplement DNA analyses to provide information regarding cell type and
origin, which in turn may assist with the inference of activities.72,73 Despite being
considered less stable than DNA due to ubiquitously present ribonucleases, the stability
and recoverability of RNA in biological stains has been demonstrated.74
6.6.1. mRNA-‐based Analysis
Biological fluids usually contain multiple cell types, each of which expresses a distinctive
pattern of mRNA transcripts. The development and implementation of mRNA profiling is
based on harnessing these multicellular transcriptomes.56 Multiple RNA transcripts have
been detected using real-‐time polymerase chain reaction (PCR)75,76 or reverse-‐
transcriptase-‐PCR.75,77 The most frequently proposed RNA markers for blood are generally
divided into proteins associated with the haem biosynthesis pathway and haemoglobin, or
proteins associated with the erythrocyte membrane.56 A collaborative exercise on mRNA
profiling for the identification of blood demonstrated that 15 of the 16 participating
laboratories were able to detect and isolate RNA from dried bloodstains, thus highlighting
the potential for mRNA profiling in forensic casework.78 When compared to conventional
biochemical analysis, mRNA profiling offers high specificity and sensitivity, the possibility of
detecting various biological fluids in one multiplex reaction, compatibility with DNA
extraction methods, and the potential for automation, all of which can preserve the
sample and improve timeliness.3,48,74 Despite several mRNA markers having been proposed
as specific, sensitive, and stable methods for forensic biological fluid determination,3 it is
still possible that UV radiation, moisture, and heat will influence mRNA marker stability.79
Other limitations associated with mRNA analysis include difficulties in profile
35
interpretation, destructiveness of the technique, and that there are no validated guidelines
for the consistent interpretation of mRNA analysis data.80
6.6.2. miRNA-‐based Analysis
An alternative option to mRNA for the identification of evidential samples are miRNAs,
which are a class of small, non-‐coding RNA molecules approximately 18 to 25 nucleotides
in length. The tissue-‐specific expression pattern and small size, make miRNA less prone to
environmental degradation.81 Analyses can be performed using the same methodology
employed in traditional RNA and DNA analysis, thereby reducing additional consumables
and equipment.80 However, a key limitation to the use of miRNA analysis is the specificity
for species and biological fluids, as any given target may have multiple miRNAs and a single
miRNA may have multiple targets.56 Reproducible and consistent results have not been
demonstrated in the literature, which reflects the need for further research to establish
appropriate candidate markers.80
6.6.3. Epigenetic Analysis
Epigenetic differences have been identified between biological fluids of forensic interest
and as such, DNA methylation, which is an epigenetic modification, has been explored for
the purpose of biological fluid identification.56 DNA methylation is the addition of methyl
(CH3) to the 5’-‐position of the pyrimidine ring of cytosine in CpG dinucleotides.3,80
Bisulphite sequencing or the use of a methylation-‐sensitive/dependent restriction enzyme
followed by PCR are the predominant methods for detecting methylation. Advantages of
epigenetic analysis include co-‐analysis with the STR amplification and a level of sensitivity
comparable to DNA profiling. However, results may be compromised by low-‐level samples
36
or samples with degraded or excess template, inhibition, or incomplete restriction, as
these factors can distort the methylation ratios.56 DNA methylation based methods could
be a valuable technique for the characterisation of biological fluids, yet for forensic
casework application further validation studies exploring differential methylation patterns
and tissue-‐specific methylated DNA loci are required.3,80
Interpretational challenges are associated with the use of mRNA, miRNA, and DNA
methylation assays. Variations in the environment, physiology, or genetic constitution can
result in altered m(i)RNA or DNA methylation levels. The discriminatory value of markers
may also be nullified or reduced by the presence of multiple sources.72 At present, the
application of these techniques may not be possible for the differentiation of blood and
decomposition fluid stains, however, these assays should be considered when developing
new approaches.
6.7. Proteomics
Protein biomarkers are among the promising approaches for biological stain
identification.53 Proteomic analysis of biological samples involves the identification,
separation, and characterisation of proteins.82 Each biological fluid has a unique protein
signature, which is attributed to the specific proteins within the sample, or to the different
combinations and relative abundance of proteins.83 Multiple studies have aimed to identify
and isolate candidate high-‐specificity protein biomarkers for the reliable identification of
biological fluids.49,53,84,85 Using a comparative MS-‐based whole proteome approach, 29
candidate protein biomarkers were proposed as highly specific indicators for trace
quantities of urine, seminal, vaginal and menstrual fluid, peripheral blood, and saliva.53 In
37
2013, Yang et al.84 attempted to define multiple markers for saliva, semen, and blood using
liquid chromatography matrix-‐assisted laser desorption/ionisation mass spectrometry (LC-‐
MALDI-‐MS). At a greater than, or equal to 95% confidence interval, results identified 59
distinct proteins in blood. Relative to each biological fluid, the alpha (α) and beta (β)
subunits of haemoglobin have been considered to be the most abundant markers for
blood.49,84,85 It has been demonstrated that protein biomarker detection using MS-‐based
technology is reproducible, sensitive, and accurate.49 The identification of reliable protein
biomarkers commonly encountered in evidentiary stains has the potential to assist in the
development of a unified multiplexed approach to forensic biological fluid identification.
However, it is possible candidate biomarkers may be released in non-‐target samples and as
such, additional larger-‐scale studies are required.53
7. Conclusions
The identification of possible blood evidence is a critical component to an investigation in
which the ante-‐mortem events of the decedent are unknown.52 It is important to
determine whether a stain observed next to decomposing remains is blood or
decomposition fluid, as blood may suggest an injury has occurred before or shortly after
death, whereas decomposition fluid is naturally released during the process of
decomposition. However, research pertaining to the explicit differentiation of blood and
decomposition fluid is currently lacking. Decomposition chemistry research has attempted
to elucidate the physical and chemical properties of decomposition fluid. However,
inconsistencies are evident across the literature concerning the compounds present
throughout the various stages of decay and the potential trends exhibited by these
compounds, thus highlighting the chemical complexity of decomposition fluid. This, in
38
conjunction with the literature suggesting that decomposition fluid contains blood
breakdown products,52 poses interpretational challenges for forensic investigators and
complicates the determination of the origin of staining.
Despite their usefulness, current presumptive and confirmatory assays are substantially
impacted by environmental insults, may suffer limitations associated with sensitivity and
specificity, and may only apply to a subset of samples.86 Several approaches have been
investigated with the primary aim of developing more reliable and sensitive techniques for
the identification of biological fluids,53 yet much research remains to be conducted in the
fields of decomposition chemistry and forensic biology. This manuscript evaluated several
methods for their potential use and effectiveness in the differentiation of blood and
decomposition fluid stains. The associated limitations of these techniques suggest that
they are not currently viable options for determining the origin of staining. However,
protein analysis and more specifically microfluidic proteomics by protein electrophoresis,
appear to hold a promising opportunity to move closer to developing a technique that may
identify a potential biosignature that will enable the differentiation of these fluids.
Continued research and a more comprehensive understanding of the basic properties of
these fluids and how they degrade over time, will better enable their differentiation and
application to stain identification. Once a more thorough understanding has been
established, future research should seek to conduct analyses using human samples. This
will assist in ensuring that any differences identified in porcine samples accurately reflect
those that would be observed in human cadavers and in turn forensic investigations.
39
References 1. Virkler K, Lednev I. Analysis of body fluids for forensic purposes: From laboratory testing to non-‐
destructive rapid confirmatory identification at a crime scene. Forensic Sci Int. 2009;188(1-‐
3):1-‐17.
2. James S, Kish P, Sutton T. Principles of bloodstain pattern analysis theory and practice. Boca
Raton: CRC Press; 2005.
3. An J, Shin K, Yang W, Lee H. Body fluid identification in forensics. BMB Reports. 2012;45(1):545-‐
553.
4. Gefrides L, Welch K. Forensic Biology: Serology and DNA. In: Mozayani A, Noziglia C, editors. The
forensic laboratory handbook procedures and practice. 2nd ed. New York: Humana Press;
2011. p. 15-‐50.
5. Byard R, Gehl A, Anders S, Tsokos M. Putrefaction and wound dehiscence -‐ a potentially
confusing postmortem phenomenon. Am J Forensic Med Pathol. 2006;27(1):61-‐63.
6. Byard R, Tsokos M. The challenges presented by decomposition. Forensic Sci Med Pathol.
2013;9(2):135-‐137.
7. Dolinak D, Matshes E, Lew E. Forensic Pathology: Principles and Practices [e-‐book]. Amsterdam:
Elsevier Academic Press; 2005 [cited 2016 Jul 28]. Available from: Google Books.
8. Byard R. Diogenes or Havisham Syndrome and the mortuary. Forensic Sci Med Pathol.
2014;10(1):1-‐2.
9. Swann L, Forbes S, Lewis S. Analytical separations of mammalian decomposition products for
forensic science: A review. Anal Chim Acta. 2010;682(1-‐2):9-‐22.
10. Lee Goff M. Early post-‐mortem changes and stages of decomposition in exposed cadavers. Exp
Appl Acarol. 2009;49(1-‐2):21-‐36.
11. Gill-‐King H. Chemical and ultrastructural aspects of decomposition. In: Haglund W, Sorg M,
editors. Forensic Taphonomy: The postmortem fate of human remains. Boca Raton: CRC
Press; 1997. p. 93.
40
12. Stuart B. Decomposition chemistry: Overview, analysis, and interpretation. In: Siegel J, Saukko
P, editors. Encyclopaedia of Forensic Sciences. 2nd ed. Amsterdam: Elsevier; 2013. p. 11-‐15.
13. Comstock J. Elucidation of the lipid degradation process in soft tissue and fluid during
decomposition, in the presence and absence of insects. PhD [thesis]. Canada: University of
Ontario Institute of Technology; 2014. Available from: ProQuest Dissertations Publishing.