Rural Poverty and Labor Markets in ArgentinaJune 21, 2005 By Dorte Verner 1 World Bank1 I am very grateful to CIET and PROINDER for assistance on data and information on rural Argentina, Robert Schneider, José María Caballero, Estanislao Gacitua-Mario, Elsie Garfield and Jesko Hentschel forinvaluable suggestions and comments, Sergio España and Luis Orlando Perez for discussions and information on education and health, Michael Justesen and Marisa Miodosky for excellent research assistance, and other team members for suggestions. Additionally, I would like to thank participants in the Rural Strategy Workshop held in Buenos Aires in December 2004 for comments on a previous draft of this paper. The findings, interpretations, and conclusions expressed in this paper are entirely those of the author.
Transcript
8/6/2019 Argentina Rural Poverty Labor Market 062105 2
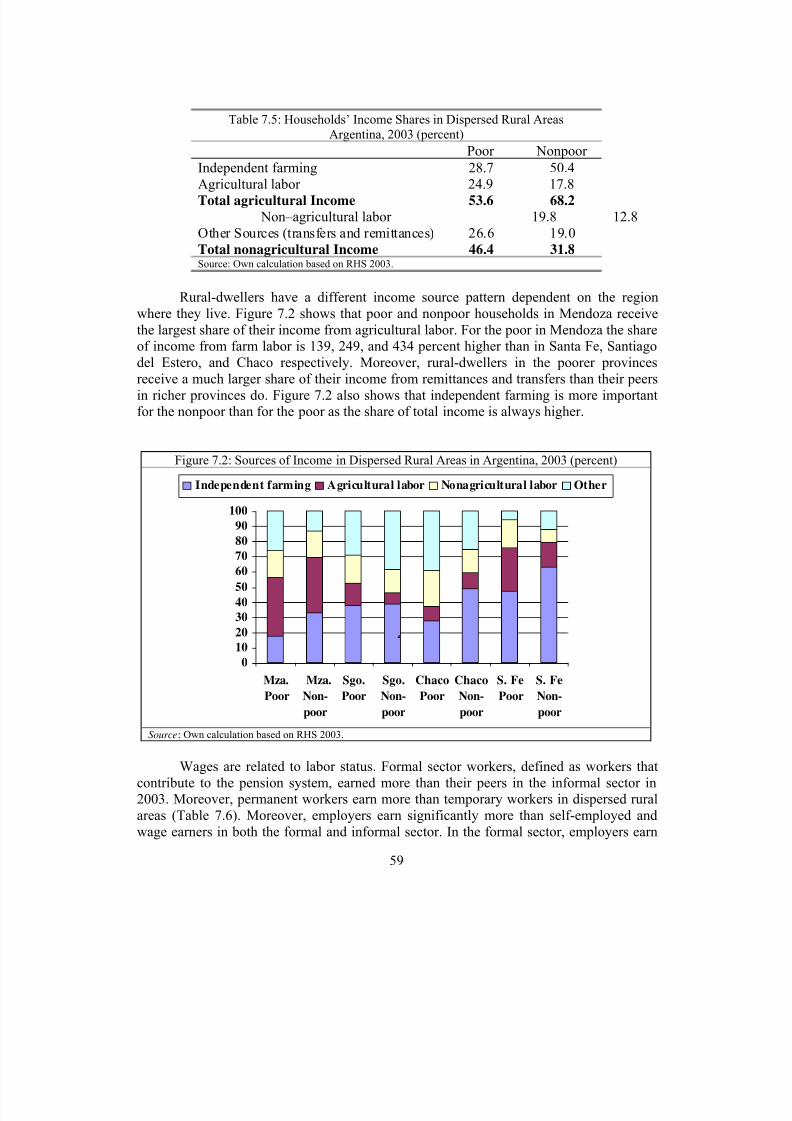
Rural income poverty is widespread and deep and it is especially extensive in the Northeast and Northwest Argentina. By the income measure of extreme poverty nearly 40 percent of rural households are in extreme poverty, compared to just over 30 percent inurban areas.2 The rural extreme poor account around 1.2 million people or around 200,000households.
In the beginning of the twentieth century, the structure of poverty is clear in ruralArgentina: larger households are poorer than smaller households, female headedhouseholds are poorer than male headed households, young households/household headsare poorer than older households/household heads, the poor tend to work more in theinformal sector, and a greater share of those engaged in agriculture are poor. Poverty is,however, by no means strictly an agricultural problem, as Wiens (1998) also noted in hisanalysis of the early and mid 1990s. Furthermore, the deepest poverty is among the poorlyeducated and young household heads with children. Without interventions to improve their opportunities and assets, their plight is likely to worsen. Moreover, labor market analysesreveal that education is key to increase productivity, wages, and incomes for rural
Argentines. Moreover, rural-dwellers that hold land are slightly less likely to seek employment off-farm in low productively jobs ; the labor market pays lower returns to poorer women than richer; the importance of nonagricultural income and employment ishighly correlated with gender, age, household size, and education; agricultural producers’income are monotonically increasing in land size and education level and positivelycorrelated with road access and use of electricity, fertilizer, and irrigation.
Poverty seems feasible and sensible to tackle via government programs. For comparison, the direct cost of eliminating the income gap between the rural poor population’s current income and the extreme poverty line is roughly 0.1 percent of GDP.3 The challenge is not to transfer these resources, however, but to help poor families to build
the assets to permanently escape from poverty. This will require a rural poverty reductionstrategy tailored to the specific characteristics of the rural poor taking into account the rural population’s lack of skills; social capital (networks), and opportunities in addition tocultural and ethnic differences. The strategy needs to include education and cash transfer programs, but it needs to go much further. The case of the rural poor in Chile is a goodexample of how despite an aggressive development of the agricultural sector, investment ineducation, targeted social protection programs and incentives for exiting rural areas, therestill remains a significant segment of rural poor that has been unable to benefit from thegrowth in the sector and public programs for facilitating their transition out of agricultureand rural areas.
2 These poverty rate comparisons refer to income poverty because consumption poverty estimates are notavailable for urban areas (see Section 3 for definition). Consumption poverty measures give a better pictureof the true status of household poverty in rural areas and therefore consumption poverty rates is used in therest of the paper unless stated differently.
3 The numbers are based on consumption poverty calculated in Section 4 and expanded to Argentina as awhole. The main idea is to calculate the cost of lifting all rural-dwellers above the indigence poverty line.The cost of administration and other related costs would have to be added to achieve the total cost.
8/6/2019 Argentina Rural Poverty Labor Market 062105 2
This paper suggests that government programs to alleviate rural poverty needs acomprehensive strategy that include different types of components such as employmentgeneration and safety nets related to secondary and tertiary education and elements toincrease the indigents’ broader asset base. Moreover, improving the rural-dwellers’connections with towns is key for speeding up rural and semi-rural area relations. This
paper follow official Argentine statistical classification methods; rural areas aredisaggregated into two categories: i) grouped rural areas with under 2,000 inhabitants andii) dispersed rural areas or open countryside.
The paper is organized as follows. Section 2 addresses demographic changes andsection 3 presents data and methodologies applied in the following sections. Section 4addresses poverty, income inequality and unmet basis needs (UBN) and section 5 presentsa poverty profile. Section 6 addresses access to selected services and assets. Section 7 presents analyses of the rural labor force and addresses correlates of nonfarm employment,the likelihood of being employed in the high/low productivity sectors, and the compositionof rural income generation. Finally, section 8 concludes and gives policy
recommendations.
2. Population
Demographic factors have direct and indirect impacts on prices and poverty. As thesize and age composition of the population changes, the relative size of the labor force andthe number of dependents also change. This modifies the dependency ratio of families andtherefore their level of poverty. This is the direct effect of demographic changes. Itcaptures the effect that demographic changes have on quantities: number of children, sizeof the labor force, and the number of elderly people. These changes in quantities, however,will in general influence prices in the economy. In particular, changes in the rate of growthof the population and in the age structure may have important impacts on labor supplies,savings, household production decisions, and migration. As a consequence, demographicchanges may have considerable impact on the level of wages and on interest rates. Sincethese prices are important determinants of family income, they are bound to have a profound influence on the level of poverty. These are the indirect impacts of demographicchanges on poverty, which occur through the effects of demographic changes on savings,wages, production decisions, and interest rates.
Changing demographics can also have important impacts on the demand for publicsector investments and public services, incentives for private sector investments, political power, and on labor markets. As a result, it is important to look at recent changes in
demographic patterns in rural Argentina. The following overview describes demographicchanges between rural and urban areas that have taken place from 1960 to 2001 andsection 7 addresses rural labor markets.
8/6/2019 Argentina Rural Poverty Labor Market 062105 2
Argentina is in the middle of a baby bust. After expanding at 16.4 percent between1980 and 1991, Argentina’s population increased by 11.2 percent or 3.6 million people
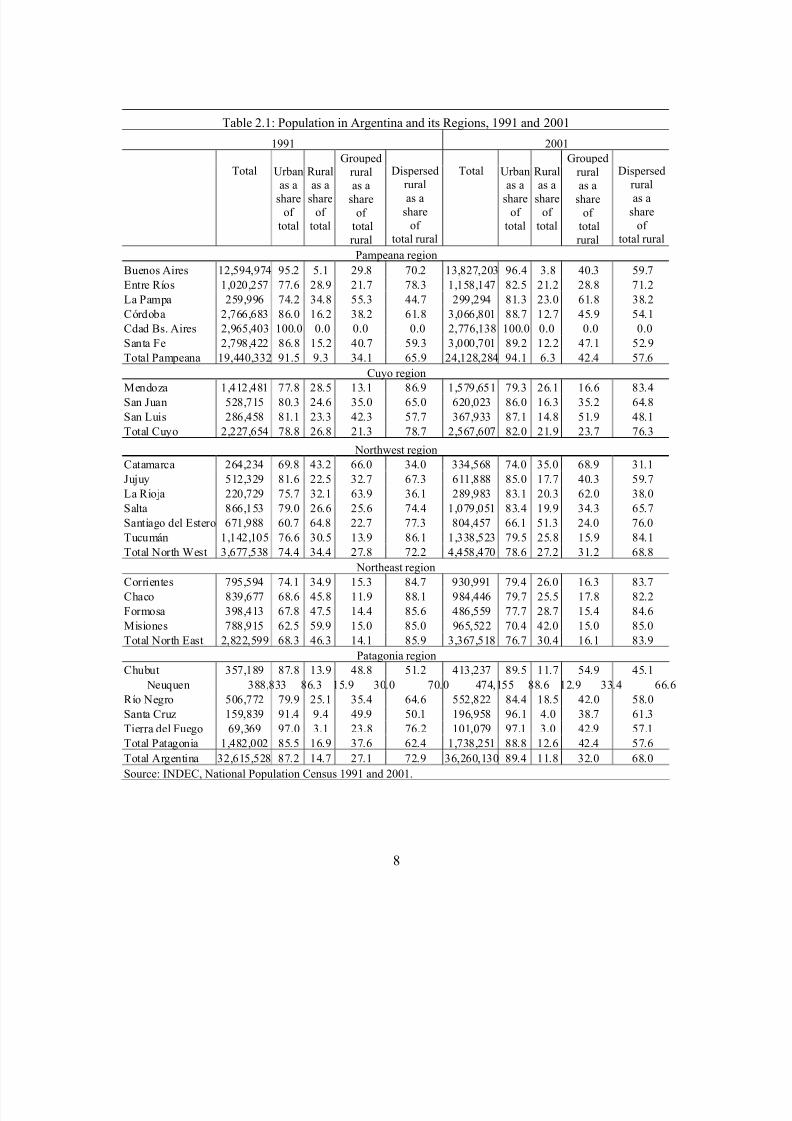
during 1991-2001 and reached 35.9 million in 2001 (Table 2.1).4 The main explanation isthe sharp drop in the birth rate and some emigration.
During 1960-2001 Argentina has become highly urbanized as the largest population growth has taken place in urban areas. Data reveal that the poorest regionsexperienced a higher population growth rate than average of Argentina as a whole during1991-2001. The Northwest and Northeast regions reached a population growth rate of 21and 19 percent, respectively. This compares to the Cuyo region where the population onlyexpanded by 15 percent and the city of Buenos Aires that lost 6 percent of its populationduring 1991-2001.
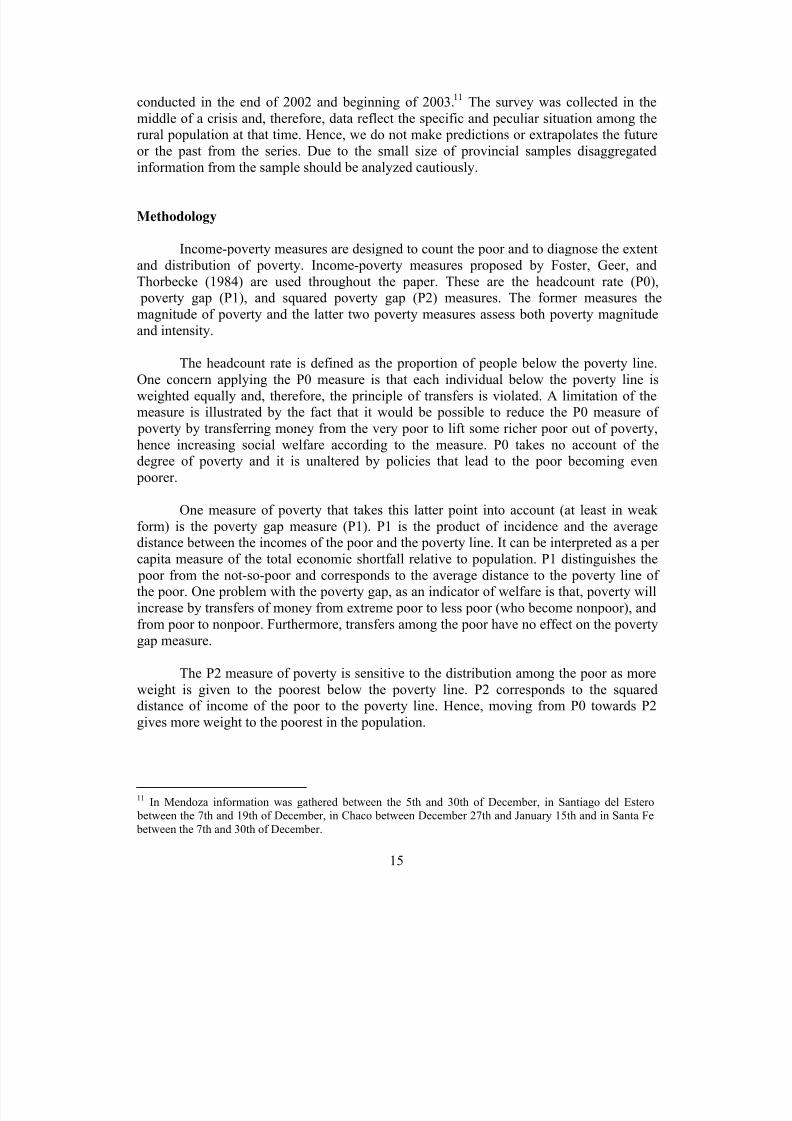
Figure 2.1: Trend in Rural and Urban Population Share in Argentina,Selected years during 1960-2001
Source: INDEC.
Sixty-seven percent of the Argentine population lives in the Pampeana region,mainly in the province of Buenos Aires. The highest population density is in themetropolitan areas of Buenos Aires where 45.8 percent of Argentines live. Of the fiveregions the Pampeana region has the largest population share (34.9 percent). The other four
regions each have a much lower population share: Northeast (12 percent), Northwest (9 percent), Cuyo (7 percent), and Patagonia (5 percent).
4 The most recent Population Census was undertaken in 2001.
0
5
10
15
20
25
30
35
1960 1970 1980 1990 2001
P
o p u l a t i o n ( m i l l i o n s )
0
5
10
15
20
25
30
R u r a l
p o p u l a t i o n s h a r e ( % )
Urban pop ulation
Rural pop ulation
Share rural pop ulation of total
8/6/2019 Argentina Rural Poverty Labor Market 062105 2
The rural population, defined for census purposes as people living in communitieswith population under 2,000 or in the open countryside, represented 11 percent of total population in 2001; down from 13 percent in 1991 and 28 percent in 1960. Hence,currently rural Argentina is home to around 3.9 million rural-dwellers, although the population was reduced by 8.4 percent during 1991-2001 (Figure 2.1 and Table 2.1).
Moreover, demographic developments in rural areas have been little homogeneous in thelast decade. The rural Northeast region experienced a population net out-migration (12.1 percent) while the rural Northwest experienced population growth and some in-migration(1.4 percent). Some provinces, such as Mendoza, Catamarca, and Tierra del Fuegoexperienced positive rural population growth rates of 4.5, 8.9, and 43.7 percent,respectively. This compares to Chaco and Santa Cruz that experienced negative rural population growth rates of 24.3 and 44.8 percent, respectively.
Data presented in Table 2.1 show dispersed rural areas lost 14.5 percent of its population over the last decade reaching 2.6 million in 2001, compared to grouped ruralareas that experienced an 8 percent increase and reached 1.2 million. Large demographic
changes are taking place in and across regions.
8/6/2019 Argentina Rural Poverty Labor Market 062105 2
In 2001, dispersed rural areas had 68 percent of rural population. Around 400,000 people left dispersed rural areas during 1991-2001. Roughly speaking, some 25 percentmay have moved to grouped rural areas and the rest may have moved to urban areas. 5 ThePampeana region experienced a fall of 24.6 percent and the Cuyo region of 5.1 percent inthe dispersed rural population. In the latter region, Mendoza province is an outlier as it
experienced a population increase of 0.3 percent in dispersed rural areas and 32.2 percentin grouped rural areas.
What is driving the heterogeneous population growth pattern rural Argentina isexperiencing? There are various reasons for the demographically changing pattern in ruralArgentina and many relates to economic opportunities, and lack of access to serviceschange in crop structures. For example, it is clear that living conditions in rural Chaco areinferior to rural Mendoza. In Mendoza, in the Cuyo region, a large part of the agriculturaland nonfarm sector is highly labor intensive and expanding, while in Chaco, in the Northeast region, capital intensive agriculture is moving into the south of the province andnorthern parts of the province experience recurrent droughts and floods that push
population out of rural areas. In the Pampeana region, jobs are becoming scarce in theagricultural sector. The change in production technology towards more capital intensivemethods, for example in the soybean sector, may explain a significant part of the largereduction in the rural population in the Pampeana region (see Box 1).
The share of children in total population is falling. In 1991, in urban and ruralareas, children aged 14 and under accounted for 30 and 36 percent and people aged 65 andover accounted for 9 and 7 percent, respectively. In 2001, the share of children aged 14 andunder was down to 28 percent, which is lower than other middle-income countries in LatinAmerica. At the same time, the number of elderly dependents has not caught up with thereduction in children’s share in the population. In 2001, 10 and 8 percent of the population
was 65 or older in urban and rural areas respectively (Table 2.2). These trends are likely tocontinue. This will have a significant effect on the country’s efforts to reduce poverty. For the next few decades, the ratio of children to working age population will decline, whilethe number of retirees will remain relatively small. As a result, not only will dependencyratios fall, but also the amount the state must spend on expanding the quantity of socialservices will decline. This will free up resources to spend on improving the quality of these services and other poverty reduction efforts.
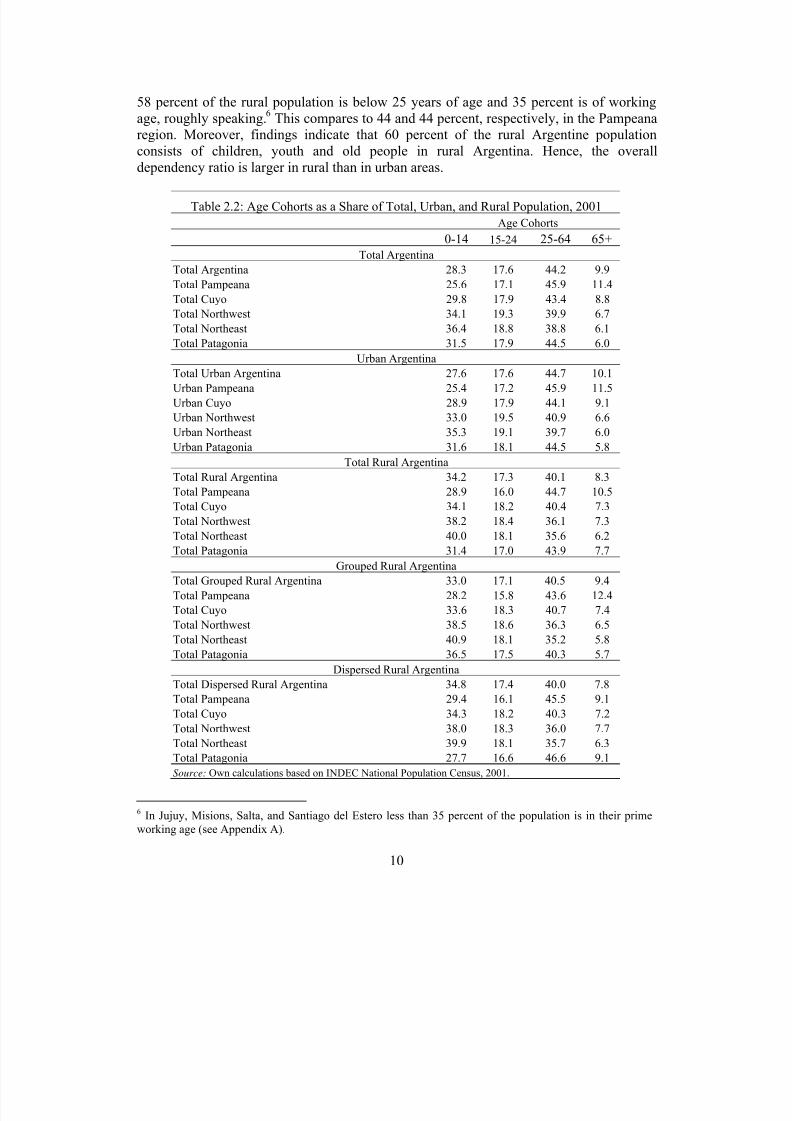
Table 2.2 shows that there are regional and rural-urban differences in the aging pattern. In Northwest and Northeast regions more than 34 and 36 percent, respectively, of the population are under age 15, compared to 28 percent of total population. This compares
to 26 percent in the Pampeana region. Moreover, there is a higher population share of working age in the latter region and therefore the Pampeana region is able to better feed theregion’s children compared to northern regions. This demographic pattern is even morewidespread when comparing regional rural to urban areas in the regions. In the Northeast,
5 This analysis is not taking into account demographical changes that may account for part of the changesreferred to.
8/6/2019 Argentina Rural Poverty Labor Market 062105 2
58 percent of the rural population is below 25 years of age and 35 percent is of workingage, roughly speaking.
6This compares to 44 and 44 percent, respectively, in the Pampeana
region. Moreover, findings indicate that 60 percent of the rural Argentine populationconsists of children, youth and old people in rural Argentina. Hence, the overalldependency ratio is larger in rural than in urban areas.
Table 2.2: Age Cohorts as a Share of Total, Urban, and Rural Population, 2001
Age Cohorts
0-14 15-24 25-64 65+
Total Argentina
Total Argentina 28.3 17.6 44.2 9.9
Total Pampeana 25.6 17.1 45.9 11.4
Total Cuyo 29.8 17.9 43.4 8.8
Total Northwest 34.1 19.3 39.9 6.7
Total Northeast 36.4 18.8 38.8 6.1
Total Patagonia 31.5 17.9 44.5 6.0
Urban ArgentinaTotal Urban Argentina 27.6 17.6 44.7 10.1
Table 2.3: Poor and Nonpoor Household Size and Average Members below Age 15
Selected Provinces in Dispersed Rural Areas of Argentina, 2003 Average Household Size Average # of Household Members <15
POOR
Mendoza Santiago delEstero Chaco SantaFe Total Mendoza Santiago delEstero Chaco SantaFe Total
5.8(2.1)
6.5 (2.4)
5.7(2.2)
5.5(2.0)
5.8(2.3)
1.8(1.7)
2.3(1.8)
2.0(1.7)
2.0(1.6)
2.1(1.7)
NONPOOR
3.6(1.4)
3.1(2.1)
3.4(1.9)
3.9(1.7)
3.6(1.8)
1.1(1.2)
.84(1.3)
1.0(1.6)
1.1(1.3)
1.1(1.4)
TOTAL SAMPLE
4.6(2.0)
5.4(2.8)
4.4(2.3)
4.2(1.9)
4.6(2.3)
1.6(1.5)
1.9(1.7)
1.4(1.7)
1.3(1.4)
1.5(1.6)
Note: Standard deviations in parenthesis.Source: Own calculation based on RHS 2003.
Demographic trends have lowered the dependency ratio, and may lead to areduction in headcount poverty. This trend is likely to deepen further in the future asArgentina’s poorer regions, such as the Northeast and Northwest experience lower fertilityrates. Unfortunately, urban-rural disaggregated fertility data are not available in Argentina.
The typical poor person lives in a larger household with more children than thenonpoor. In Argentina, poor households in dispersed rural areas have on average 5.8individuals in 2003 (Table 2.3). Poor households have 2.2 individuals more than nonpoor households. Moreover, the average number of household members below age 15 is also
higher in poor households than in nonpoor. Poor households have on average 2.1 children below 15 years of age, nearly the double of those of the nonpoor. The dependency ratio isalso much higher in poor households (Table 2.4). Each worker in a poor householdsupports 2.9 family members, compared to the nonpoor worker that supports 1.9 familymembers.
Table 2.4: Dependency Ratio in Dispersed Rural Areas in Argentina, 2003
# of household members with a job 1.7 1.1 2.0 1.3 1.5 0.8
# of household members without a job 3.1 2.2 3.9 2.2 2.3 1.7 Note: Dependency rate is defined as the total number of household members without a job relative to the total number of household members with a job.
Source: Own calculation based on RHS 2003.
8/6/2019 Argentina Rural Poverty Labor Market 062105 2
Fecundity--measured as the number of children per mother--dropped from 2.8 in1991 to 2.4 in 2001 (University of La Plata 2004). Women’s increased participation in thelabor market is an important factor contributing to the reduction in the fertility rate, whichalso produced a sharp drop in the dependency rate. However, fecundity is nothomogeneous across Argentina’s provinces. The poorer provinces have a higher fertility
rate than richer provinces; for example, Santiago del Estero, Misions, and Formosa have afertility rate above 3.2. Total desired fertility rate in poor provinces are lower than theactual fertility rate according to the author’s field visits in Chaco and Santiago del Estero.Similar findings are presented in Gacitua et al (2001) for Salta and Misiones provinces.This would indicate that there is still a substantial unmet demand for high quality andreliable family planning services, information, and resources.
Table 2.5: Average Number of Children of Household HeadsBy Education Attainment in Dispersed Rural Areas in Argentina, 2003
Note: Standard deviations in parenthesis. Children are defined as people below age 18.Source: Own calculation based on RHS 2003.
Another important development is the decline in the fertility differential betweenmore educated and less educated household heads. Survey data from four provinces(Chaco, Santa Fe, Santiago del Estero, and Mendoza, see Section 3 for more informationon the survey) show that parents with no or incomplete primary education have 1.8children while those with complete tertiary education have 1.1 children (Table 2.5). Hence,education plays a key role both directly via increased income and wages (see Sections 5and 6) and indirectly via the reduced fertility rate in poverty reduction.
8/6/2019 Argentina Rural Poverty Labor Market 062105 2
Box 1: The Growth of Soybeans Production a Blessing and for Some a Curse
Steady growth in soybeans production to service expanding export markets is putting
greater pressure on fragile ecosystems and their inhabitants in Argentina as elsewhere in SouthAmerica (specifically Brazil). Argentina is the world's third largest soybeans producer, accountingfor 17 percent of global output (after the U.S. and Brazil with 35 and 27 percent respectively) andalso the third largest exporter with 28 percent of the market. At least 98 percent of Argentina’ssoybeans production is genetically modified (GM) and exports are directed primarily to thegrowing Asian market.
While soybeans cultivation delivers economic benefits, there is increasing evidence thatexpansion of this crop is having negative social impacts. Social impacts include loss of livelihoodsecurity (especially for local populations dependent on natural forest and aquatic resources) andlimited employment opportunities.7
Soybeans were introduced in the 1980s and now occupy over 14 million hectares, morethan all other crops combined. Soybeans were until recently concentrated in Buenos Aires,Cordoba and Santa Fe provinces, employing mechanized GM technology and replacing other crops. Initial impacts of the conversion of the Pampas to arable farming took the form of soilerosion and degradation, causing river and flooding. Since the late 1990s, some 10 percent of production has spread to Entre Ríos, Chaco, Santiago del Estero, Salta and Tucumán provinces, atthe expense of Chacos’ bush savannahs and the Yungas subtropical forests. In Chaco, 2.4 millionhectares have been cleared to make way for soybeans. Soil erosion, sedimentation and increasedrisk of flooding have accompanied soybeans expansion. Deforestation caused by soybeansexpansion will compromise this stock of natural capital including a forest loss rate of 10,000hectares a year. Moreover, soybeans have overtaken sugar and tobacco, two key crops of smallfarmers, and plantation forest as the main driver of deforestation.
The loss of land and livelihood experienced by small farmers squeezed out through landspeculation and concentration is not easily quantified. A further consideration is that large scalemechanized soybeans farming predominates in Argentina, generating only one job per 200hectares, compared with one job per eight hectares for typical smallholder operations. This inducesa process of rural out-migration and a destabilization of livelihoods, which have much wider impacts, including loss of food security and urban overpopulation (see also Section 6).
Source: Oxford Analytica; http://www.oxweb.com
7 In addition to the social consequences of soybean production exist also ecological consequences includingdeforestation, soil erosion, river sedimentation and pollution by agro-toxics as well as loss of natural habitatsand biodiversity.
8/6/2019 Argentina Rural Poverty Labor Market 062105 2
This section presents data sources and methodologies used in this paper to analyze poverty and labor markets in rural Argentina.
Data
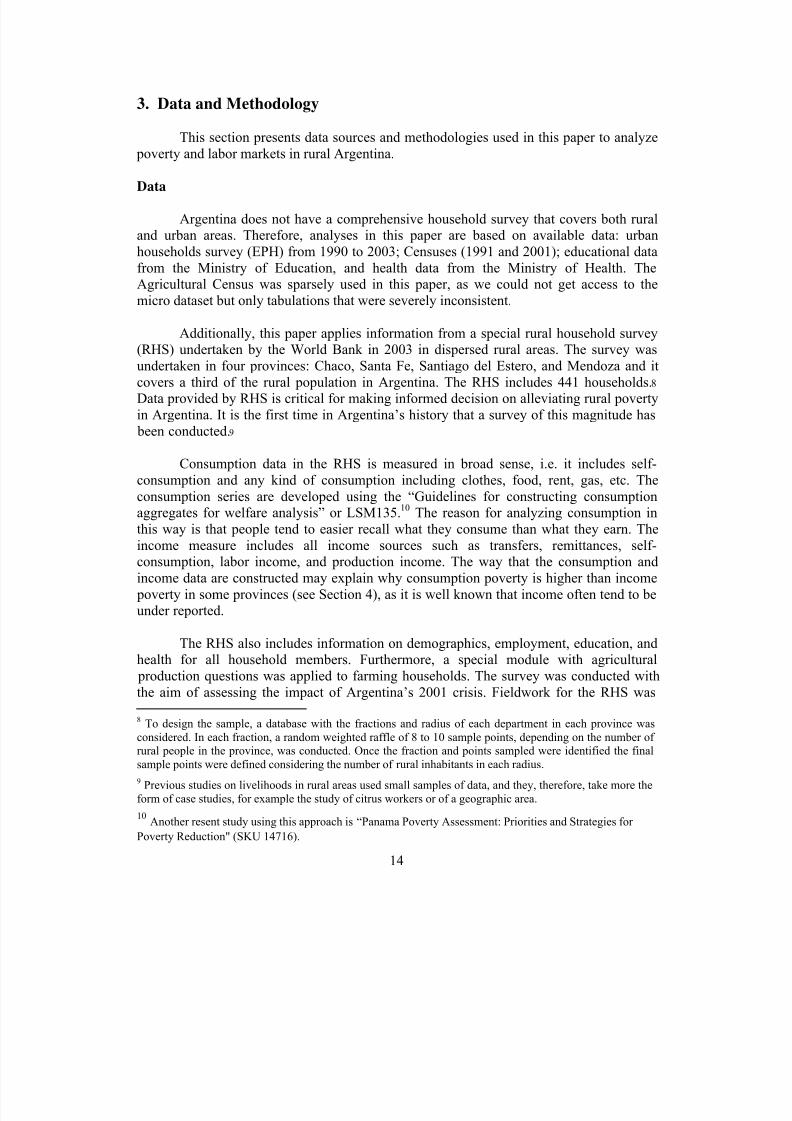
Argentina does not have a comprehensive household survey that covers both ruraland urban areas. Therefore, analyses in this paper are based on available data: urbanhouseholds survey (EPH) from 1990 to 2003; Censuses (1991 and 2001); educational datafrom the Ministry of Education, and health data from the Ministry of Health. TheAgricultural Census was sparsely used in this paper, as we could not get access to themicro dataset but only tabulations that were severely inconsistent.
Additionally, this paper applies information from a special rural household survey(RHS) undertaken by the World Bank in 2003 in dispersed rural areas. The survey was
undertaken in four provinces: Chaco, Santa Fe, Santiago del Estero, and Mendoza and itcovers a third of the rural population in Argentina. The RHS includes 441 households.8
Data provided by RHS is critical for making informed decision on alleviating rural povertyin Argentina. It is the first time in Argentina’s history that a survey of this magnitude has been conducted.9
Consumption data in the RHS is measured in broad sense, i.e. it includes self-consumption and any kind of consumption including clothes, food, rent, gas, etc. Theconsumption series are developed using the “Guidelines for constructing consumptionaggregates for welfare analysis” or LSM135.10 The reason for analyzing consumption inthis way is that people tend to easier recall what they consume than what they earn. The
income measure includes all income sources such as transfers, remittances, self-consumption, labor income, and production income. The way that the consumption andincome data are constructed may explain why consumption poverty is higher than income poverty in some provinces (see Section 4), as it is well known that income often tend to beunder reported.
The RHS also includes information on demographics, employment, education, andhealth for all household members. Furthermore, a special module with agricultural production questions was applied to farming households. The survey was conducted withthe aim of assessing the impact of Argentina’s 2001 crisis. Fieldwork for the RHS was
8 To design the sample, a database with the fractions and radius of each department in each province wasconsidered. In each fraction, a random weighted raffle of 8 to 10 sample points, depending on the number of rural people in the province, was conducted. Once the fraction and points sampled were identified the finalsample points were defined considering the number of rural inhabitants in each radius.
9 Previous studies on livelihoods in rural areas used small samples of data, and they, therefore, take more theform of case studies, for example the study of citrus workers or of a geographic area.
10 Another resent study using this approach is “Panama Poverty Assessment: Priorities and Strategies for
Poverty Reduction" (SKU 14716).
8/6/2019 Argentina Rural Poverty Labor Market 062105 2
conducted in the end of 2002 and beginning of 2003.11 The survey was collected in themiddle of a crisis and, therefore, data reflect the specific and peculiar situation among therural population at that time. Hence, we do not make predictions or extrapolates the futureor the past from the series. Due to the small size of provincial samples disaggregatedinformation from the sample should be analyzed cautiously.
Methodology
Income-poverty measures are designed to count the poor and to diagnose the extentand distribution of poverty. Income-poverty measures proposed by Foster, Geer, andThorbecke (1984) are used throughout the paper. These are the headcount rate (P0), poverty gap (P1), and squared poverty gap (P2) measures. The former measures themagnitude of poverty and the latter two poverty measures assess both poverty magnitudeand intensity.
The headcount rate is defined as the proportion of people below the poverty line.One concern applying the P0 measure is that each individual below the poverty line isweighted equally and, therefore, the principle of transfers is violated. A limitation of themeasure is illustrated by the fact that it would be possible to reduce the P0 measure of poverty by transferring money from the very poor to lift some richer poor out of poverty,hence increasing social welfare according to the measure. P0 takes no account of thedegree of poverty and it is unaltered by policies that lead to the poor becoming even poorer.
One measure of poverty that takes this latter point into account (at least in weak form) is the poverty gap measure (P1). P1 is the product of incidence and the average
distance between the incomes of the poor and the poverty line. It can be interpreted as a per capita measure of the total economic shortfall relative to population. P1 distinguishes the poor from the not-so-poor and corresponds to the average distance to the poverty line of the poor. One problem with the poverty gap, as an indicator of welfare is that, poverty willincrease by transfers of money from extreme poor to less poor (who become nonpoor), andfrom poor to nonpoor. Furthermore, transfers among the poor have no effect on the povertygap measure.
The P2 measure of poverty is sensitive to the distribution among the poor as moreweight is given to the poorest below the poverty line. P2 corresponds to the squareddistance of income of the poor to the poverty line. Hence, moving from P0 towards P2
gives more weight to the poorest in the population.
11 In Mendoza information was gathered between the 5th and 30th of December, in Santiago del Estero between the 7th and 19th of December, in Chaco between December 27th and January 15th and in Santa Fe between the 7th and 30th of December.
8/6/2019 Argentina Rural Poverty Labor Market 062105 2
This paper sets its poverty bar very low. To define “extreme poverty” it uses theindigence, or “food only” poverty line; those with sufficient income to buy a basic food basket are above the line. The poverty line is based on the monetary value of food itemsonly. This measure is based on the cost of a “minimum food-basket” equal to a minimumcaloric intake of 2,700 kcal daily per household member.
The poverty lines used for the rural household survey were constructed based onthe consumption patterns of households located in the three lowest deciles of theconsumption distribution. The observed consumption patterns were translated to a basicfood basket (BFB) that fulfills the caloric requirement for an adult equivalent. Moreover,the basic food basket was expanded with nonfood services, considering the serviceconsumption patterns of the total population. In this way, a total basic basket (TBB) wasconstructed. To place a value on the TBB, the weight of the food component in the TBBfor the total population (Engel coefficient) was calculated. Finally, the BFB was multiplied by the inverse of the Engel coefficient. Thus, the poverty line was set at AR$118.61(approx. US$40) and the indigence line or the extreme poverty line at AR$69.65 (approx.
US$21) per adult equivalent (Gerardi 2003).
The analysis of labor market activity is based on a multivariate analysis using probit regression techniques simultaneously for all provinces. Analyses of producer andlabor incomes are based on nonlinear ordinary least square (OLS) and quantile regression(QL) techniques.
Quantile Regressions
Economic model
The underlying economic model used in the analysis will simply follow Mincer’s(1974) human capital earnings function extended to control for a number of other variablesthat relate to location. In particular, we apply a semi-logarithmic framework that has theform:
ln yi = φ(xi, zi) + ui (1)
where ln yi is the log of earnings or wages for an individual, i; xi is a measure of a number of personal characteristics including human capital variables, etc.; and zi representslocation specific variables. The functional form is left unspecified in equation (1). Theempirical work makes extensive use of dummy variables in order to catch nonlinearities inreturns to years of schooling, tenure, and other quantitative variables. The last component,ui, is a random disturbance term that captures unobserved characteristics.
Quantile regressions
Labor market studies usually make use of conditional mean regression estimators,such as OLS. This technique is subject to criticism because of several, usually, heroic
8/6/2019 Argentina Rural Poverty Labor Market 062105 2
assumptions underlying the approach. One is the assumption of homoskedasticity in thedistribution of error terms. If the sample is not completely homogenous, this approach, byforcing the parameters to be the same across the entire distribution of individuals may betoo restrictive and may hide important information.
The method applied in this paper is quantile regression. The idea is that one canchoose any quantile and thus obtain many different parameter estimates on the samevariable. In this manner, the entire conditional distribution can be explored. By testing,whether coefficients for a given variable across different quantiles are significantlydifferent, one implicitly also tests for conditional heteroskedasticity across the wagedistribution. This is particularly interesting for developing countries such as Argentinawhere wage disparities are huge and returns to, for example, human capital may varyacross the distribution.
The method has many other virtues apart from being robust to heteroskedasticity.When the error term is nonnormal, for instance, quantile regression estimators may be
more efficient than least square estimators. Furthermore, since the quantile regressionobjective function is a weighted sum of absolute deviations, one obtains a robust measureof location in the distribution and, as a consequence the estimated coefficient vector is notsensitive to outlier observations on the dependent variable.
12
The main advantage of quantile regressions is the semi-parametric nature of theapproach, which relaxes restrictions on parameters to be fixed across the entiredistribution. Intuitively, quantile regression estimates convey information on wagedifferentials arising from nonobservable characteristics among individuals otherwiseobservationally equivalent. In other words, by using quantile regressions, we candetermine if individuals that rank in different positions in the conditional distribution (i.e.,
individuals that have higher or lower wages than predicted by observable characteristics)receive different premiums to education, tenure, or to other relevant observable variables.
Formally, the method, first developed by Koenker and Basset (1978), can beformulated as13
yi = xi′βθ + uθi = Quantθ(yi | xi) = xi′βθ (2)
12 That is, if 0ˆ >′− θ β ii x y then yi can be increasing towards + ∞, or if 0ˆ <′− θ
β ii x y , yi can be
decreasing towards -∞, without altering the solutionθ β ̂ . In other words, it is not the magnitude of the
dependent variable that matters but on which side of the estimated hyperplane the observation is. This is most
easily seen by considering the first-order-condition, which can be shown to be given as (see Buchinsky 1998)
∑=
=′−+−n
i
iiin x x y
121
211 .0))ˆsgn(( θ β θ
This can be seen both as a strength and weakness of the method. To the extent that a given outlier representsa feature of “the true” distribution of the population, one would prefer the estimator to be sensitive, at least toa certain degree, to such an outlier.
13 See Buchinsky (1998).
8/6/2019 Argentina Rural Poverty Labor Market 062105 2
where Quantθ(yi | xi) denotes the θth conditional quantile of y given x, and i denotes an
index over all individuals, i = 1,…,n.
In general, the θth
sample quantile (0 < θ < 1) of y solves
⎭⎬⎫
⎩⎨⎧ ′−−+′−= ∑∑
′<′≥ β β β
β θ β θ iiii x yi
ii
x yi
ii x y x yn ::
||)1(||1min
(3)
Buchinsky (1998) examines various estimators for the asymptotic covariancematrix and concludes that the design matrix bootstrap performs the best. In this paper, thestandard errors are obtained by bootstrapping using 200 repetitions. This is in line with theliterature.
4. Poverty, Income Inequality, and Unmet Basic Needs
Social programs are needed to ensure that the poor can take advantage of jobopportunities and to protect some vulnerable groups that are not able to participate fully inthe economy. In order to design these programs, information on the poor is needed. Thissection addresses headcount income poverty and its depth, other poverty indicators,income inequality, and UBN but does not attempt a more comprehensive quantitative andqualitative analysis of other forms of deprivation or social exclusion. Due to lack of dataand information, this section does not address the broader issues of inequality of assets andopportunities. Assets inequalities are addressed in section 6.
In rural and urban Argentina, extreme monetary poverty has increased rapidly in
the last decade and currently affects around 10.8 million Argentines. This means thataround 28.7 percent of the Argentine population did not have sufficient income to buy aminimum basket of food in 2003. Around 15 percent of the extreme poor people inArgentina live in rural dispersed areas. The following paragraphs present generalinformation and analyses of rural and urban poverty that is behind findings presented inthis paragraph.
The Argentine income poverty trend has been fairly volatile during 1990-2003.During 1990-94, GDP expanded rapidly (25 percent during the period) and povertydeclined in Argentina. When the Mexican crises hit in 1994 and unemployment reachedmore than 18 percent of the active population, the declining trend experienced in the
previous years reversed. The headcount poverty rate started climbing in tandem with theincrease in the number of informal sector jobs and unemployment. The economic crisiswas further aggravated in 1999-2001 and ended in a devaluation of the currency and hence poverty continued climbing in the end of the 1990s and early 2000. The sharp rise in poverty after the 2001 crisis has in great part been due to the rise in prices of foods (their prices rose with the devaluation), a major portion of expenditures of the poor (World Bank 2003). Moreover, inflation reduced real wages substantially as the break with theConvertibility Plan meant that labor market adjustment occurred more through wages,
8/6/2019 Argentina Rural Poverty Labor Market 062105 2
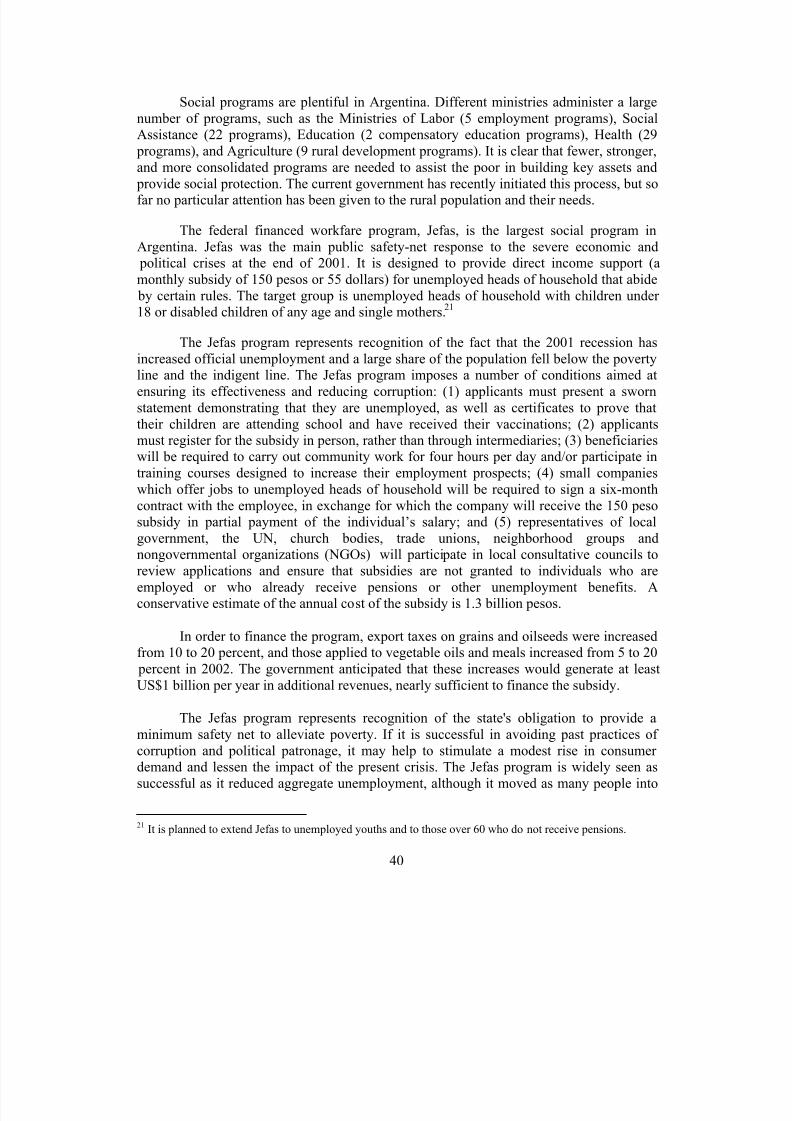
rather than through increased unemployment. Unemployment arose largely from theformal sector, with an increase in employment in the informal sector and particularly inlow paid temporary jobs. In late 2001, the government introduced the safety-net programPlan Jefas y Jefes de Hogar Desocupado (Jefas) leading to a slight reduction in extremeurban income poverty in Argentina (Galasso and Ravallion 2004). Finally, in 2003, the
economy started picking up, new employment began to be created, and prices stabilized.
In terms of location, poverty is distributed roughly along two dimensions inArgentina; (1) within provinces along a population density gradient running from dispersedrural to urban, and (2) across regions. Argentina has fairly steep declining gradients inconditions of living from more developed urban areas, through the urban periphery andsmaller towns (grouped rural areas), through to the more remote rural areas. This povertylocation pattern is similar to other countries in Latin America, for example Mexico. In rurallocalities in Mexico with less than 2,500 people, more than 40 percent were extremely poor compared with those localities with 2,500-15,000 people where 21 percent were poor in 2002 (Verner 2005).
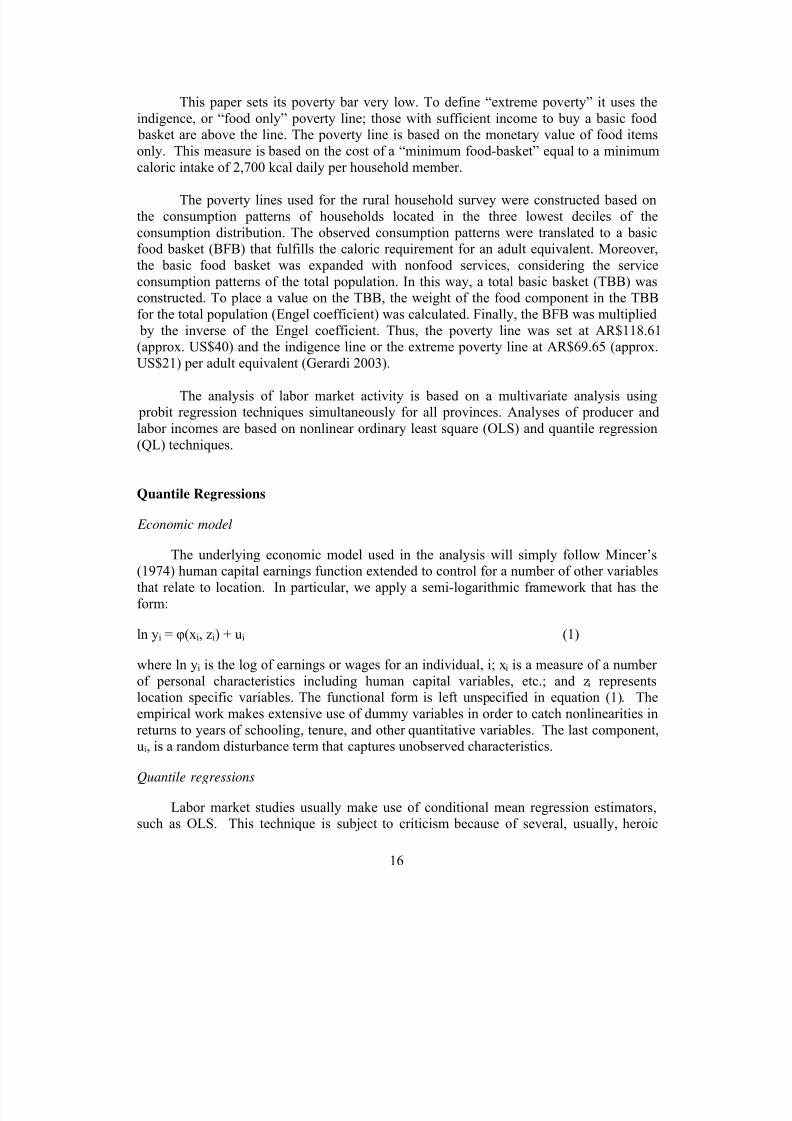
Figure 4.1: Poverty and Indigence Poverty in Urban Areas in Argentina (P0)1990-2003 (percent)
Source: Adapted from PRODERNOA (2003), based on INDEC data.
In the last decade, urban poverty in Argentina has increased dramatically. During1992-2003, the indigence poverty, measured by P0, increased by 23.8 percentage points in
0
10
20
30
40
50
60
1 9 9 0
1 9 9 3
1 9 9 5
1 9 9 8
1 9 9 9
2 0 0 0
2 0 0 1
2 0 0 2
2 0 0 3
Households below poverty line Households below indigence line
Population below poverty line Population below indigence line
8/6/2019 Argentina Rural Poverty Labor Market 062105 2
urban areas.14 The largest increase occurred after the 2001 crises. Indigent poverty in urbanareas is still very high at 28.0 percent. This translates to over 9.1 million people in urbanareas who live in extreme poverty, which means that they do not have sufficient income to buy a minimum basket of food. This is almost seven times higher than the poverty rate of 4.2 percent in 1992 (see also Figure 4.1).
In Argentina, the rural population is more affected by poverty than the urban population. Since the 1980s, the rural poverty incidence is higher than the urban povertyincidence (Murmis 1996). In 2003, extreme poverty, measured by consumption, affected30.9 percent of the rural-dwellers in dispersed rural areas in Chaco, Santa Fe, Santiago delEstero, and Mendoza (Table 4.1). Applying the extreme poverty rates for these provincesto their respective regional populations yields a total of some 800,000 extreme poor livingin dispersed rural areas.15 Assuming as an upper bound (in the absence of reliableinformation on poverty in grouped areas) that extreme poverty is the same in grouped areasyields 1.2 million people live in extreme poverty in rural Argentina. It is clear thatassuming poverty rates are similar in dispersed and grouped rural areas overestimates
poverty in grouped rural areas as we expect P0 in grouped areas to be lower than indispersed rural areas. Furthermore, this in line with other social indicators in Argentinashows that people in grouped areas are better off or less poor than people in dispersed ruralareas. Additionally, studies from other countries such as Mexico show that poverty ratesare higher in dispersed areas as compared to grouped rural or urban areas. Therefore inreality the share of the extreme poor rural-dwellers accounts for less than 1.2 million or 15 percent of Argentina’s extreme poor population. Hence, with good policies rural extreme poverty should be fairly easy to alleviate, in the short-run by introducing good safety-netsand having high quality service available for these people so they can build assets andskills and therefore escape poverty all together in the medium to long-run.
Geographic factors are important when analyzing poverty in Argentina. Living in a poor area can make a profound difference to well-being and life prospects. There are largedifferences in consumption poverty between different regions, with a not-so-straightgradient from south to north. In 2003, the headcount indigence rate in rural areas in SantaFe in the Pampeana region reached 7.6 percent, nearly a fourth of that in Santiago delEstero in the Northeast region where 29.1 percent were extremely poor. Chaco in the Northwest region experienced an extreme poverty headcount of 20.7 percent and Mendozain the Cuyo region of 26.6 percent. The latter finding may surprise the reader, butconsidering the fact that many agricultural workers face seasonal employment constraintsthe finding is less surprising. Agricultural workers in for example garlic, wine, and herbswork 4-6 months a year and not continuously.
14The numbers used are based on calculations from University of La Plata, CEDLA 2004
(http://www.depeco.econo.unlp.edu.ar/cedlas/monitoreo/excels/argentina/poverty/extreme_official.xls). 15 In the absence of household survey data for Patagonia, the weighted average of the poverty rate of theother regions was applied to Patagonia.
8/6/2019 Argentina Rural Poverty Labor Market 062105 2
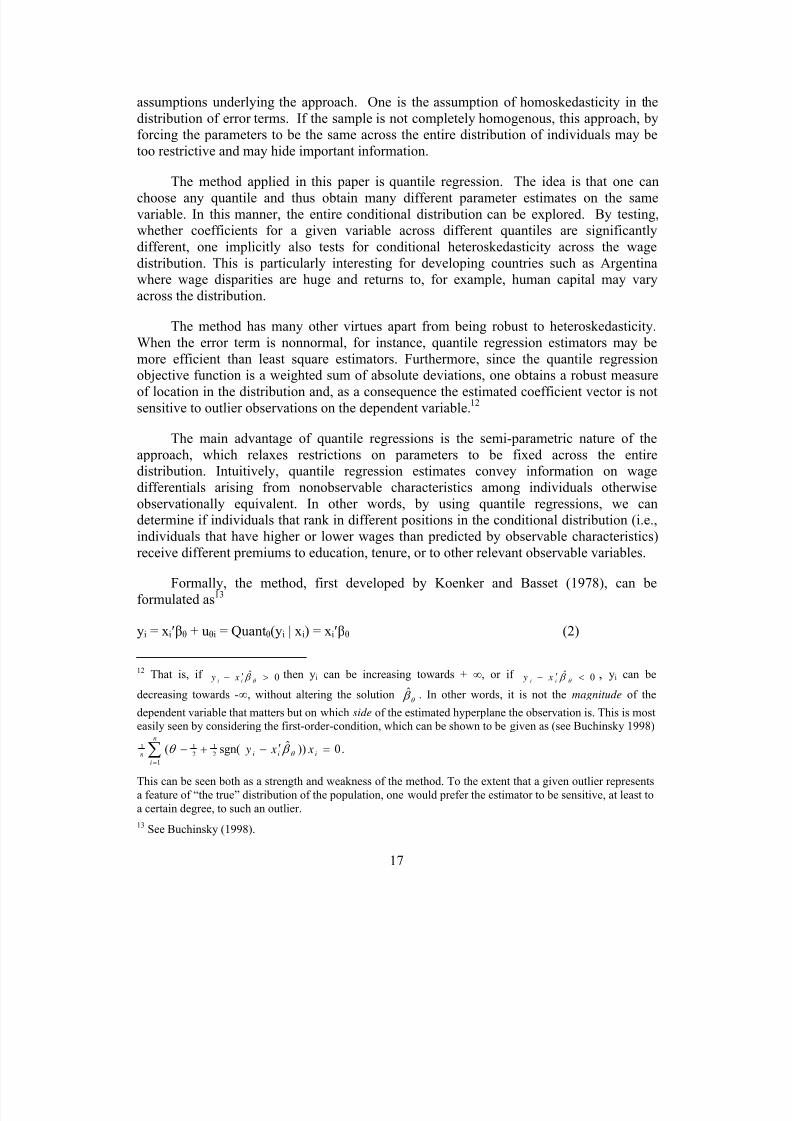
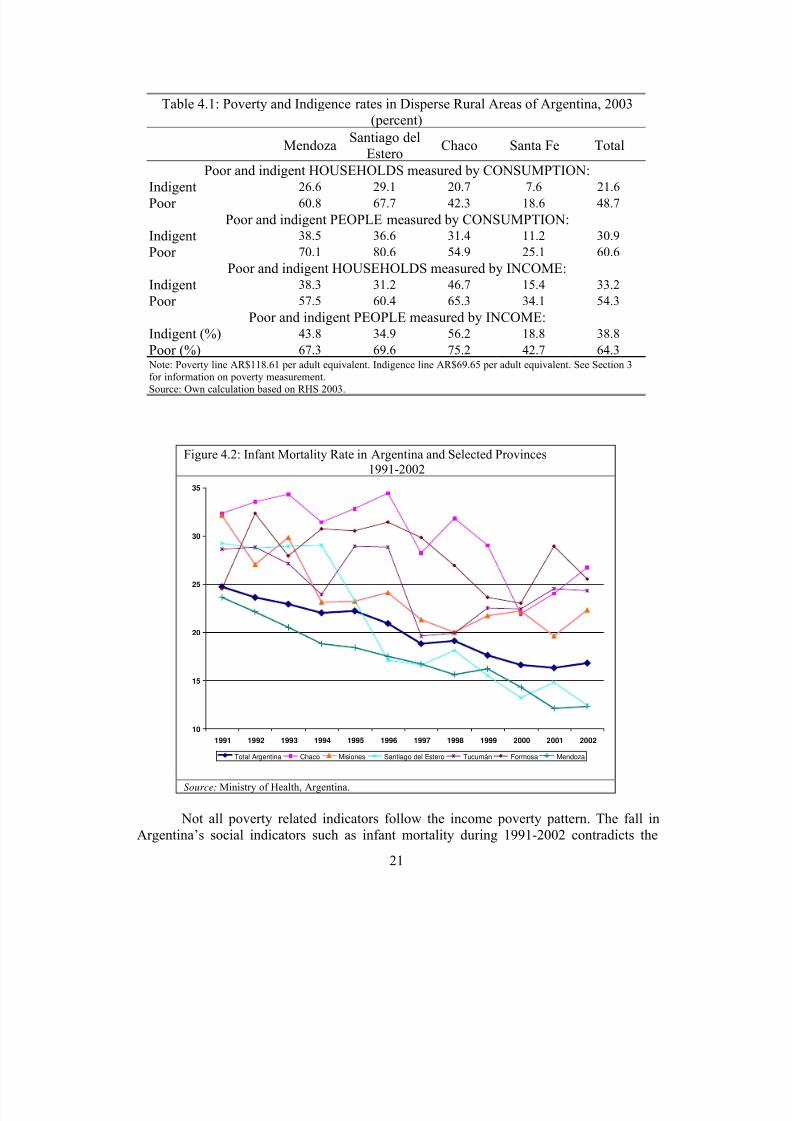
Figure 4.2: Infant Mortality Rate in Argentina and Selected Provinces1991-2002
Source: Ministry of Health, Argentina.
Not all poverty related indicators follow the income poverty pattern. The fall inArgentina’s social indicators such as infant mortality during 1991-2002 contradicts the
Table 4.1: Poverty and Indigence rates in Disperse Rural Areas of Argentina, 2003(percent)
MendozaSantiago del
EsteroChaco Santa Fe Total
Poor and indigent HOUSEHOLDS measured by CONSUMPTION:Indigent 26.6 29.1 20.7 7.6 21.6
Poor 60.8 67.7 42.3 18.6 48.7
Poor and indigent PEOPLE measured by CONSUMPTION:Indigent 38.5 36.6 31.4 11.2 30.9
Poor 70.1 80.6 54.9 25.1 60.6
Poor and indigent HOUSEHOLDS measured by INCOME:Indigent 38.3 31.2 46.7 15.4 33.2
Poor 57.5 60.4 65.3 34.1 54.3
Poor and indigent PEOPLE measured by INCOME:Indigent (%) 43.8 34.9 56.2 18.8 38.8
Poor (%) 67.3 69.6 75.2 42.7 64.3 Note: Poverty line AR$118.61 per adult equivalent. Indigence line AR$69.65 per adult equivalent. See Section 3for information on poverty measurement.Source: Own calculation based on RHS 2003.
deterioration in measured income poverty. The infant mortality rate dropped dramaticallyfrom 24.7 per 1,000 live births in 1991 to 16.7 per 1,000 live births in 2002 (Figure 4.2).Today the infant mortality rate in Argentina is one of the smallest among middle-incomecountries and mainly a rural phenomenon. The positive trend in falling infant mortality ratefrom 1991-2002 occurred in all provinces. However, the poorer provinces, such as Chaco
and Formosa, experienced a short-run trend that can be characterized as a slippery slope.These provinces experienced an increase in infant mortality after each economic crisisoccurred in Argentina and some provinces had children dying of hunger (see Box 2). Largeand steady advances have taken place in richer provinces, such as Mendoza. Advances can be attributed to an improved health care system, increased access to water, urbanization,and past investments in education (see Section 6), and other social programs. Hence, tofurther reduce the infant mortality rate in order to reach levels of Uruguay (13.5), Chile(8.9), or high-income OECD countries (5.0), especially in rural areas, further actions arecalled for. These include general livelihood improvements such as access to clean water and sanitation, high quality education and health care, and a daily caloric intake sufficientto cover basic needs. Moreover, Filmer and Pritchett (1997) find that a 10 percent increase
in income is associated with a 6 percent lower infant mortality rate. Hence, economicgrowth is key for infant mortality reduction.
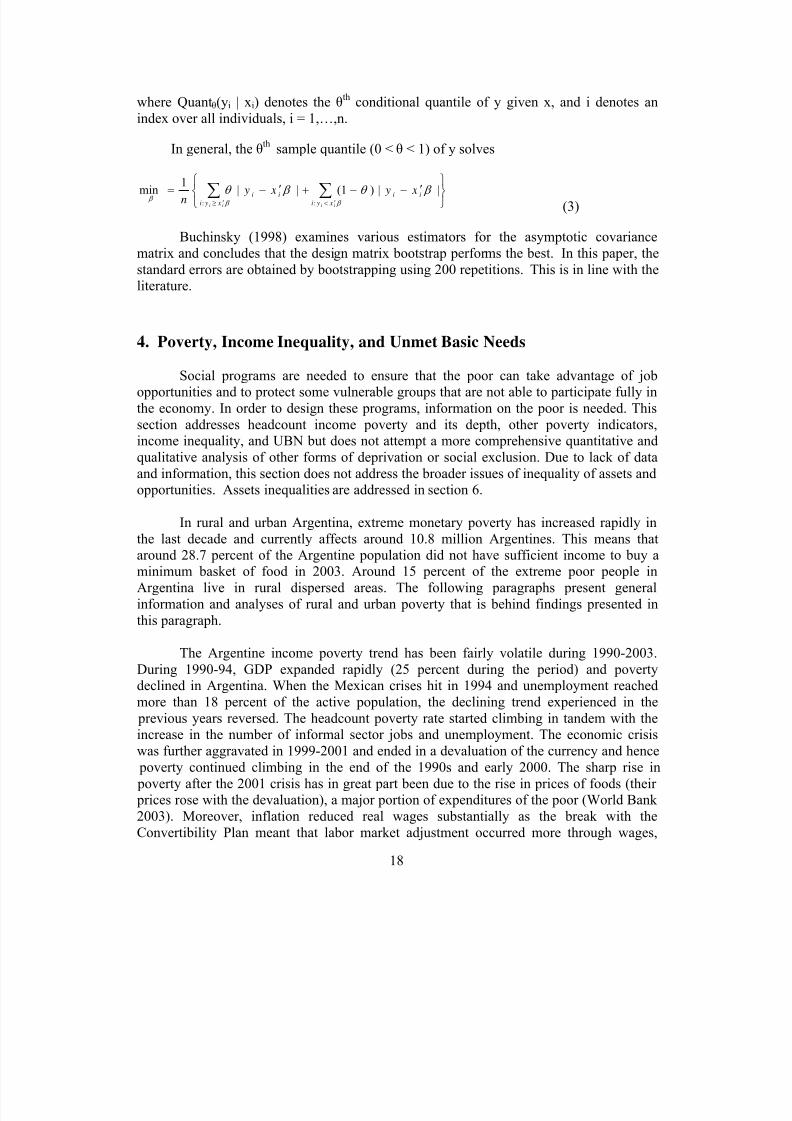
Figure 4.3: Share of Argentines with Unmet Basic Needs in 1991 and 2001
Source: INDEC. National Population Census 1991 and 2001.
The share of the Argentine population with UBN took the same declining path asinfant mortality. During 1991–2001 the share with UBN fell 2 percentage points (Figure4.3), reaching 17.7 percent of the population (6.3 million Argentines or 1.4 million
0
5
10
15
20
25
30
35
40
45
T
o t a l
A r g e n
t i n a
B u e n
o s A i r e
s
C a t a
m a r
c a
C h a c
o
C h u b
u t
C d a d . B u
e n o s
A i r e
s
C o r r i
e n t e
s
F o r m
o s a
J u j u y
L a P a
m p a
L a R i
o j a
M e n d
o z a
M i s i o
n e s
R . N e
g r o S a
l t a
S a n J u
a n
S a n L u
i s
S a n t
a C r u
z
S a n t
a F e
S a n t i a g o d
e l E s
t e r o
T . d e l
F u e g o
% o f p o p u l a t i o n w i t h
U B N
19912001
8/6/2019 Argentina Rural Poverty Labor Market 062105 2
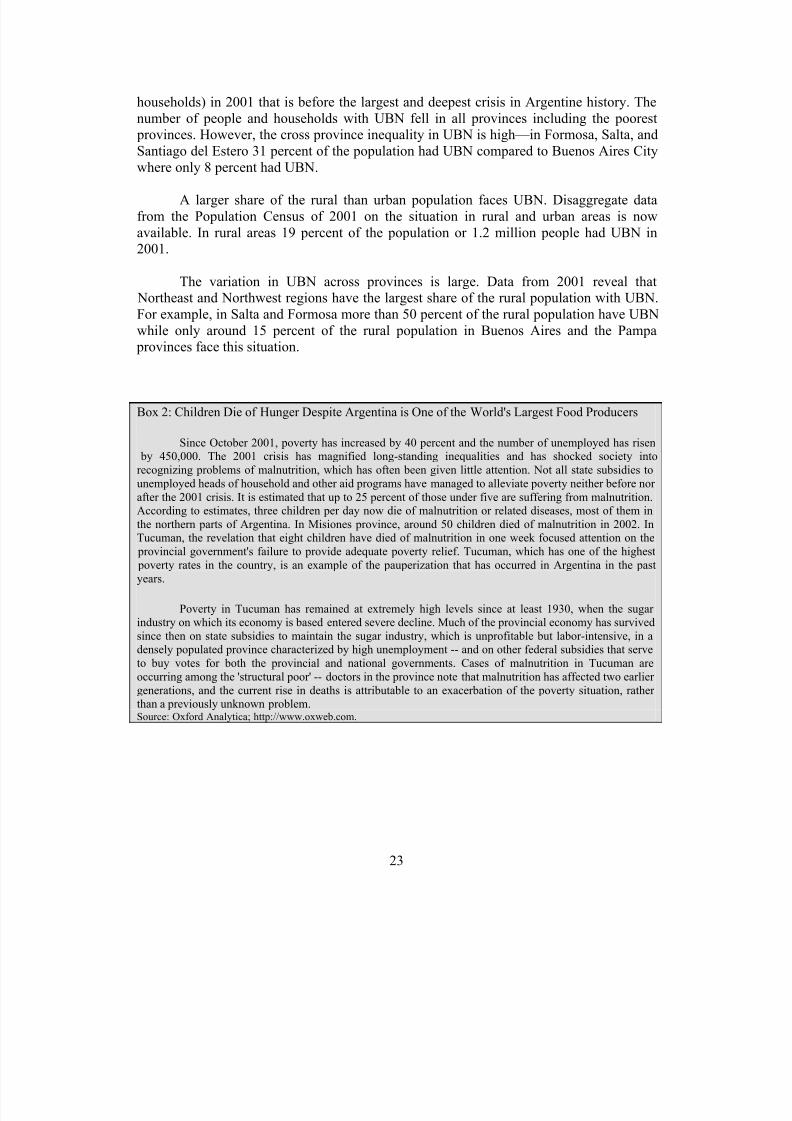
households) in 2001 that is before the largest and deepest crisis in Argentine history. Thenumber of people and households with UBN fell in all provinces including the poorest provinces. However, the cross province inequality in UBN is high—in Formosa, Salta, andSantiago del Estero 31 percent of the population had UBN compared to Buenos Aires Citywhere only 8 percent had UBN.
A larger share of the rural than urban population faces UBN. Disaggregate datafrom the Population Census of 2001 on the situation in rural and urban areas is nowavailable. In rural areas 19 percent of the population or 1.2 million people had UBN in2001.
The variation in UBN across provinces is large. Data from 2001 reveal that Northeast and Northwest regions have the largest share of the rural population with UBN.For example, in Salta and Formosa more than 50 percent of the rural population have UBNwhile only around 15 percent of the rural population in Buenos Aires and the Pampa provinces face this situation.
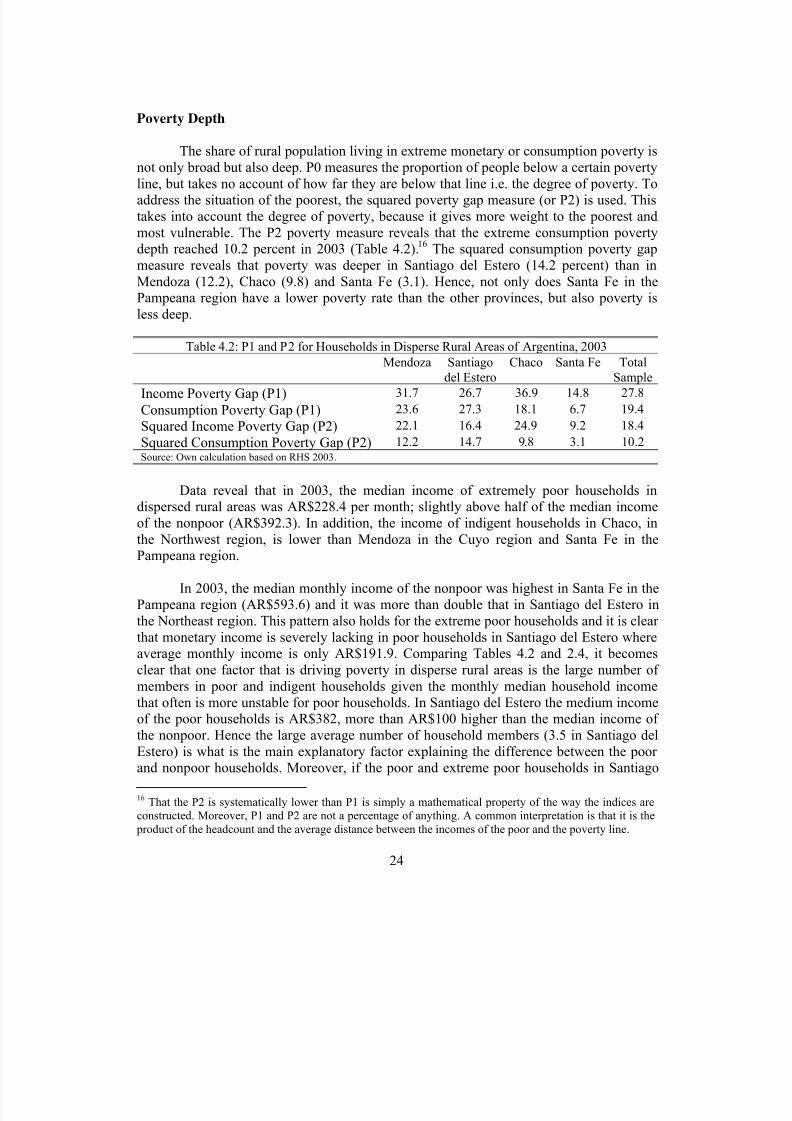
Box 2: Children Die of Hunger Despite Argentina is One of the World's Largest Food Producers
Since October 2001, poverty has increased by 40 percent and the number of unemployed has risen by 450,000. The 2001 crisis has magnified long-standing inequalities and has shocked society intorecognizing problems of malnutrition, which has often been given little attention. Not all state subsidies tounemployed heads of household and other aid programs have managed to alleviate poverty neither before nor after the 2001 crisis. It is estimated that up to 25 percent of those under five are suffering from malnutrition.According to estimates, three children per day now die of malnutrition or related diseases, most of them inthe northern parts of Argentina. In Misiones province, around 50 children died of malnutrition in 2002. In
Tucuman, the revelation that eight children have died of malnutrition in one week focused attention on the provincial government's failure to provide adequate poverty relief. Tucuman, which has one of the highest poverty rates in the country, is an example of the pauperization that has occurred in Argentina in the pastyears.
Poverty in Tucuman has remained at extremely high levels since at least 1930, when the sugar industry on which its economy is based entered severe decline. Much of the provincial economy has survivedsince then on state subsidies to maintain the sugar industry, which is unprofitable but labor-intensive, in adensely populated province characterized by high unemployment -- and on other federal subsidies that serveto buy votes for both the provincial and national governments. Cases of malnutrition in Tucuman areoccurring among the 'structural poor' -- doctors in the province note that malnutrition has affected two earlier generations, and the current rise in deaths is attributable to an exacerbation of the poverty situation, rather than a previously unknown problem.Source: Oxford Analytica; http://www.oxweb.com.
8/6/2019 Argentina Rural Poverty Labor Market 062105 2
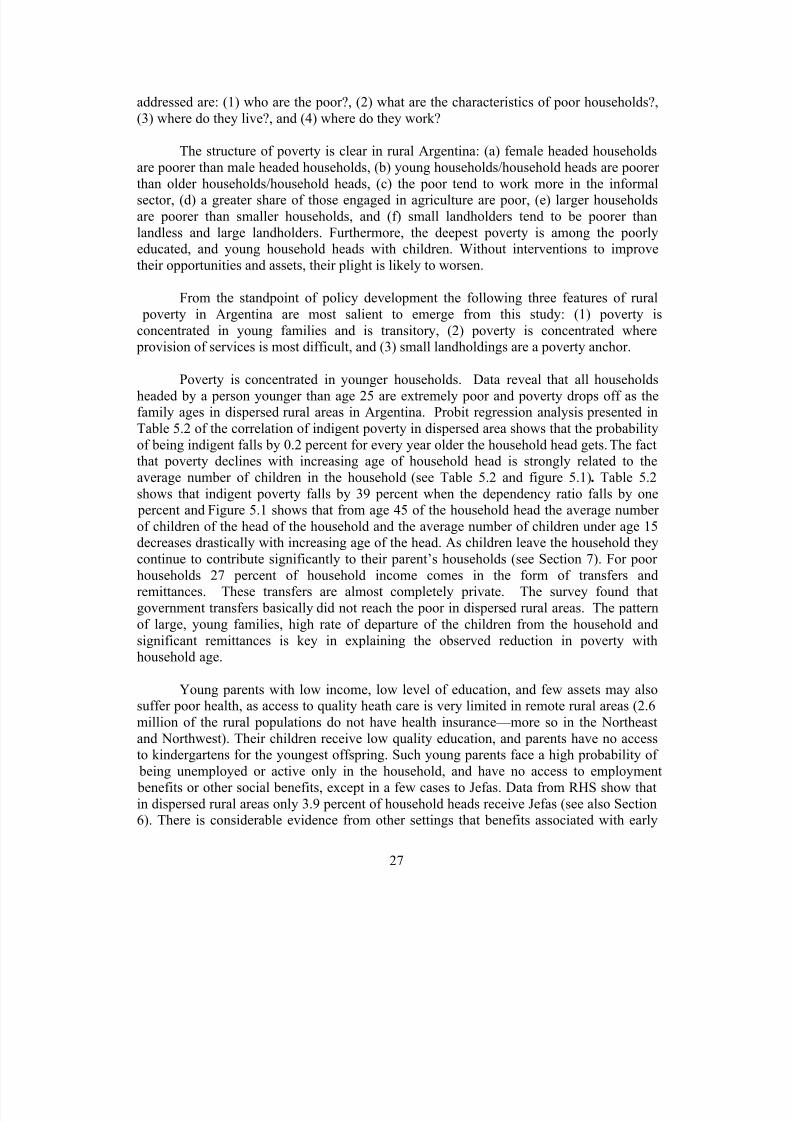
The share of rural population living in extreme monetary or consumption poverty isnot only broad but also deep. P0 measures the proportion of people below a certain poverty
line, but takes no account of how far they are below that line i.e. the degree of poverty. Toaddress the situation of the poorest, the squared poverty gap measure (or P2) is used. Thistakes into account the degree of poverty, because it gives more weight to the poorest andmost vulnerable. The P2 poverty measure reveals that the extreme consumption povertydepth reached 10.2 percent in 2003 (Table 4.2).16 The squared consumption poverty gapmeasure reveals that poverty was deeper in Santiago del Estero (14.2 percent) than inMendoza (12.2), Chaco (9.8) and Santa Fe (3.1). Hence, not only does Santa Fe in thePampeana region have a lower poverty rate than the other provinces, but also poverty isless deep.
Table 4.2: P1 and P2 for Households in Disperse Rural Areas of Argentina, 2003
Mendoza Santiagodel Estero
Chaco Santa Fe TotalSample
Income Poverty Gap (P1) 31.7 26.7 36.9 14.8 27.8
Consumption Poverty Gap (P1) 23.6 27.3 18.1 6.7 19.4
Squared Income Poverty Gap (P2) 22.1 16.4 24.9 9.2 18.4
Squared Consumption Poverty Gap (P2) 12.2 14.7 9.8 3.1 10.2Source: Own calculation based on RHS 2003.
Data reveal that in 2003, the median income of extremely poor households indispersed rural areas was AR$228.4 per month; slightly above half of the median incomeof the nonpoor (AR$392.3). In addition, the income of indigent households in Chaco, in
the Northwest region, is lower than Mendoza in the Cuyo region and Santa Fe in thePampeana region.
In 2003, the median monthly income of the nonpoor was highest in Santa Fe in thePampeana region (AR$593.6) and it was more than double that in Santiago del Estero inthe Northeast region. This pattern also holds for the extreme poor households and it is clear that monetary income is severely lacking in poor households in Santiago del Estero whereaverage monthly income is only AR$191.9. Comparing Tables 4.2 and 2.4, it becomesclear that one factor that is driving poverty in disperse rural areas is the large number of members in poor and indigent households given the monthly median household incomethat often is more unstable for poor households. In Santiago del Estero the medium income
of the poor households is AR$382, more than AR$100 higher than the median income of the nonpoor. Hence the large average number of household members (3.5 in Santiago delEstero) is what is the main explanatory factor explaining the difference between the poor and nonpoor households. Moreover, if the poor and extreme poor households in Santiago
16 That the P2 is systematically lower than P1 is simply a mathematical property of the way the indices areconstructed. Moreover, P1 and P2 are not a percentage of anything. A common interpretation is that it is the product of the headcount and the average distance between the incomes of the poor and the poverty line.
8/6/2019 Argentina Rural Poverty Labor Market 062105 2
del Estero and the other three provinces had the same number of members as the nonpoor households in the respective provinces only 30.2 and 17.1 percent of households would be below the poverty line as compared to currently 48.7 and 21.6 percent, respectively.
Table 4.3: Median Monthly Household Income in Dispersed Rural Areas of Argentina, 2003 (AR$)
Mendoza Santiagodel
Estero
Chaco Santa Fe Total
Nonpoor households 318.1 270.7 258.2 593.6 392.3
Poor households 330.7 381.5 213.2 373.4 300.0
Indigent households 291.5 191.9 222.6 373.4 228.4 Note: Poverty measured by consumption.Source: Own calculation based on RHS 2003.
Income inequality
Part of the reason why the poverty indicators of rural Argentina and those of thenation as a whole are worse than in other countries with similar per capita incomes isincome inequality. Moreover, the country’s income inequality became worse during thelast decade. In 2000, the average Gini index for Argentina’s urban areas was 0.45 (Figure4.4).
Figure 4.4: Gini Index for Urban Areas in Argentine Provinces, 1990 and 2000
Note: The Gini index is calculated using data for urban areas of the province covered by the EPH.Source: Department of Economics National University of La Plata. Based on EPH data.http://www.depeco.econo.unlp.edu.ar/dbregional/excels/gini.xls .
Income inequality is significantly higher in dispersed rural areas than in urbanareas. Data for the four provinces show a Gini index of 0.74 (Table 4.4). This high incomeinequality probably reflects the large range of livelihood strategies of the dispersed population ranging from heavy reliance on subsistence agriculture, with little earnedincome to complete reliance on wage labor. This hypothesis is supported by thesignificantly lower consumption inequality of 0.43, which is roughly equal to that in urban
0
0.1
0.20.3
0.4
0.5
0.6
L a P l a t
a
R o s a r i o
S a n t a
F e
C . R i v a
d a v i a
M e n d o z a
C o r d
o b a
S g o . d e l E
s t e r o
J u j u y
C a t a m
a r c a
S a l t a
S a n J
u a n
S a n t a R
o s a
T i e r r r a
d e l F
u e g o
C d a d
. d e B
s . A i r e s
G i n i i n
d e x
1991 2000
8/6/2019 Argentina Rural Poverty Labor Market 062105 2
areas It is worth noting that international research shows that the more unequal income isdistributed the less effective is economic growth in reducing poverty (Lustig et al 2001).
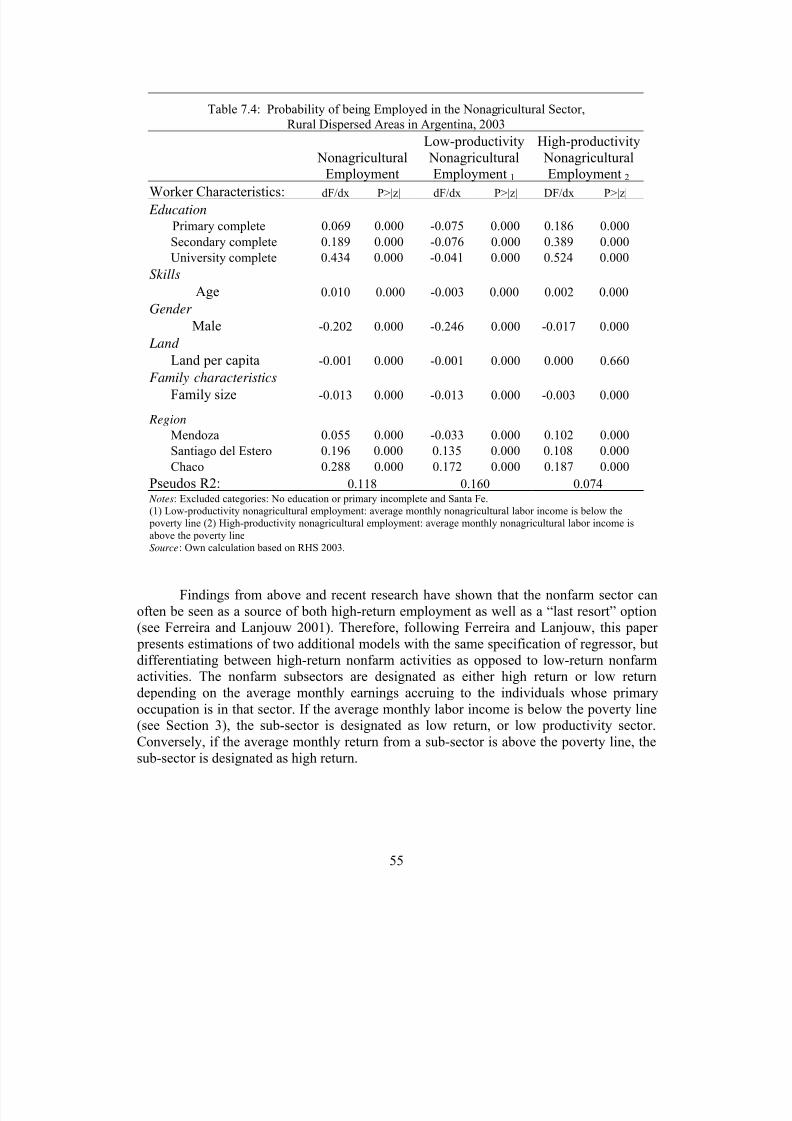
High return rural nonfarm occupations in Argentina were mostly taken up by thecomparatively better off, however, although the poor have also participated to some extent
(see Section 7). Hence, it is likely that the impact has not been equalizing, and the ruralnonfarm sector has contributed in some measure to the worsening of the rural incomedistribution. Private transfers (and too a much less extend public transfers) have definitelyhelped the poor more than other groups, and have therefore had an equalizing impact (SeeSection 7)
The problem of poverty and inequality in rural Argentina largely reflects disparitiesin opportunities. The distribution of key productive assets – jobs, human capital, physicalassets, financial assets, and social capital – is highly unequal, both among provinces and between provinces. These disparities are greatest between the poor and nonpoor, but alsomanifest themselves differently by geographic area. In addition, access to services is
unequal.Table 4.4: Gini Index in Disperse Rural Areas of Argentina, 2003
Mendoza Santiagodel
Estero
Chaco Santa Fe Total
Income 0.50 0.48 0.79 0.76 0.74
Consumption 0.37 0.37 0.48 0.35 0.43Source: Own calculation based on RHS 2003.
Changes in inequality are typically very slow, except during periods of radicalsocial and institutional change. Where inequality has fallen, it has usually happened in
association with major expansion and equalization in educational attainment, as in Koreaand Malaysia in the 1970s and 1980s. Education is also unequally distributed andinternational research shows that this can more easily be reduced than income inequality.However, research also shows that a reduction in education inequality affects the incomedistribution very little in the short run (Ferreira 2002).
5. Poverty Profile
After counting the rural poor, we need to know who they are, where they live, andwhat they do. Comparing average levels of poverty for different categories is useful for learning about which population groups are falling behind or catching up in terms of
poverty. This is useful for the design of policies: we would like to know whether, for example, more or less educated people are more likely to be poor in rural Argentina.Unfortunately, data do not allow for analyzing how the relative odds of being poor haveevolved for these groups since data are only available for 2003. The poverty profileconstructed is based on data from the RHS (Table 5.1). In the following the indigent poverty line and consumption poverty is referred to in the text. The main questions
8/6/2019 Argentina Rural Poverty Labor Market 062105 2
addressed are: (1) who are the poor?, (2) what are the characteristics of poor households?,(3) where do they live?, and (4) where do they work?
The structure of poverty is clear in rural Argentina: (a) female headed householdsare poorer than male headed households, (b) young households/household heads are poorer
than older households/household heads, (c) the poor tend to work more in the informalsector, (d) a greater share of those engaged in agriculture are poor, (e) larger householdsare poorer than smaller households, and (f) small landholders tend to be poorer thanlandless and large landholders. Furthermore, the deepest poverty is among the poorlyeducated, and young household heads with children. Without interventions to improvetheir opportunities and assets, their plight is likely to worsen.
From the standpoint of policy development the following three features of rural poverty in Argentina are most salient to emerge from this study: (1) poverty isconcentrated in young families and is transitory, (2) poverty is concentrated where provision of services is most difficult, and (3) small landholdings are a poverty anchor.
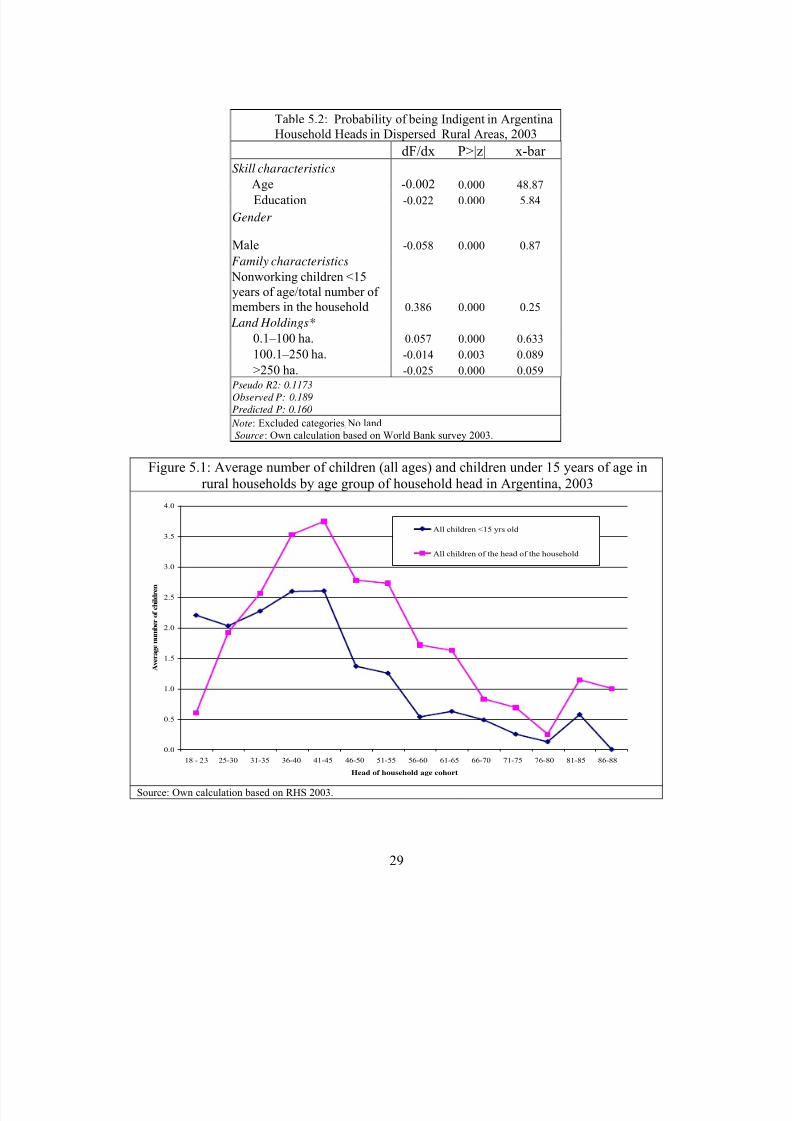
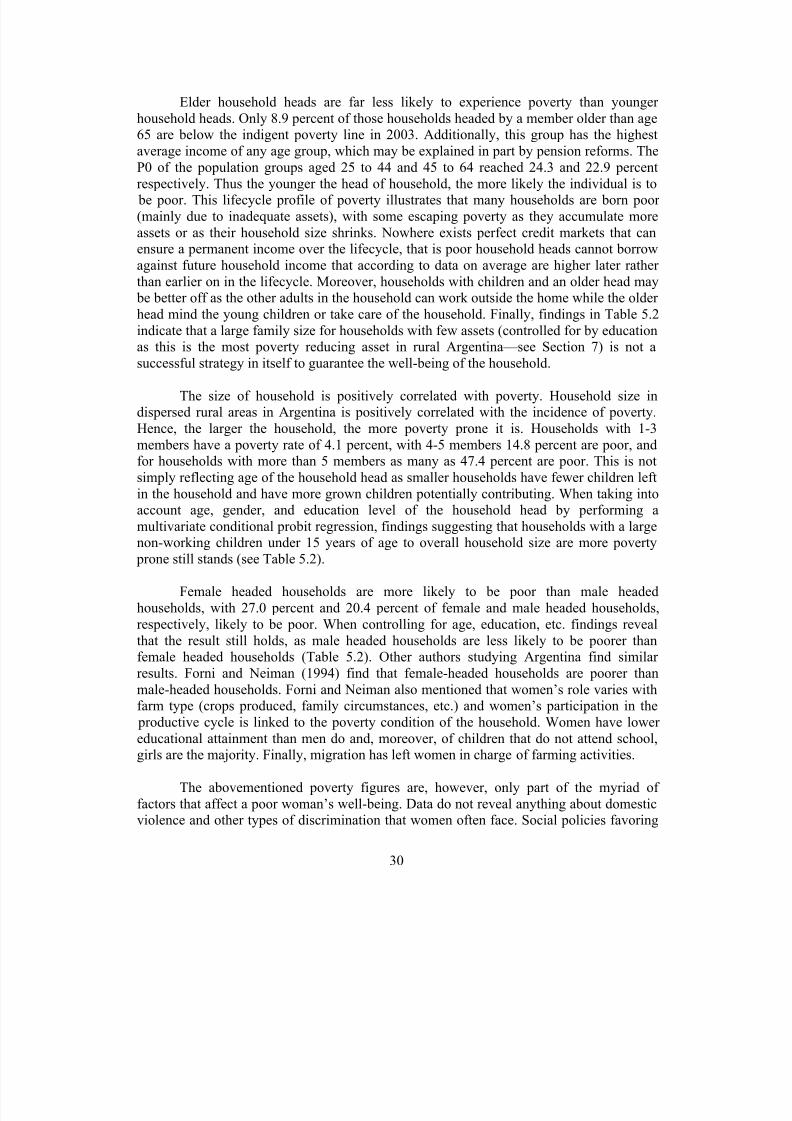
Poverty is concentrated in younger households. Data reveal that all householdsheaded by a person younger than age 25 are extremely poor and poverty drops off as thefamily ages in dispersed rural areas in Argentina. Probit regression analysis presented inTable 5.2 of the correlation of indigent poverty in dispersed area shows that the probabilityof being indigent falls by 0.2 percent for every year older the household head gets. The factthat poverty declines with increasing age of household head is strongly related to theaverage number of children in the household (see Table 5.2 and figure 5.1). Table 5.2shows that indigent poverty falls by 39 percent when the dependency ratio falls by one percent and Figure 5.1 shows that from age 45 of the household head the average number of children of the head of the household and the average number of children under age 15
decreases drastically with increasing age of the head. As children leave the household theycontinue to contribute significantly to their parent’s households (see Section 7). For poor households 27 percent of household income comes in the form of transfers andremittances. These transfers are almost completely private. The survey found thatgovernment transfers basically did not reach the poor in dispersed rural areas. The patternof large, young families, high rate of departure of the children from the household andsignificant remittances is key in explaining the observed reduction in poverty withhousehold age.
Young parents with low income, low level of education, and few assets may alsosuffer poor health, as access to quality heath care is very limited in remote rural areas (2.6
million of the rural populations do not have health insurance—more so in the Northeastand Northwest). Their children receive low quality education, and parents have no accessto kindergartens for the youngest offspring. Such young parents face a high probability of being unemployed or active only in the household, and have no access to employment benefits or other social benefits, except in a few cases to Jefas. Data from RHS show thatin dispersed rural areas only 3.9 percent of household heads receive Jefas (see also Section6). There is considerable evidence from other settings that benefits associated with early
8/6/2019 Argentina Rural Poverty Labor Market 062105 2
childhood interventions are very high indeed, especially for children from disadvantaged backgrounds, both because this is a critical stage in child development and because returnsto any productive investment in children accrue over a much longer period of time thanreturns to productive investments in adults (see Heckman 1999; Currie 2001). Thissuggests that interventions that benefit children should receive high priority. In addition,
targeted social protection measures that relate to youth employment, family planning, and preschool programs could help improve employment prospects of young people.
Table 5.1: Poverty Profile by Four Measures of Poverty (P0)Dispersed Rural Areas of Argentina, 2003
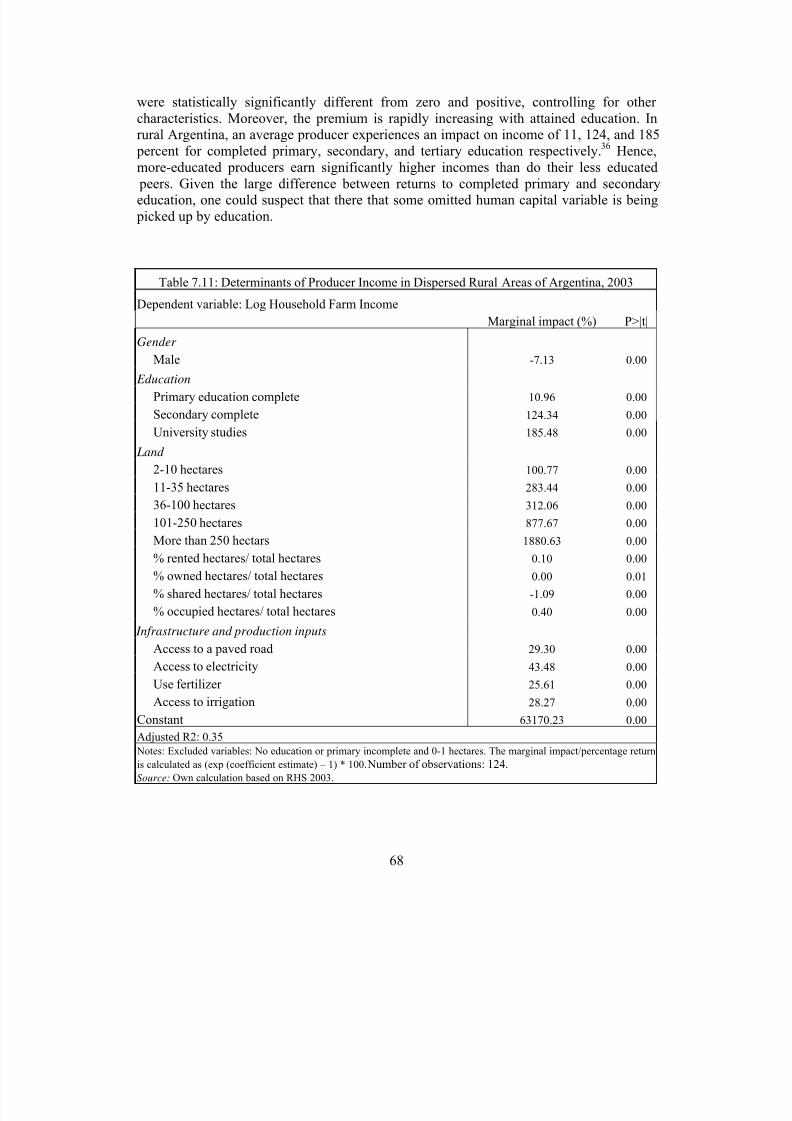
Table 5.2: Probability of being Indigent in ArgentinaHousehold Heads in Dispersed Rural Areas, 2003
dF/dx P>|z| x-bar
Skill characteristics
Age -0.002 0.000 48.87
Education -0.022 0.000 5.84
Gender
Male -0.058 0.000 0.87
Family characteristics
Nonworking children <15years of age/total number of members in the household 0.386 0.000 0.25
Land Holdings*
0.1–100 ha. 0.057 0.000 0.633
100.1–250 ha. -0.014 0.003 0.089
>250 ha. -0.025 0.000 0.059
Pseudo R2: 0.1173
Observed P: 0.189
Predicted P: 0.160
Note: Excluded categories: No land
Source: Own calculation based on World Bank survey 2003.
Figure 5.1: Average number of children (all ages) and children under 15 years of age inrural households by age group of household head in Argentina, 2003
Elder household heads are far less likely to experience poverty than younger household heads. Only 8.9 percent of those households headed by a member older than age65 are below the indigent poverty line in 2003. Additionally, this group has the highestaverage income of any age group, which may be explained in part by pension reforms. TheP0 of the population groups aged 25 to 44 and 45 to 64 reached 24.3 and 22.9 percent
respectively. Thus the younger the head of household, the more likely the individual is to be poor. This lifecycle profile of poverty illustrates that many households are born poor (mainly due to inadequate assets), with some escaping poverty as they accumulate moreassets or as their household size shrinks. Nowhere exists perfect credit markets that canensure a permanent income over the lifecycle, that is poor household heads cannot borrowagainst future household income that according to data on average are higher later rather than earlier on in the lifecycle. Moreover, households with children and an older head may be better off as the other adults in the household can work outside the home while the older head mind the young children or take care of the household. Finally, findings in Table 5.2indicate that a large family size for households with few assets (controlled for by educationas this is the most poverty reducing asset in rural Argentina—see Section 7) is not a
successful strategy in itself to guarantee the well-being of the household.
The size of household is positively correlated with poverty. Household size indispersed rural areas in Argentina is positively correlated with the incidence of poverty.Hence, the larger the household, the more poverty prone it is. Households with 1-3members have a poverty rate of 4.1 percent, with 4-5 members 14.8 percent are poor, andfor households with more than 5 members as many as 47.4 percent are poor. This is notsimply reflecting age of the household head as smaller households have fewer children leftin the household and have more grown children potentially contributing. When taking intoaccount age, gender, and education level of the household head by performing amultivariate conditional probit regression, findings suggesting that households with a large
non-working children under 15 years of age to overall household size are more poverty prone still stands (see Table 5.2).
Female headed households are more likely to be poor than male headedhouseholds, with 27.0 percent and 20.4 percent of female and male headed households,respectively, likely to be poor. When controlling for age, education, etc. findings revealthat the result still holds, as male headed households are less likely to be poorer thanfemale headed households (Table 5.2). Other authors studying Argentina find similar results. Forni and Neiman (1994) find that female-headed households are poorer thanmale-headed households. Forni and Neiman also mentioned that women’s role varies withfarm type (crops produced, family circumstances, etc.) and women’s participation in the
productive cycle is linked to the poverty condition of the household. Women have lower educational attainment than men do and, moreover, of children that do not attend school,girls are the majority. Finally, migration has left women in charge of farming activities.
The abovementioned poverty figures are, however, only part of the myriad of factors that affect a poor woman’s well-being. Data do not reveal anything about domesticviolence and other types of discrimination that women often face. Social policies favoring
8/6/2019 Argentina Rural Poverty Labor Market 062105 2
women, such as conditional-cash-transfer programs such as Bolsa Familia in Brazil wherethe mother receives the benefit should be considered (see Section 6). Furthermore,introducing more kindergarten and childcare facilities introduced for poor mothers couldfacilitate poor women’s labor market participation.
Education levels are strongly related to poverty. That is, being able to read andwrite is important in determining the likelihood of being poor. In dispersed rural areas, theP0 is 20.3 percent for household heads that are literate, and 33.8 percent for those that areilliterate. There appears to be a relatively large difference in P0 already between householdheads with no education (31.5 percent) and household heads with 1-4 years of primaryeducation. Nevertheless, household heads that have completed secondary education aremuch better off (10.7 percent are indigent) than those with only primary education (20.5 percent). Of the household heads with more than 12 years of schooling, which are veryfew, no rural-dweller was extremely poor in 2003. These findings indicate that education isa very important key to poverty reduction in rural Argentina (see also Section 7).
17Policy
interventions that facilitate poor rural people’s access to basic services and expanding high
quality rural education are central to poverty reduction in rural Argentina.
Argentina, together with Chile, is well known for its relatively well-educated population compared to other nations in Latin America. Tremendous strides have beenmade in improving access of the poor to basic education. However, there exist largedisparities between rural and urban areas and across regions. Children in dispersed areasoften face a long travel time to go to school and for the poor this is especially so, as theyoften have to go by foot or horse.
Labor market connection is important for the probability of falling into poverty.Economically active heads face more poverty than employed heads do. The difference
between the two has to do with unemployment, as there are unemployed heads searchingfor work included in the former category. That also explains why active household headsface less consumption poverty than income poverty as the unemployed heads may cultivatefor self-consumption and therefore be less consumption poor than income poor.
Informal workers suffer more poverty than formal workers (79.7 and 20.3 percentare employed in the respective sectors). The P0 for informal workers is high, 21.2 percentcompared to 14.6 percent for formal workers. In dispersed rural areas, only 20.3 percent of household heads are engaged in the formal labor market, while 79.7 percent are engaged inthe informal labor market.
17 Clearly, it is valid to question causality. Moreover, the education-poverty literature has still not uncoveredthis. It is surely the case that many children received a good education because their parents had a goodeducation and income. Hence one direction of causation flows from well-off or better-educated parents to better-educated children. How strong is the education effect when the previous generation was poor anduneducated. Access to education has also shown to be important. Unfortunately, our data set cannot shedfurther light on this question.
8/6/2019 Argentina Rural Poverty Labor Market 062105 2
The informal poor face risks in the form of unemployment and overall economicdownturns, earn a low and irregular income, own very few assets, and have no insuranceagainst poverty, such as unemployment benefits. At the same time, it should be recognizedthat since very few people work in the formal labor market, social policies tied to formalemployment or unemployment will have only very limited reach among the poor.
Moreover, informal mechanisms of risk sharing in dispersed rural areas are limited ascovariate risk (such as climate) is high and, therefore, there is limited potential for informalrisk sharing. This puts a premium on migration diversification strategies, such as sending afew children to urban informal markets.
The labor category contributing the largest share to overall poverty is employeeswith salary as a percent of sales or production (26 percent are indigent). This contrasts withthe self-employed and wageworker categories where 18.7 and 23.2 percent are extremely poor, respectively.
Those who work in agriculture and services are more likely to be poor than workers
in industry. This suggests that productivity in agriculture and services is lower than inindustry. It also suggests a more competitive wage environment among more highlyeducated workers in the industrial sector. The P0 is 24.5 percent in agriculture, 25.7 percent among service workers and 5.2 percent among industrial workers.
Historically, poverty in Argentina has been associated with agriculture. In 2003,more than 75 percent of the extreme poor household heads in dispersed rural areas citedagriculture as their primary form of employment. One explanation for the indigent povertyrate in agriculture can be traced to migration out of the sector as the most educated rural-dwellers leave, in part due to the structure of land ownership, the quality of land and lack of credit and other productive inputs. Rural land ownership is characterized by a high
degree of concentration of land in few large establishments and a large number of smallfarms with an insufficient area to sustain a family by agricultural employment alone.
In the last 10 years, the land concentration increased. During 1988–2001, the planted area increased by 8 percent, while the number of farm enterprises decreased by 21 percent (Agricultural Census, 2001). Table 5.3 indicates the land distribution as of 2003 indispersed rural areas in Argentina. The table shows that nearly half of the land holdings(49 percent) are smaller than 10 hectares and 19 percent are larger than 100 hectare.
Table 5.3: Land Distribution For Producer HouseholdsDispersed Rural Areas in Argentina, 2003 (percent)
Hectares Total Cumulative
0 –1 27.6 27.6
1.12-10 21.7 49.3
10.1 –35 17.9 67.2
35.1-100 14.2 81.4
100.1-250 10.8 92.2
More than 250 7.8 100.0
Source: Own calculation based on RHS 2003.
8/6/2019 Argentina Rural Poverty Labor Market 062105 2
Extreme poverty among landless rural-dwellers is not necessarily higher thanamong households with land. P0 for landless households is 12.9 percent compared to 23.8and 30.8 percent for landholders of less than one hectare and 10-35 hectares, respectively.Only households with more than 250 hectares experience less consumption poverty thanlandless households. Extreme poverty is decreasing from households with more than 10
hectares onwards. However, income poverty is higher for households with 1-250 hectaresthan it is for households with no land holdings (Table 5.1).
In dispersed rural areas the majority of the population lives with limited access to basic infrastructure and services. The rural poor are primarily smallholders, sharecroppers,and informal wageworkers that depend on a diverse strategy of income-generatingactivities in which subsistence production predominates. The varying soil quality andclimatic conditions (76 percent of Argentina is arid or semi-arid) explain why crops andlivestock of the poor vary across the country. In the precordillera (mountainous areas) goatrearing is the main occupation of farmers. Poor farmers cultivate corn, cotton, wool,tobacco, or sugar cane and, furthermore, in the North pepper and peas are produced. In
addition, a few vegetables and fruits are grown mainly for subsistence.
In semi-arid/dessert and transition zones, rainfall is scarce and highly irregular,yielding crops of low quality and low income generating capacity. These small farmerslack modern production technology, basic infrastructure to store harvests to take advantageof cyclical price fluctuations, technical assistance to improve productivity, and organizedmarketing facilities. Family income is therefore highly variable and there is littleopportunity for saving. They have very few assets, including education, and are veryvulnerable. How to best address poverty in rural Argentina? There are three dimensions toany rural poverty reduction strategy: (1) improve the mobility of the poor, in order to helpthem to move to areas with better employment opportunities, (2) create jobs accessible to
the poor, and (3) strengthen safety nets to help them wherever they may be found. The bestoption for Argentina is a strategy that (1) emphasizes rural employment growth, (2)combines safety net transfers with incentives for improved secondary and tertiary schoolattendance, and (3) strives to strengthen links between families living in dispersed areaswith the closest grouped areas.
6. Access to Services and Assets
The well being and value of goods produced by the rural population is closelylinked to availability of assets and infrastructure, which is discussed in this section.Production capacity and the quality of products increases, production value improves, and
so does household incomes of the rural population with increased access to better irrigationsystems, flood control, energy, regular land tenure and roads of good condition. Lack of education and good health for the rural population is another factor causing poverty.
The problem of poverty and inequality in rural Argentina largely reflects disparitiesin opportunities and assets. The distribution of key productive assets – labor, humancapital, physical assets, financial assets, and social capital – is highly unequal. These
8/6/2019 Argentina Rural Poverty Labor Market 062105 2
disparities are greatest between the poor and nonpoor, but also manifest themselvesdifferently by geographic area. In addition, access to services is unequal. This sectionaddresses a few of these areas, namely education, basic infrastructure services, and socialassistance. The following sections address employment and wage and therefore also theimportance of education and other assets in employment, wage, and income determination.
Education
Education is key to poverty reduction. Increased educational attainment canimprove the livelihoods of the poor and reduce the likelihood of becoming poor as shownin Section 5. More education is also a key factor in obtaining a higher income (see Section7). Furthermore, education is associated with fertility, i.e. the more education a womanattains, the lower her fertility rate, and therefore the lower the dependency ratio and thelower the likelihood of falling into poverty as each year of schooling yields an increase inhourly earnings (as shown in Section 7). Therefore, a clear message is that the rural-dwellers in Argentina need to be brought up the educational ladder to escape poverty.
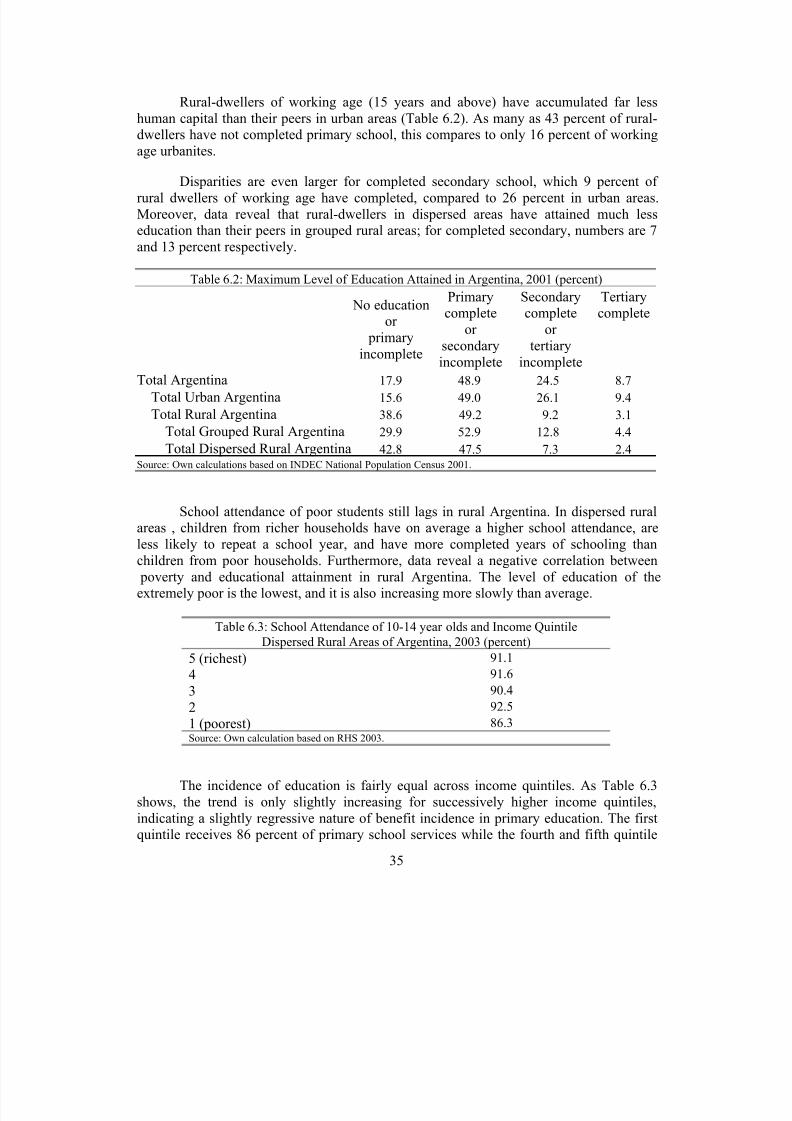
Argentina, together with Chile, is well known for its relatively well-educated population compared to other nations in Latin America. However, there exist largedisparities between rural and urban areas and across regions. Tremendous strides have been made in improving access of the poor to basic education. However, inequalitiesremain between rural and urban dwellers. In urban areas, 98.5 percent of the 6-11 year oldsattend school. In grouped rural areas, also 98.5 percent of the 6-11 year olds attend school, but the number falls to 95.5 in dispersed rural areas (Table 6.1). The 12-14 and 15-17 year olds in dispersed rural areas fall more behind their peers in urban areas; 12 and 20 percentage points respectively. Moreover, children and youth in the poorest provinces falleven further behind. For example, 91 percent of the 6-11 year olds in dispersed rural areas
attend school in Chaco and Misions compared to 98 percent in Buenos Aires, Cordoba andSanta Fe. Of the 15-17 year olds, only 28 percent attend school in Santiago del Esterocompared to 72 percent in the province of Buenos Aires. Moreover, education quality isoften lower in dispersed rural areas and children often face a long travel time go to schooland for the poor this is specially so, as they often have to go by foot or horse.
What causes the falloff in school enrollment after 11 years of age in the dispersedrural areas? Is it a supply constraint or lack of demand? Is the reason cost of schooling indispersed areas or lack of economic value for education above primary level for children indispersed areas? To answer these questions more research is needed.
Table 6.1: School Attendance Rural and Urban Argentina, 2001 (percent)Age (years)
3-4 5 6-11 12-14 15-7 18-24
Total 39.1 78.8 98.2 95.1 79.4 36.9
Total Urban Argentina 42.0 80.8 98.5 96.2 82.4 39.1
Total Rural Argentina 20.4 65.9 96.4 87.2 56.1 16.5
Total Grouped Rural Argentina 29.3 78.2 98.5 93.2 70.9 23.2
Total Dispersed Rural Argentina 16.6 60.6 95.5 84.4 49.1 13.5
Source: Own calculations based on INDEC National Population Census 2001.
8/6/2019 Argentina Rural Poverty Labor Market 062105 2
Rural-dwellers of working age (15 years and above) have accumulated far lesshuman capital than their peers in urban areas (Table 6.2). As many as 43 percent of rural-dwellers have not completed primary school, this compares to only 16 percent of workingage urbanites.
Disparities are even larger for completed secondary school, which 9 percent of rural dwellers of working age have completed, compared to 26 percent in urban areas.Moreover, data reveal that rural-dwellers in dispersed areas have attained much lesseducation than their peers in grouped rural areas; for completed secondary, numbers are 7and 13 percent respectively.
Table 6.2: Maximum Level of Education Attained in Argentina, 2001 (percent)
No educationor
primary
incomplete
Primarycomplete
or secondary
incomplete
Secondarycomplete
or tertiary
incomplete
Tertiarycomplete
Total Argentina 17.9 48.9 24.5 8.7
Total Urban Argentina 15.6 49.0 26.1 9.4
Total Rural Argentina 38.6 49.2 9.2 3.1
Total Grouped Rural Argentina 29.9 52.9 12.8 4.4
Total Dispersed Rural Argentina 42.8 47.5 7.3 2.4Source: Own calculations based on INDEC National Population Census 2001.
School attendance of poor students still lags in rural Argentina. In dispersed ruralareas , children from richer households have on average a higher school attendance, are
less likely to repeat a school year, and have more completed years of schooling thanchildren from poor households. Furthermore, data reveal a negative correlation between poverty and educational attainment in rural Argentina. The level of education of theextremely poor is the lowest, and it is also increasing more slowly than average.
Table 6.3: School Attendance of 10-14 year olds and Income QuintileDispersed Rural Areas of Argentina, 2003 (percent)
5 (richest) 91.1
4 91.6
3 90.4
2 92.5
1 (poorest) 86.3Source: Own calculation based on RHS 2003.
The incidence of education is fairly equal across income quintiles. As Table 6.3shows, the trend is only slightly increasing for successively higher income quintiles,indicating a slightly regressive nature of benefit incidence in primary education. The firstquintile receives 86 percent of primary school services while the fourth and fifth quintile
8/6/2019 Argentina Rural Poverty Labor Market 062105 2
each receives more than 91 percent. Compared to other countries in the region this seems issurprisingly equal. The big policy question is whether the lower participation of the lowestquintile is supply or demand driven. If the problem is related to lack of demand a programlike Bolsa Escola in Brazil may increase school attendance of the poor. Most regions dohave schools, but the students’ travel time to get to the school may be significant in
particular in Northwest and Northeast Argentina.
Education seems to reduce the risk of falling into poverty in Argentina (WorldBank 2003). Large gaps exist in school attendance between the poor and nonpoor. Sincethe number of those under age 14 is not growing (see Section 2), Argentina has been presented with an excellent opportunity to increase access of the poor to primary school(there are lower rates of participation of the first quintile than other quintiles) and above primary school and improve the quality of education. Policies to improve access of the poor to secondary and higher education linked with improved quality of education andincreased focus on technical skills should be one of the key pillars of the government’srural poverty reduction strategy.
Basic Infrastructure Services
Basic infrastructure services contribute to higher welfare and productivity. Someservices such as potable water and sanitation contribute directly to overall welfare andhealth status. Others such as electricity and telephones help households use their homes productively for income generation. Research reveals that access to basic services is highlycorrelated with a lower probability of being poor. Inequities in access to such servicesabound in rural Argentina, both between the poor and nonpoor and by geographical area.Key gaps for the rural poor exist in energy and potable water.
Access to public infrastructure services is poor for many services in rural Argentinaand the rural and urban services gap is large. Argentina’s rural population has little accessto safe water; only 30 percent have access compared to 85 percent in urban areas. Rural-dwellers in Argentina have less access to safe water than do some of their peers in ruralAfrica such as Kenya (31 percent), Nigeria (39 percent), and Uganda (46 percent)
18, a fact
having to do with the highly dispersed nature of Argentina’s rural poor population,especially compared to Africa’s village based rural population. Moreover, the supply of services is seriously lacking in dispersed rural areas compared to national averages. Indispersed rural areas, only 21 percent of households have access to safe water, 7 percent totrash collection, 16 percent to paved roads, and 7 percent to a fixed telephone (Table 6.4).19
18 Source: Unicef database (2000).
19 There may be representative problems at provincial level in the data set.
8/6/2019 Argentina Rural Poverty Labor Market 062105 2
Mobil phone 18.3 3.1 6.7 31.6 15.6Source: Own calculation based on RHS 2003.
Large differences exist in access to energy and electricity in rural Argentina.
Energy and rural electrification contribute to the improvement of living conditions in ruralareas. It facilitates social integration, contributes to increase production value, and promotes diversification. Some houses, most of them in dispersed areas and smalllocalities far from main roads, use diesel generators. Large differences exist among provinces with regard to access to the electrical network and the type of energy used, acommonly used energy source for cooking for rural residents is firewood or charcoal. Indispersed rural areas, public electricity connection reach from 5.1 percent for the poorestquintile in Santiago del Estero to 85.1 percent for the wealthiest quintile in Santa Fe in2003 (Figure 6.1 and Table 6.5). Hence, there are extreme differences across the incomedistribution and across provinces in access to electricity. The general trend is increasing for successively higher income quintiles, indicating the regressive nature of electrification in
Chaco, Mendoza, Santiago del Estero, and Santa Fe. The clearest regressive pattern inincidence benefits is seen in Santiago del Estero. In Chaco and Santiago del Estero andother provinces, it would not take a great deal of effort to increase access to electricity because in many places the electricity line runs directly over the lot, but the dwelling is notconnected to the grid. The rural-dwellers mentioned during field visit that it is a questionof a one-time fee of AR$750-1100 for connecting the household to the electricity grid.
Table 6.5: Access to Basic Infrastructure by Income Quintile inDispersed Rural in Argentina, 2003 (percent)
Figure 6.1: Access to Public and Private Provided Electricity
by Income Quintile in Dispersed Rural Areas in Argentina, 2003
0
20
40
60
80
100
1st
(poorest)
2nd 3rd 4th 5th
(richest) P e r c e n t o f h o u s e h o l d s w i t h a c c e
s s
MendozaSantiago
ChacoSanta Fe
Source: Own calculation based on RHS 2003.
The incidence of water access varies among rich and poor and provinces. Overall,two-thirds of rural drinking water service by neighborhood groups and cooperatives andone-third is provided by official agencies provincial and municipal (World Bank 2004). AsFigure 6.2 shows, access to water varies across income groups. The trend is increasing for successively higher income quintiles in Mendoza. The first and second quintiles receive
around 31 percent of the water services while the fourth and fifth receive more than 50 percent each.20 The benefit incidence of water in Santiago del Estero is concentrated in thefourth quintile. In Chaco, the first quintile receives 20.3 percent of the service while thefourth only 15.3 percent; hence the trend seems more progressive. However, the RHS maynot be representative at provincial level for all provinces; hence, more research is neededin order to check the robustness of this finding.
If one considers that the provision of drinking water, sewerage networks, andelectricity to a dispersed rural population would be particularly costly, efforts should first be aimed at the agglomerated population in localities and in regions and provinces with themost acute level and high density of poverty. At the same time, special programs should be
defined, using appropriate technologies that improve the access to water of the dispersedrural population.
20 In Mendoza, although households have access to water in some places it is contaminated and unsuitable for drinking.
8/6/2019 Argentina Rural Poverty Labor Market 062105 2
Figure 6.2: Access to Public and Private provided Water in Dispersed RuralAreas in Argentina by Income Quintile, 2003
0
10
20
30
40
50
60
1st
(poorest)
2nd 3rd 4th 5th
(richest) P e r c e n t o f h o u s e h o l d s w i t h a c c e s s
t o w a t e r
Mendoza
Santiago
Source: Own calculation based on RHS 2003.
Social and Productive Assistance
Recognizing that economic growth and social investment in education (and health)will still leave many in extreme poverty, the province and federal governments have avariety of programs aimed at reducing economic insecurity and targeted poverty reduction.Programs fall into three categories: (i) those dealing with lifecycle considerations such associal security and pensions; (ii) those dealing with income volatility such as
unemployment insurance; and (iii) those dealing with social protection, aimed atimproving the well-being of specific vulnerable groups.
Social protection programs specifically targeted at rural-dwellers do not exist inArgentina. Social protection programs in rural areas are rural extension of nationwide programs. These include cash-transfer schemes as well as employment and incomegenerating programs.
This section describes some of the social protection issues and addresses policies of the government in dealing with them. In doing so, it focuses on one major social protection program: Jefas. Additionally , rural development programs and programs targeted to
indigenous peoples are briefly addressed.
Many existing social programs find it difficult to reach the very poorest. A recentstudy for Brazil found that of the total spent on social programs, 14 percent accrued to thefirst quintile of the income distribution (World Bank 2001). Many programs lack broadreach amongst the poor, good targeting, or both. Some guidelines for the design of goodsocial programs are provided in Box 4.
8/6/2019 Argentina Rural Poverty Labor Market 062105 2
Social programs are plentiful in Argentina. Different ministries administer a largenumber of programs, such as the Ministries of Labor (5 employment programs), SocialAssistance (22 programs), Education (2 compensatory education programs), Health (29 programs), and Agriculture (9 rural development programs). It is clear that fewer, stronger,and more consolidated programs are needed to assist the poor in building key assets and
provide social protection. The current government has recently initiated this process, but sofar no particular attention has been given to the rural population and their needs.
The federal financed workfare program, Jefas, is the largest social program inArgentina. Jefas was the main public safety-net response to the severe economic and political crises at the end of 2001. It is designed to provide direct income support (amonthly subsidy of 150 pesos or 55 dollars) for unemployed heads of household that abide by certain rules. The target group is unemployed heads of household with children under 18 or disabled children of any age and single mothers.21
The Jefas program represents recognition of the fact that the 2001 recession has
increased official unemployment and a large share of the population fell below the povertyline and the indigent line. The Jefas program imposes a number of conditions aimed atensuring its effectiveness and reducing corruption: (1) applicants must present a swornstatement demonstrating that they are unemployed, as well as certificates to prove thattheir children are attending school and have received their vaccinations; (2) applicantsmust register for the subsidy in person, rather than through intermediaries; (3) beneficiarieswill be required to carry out community work for four hours per day and/or participate intraining courses designed to increase their employment prospects; (4) small companieswhich offer jobs to unemployed heads of household will be required to sign a six-monthcontract with the employee, in exchange for which the company will receive the 150 pesosubsidy in partial payment of the individual’s salary; and (5) representatives of local
government, the UN, church bodies, trade unions, neighborhood groups andnongovernmental organizations (NGOs) will participate in local consultative councils toreview applications and ensure that subsidies are not granted to individuals who areemployed or who already receive pensions or other unemployment benefits. Aconservative estimate of the annual cost of the subsidy is 1.3 billion pesos.
In order to finance the program, export taxes on grains and oilseeds were increasedfrom 10 to 20 percent, and those applied to vegetable oils and meals increased from 5 to 20 percent in 2002. The government anticipated that these increases would generate at leastUS$1 billion per year in additional revenues, nearly sufficient to finance the subsidy.
The Jefas program represents recognition of the state's obligation to provide aminimum safety net to alleviate poverty. If it is successful in avoiding past practices of corruption and political patronage, it may help to stimulate a modest rise in consumer demand and lessen the impact of the present crisis. The Jefas program is widely seen assuccessful as it reduced aggregate unemployment, although it moved as many people into
21 It is planned to extend Jefas to unemployed youths and to those over 60 who do not receive pensions.
8/6/2019 Argentina Rural Poverty Labor Market 062105 2
the workforce from inactivity as it did people who would otherwise have been unemployed(Galasso and Ravallion 2003).
22The authors also find that the Jefas program partially
compensated losers from the crisis and reduced extreme poverty (the research wasundertaken with the household survey dataset that only cover urban areas).
With support from the World Bank, the program expanded rapidly to cover abouttwo million households by late 2002. Despite Jefas being the program with the bestmonitoring system, the information gathered by the program does not allow disaggregationof coverage into rural and urban areas.
Provinces in Argentina are divided in departments and departmental informationindicates that the coverage of Jefas is highest in departments with 2,000-6,000 inhabitantswhere 7 percent of dwellers are covered and lowest in departments with less than 2,000inhabitants where 4 percent of dwellers are covered (Table 6.6). In dispersed rural areas,only 3.9 percent of household heads received Jefas in 2003, 4.2 percent of male heads and3.5 percent of female heads (see Table 6.7). Data also reveal that large variations exist
across provinces. Provinces with the least rural poverty received less Jefas than other provinces. In Santa Fe and Mendoza provinces, 1.0 and 2.5 percent of the household headsreceived Jefas while in Santiago del Estero and Chaco 5.6 and 7.3 percent, respectively,received Jefas. Moreover, 1.3 percent of nonpoor household heads (measured by income)received Jefas and 5.4 percent of income poor heads received Jefas. These findingstogether with findings from Section 4 (P0 for rural households are much larger than for urban) indicate that rural areas are under covered compared to urban areas in Argentina.Field visits to rural areas in Chaco, Mendoza, and Santiago del Estero confirm thisobservation.
Table 6.6: Coverage of Jefas by Departmental Population, Argentina, 2003
Inhabitants in departments Beneficiaries CoverageLess than 2,000 0.03 0.04
2,001 – 6,000 0.10 0.07
6,001 – 10,000 0.12 0.05
10,001 – 20,000 0.22 0.06
20,001 – 40,000 0.18 0.05
40,001 – 80,000 0.16 0.05
80,001 – 12,000 0.06 0.04
More than 120,000 0.14 0.05Source: Own calculations based on data from Ministry of Employment. Coverage= #beneficiaries/total
22 Galasso and Ravallion (2003) assesses the Jefas program in urban areas only due to lack of data on ruralhouseholds.
8/6/2019 Argentina Rural Poverty Labor Market 062105 2
Table 6.7: Share of Household Heads Receiving Jefas in 2003Dispersed Rural Areas in Argentina, (Percent)
Mendoza
Santiagodel
EsteroChaco
SantaFe Total
Share of Household HeadsReceiving Jefas 2.5 5.6 7.3 1.0 3.9
Source: Own calculation based on RHS 2003.
In Argentina, rural development programs are managed by the Agriculturalsecretariat (SAGPyA), Ministry of production, and the National Institute of AgriculturalTechnology (INTA). The majority of rural development programs emerged in the 1990sand aimed at assisting small farmers in order to increase production. Rural development programs provide subsidies, credits, technical assistance, training, and organizationalcapacity. National rural development programs PSA, PROINDER (see Box 3),
PRODERNOA, and PRODERNEA use a holistic approach to improve the livelihood of small farmers by providing several tools simultaneously to improve their production andliving conditions. PROINDER, PRODERNEA, and PRODERNOA are specificallytargeting the rural poor, identified by households with UBN. The program’s technical staff is extremely committed to reduce rural poverty, but programs lack resources to reach allneedy households. Programs may benefit from evaluation and improved coordination.Apart from national level programs, provinces also have their own rural development programs. For example, programs in Chaco province are primarily devoted to livestock and agriculture development.
23 24
Social or rural development programs lack for rural workers. Rural work is
regulated by specific resolutions passed by the National Commission for AgriculturalWork (Comisión Nacional de Trabajo Agrario, CNTA) and approved by the NationalCongress. CNTA is an autonomous agency composed by representatives of the nationalgovernment, employers, and employees. In 1999, the national congress passed the “rural
23 For example, Programa Hortícola para el Este Provincial (Horticulture program for the east of the province) aimed at developing 5.000 ha of crops through investments in irrigation systems and machinery, El
Programa Frutícola para el Este Provincial (Fruit program for the east of the province) aimed at planting1.000 ha of citrus and other species, Programa Frutícola para El Impenetrable (Fruit program for theimpenetrable region) aimed at investing on 200 fruit farms, and Programa Provincial de Siembra Directa
(Direct sawing program) aimed at modernizing farm technology. Moreover, Chaco has forestry,desertification, protection, and fishery programs. Chaco is also implementing a program to formalize and
regularize the use and tenure of fiscal lands. 24 For example: Programa Ganadero del Noroeste (Livestock program for the Northeast) aimed at improvingthe socioeconomic situation of 700 small goat farmers , Proyecto Apícola (apicultural project) that promotesapicultural development, Programa de Desarrollo de la Producción Láctea (dairy development program) focused on middle size producers. It contemplates the construction of one model dairy farm and investmentson 80 dairy farms and two milk fields. It is also aimed at building six farmyards to host livestock atemergencies, Programa de manejo de aguas superficiales en campos de pastoreo (superficial water management program), and Programa de pastoreo racional intensivo (program for intensive grazing).
8/6/2019 Argentina Rural Poverty Labor Market 062105 2
worker license” law (Law 25,191), aimed at regulating different aspects of the hiring process of permanent, temporary, and harvest workers. Law 25,191 filled a vacuum in theagricultural labor legislation, because the previous law (22,248) only regulated labor conditions for permanent workers. Law 25,191 also established unemployment insurancefor rural workers funded by employers’ contribution. Before the act/law rural workers
lacked unemployment benefits because they were not included in the labor law thatregulated other sectors of the economy. In 2001, the national congress established the National Record Office of Rural Employers and Workers (RENATRE) in charge of making effective the rural worker license. The objective has been to combat informalemployment and increase protection of workers. Brondo and Luparia (2001) estimates that1.5 million agricultural workers are engaged in the informal sector, but recognizes thedifficulties of getting accurate data. Neiman (2003) finds that for a sample of five provinces, more than half of the rural workers have salaries 30 percent below the minimumsalary established by law, about 25 percent receive salaries according to the maximum andminimal legal levels, while 20 percent earn salaries above the maximum legal threshold.
25 The RHS reveals that only 17.5 of workers in the agricultural and livestock sector were
engaged in formal employment in dispersed rural areas.
25 This does not mean that approximately half of rural workers are formal (paying contributions to socialsecurity).
8/6/2019 Argentina Rural Poverty Labor Market 062105 2
Box 3: PROINDER’s principal achievement n terms of improving living and productive conditions for the beneficiaries of the PROINDER programs
Direct financing to beneficiaries through the Programa Social Agropecuario’s Rural Initiatives Support Fund(FAIR) took place from 2000 to May 2005, in 5861 subprojects involving 40,843 families of small farmers andagricultural migrant workers in 21 provinces. An evaluation carried out in 2002 based on a sampling of thesesubprojects, a year and a half after their start-up, showed the following results:26
• Evolution of the social and organizational level of groups: the organizational level of 39% of the groups
has increased. They have progressed from being groups with no prior organization, to stages with an earlylevel of organization, and to a lesser extent a consolidated organization, which provides them with greater management capacity to advance their interests in political and commercial arenas.
• Joint purchase of goods or joint sale of products: the number of groups that purchased and/or sold jointlyincreased by 36%. Joint purchases of goods, even among different groups of producers, resulted in alowering of the costs foreseen in the original design of the subprojects, which also permited an increase ingoods purchased and/or in improvements made.
• Investments in productive infrastructure: stemming from investments financed through different types of subprojects, the productive infrastructure owned by groups increased by 22%, reaching as high as 39% insome provinces. Taking into account the limited on-farm investments at the start-up of each subproject, theinvestments in productive infrastructure are considered to have enabled significant increases in productivity
such as those listed below:
Number of products for on-farm consumption: the number of products increased by 46%. This indicator relates directly to the existence of improvements in the quality of life at the family level, since it allows thediet to be diversified and increases on-farm “non-monetary income” (valuing of on-farm consumption).
Equivalent amount of production for on-farm consumption: the increase in the value of production for on-farm consumption totaled 34%.
Number of products for sale: the number of products and/or by-products for sale increased by 32%, whichclearly indicates an increase in productive diversification.
Income from sales: with regard to the amount of income obtained from marketed products market, a positive trend is observed throughout the entire country, totaling 11%. However, this result stems from ahigh level of inter-provincial variability, linked to various reasons: (i) provinces where products slated for market were few and are increasing, consequently the increased amount obtained from sales expands; (ii) provinces in which commercial products predominate but faced a crisis in prices and where it has beendifficult to sustain income from sales even though additional products have been incorporated into thelivelihood strategy. Despite these results, producers state that, without the subproject, their situation would be one of a serious deterioration of their income level.
Another significant contribution to the improvement in productivity was the PROINDER’s subcomponent of Research in Appropriate Technologies for Small Farmers, which carried out 33 adaptive research studies between2001 and 2004. An analysis of the research results, using 4 basic indicators (increase in income, productivityand/or quality of production, savings in labor and/or inputs, and improvement in the sustainable use of naturalresources) shows the following results:
• 70% of projects produced some improvement in a given indicator.
• 45% of projects showed simultaneous improvements in more than one indicator.• 44% of projects showed increases in income.
• In 60% of projects, productivity and/or quality of production increased.
• 28% produced some type of savings (labor and/or inputs).
• 35% increased the sustainability of natural resource use.
Source: Aparicio and Tapella (2002)
8/6/2019 Argentina Rural Poverty Labor Market 062105 2
Better targeting requires different approaches for different programs. For universal programs, such as education, health, and urban services, the targeting of public spending can be improved without abandoning universality. True universalization of services from whichthe poor are mostly excluded is, in fact, synonymous with targeting the poor for serviceexpansion.
Several principles are useful to follow. First, public spending should focus onspending items that disproportionately benefit the poor (such as schools, health facilities,and water supply in poor areas, or education initiatives targeted at reducing repetition ratesin school). Second, some government services could require cost recovery for the nonpoor.
For insurance programs, such as pensions and unemployment insurance, contributions and benefits should be set such that public funds are used only for transfers targeted to the poor.Income transfers and related programs should be strictly tied to a means-testing procedure.In particular, public spending for income transfer programs should be focused on the very
poorest. Third, often an effective way of targeting the poor is to provide goods, which arenot well liked by the nonpoor, such as cheap but nutritious food.
There needs to be rigorous monitoring of the efficiency and effectiveness of social programs. Demand and willingness to pay serve as the basic guidelines to estimate program benefits. Investments and current transfers should be compared based on cost–benefit andtransfer effectiveness analyses. Redistributive objectives should not be used to justify badinvestments. Social investments should pass an efficiency test demonstrating that they aremore cost-effective than income transfer programs in bringing monetary or nonmonetary
benefits to the poor.
The design of social programs should correspond to the demand of the beneficiary population and include genuine beneficiary participation. In general, this implies that service provision should be at the level of willingness to pay. Cash and voucher programs are preferable to in-kind service provision, unless better targeting or externalities justify thelatter. In some cases, a switch from in-kind to voucher financing can be an effective mean toincrease transparency, consumer choice, competition, and internal efficiency. Beneficiary
participation in program design, implementation, monitoring, and evolution is essential.
An increasing share of social policy is implemented at the provincial and municipallevel, especially in education, health, and social assistance. Thus, any social spending
reform must include reforms at the state and municipal level. Social spending reform at the provincial and municipal level revolves around three objectives. First, reforms shouldimprove incentives for providing service to the poor. This could include conditional cashtransfers. Second, the responsibilities of the different levels of government should beclarified where they are unclear. Finally, reforms must attempt to strengthen the capacity of states and municipalities to deal with poverty-related issues.
Source: World Bank (2001).
8/6/2019 Argentina Rural Poverty Labor Market 062105 2
Argentina has 17 indigenous peoples’ groups distributed throughout the country.The most important indigenous peoples are Kolla, Mapuche, Toba, and Tupi-Guarani. The National Population Census of 2001 included a specific question on self-identification of ethnicity. Preliminary figures indicate that 3.5 percent of households recognize the presence of an indigenous member. Hence, nearly 100,000 households have at least one
indigenous member.
The majority of indigenous peoples live in rural areas and their living conditionsare worse than other rural-dwellers. Health agents argue that infant mortality is about 30 percent among indigenous people. Despite important improvements at the national and provincial levels in recognizing indigenous peoples’ rights and land regularization, thereare few other effective policy actions aimed at improving their livelihood. At the nationallevel, four programs specifically target indigenous people, and the largest is Desarrollo de
Comunidades Indígenas (indigenous communities development), which is aimed atcommunity development and natural resource management in indigenous communities.The pilot project is implemented in Salta, Neuquén, and Tucumán. Finally, indigenous
people are also reached by social protection and rural development programs such as PSA(Box 5), Pro-Huerta, Jefas, and pensions. However, coverage information for indigenous peoples is not available. Since rural dwellers are under covered, it seems likely thatindigenous people are also. Field visits to Chaco and Mendoza confirmed this hypothesis.
8/6/2019 Argentina Rural Poverty Labor Market 062105 2
Box 5: Experiences with indigenous peoples, woman and youth groups since the start of PSA-PROINDER
Indigenous PeoplesPROINDER continues and expands upon the work that, since the establishment of the Social Program for
Agriculture (PSA) in 1993, had been started with indigenous communities. PSA-PROINDER is consideredthe only program that offers aboriginal beneficiaries the opportunity to participate in decision-making. Nationwide, 5500 indigenous people participate in on-farm consumption and infrastructure investmentsubprojects, especially for irrigation water, handicrafts centers, and land improvements. Over half of these beneficiaries are from the Province of Salta, with aboriginal communities representing 70% of this province’stotal beneficiaries.
Formosa’s Provincial Coordination Unit, which evaluates and approves subprojects, has 20 indigenousdelegates. From 1998 to 2001 the Project for Experimentation and Provision of Water to AboriginalCommunities was carried out, benefiting 768 families (around 3840 people) with hydraulic works in 34communities. This signified the resolution of water problems in the communities, and the training of 30indigenous technicians from different ethnic groups in drilling and in the design and generation of appropriate technology. The project was executed by means of coordinated efforts among the region’s NGOs(APCD, the Zonal Training Center–CECAZO, the Parochial Team for Aboriginal Pastoral Issues–EPPA, theInstitute of Popular Culture–INCUPO, the National Institute of Indigenous Affairs–INAI-), and the NationalUniversity of Formosa.
Rural WomenAs of the year 2000, women beneficiaries of PSA totaled 10,000 throughout the country, representing 28% of all recipients of financing both for subprojects supporting production for on-farm consumption and for sale.From 2001 to 2005, PROINDER was able to benefit 20,000 rural women, representing 40% of the country’stotal beneficiaries. In parallel, it helped them increase their participation, managerial and organizationalcapacity, resulting in concrete achievements with regard to productive issues (greater participation by womenwith their products being presented at regional and provincial fairs) and other aspects of quality of life(housing, schools, health centers, scholarships, etc.).Systematic work has also contributed to a marked increase in women’s self-esteem and sense of self-worth,together with a recognition of the rights of women in general and of rural women in particular. Over the
years, this process has become institutionalized. Currently, a peasant woman and a technician are participating in the Coordination Unit of the Latin American Network of Rural Women. This unit alsocoordinates the National Network of Female Technicians and Institutions working with Rural Women— TRAMA—which brings together 100 female agricultural technicians from 27 governmental and non-governmental institutions. In 2004, the PSA introduced an exclusive line of financing for groups of women,stemming from the recognition of their double role as producer and housewife, with the objective of alleviating their housework. Over 50 subprojects are currently being formulated throughout the country, outof the 150 planned for 2005.
YouthWith regard to youth, systematic work began in 2004, and rural youth were incorporated as specific actors, to be financed by PSA–PROINDER, since PROINDER’s original formulation did not include financing for thisgroup. The PSA–PROINDER work process showed a clear need to incorporate an exclusive line of
subprojects for youth. Since that time and to date human resources have been trained (technicians as well asyouth) on productive issues (agricultural and non-agricultural) and on youth-specific issues. This process isaccompanied by the development and dissemination of specific materials (specific teaching material,dissemination of existing studies and bibliographic material). Sixty subprojects, out of the 150 planned for
2005, are in the process of being formulated and appraised.Source: PROINDER (2005)
8/6/2019 Argentina Rural Poverty Labor Market 062105 2
Two issues, targeting and institutional arrangements, arise in the implementation of the poverty alleviation strategy. Targeting seeks to reduce costs by limiting benefits only tothe desired beneficiary group. Clearly, for targeting to be efficient the administrativemechanism must not be so costly that it offsets savings from excluding the nonneedy. InArgentina, targeting can be effective if based on individual or family characteristics.
The seriousness of the poverty in rural Argentina calls for the active participationof all resources, including NGOs. According to Organizaciones de la Comunidad
(CENOC) 2615 civil society organizations are operating in rural areas in Argentina and 38 percent are located in the Pampeana region, 25 percent in the Northwest, 14 percent in the Northeast, 12 percent in the Cuyo region, and 11 percent in Patagonia. NGOs in ruralArgentina cover different fields, such as Fundación Solidarida that assists groups of rural-dwellers in improving their production and livelihood, and Fundapaz that providestechnical assistance and economic support to small farmers.
Responde is another important NGO that works on recuperating villages at risk of
disappearing, by for example assisting in improving the livelihood of rural-dwellers.Communities at risk of disappearing exist in all provinces, but they are highly concentratedin the Pampeana region and surrounding provinces (Box 6). Reasons for their disappearance are multifold, but the main reasons are: (i) termination of key economicactivities, (ii) closing of railway stations, (iii) isolation from paved roads, and (iv) lack of employment opportunities.
8/6/2019 Argentina Rural Poverty Labor Market 062105 2
Box 6: Villages at Risk of Disappearing in Argentina
Source: RESPONDE www.responde.org.ar
Nussbaumer (2004) studies reasons for out-migration and changing settlement patterns in rural locations in Chaco province. The majority of the recorded migrant population left their communities of origin due to lack of employment opportunities andthe low household consumption level and poverty that followed. Owners of large farms(more than 1,000 ha) used to have many families working and living on the farm. Other factors were the disappearance of typical peasant agrarian products such as cattle, goats, poultry, charcoal, and timber as local stores closed, lack of road maintenance of roads, lack of access to water, reduced health assistance (it used to be common to find at least a
sanitary agency in the majority of parajes27 ). far away from secondary schools andcommunication services. Finally, loneliness and changing cultural patterns amonggenerations has also been mentioned as key factors for depopulation in rural Argentina. Insum, the people leave rural areas due to the deterioration of the living conditions that issaid to be mirroring the lack of developing strategies.
8/6/2019 Argentina Rural Poverty Labor Market 062105 2
7. Labor Markets and Income Generation in Rural Areas
Labor is poor people’s most abundant asset and it accounts for the majority of their total income. Nonetheless, the poor are constrained in their labor use in a number of ways:lack of jobs, low wages, and wage discrimination especially for female and indigenousworkers. The poverty analysis reveals that many workers in Argentina, particularly thosein the informal sector, are poor despite full-time work (Section 5). The challenge of creating employment is therefore to increase worker productivity and tighten the labor market for competitive wages to lift the employee’s household out of poverty.
Rural labor markets are important for poverty reduction in rural Argentina.Employment is key to lifting poor rural families out of poverty. Rural labor markets can beanalyzed in many ways. One way is to consider the agricultural and nonagricultural sector or the nonfarm sector. Rural nonfarm employment has been traditionally seen as a low productivity sector, producing low quality goods. The sector, in this view, is expected toshrink as the economy develops and incomes increase. However, recent research shows
that the rural nonfarm sector has a positive role in absorbing a growing rural labor forceand slowing rural-urban migration. Moreover, the nonagricultural sector contributes tonational income growth and in promoting a more equitable distribution of income(Lanjouw and Lanjouw 2001). Lanjouw and Lanjouw also find that the nonagriculturalsector is large and growing in developing countries. In Latin America alone 47 percent of the labor force in rural settlements and rural towns are employed in off-farm activities.Moreover, 79 percent of women in the Latin American rural labor force are employed inoff-farm activities. In terms of income the rural nonfarm sector is providing more incometo the poor than to the nonpoor.
In order to have a good understanding of the livelihood of rural poor it is necessary
to address their different livelihood strategies. This has crucial importance for policyrecommendations. There are at least three types of rural poor livelihood strategies inArgentina: (i) on-farm—agricultural based livelihood—where 15 percent of the total population (16 and 84 percent poor and nonpoor respectively) are engaged full time; (ii)off-farm—agricultural and nonagricultural employment and subsidies—where 21 percentof the total population (59 and 41 percent poor and nonpoor respectively) are engaged fulltime; and (iii) a combination of (i) and (ii) where 65 percent of the total population (53 and47 percent poor and nonpoor respectively).28 Unfortunately, no data for poor rural peoplein Argentina are available on social capital, access to markets and institutions thereforethese areas are not included in the analysis. This section attempts to address these threelivelihood strategies and it is organized in three subsections addressing: first,
characteristics of the rural labor force; second, rural employment, including correlates of participation in rural nonfarm employment; and, third, wages and income in rural areas,including factors explaining rural labor income and the agricultural sector and factorsexplaining agricultural producer income.
Findings from this section show that the poor allocate a lower share of their labor tofarm sectors than nonpoor do, but still around 70 percent work in agriculture, and the vast
8/6/2019 Argentina Rural Poverty Labor Market 062105 2
majority of rural workers are engaged in the informal sector. Employment analyses showthat women have higher probability than men to participate in rural nonfarm activities andthey are not confined to low-return employment. Moreover, involvement in the nonfarmsector is related to education attainment; as it increases so does the likelihood of beingemployed in the nonfarm sector. Workers living in poorer regions with land access are
less likely to be employed in the nonfarm sector. Labor income analyses reveal that labor markets pay lower returns to poorer than to richer women and returns to education areincreasing with increased level of completed education and income level. Moreover,employment analyses show that nonfarm income and employment is highly correlated withgender, skills, household size, and education. Finally, agricultural producer incomeanalyses reveal that producers’ income is monotonically increasing with land size and withcompleted education level, and positively correlated with road access and use of electricity,fertilizer, and irrigation.
CHARACTERISTICS OF THE RURAL LABOR FORCE
The rural labor force is highly feminized. Women are highly engaged in the rurallabor market in Argentina; 47.6 percent of the rural labor force is women (Table 7.1). The participation of family and unpaid workers is relatively low in Argentina compared toother developing countries.
The skill level of the rural labor force is low in dispersed rural areas. The averageyears of education of the employed in dispersed rural labor force reached 6.7 years in2003. The male and female workers that completed at least primary education reached64.2 percent (Table 7.1). Only 8.5 percent of the rural labor force completed secondaryschool in dispersed rural areas.
Table 7.1: Labor force in Dispersed Rural Areas in Argentina, 2003 (percent)
Self-employment is widespread in rural areas. Table 7.1 reveals information on the
labor status of the rural population. In 2003, self-employed accounted for 46.3 percent of the employed labor force, salaried workers for 41.5 percent, employers for 8.4 percentwhile unpaid family workers accounted for 3.7 percent.
RURAL EMPLOYMENT
Agricultural employment has fallen since the early 1990s. According todemographic censuses agricultural employment has roughly fallen by 34 percent from1991 to 2001. Moreover, agricultural labor markets are highly seasonal in Argentina and,many rural workers are employed only part-time in agriculture.
Table 7.2: Distribution of Workers among Sectors DispersedRural Areas in Argentina, 2003 (percent)
Male Female TotalSample
Industry 4.2 5.8 4.4
Services and Commerce 9.8 36.0 15.3
Agriculture andLivestock
77.1 50.4 71.6
Public Administration 3.4 6.3 4.0
Other Sectors 5.6 1.5 4.7
Total 100 100 100Source: Own calculation based on RHS 2003.
Agriculture is still the main employer in dispersed rural areas. In Table 7.2, theeconomically active population in dispersed rural areas is broken down by sector of principal activity (occupation). In 2003, 71.6 percent of the working population wasengaged in agricultural activities, the vast majority in cultivation. Moreover, the greater part was males, 77.1 and 50.4 percent of the rural males and females respectively wereemployed in agricultural activities (Table 7.2). Turning to rural nonfarm activities, weobserve that 4.4 percent of the working age population was primarily engaged inmanufacturing, 15.3 percent in services and commerce, and 4.0 percent in the publicadministration in 2003.29 In total, about 28.4 percent of the rural working population wasengaged in nonagricultural activities as a primary activity. These estimates are likely to be
conservative estimates of the importance of nonagricultural activities because they do notinclude nonfarm activities that are secondary.
The nonpoor people are slightly more likely to be employed in agriculturalactivities than the poor and indigent in dispersed rural areas. While 67.6 percent of theworking poor are employed in agricultural activities, more than 76 percent of the nonpoor are active in this sector (Table 7.3).
8/6/2019 Argentina Rural Poverty Labor Market 062105 2
Table 7.3: Sector of Employment and Poverty ConditionDispersed Rural Areas in Argentina, 2003 (percent)
Indigent Poor Nonpoor
Industry 4.7 5.4 2.9Services and Commerce 16.7 15.9 14.6Agriculture and Livestock 71.2 67.6 76.3Public Administration 1.9 4.3 3.6Other Sectors 5.5 6.5 2.6Source: Own calculation based on RHS 2003.
Considering the distribution of rural labor by status and farm and nonfarmhouseholds, the RHS reveals that the majority of household heads of the nonfarmhouseholds are salaried workers and a few are self-employed (Figure 7.1). Of the farmhouseholds 30 percent of household heads also offer their labor to the market.
Figure 7.1: Household Activity and Labor Status in Dispersed Rural Areas, 2003 (percent)
Source: Own calculation based on RHS 2003.
The majority of jobs in dispersed rural areas are informal in nature. The share of the rural workforce engaged in the formal sector is affected by crises and stagnation in production, as these events tend to increase both unemployment and informality. In 2003,only 28.3 percent of Argentina's heads of household in dispersed rural areas was engagedin the formal labor market.
The rural nonfarm sector is very important for income, employment and povertyreduction in Argentina. The significance of rural nonfarm activities is being increasinglyrecognized in the development literature and in applied programs.30 Today’s industrializedcountries have highly diversified rural areas, with agriculture as only one of manyeconomic activities. Also, rural nonfarm incomes and employment have expanded rapidlyin middle income countries. According to Reardon, Berdegué, and Escobar (2001), in the1990s, incomes in the rural nonfarm sector accounted on average for around 40 percent of
rural incomes in Latin America. In Argentina both the poor and nonpoor receive a largeshare of their incomes from the rural nonfarm sector; 46 and 32 percent respectively (see below).
The rural nonfarm sector is key to solve a series of issues in rural areas. According
to Lanjouw and Lanjow (2001) these are: first, the rural nonfarm sector has a potential toabsorb a growing rural labor force; second, the rural nonfarm sector can slow down rural-urban migration; third, the rural nonfarm sector’s contribution to national growth; andfourth the rural nonfarm sector can promote a more equitable distribution of income. In thefollowing subsection nonfarm employment and incomes is addressed in more detail.
Rural nonfarm activities account for an important share of employment in ruralareas in Argentina. In 2003, about 25 percent of the rural working population declarednonfarm activities as their primary source of employment (see above). These figures arelikely to be highly conservative estimates of the importance of RNF activities because theydo not take into account seasonality and do not consider secondary occupations. Also, the
figures refer to a definition of rural as disperse areas. Including grouped or semi-urbanareas, the share of workers declaring nonfarm activities as their primary occupation wouldrise significantly. In Mexico, for example the number increases from 44 to 55 percent.
Correlates of Participation in Rural Nonfarm Employment
What determines what type of workers is most likely to seek employment outsidethe agricultural sector? This section examines factors, which are associated withemployment in nonagricultural activities in dispersed rural areas in Argentina. We presentan exercise carried out on the basis of the RNS 2003, using a probit model to determine the probability of individual involvement in non-farm activities as primary occupation,
conditional on a range of personal, household and geographical characteristics. Thespecification of the model draws on findings from the poverty analysis, which suggeststhat the choice of primary occupation is affected by for example education and gender.Rather than reporting the parameter estimates, which are difficult to interpret on their own,Table 7.4 presents the marginal effects associated with each explanatory variable. Thesecan be interpreted as indicating the effect of a percentage change in the explanatoryvariable on the probability of involvement in nonfarm business activities, taking all other variables in the specification at their means.
31Because of limitations in the RNS survey,
some important variables cannot be considered, including ethnicity and social networks.
8/6/2019 Argentina Rural Poverty Labor Market 062105 2
University complete 0.434 0.000 -0.041 0.000 0.524 0.000
Skills
Age 0.010 0.000 -0.003 0.000 0.002 0.000
Gender
Male -0.202 0.000 -0.246 0.000 -0.017 0.000
Land
Land per capita -0.001 0.000 -0.001 0.000 0.000 0.660Family characteristics
Family size -0.013 0.000 -0.013 0.000 -0.003 0.000
Region
Mendoza 0.055 0.000 -0.033 0.000 0.102 0.000
Santiago del Estero 0.196 0.000 0.135 0.000 0.108 0.000
Chaco 0.288 0.000 0.172 0.000 0.187 0.000
Pseudos R2: 0.118 0.160 0.074 Notes: Excluded categories: No education or primary incomplete and Santa Fe.(1) Low-productivity nonagricultural employment: average monthly nonagricultural labor income is below the
poverty line (2) High-productivity nonagricultural employment: average monthly nonagricultural labor income isabove the poverty lineSource: Own calculation based on RHS 2003.
Findings from above and recent research have shown that the nonfarm sector canoften be seen as a source of both high-return employment as well as a “last resort” option(see Ferreira and Lanjouw 2001). Therefore, following Ferreira and Lanjouw, this paper presents estimations of two additional models with the same specification of regressor, butdifferentiating between high-return nonfarm activities as opposed to low-return nonfarmactivities. The nonfarm subsectors are designated as either high return or low returndepending on the average monthly earnings accruing to the individuals whose primaryoccupation is in that sector. If the average monthly labor income is below the poverty line
(see Section 3), the sub-sector is designated as low return, or low productivity sector.Conversely, if the average monthly return from a sub-sector is above the poverty line, thesub-sector is designated as high return.
8/6/2019 Argentina Rural Poverty Labor Market 062105 2
Poor households are often involved in low-return nonfarm occupations. This may be seen as the equivalent of subsistence farming as mentioned by Reardon, Berdegué andEscobar (2001); low productivity, low wage, rather unstable, and with low growth potential. These occupations serve as a survival mechanism for poor households with fewassets.
Table 7.4 presents three probit models linking the probability of a worker having primary employment in nonagricultural wage-labor occupation to a range of explanatoryvariables (age, gender, schooling variables, land, household size, and regional dummies)included in the analysis. In the first model, comprising all combined nonfarm activities indispersed rural Argentina, the dependent variable takes the value of one if the worker is primarily employed in nonagricultural labor and zero if the worker is primarily employedin agricultural labor. The second and third model split those employed in thenonagricultural labor force into two groups; those with a low productivity (low-return) joband those with a high productivity (high-return) job.
Women have considerable higher probability than men to participate in ruralnonfarm activities, but men are more likely to be employed in high-return than low returnoccupations. Considering all nonfarm employment together, men are significantly lessheavily represented in the nonfarm wage-labor force than women, controlling for all other variables (Table 7.4). This finding is different from the poor Northeast Brazil wherewomen are more likely to be represented in the agricultural sector (see Ferreira andLanjouw 2001), but in line with findings from rural Mexico (Verner 2004). After dividingthe types of occupation into two groups depending on whether earnings are lower or higher than the poverty line, men are significantly less likely than women to be employed in low-return nonagricultural activities. This is also the case for high-return nonagriculturalactivities, but the effect is much lower, i.e. the difference between male and female
participation rates is leveling out in the high-productivity nonfarm sector. Hence womendo not have more limited access to high return occupations and are not confined to lowreturn ones in rural Argentina (which is the case in rural Mexico). However, men are morelikely to be employed in high-return than low return nonfarm jobs.
The probability of nonfarm employment rises with increased skill level (proxied byage), controlling for other characteristics. It is positively associated with nonagriculturalemployment in general and high productivity non-agricultural employment, while it isnegatively associated with low productivity nonagricultural employment. Moreover, thereis no evidence that participation begins to decline at a certain skill level or age in ruralArgentina. This finding contrasts with findings from Brazil where older workers have a
smaller probability of being employed off-farm (Ferreira and Lanjouw 2001). However, inrural Argentina the older workers have a smaller probability of being employed in the low- productivity off-farm sector than do younger workers. This is contrary to what occurred inthe high productivity off-farm sector.
8/6/2019 Argentina Rural Poverty Labor Market 062105 2
Involvement in the nonfarm sector is significantly related to education attainment.As education levels rise, so does the probability of being employed in the high returnsector. Findings in Table 7.4 show that the probability of involvement in the nonfarmsector is positively and significantly related to education levels in rural Argentina. Relativeto the non-educated, those with education are generally more likely to find employment in
the nonagricultural sector, controlling for other variables.
As education attainment rises, so does the probability of being employed in thenonagricultural sector (Table 7.4). In the high productivity jobs, the completed primary,secondary, and tertiary education variables are all statistically significant and positive. Ataverage values of other variables, having completed primary education raises the probability of employment in high-return jobs to 19 percent. Raising the level of attainededucation to the secondary level increases it even more. A high school educated workers ismore than twice as likely to be employed in the high-return nonfarm employment as primary educated workers. Moreover, university graduates have a much larger probabilityof working in high-return nonfarm jobs than do secondary school graduates (13 percentage
points). It is important to acknowledge that the exogeneity of education in these modelscan be questioned so more research would be needed to understand employment possibilities in high-productive sectors.
Workers with land access are slightly less likely to be employed in the ruralnonfarm sector. Access to land is also an important factor to determine sector of labor market participation. In fact, Finan, Sodoulet and de Janvry (2002) find that youngeducated men from land-poor households in Mexico are more likely to participate in off-farm nonagricultural employment. For Argentina, the regression analysis presented inTable 7.4 reveals that at average values of other variables, increasing the land holding byone hectare reduces the probability of employment in the nonfarm sector and low-return
jobs by 0.1 percent, which is very little. However, landholders are not significantly more or less likely to be employed in the high-return rural nonfarm sector than people that arelandless
Workers in regions with higher poverty rates are less likely to participate in ruralnonfarm activities. Spatial heterogeneity is large within rural Argentina. Geographyinfluences probabilities of nonfarm sector participation even after controlling for other characteristics. Relative to those living in Santa Fe, workers living in Chaco, Mendoza, andSantiago del Estero are more likely to be employed in high-productive nonagriculturalsectors and nonagricultural sectors generally, controlling for individual characteristics.Mendoza’s rural-dwellers are less likely than those in the Santa Fe to be employed in low-
productivity nonagricultural activities. This indicates that workers in dispersed rurallocalities are not stuck with cultivation only as wage employment opportunities do exist.Improving transport infrastructure that provides access to more inhabited rural or urbancenters may translate into better access to off-farm jobs. For Mexico, Araujo (2003) findsthat interventions in roads are more effective in reducing poverty, through nonfarm ruralemployment in rural municipalities with low value agriculture outputs, but high productivity of labor.
8/6/2019 Argentina Rural Poverty Labor Market 062105 2
Rural poor families seem to have benefited from the opportunities opened by the
rural nonfarm economy. However, data do not reveal if these opportunities were taken up because of the fall in other sources of income, thus substituting for them, or were anaddition to these sources. If they were not additional, the conclusion is that they did not
serve to reduce poverty.
High return rural nonfarm occupations were mostly taken up by the comparatively better off, however, although the poor have also participated in them to some extent.Hence, it is likely that the impact has not been equalizing, and the rural nonfarm sector hascontributed in some measure to the worsening of the rural income distribution. Public and private transfers are a different case. These have definitely helped the poor more than other groups, and have therefore had an equalizing impact.
WAGES AND INCOMES IN RURAL AREAS
This subsection addresses firstly the levels and sources of wages and income inrural Argentina, secondly determinants of wages and earnings for wage workers, andthirdly determinants of incomes of agricultural producers.
In the longer term, the slowdown in Argentina’s rural population growth (seeSection 2) will affect poverty through its broader effects on the labor market. The population growth experienced in previous decades has resulted in an elastic supply of unskilled labor. Moreover, the type of technical change taking place and crop mix chosen by farmers in Argentina is labor augmenting. As a result wage levels have remained low,except for high skilled, well-educated workers, even in times of relatively high economicgrowth.
Wages and incomes are key to escaping poverty in rural Argentina as elsewhere.Table 7.5 shows (i) rural farm and nonfarm wages or entrepreneurial earnings and (2)income from public and private transfers. Both are incomes and the former may indicatecertain dynamism of the rural economy, while the latter points to an expansion of privateand public social protection in rural areas
Farm income is still the most important income source for rural-dwellers inArgentina. The poor and nonpoor in dispersed rural areas receive the largest share of their total income (53.6 and 68.2 percent) from agricultural activities such as farming andagricultural labor (Table 7.5). The rural-dwellers also work as laborers in the nonfarm
sector; the poor and nonpoor receive 12.8 and 19.8 percent respectively of their totalincome off-farm. Remittances and transfers are a significant source of income in general inrural areas; accounting for 19 percent of the poor’s total income, or 7 percentage pointsmore than the nonpoor that receive 12.8 percent of their total income from these sources.Hence, in total the nonfarm income account for 14 percentage points more of the poor’sincome than of the nonpoor’s income.
8/6/2019 Argentina Rural Poverty Labor Market 062105 2
Table 7.5: Households’ Income Shares in Dispersed Rural AreasArgentina, 2003 (percent)
Poor Nonpoor
Independent farming 28.7 50.4
Agricultural labor 24.9 17.8Total agricultural Income 53.6 68.2
Non–agricultural labor 19.8 12.8Other Sources (transfers and remittances) 26.6 19.0Total nonagricultural Income 46.4 31.8Source: Own calculation based on RHS 2003.
Rural-dwellers have a different income source pattern dependent on the regionwhere they live. Figure 7.2 shows that poor and nonpoor households in Mendoza receivethe largest share of their income from agricultural labor. For the poor in Mendoza the shareof income from farm labor is 139, 249, and 434 percent higher than in Santa Fe, Santiago
del Estero, and Chaco respectively. Moreover, rural-dwellers in the poorer provincesreceive a much larger share of their income from remittances and transfers than their peersin richer provinces do. Figure 7.2 also shows that independent farming is more importantfor the nonpoor than for the poor as the share of total income is always higher.
Figure 7.2: Sources of Income in Dispersed Rural Areas in Argentina, 2003 (percent)
0
10
20
30
40
50
60
7080
90
100
Mza.
Poor
Mza.
Non-
poor
Sgo.
Poor
Sgo.
Non-
poor
Chaco
Poor
Chaco
Non-
poor
S. Fe
Poor
S. Fe
Non-
poor
Independent farming Agricultural labor Nonagricultural labor Other
Source: Own calculation based on RHS 2003.
Wages are related to labor status. Formal sector workers, defined as workers thatcontribute to the pension system, earned more than their peers in the informal sector in2003. Moreover, permanent workers earn more than temporary workers in dispersed ruralareas (Table 7.6). Moreover, employers earn significantly more than self-employed andwage earners in both the formal and informal sector. In the formal sector, employers earn
8/6/2019 Argentina Rural Poverty Labor Market 062105 2
roughly double that of self-employed and four times more than wageworkers. Not only do protected formal sector workers receive benefits in form of pensions, but also averagewages are significantly higher compared to those of unprotected informal workers. In theinformal sector, wages are more aligned (Table 7.6).
Table 7.6: Average Annual Earnings for Permanent and TemporaryWorkers in Disperse Rural Areas of Argentina, 2003 (AR$)
Permanent Temporary Formal Informal
Total SampleSelf-employed 4,325.2 1,441.7 7,895.1 2,602.5
Wageworker 3,811.4 1,507.7 4,122.8 2,061.8Source: Own calculation based on RHS 2003.
Male wages are highest in industry, followed by the public administration and
agriculture (Table 7.7). Services pay the lowest wages both to the male and femaleworkers. The highest female wages are paid in the public administration followed byagriculture.
Table 7.7: Average Salary for Wageworkers and Self-employed by Gender Disperse Rural Areas of Argentina, 2003 (AR$)
Male Female
Wageworkers Self-employed
Wageworkers Self-employed
Agriculture &Livestock
3,018.8 3,283.3 3,742.3 1,174.932
Industry 3,650.4 1,335.8 1,513.9 4,834.8
Services &Commerce
1,729.5 4,295.5 1,475.6 1,729.5
PublicAdministration
3,483.9 NA 4,037.6 NA
Other 2,258.2 1,649.6 2,400.0 600
Notes: Exchange rate US$=3 Argentinean pesos (approximation).Source: Own calculation based on RHS 2003.
Formal sector workers receive not only higher wages than do the informal workers;they also receive benefits. More than half of the formal sector workers receive some formof benefits. Of the individual benefits, bonuses and paid holidays are the most important;37 percent of the workers receive this benefit.
8/6/2019 Argentina Rural Poverty Labor Market 062105 2
Child labor still exist in disperse rural areas of Argentina, but at much lower extentthan other countries in the region. International evidence shows that child workers tend to be poor and complete fewer years of schooling than their nonpoor counterparts. Childrenshould not have to work, but an estimated 250 million children are working worldwide.Data reveal that 4 percent of children in Mendoza and Chaco worked in 2003. Hence, child
labor is not a serious problem in rural Argentina and, furthermore, the majority of childrenmay be both working and studying.
Factors Explaining Rural Labor Income
After a short and simple presentation of wages and incomes, this section addressesdeterminants of wages in dispersed rural areas in Argentina. It looks at factors determiningrural wages and investigates the characteristics that differentiate low and high paidworkers. Section 5 showed the importance of education and other personal characteristicsas correlates of poverty. Here the focus is instead on the impact of these characteristics andother context variables on rural wages.
Workers located at different points in the wage distribution are compared toanalyze this issue, using a quantile regression methodology based on the RHS from 2003.Wages are compared across workers grouped by gender, education, experience, labor status, and location. Findings indicate that wages are by no means determined in the sameway for high and low paid workers. For example, female workers are paid much less thanmales working in the high end of the wage distribution relative to their peers in the low endof the distribution, and returns to lower levels of education are far smaller in the upper income quantiles than in the lower ones.
The quantile regression methodology characterizes the distribution of labor income
in more detail than traditional ordinary least squares (OLS) and two stage least squares(2SLS) regressions, as it makes it possible to break down the wage determination processacross the entire wage distribution. Specifically, this section addresses the determinants of rural labor incomes of employees and self-employed, including investigations of differences between low and high paid workers (the next section addresses agricultural producer incomes). Comparisons of workers age—14 and older—located at differentlocations in the labor income distribution shed light on these questions. Labor incomes arecompared across workers organized by gender, education, skills, labor status, sector, andlocation.
Labor incomes are modeled by using log annual labor incomes as the dependent
variable. The general model contains explanatory variables in levels and allows for nonlinearities in the data. For example, the log labor income equation is found to benonlinear in education. In addition, the model contains dummy variables that take the valueof one if, for example, a worker holds a job in the formal sector, and zero otherwise. Sucha dummy variable may reveal whether there is an income premium related to formal sector employment. The 25th, 50th, 75th, and 90th quantiles are used in the analysis. Findingsindicate that labor incomes are by no means determined in the same way for high and low paid workers. Findings for dispersed rural areas in Argentina are presented in Table 7.8.
8/6/2019 Argentina Rural Poverty Labor Market 062105 2
All of the included variables are significantly different from zero for all quantiles.Each explanatory variable will now be discussed in turn: education, experience, labor market association and status, sector, gender, and geographical location.
Having completed primary education contributes to better wages, and the premium
increases rapidly with the level of education attainment. Better-educated individuals inrural Argentina earn much higher wages than their less-educated counterparts. In 2003, theassociation with the wage level of primary, secondary, secondary, and tertiary educationrelative to no or incomplete primary education was positive at all quantiles, controlling for other individual characteristics. Compared to the wages of non-educated workers and thosewith incomplete primary, median wages of workers with complete tertiary education were136 percent higher; the comparable premium for secondary schooling was 72 percent.Workers with complete primary education received a 27 percent higher return compared to peers with no complete education.
32
Returns across the wage distribution vary a lot for workers with complete upper
secondary and tertiary education; i.e. workers with completed primary education(secondary and tertiary education) in the low end of the income distribution are being paidcomparatively less (more) than their peers in the high end. This would seem to indicatethat: (1) there is wide heterogeneity in the quality of education in rural areas across thewage distribution, and (2) the capacity of workers to convert their educational capital intohigher earnings through labor market networks is not very similar for poorer and richer workers. Hence, poor people with secondary education seem to benefit more from goodlabor market connections or social networks than richer people.
33
Workers with complete secondary and tertiary education face decreasing returnsacross the wage distribution, however: those at the low end are paid proportionally more
than those at the high end, indicating that workers with the same level of education are notcompensated equally. The poorest (25th quantile) receive a wage premium whencompleting secondary education of 150 percent, while the richest (90th quantile) receiveonly 89 percent. One possible explanation is that social networks that facilitate labor market connections operate better among the poorer than the richer segments of the rurallabor force.
8/6/2019 Argentina Rural Poverty Labor Market 062105 2
Notes: Excluded categories: no education or primary incomplete, piece-worker, industrial sector, and Santa Fe province. The
percentage return is calculated as (exp (coefficient estimate) – 1) * 100. Number of observations: 514 (weighted: 209,984)
Source: Own calculation based on RHS 2003.
There are several reasons for including experience characteristics in the analysis.One such reason is that a trained and educated workforce provides flexibility in adapting tochanges in technology or other economic changes. Experience and years of schooling arewidely used in analyses of income determination (see Mincer 1974, and Levy andMurnane 1992). The measure of experience included in this analysis is general experiencemeasured by the age of the worker.34
8/6/2019 Argentina Rural Poverty Labor Market 062105 2
General experience—here proxied by the age of the worker—increases wages. Twoquestions are addressed: (1) is experience important in the wage determination process?and (2) are returns to experience homogeneous across workers? According to the findings presented in Table 7.8, the answer is yes to the first question and no to the second one.The experience variable is statistically significant for all reported quantiles, controlling for
other individual characteristics. Returns to experience are low and first increasing and thenroughly falling across the income distribution in rural Argentina. Returns to measuredannual experience are 0.3 percent in the 25
thquantile and 1.2 percent in the 50
thand 1.1
percent in the 90th
quantile.
Workers in the formal sector obtain a significantly higher pay after controlling for other variables. Labor market association is measured by the formality of a worker’s jobstatus. That is, whether a worker is engaged in the formal or informal sector. The positiveimpact on incomes of formality is decreasing across the distribution; a worker placed in the25th quantile obtains an income premium of 66 percent whereas a worker in the 90thquantile and above receives a 17 percent premium. The formal sector generally provides
higher quality jobs than the informal one. Since higher quality jobs may require moreskills, the informal sector variable may be capturing skill differences not signaled by other variables included in the regression. The wage gap may also be due to lower productivityin the informal sector relative to the formal one not captured by education and experience.Hence, workers in the informal sector are disadvantaged in at least two ways: first, they donot have access to social security; and second, they obtain lower incomes, which evidentlydo not compensate informal workers for the absence of social security. Informal sector workers are not only disfavored in terms of incomes and social security, but they may alsowork in an environment where they are more exposed to the risk of accidents occurringand seasonality.
The labor status of workers is another important determinant of wages. All theincluded occupational groups are statistically significant and different from zero. Lookingat the median of the distribution, piece-workers (the reference group) receive 3 percentmore than wageworkers do and 26 percent more than self-employed, controlling for other factors such as level of human capital. For the 75
thand 90
thquantile, the premium-gap
changes in favor of the self-employed; the average self-employed earn a 5 and 24 percent premium, respectively. Hence, regarding labor status there exist substantial differencesacross the income distribution.
Discrimination at an individual level is said to arise if an otherwise identical personis treated differently by virtue of that person’s ethnicity or gender, and ethnicity or gender
by themselves have no direct effect on productivity. Under perfect competition in thecapital and labor markets, equivalent employees in equivalent jobs are compensatedequally, that is, there is no discrimination.
The estimation of discrimination is difficult. Worker productivity is seldom observeddirectly, so data must be used to proxy for the relevant productivity characteristics. Themain debate occurs over whether relevant omitted characteristics differ between ethnicity,and between gender, and whether certain included characteristics capture productivity
8/6/2019 Argentina Rural Poverty Labor Market 062105 2
Source: Caballero (2005)--calculations based on FAO’s AGROSTAT.
Labor productivity in Argentina’s agricultural sector is the highest in the region and
way above the average for LAC countries. Labor productivity is compared across the LACregion in Figure 7.3. Argentina and Uruguay, both land-abundant countries, have thehighest labor productivity, with a labor productivity of US$ 9,461 and US$ 7,807,respectively, which is far more than double the LAC average of US$ 3,368. The highagricultural labor productivity in Argentina are mainly due to factors other than publicexpenditure in the sector, which are only $136 per worker and lower the average for LatinAmerica of US$ 146 per agricultural worker (calculations made in Caballero 2005).
Figure 7.3: Agricultural Labor Productivity1/
in LAC Countries in 2002Measured in 1995 USD per Worker
0
1000
2000
3000
4000
5000
6000
7000
8000
9000
10000
H a i B o l
H
o n
E
c u
E l S a l
G
u a P e r
M
e x N i c
P
a n P a r
R . D . C o l
C
u b B r a
V
e n C h i
C
. R U r u
A
r g .
L A C
Source: Caballero (2005) based on CEPAL (for agricultural value added) and FAO (for agricultural labor force) data assembled by Dirven (2004). 1/ Defined as agricultural value added divided by the agriculturallabor force and measured in US Dollars of 1995.
8/6/2019 Argentina Rural Poverty Labor Market 062105 2
According to an agricultural orientation index Argentina practices expenditurediscrimination against the farming sector. The index is constructed by dividing the share of agricultural spending in total spending by the share of agriculture in GDP (Table 7.10).The index measures the intensity of the fiscal effort in agriculture relative to the economicimportance of the sector. Argentina has an agriculture orientation index of 0.07, or a fifth
of the average of the LAC region (0.33). Argentina, hence, practices public expenditurediscrimination against its agriculture.
Table 7.10: Public Expenditure in Agriculture as Percentage of Total Public Expenditure in LAC Countries, Average 1996-2000
Brazil 0.23
Mexico 1.79
Bolivia 0.41
Colombia 0.06
Peru 0.19
Argentina 0.07Chile 0.37
Costa Rica 0.12
El Salvador 0.08
Guatemala 0.07
Nicaragua
Dominican Republic 0.37
Average LAC 0.33
Source: Caballero (2005) based on data from Kerrigan (2001).
After addressing briefly the agricultural sector as a whole, this sub-section addresses
the determinants of producer households’ income from farm activities in dispersed ruralareas and analyzes whether various individual, sectorial, production, infrastructural, andgeographical characteristics are important for the generation of agricultural producer incomes.
Rural producer incomes generated in agriculture are analyzed by applying anaugmented earnings function method. Producer incomes from farm activities are modeled by using log annual incomes drawn from farming activities as the dependent variable. Thegeneral model contains explanatory variables in levels and allows for nonlinearities in data.Findings are presented in Table 7.11. All included explanatory variables have the expectedsigns and they all are statistically significantly different from zero. Each explanatoryvariable will now be discussed in turn: (1) education; (2) gender; (3) farm size; (4) accessto infrastructure, and (5) access to production techniques.
Are returns to education for producers in dispersed rural areas constant over differenteducation levels?35 According to the findings presented in Table 7.11, the answer is no.Findings allow for comparison of producers with no completed level of education (thereference group) with peers who have completed primary, secondary, and tertiaryeducation. In 2003, returns to primary, secondary, and tertiary education in rural Argentina
8/6/2019 Argentina Rural Poverty Labor Market 062105 2
were statistically significantly different from zero and positive, controlling for other characteristics. Moreover, the premium is rapidly increasing with attained education. Inrural Argentina, an average producer experiences an impact on income of 11, 124, and 185 percent for completed primary, secondary, and tertiary education respectively.36 Hence,more-educated producers earn significantly higher incomes than do their less educated
peers. Given the large difference between returns to completed primary and secondaryeducation, one could suspect that there that some omitted human capital variable is being picked up by education.
Table 7.11: Determinants of Producer Income in Dispersed Rural Areas of Argentina, 2003
Dependent variable: Log Household Farm Income
Marginal impact (%) P>|t|
Gender
Male -7.13 0.00 Education
Primary education complete 10.96 0.00
Secondary complete 124.34 0.00
University studies 185.48 0.00
Land
2-10 hectares 100.77 0.00
11-35 hectares 283.44 0.00
36-100 hectares 312.06 0.00
101-250 hectares 877.67 0.00
More than 250 hectars 1880.63 0.00% rented hectares/ total hectares 0.10 0.00
% owned hectares/ total hectares 0.00 0.01
% shared hectares/ total hectares -1.09 0.00
% occupied hectares/ total hectares 0.40 0.00
Infrastructure and production inputs
Access to a paved road 29.30 0.00
Access to electricity 43.48 0.00
Use fertilizer 25.61 0.00
Access to irrigation 28.27 0.00
Constant 63170.23 0.00Adjusted R2: 0.35
Notes: Excluded variables: No education or primary incomplete and 0-1 hectares. The marginal impact/percentage return
is calculated as (exp (coefficient estimate) – 1) * 100. Number of observations: 124. Source: Own calculation based on RHS 2003.
8/6/2019 Argentina Rural Poverty Labor Market 062105 2
The size of the producer household’s land holdings is also important for the incomegenerated on the farm. The farm size variables are all statistically significant and positive.The regression analysis presented in Table 7.11 reveals that at average values of other variables, income increases with farm size, in a nonlinear fashion. In rural Argentina, anaverage producer experiences an increase in income of 101, 283, 312, 878 and 1881
percent for holding 2-10, 11-35, 36-100, 101-250, and 250 or more hectares respectively,compared to farmers with only one hectare of land. Hence larger farms earn dramaticallyhigher incomes than do their counterparts with smaller farms. However, whether thefarmland is rented or owned has very little measurable effect on incomes.
Farms run by women are more productive (7 percent) than farms run by men indisperse rural areas (Table 7.11). The dummy variable included for male head of households is negative and significantly different from zero.
Access to infrastructural services is important for income generation in disperse ruralareas of Argentina. Farmers with access to paved road and electricity are more productive
and earn statistically significantly higher incomes than do farmers without access. Accessto paved road or electricity increase income by 29 and 44 percent respectively.
The use of productivity enhancing production techniques such as fertilizers andirrigation are also important for increasing income in rural Argentina. Fertilizer use andaccess to irrigation are both significantly positive determinants of farm income, althoughthere may be possible endogeneity at play. Farms that apply these productivity enhancingtechnologies such as irrigation and fertilizers experience 28 and 26 percent higher incomesthan farms that do not use or have access to irrigation or fertilizers respectively.
Summary of Findings
A comprehensive vision of rural development beyond sectoral approaches isforming. The rural world is not only an agricultural world—although it more so inArgentina than in for example Mexico—and the rural economy is not only an agriculturaleconomy; indeed, the combination of economic activities is the dominant characteristic of rural households and communities. Unfortunately, the governments in Argentina have stillnot embraced a more comprehensive view of the rural world, including by changing theinstitutional set up.
The demographic changes and those in the characteristics of the labor force reflecta rural society in transformation––a view reinforced by the increasing extent of migration
(see Section 2). When examining correlates of nonfarm employment in rural Argentina,findings suggest that a key determinant of access to employment and productivity innonfarm activities is education, skills, land access, location and gender. There is strongevidence that educated people have better prospects in both the farm and nonfarm sectors.This is emphasized when nonfarm activities are divided into low return and high returnactivities. Education is a particularly important determinant of employment in the better- paid nonfarm activities. Furthermore, the labor income analysis shows a rather heterogeneous impact pattern of individual characteristics across the income distribution.
8/6/2019 Argentina Rural Poverty Labor Market 062105 2
That is, the magnitude of the affect of an income determinant is different depending on theworker being rich, poor or placed in the median of the income distribution. The agricultural producer income analyses reveal that education is also essential for producers to earninghigher incomes.
It is key that governments assist in augmenting the human capital of the rural-dwellers in more dispersed rural areas so they can improve their productivity. Secondaryeducation has been repeatedly found to be strongly linked to participation in the ruraleconomy, and also to enhance the income obtained from a variety of occupations andtechnical training. This is one more reason to expand the coverage and quality of secondary education in rural areas, in particular for those who are falling behind such asthe extreme poor, indigenous groups, and residents of remote areas. Quality is probably asimportant or more than quality if we want to increase the impact of education.
The agricultural producer income analyses for rural Argentina reveal that farmsoperated by women are slightly more productive than farms operated by men. Moreover,
the size of the producer household’s land holdings is important for the income generatedon the farm and at average values of other variables, income increases with farm size. Aslarger farms earn dramatically higher incomes than do their counterparts with smaller farms. However, whether the farmland is rented or owned have very little measurableeffect on incomes. Additionally, access to infrastructural services (paved roads andelectricity) and use of productivity enhancing production techniques (fertilizers andirrigation) are important for income generation. Farmers with access to paved roads andelectricity earn significantly higher incomes than do farmers without access.
Infrastructure and location characteristics are other important correlates of ruralnonfarm participation where policy makers can intervene. Road connections,
communications, and energy have been shown to be important for the development of therural economy. The lack of key infrastructural services is systematically associated withlower incomes and employment opportunities. This is another reason why raising the lowlevels of investment in rural infrastructure, in particular in grouped rural areas, could payoff. Potentially gains from a spatial policy that favor the concentration of investment andservices and the establishment of links between these and their rural hinterlands are so far untapped in rural Argentina.
Pursuing rural nonfarm growth should not be seen as an impediment or analternative to pursuing agricultural development; there are strong synergies between thefarm and nonfarm sectors. In signaling the importance of the rural nonfarm sector and
advocating for more policy focus on the nonfarm economy, this does not mean that theimportance of agricultural development is reduced. There is no contradiction between thedevelopment of the farm and non-farm sectors as shown in Lanjouw and Lanjouw (2001).What is needed is a comprehensive rural development policy where farm and nonfarm cancoexist and their connections enhance productivity in both sectors.
8/6/2019 Argentina Rural Poverty Labor Market 062105 2
Poor small farmers need assistance to improve productivity and an important factor would be the presence of extensive and well functioning research and extension, increasedaccess to land, and rural finance systems. Moreover, poorer farmers tend to face moremarket failures and need to have services like research and extension, as well as ruralfinance or credit, tailored to their needs. Finally, small farmers and rural poor in Argentina
have never received much attention from governments—they are too few and thereforesupply few votes. Government expenditure on agriculture and nonagricultural activities islow in Argentina, reflecting the traditionally neglect by governments of rural areas, particularly the rural poor and small farmers, despite a fairly strong labor productivity performance of the sector. Hence a rural development strategy is called for that includesspecific recommendations for small farmers and other poor people. In this regard,PROINDER has demonstrated that: (i) strategies need to be tailored to the regional andlocal characteristics of the rural poor and that (ii) interventions aimed at increasing the productivity and sustainability of poor small farmers are viable provided that there isinstitutional support available to them. PROINDER’s data suggest that the approachfollowed has yielded positive results, both in terms of the welfare status of the families
participating in the program as well as from the institutional side, with the establishment of the Comisión de Desarrollo Rural and the drafting of provincial rural developmentstrategies.
8. Conclusion
The analyses of demographic trends, the poverty profile, and labor markets provideguidance on a social inclusion and poverty alleviation strategy for rural Argentina. Rural poverty remains a crucial part of the poverty story in Argentina. Although Argentina is alargely urbanized country, extreme income poverty in rural areas reached 39 percent of the
people or 200-250,000 indigent families. These families tend to: (1) be large, and young,and to escape from poverty as they mature and children leave the household (life-cycle);(2) live largely in dispersed areas where basic service provision is often weak and deliveryis difficult (in particular education attendance beyond 11 years of age falls off very rapidlycompared to grouped rural or urban areas); (3) be more likely to be small landholders thanlandless laborers.
These findings suggest that a rural poverty strategy should be well-focused on thetruly poor families, and on helping young families to make the transition to life in groupedor urban areas. This will require a more targeted focus on education for poor families andon the acquisition of skills required to compete in an increasingly urban world.
Importantly, this strategy would be in concert with the underlying demographic andeconomic forces affecting the distribution of population among rural dispersed, ruralgrouped, and urban areas. Dispersed areas lost 14.5 percent of its population over the lastdecade reaching 2.6 million in 2001, compared to grouped rural areas that experienced an 8 percent increase and reached 1.2 million in 2001. Around 400,000 people left thedispersed rural areas during 1991-2001. Roughly speaking, some 25 percent may have
8/6/2019 Argentina Rural Poverty Labor Market 062105 2
moved to grouped rural areas and the rest may have moved to urban areas. The Pampeanaregion experienced a fall of 24.6 percent and the Cuyo region of 5.1 percent in thedispersed rural population. In the latter region, Mendoza province is an outlier as itexperienced a population increase of 0.3 percent in dispersed rural areas and 32.2 percentin grouped rural areas.
The described distribution profile reveals that poor Argentineans tend to earn alarge share of their incomes from wage labor activities. For the poor, lowreturn/productivity wage labor activities are important. The rural nonfarm sector isheterogeneous and includes a great variety of activities and productivity levels acrossnonfarm jobs. Moreover, nonfarm sector can reduce poverty in a couple of distinct butqualitatively important ways. First, high productivity activities seem to provide rural-dwellers with sufficient income to escape poverty. Second, vulnerable segments of the population, such as women and many of the poorest tend to be concentrated in the low or less productive rural nonagricultural activities, mainly due to lack of skills, educationaldeficiencies, and location disadvantages. These low productivity/return occupations
nevertheless provide a critical contribution to their livelihoods preventing further destitution.
The labor income analysis for rural Argentina shows a rather heterogeneous impact pattern of individual characteristics across the income distribution. That is, the magnitudeof the affect of an income determinant is different depending on the worker being rich, poor or placed in the median of the income distribution. Findings reveal that education iskey to earning higher incomes; more educated workers earn higher incomes than their lesseducated peers.
The agricultural producer income analyses for rural Argentina reveal that also for
producers’ education is key to earning higher incomes; more educated producers earnhigher incomes than their less educated peers, and farms operated by women are slightlymore productive than farms operated by men. Moreover, the size of the producer household’s land holdings is important for the income generated on the farm and ataverage values of other variables, income increases with farm size. As larger farms earndramatically higher incomes than do their counterparts with smaller farms. However,whether the farmland is rented or owned have very little measurable effect on incomes.Finally, access to infrastructural services (paved roads and electricity) and use of productivity enhancing production techniques (fertilizers and irrigation) are important for income generation. Farmers with access to paved roads and electricity earn significantlyhigher incomes than do farmers without access.
When examining correlates of nonfarm employment in rural Argentina, findingssuggest that a key determinant of access to employment and productivity in nonfarmactivities is education. There is strong evidence that the educated have better prospects in both the farm and nonfarm sector. This is emphasized when nonfarm activities are dividedinto low return and high return activities. Education is a particularly important determinantof employment in the better-paid nonfarm activities. It is key that governments assist in
8/6/2019 Argentina Rural Poverty Labor Market 062105 2
augmenting the human capital of the rural-dwellers in more dispersed rural areas so theycan improve their productivity, move, and take advantage of increased job opportunities inother locations than dispersed rural Argentina.
Four-pronged approach to poverty reduction in dispersed rural areas in Argentina
Poverty in dispersed rural areas is maybe not a big problem, but lack of humancapital is. The above-mentioned findings indicate that poverty is a transitory phase, asmobility does exist in rural areas. After the childrearing phase, families “grow” out of poverty as people in the active-age move out and away from dispersed rural areas.Moreover, households with a small landholding are tired down as they are less productivethan non-smallholders i.e. landless or large landholders (with more than 250 hectares).Furthermore, there is little access to services, especially education and health in dispersedrural areas. It is important that the government assists rural-dwellers in moving up theeducation and health ladder in order to increase their asset base. This will make the rural-
dwellers more productive, both if they decide to stay in rural areas or move to urban areasand also reduce or eliminate the opportunity cost of farming own land. Moreover,enhancing the human capital stock of rural-dwellers will make them more likely to escapeextreme poverty.
With good policies, rural extreme poverty should be fairly easy to alleviate byinvesting in children and families and making grouped rural areas more attractive byincreasing the quality of services in grouped rural areas.
It is recommended that the government improve the access and quality of ruraleducation and reproductive health-care and expand the rural development programs so that
the indigent eventually would leave the social programs. Moreover, improving the rural-dwellers’ connections with towns (even in the same rural space, grouped rural areas) is keyfor speeding up migration from dispersed rural areas where public services are scarce andexpensive to supply to all dwellers.
The strategic principles for reducing rural poverty involve seeking to strengthen thekey assets of the poor, taking into account geographic differences in the poverty situationand priorities. The government of Argentina could apply a four-pronged poverty reductionapproach:
First, improve the asset base of the poor households. This requires improvements
in social policies and access to public services. Extreme poor and poor households are atgreat risk of poor or low human capital accumulation. That includes poor health andundesired pregnancies because they lack access to family planning (and clean water andsanitation facilities) and low quality education and education attainment. Target indigentand poor families with transfers linked to education through the secondary level—alongthe lines of the Brazilian Bolsa Escola for primary education. Improved quality of education and access to education can reduce the likelihood of becoming poor, as more
8/6/2019 Argentina Rural Poverty Labor Market 062105 2
education is a key factor in obtaining a higher income in both the farm and nonfarmsectors. Furthermore, education is associated with fertility: the more education a womanattains, the lower her fertility rate and, therefore, the lower the dependency ratio and thelower the likelihood of falling into poverty and, therefore, the lower the dependency ratioand the likelihood of falling into poverty. Special efforts should be made to increase the
level of human capital including: (i) ensure access to high quality healthcare includingreproductive health; and (ii) ensure access to high quality education and primary andsecondary education adapted to the realites in rural areas; including technical or vocatational training components at the end of primary school.
Second, create jobs. Many households are poor because they are trapped on low- productivity land or are in low-paying, low-productivity jobs in the informal sector or unemployed. The workers need more productive jobs and tighter labor markets to raisetheir income above the poverty level. It should be recognized that since very few peoplework in the formal labor market, social policies tied to formal employment or unemployment will have only very limited reach among the poor. Special efforts should be
made to assist in generating rural employment. Much high productivity, labor intensive jobs can be created in the regional economies through improving the provision of publicgoods and improving the environment for collective action in irrigated agriculture amongother things.
Third, facilitate migration to higher opportunity areas, i.e. grouped or urban areas.In addition to education, other mechanisms should be explored to facilitate the on-goingmigration out of dispersed areas. This could range from efforts to improve social linkagesor capital between households in dispersed areas to a program to ensure titling of land for indigent farmers on dispersed lands. In the absence of titles a farmer on dispersed land haslittle chance to benefit from the undertaken land improvements were the farmer to choose
to move to higher opportunity areas.
Fourth, target carefully. Poverty interventions need to target the poor population aseffectively as possible. In view of the trend of population movement out of dispersedareas, the much lower prospects for the development of human capital in these areas, andthe very high cost of providing public goods , government should, to the extent possible,invest in the people, not in the area. The government needs to develop a povertymonitoring system to track living conditions and provide data for (1) impact evaluation of interventions and (2) improving the targeting of interventions. The government should alsoseek to develop a key set of indicators for monitoring actions to reduce poverty. This mayrequire including rural areas in the annual household survey or introducing an annual rural
household survey.
Fifth, increase sectoral integration. For the poverty reduction strategy to beeffective, a high level of sectoral integration is needed at all levels of government. It is of utmost importance that the Secretariat of Economy works closely with other secretariats inthe country so that all changes in poverty indicators, etc. are reflected in the social programs. Finally, in Argentina rural development is a small part of the Ministry of
8/6/2019 Argentina Rural Poverty Labor Market 062105 2
Agriculture. In order to serve other sectors than agriculture a new model is called for witha clear rural strategy or a national policy to address rural issues including rural poverty.
37
One option is to create a Sub-secretariat or Secretariat of Rural Development, as has beenimplemented in other countries in the region for example in Brazil. This together withincreased coordination of programs would increase the impacts individual programs can
achieve. Moreover, the government should establish clear and efficient mechanisms for NGO collaboration. Emerging NGO consortia provide one mechanism, which should beexplored for fostering greater coordination, dialogue, and joint planning with thegovernment.
8/6/2019 Argentina Rural Poverty Labor Market 062105 2
Aparicio, S. and R. Benencia (Coordinadores), 1999. “Empleo Rural en Argentina: viejos ynuevos actores en el Mercado de trabajo”. In Empleo Rural en Tiempos deFlexibilidad, La Colmena, Buenos Aires.
Aparicio, S. and E. Tapella (2002) “Algunos resultados preliminares del monitoreo desubproyectos”. Nacional Coordination Unit, PROINDER, Buenos Aires.
Araujo, C., A.de Janvry and E. Sadoulet, 2003. "Measuring the role of social networks on behavior with an application to rural off-farm employment". Department of Agricultural and Resource Economics University of California Berkeley. Mimeo.
Arias, Omar, K.F. Hollack, and W. Sosa, 1999. “Individual Heterogeneity in the Returns toSchooling: Instrumental Variables Quantile Regression Using Twins Data,”Mimeo, University of Illinois.
Brondo, A. and C. Luparia, 2001. “La libreta del trabajador rural”. In Neimanl G.(Compilador) Trabajo de campo: producción, tecnología y empleo en el mediorural. Ediciones Ciccus, Buenos Aires.
Buchinsky, M., 1998. “Recent Advances in Quantile Regression Models – A PracticalGuideline for Empirical Research". In The Journal of Human Resources, Vol. XXXIII, No. 1, pp. 88-126.
Card, D., 1998. “The Causal Effect of Education on Earnings”. Forthcoming in Handbook of Labor Economics, Vol. 3, Ashenfelter, O. and Card, D. (eds.).
Caballero J. M. (2005) “ Rural poverty in Mexico” .World Bank, mimeo.
CEDLAS, 2004. “Monitoring the Socio-Economic Conditions in Argentina, Chile,Paraguay and Uruguay: Argentina chapter”. Available online athttp://www.depeco.econo.unlp.edu.ar/cedlas/monitoreo/pdfs/argentina1.pdf
Craviotti Clara and S. Soverna, 1999. “Sistematización de estudios de casos de pobrezarural”. PROINDER, SAGPyA, Buenos Aires.
Currie, Janet, 2001. “Early Childhood Development Programs.” In Journal of EconomicPerspectives, 15 (2), pp. 213–38.
Elbers, C., J. Olson Lanjouw, P. Lanjouw and P. G. Leite, 2001. “Poverty and Inequality inBrazil: Estimates from Combined PPV-PNAD Data.” World Bank, Mimeo.
Heckman, James, 1999. “Policies to Foster Human Capital.” Working Paper No. 7288.MA: National Bureau of Economic Research, Cambridge.
8/6/2019 Argentina Rural Poverty Labor Market 062105 2
Finan, F., E. Sadoulet, and A. de Janvry, 2002 "Measuring the Poverty Reduction Potential
of Land in Rural Mexico”, University of California at Berkeley. Mimeo.
Ferreira, F. and P. Lanjouw, 2001. “Rural Poverty and Nonfarm Employment in Brazil”,World Development, 29/3, pp. 509-528.
Forni, Floreal and G. Neiman, 1994. "La pobreza rural en la Argentina" Documento detrabajo N° 5, mimeo inédito, CEPA (Comité Ejecutivo para el Estudio de la Pobreza enla Argentina), Ministerio de Economía y Obras y Servicios Públicos, Secretaría deProgramación Económica, Buenos Aires.
Foster, Greer, and Thorbecke, 1984. “A class of decomposable poverty measures.” InEconométrica, 52, 761-65.
Gerardi Alejandro and C. Cravioti, 2000. “Implicancias del empleo rural no agropeacuarioen los hogares de Rio Negro, Mendoza y Santa Fe”. SAGPyA – PROINDER,Buenos Aires.
———, 2001. “Ingresos, niveles de pobreza y gasto de hogares rurales en Mendoza, Río Negro y Santa Fe”. PROINDER – SAGPyA – PROINDER, Buenos Aires.
———, 2003. “La crisis argentina y su impacto en el bienestar de los hogares rurales enzonas dispersa”. Mimeo.
Gacitua Mario E., C. Sianes and Q. Wodon, 2001. “Reproductive Health in Argentina’s
poor rural area”. In Measuring and measurement: Combining qualitative andquantitative methods for the analysis of poverty and social exclusion in LA.Washington, DC: World Bank.
Koenker, R. and Basset, G. Jr., 1978. “Regression Quantiles”. In Econometrica, Vol. 46, No. 1, pp. 33-50.
Koenker and D’Orey, 1993. “Computing Regression Quantiles”. In Applied Statistics, 36, pp. 383-393, and 43, pp. 410-414.
Koenker, R. and Portnoy, 1997. “Quantile Regression”, Office of Research WorkingPaper, No. 97-0100, College of Commerce and Business Administration, University of
Illinois at Urbana-Champaign.
Lanjouw, J. O. and P. Lanjouw, 2001. “The Rural Nonfarm Sector: Issues And EvidenceFrom Developing Countries”. In Agricultural Economics 24, pp.1-23.
8/6/2019 Argentina Rural Poverty Labor Market 062105 2
Levy, F. and R. J. Murnane, 1992. “U.S. Earnings Levels and Earnings Inequality: AReview of Recent Trends and Proposed Explanations”. In Journal of EconomicLiterature, Vol. 30, pp. 1333-1381.
Mankiw, N.G., Romer, D., and Weil, D.N. 1992. “A Contribution to the Empirics of
Economic Growth”. In Quarterly Journal of Economics, Vol. 107, No. 2.
MECON, 1998. “Informe sobre Niveles de Vida en Hogares Rurales de la provincia deSan Juan”. Secretaría de Programación Económica y Regional, Buenos Aires.
MECON, 1998. “Informe sobre Niveles de Vida en Hogares Rurales de las provincias deMisiones y Salta”. Secretaría de Programación Económica y Regional, Buenos Aires.
Mincer, J. .1974. “Schooling, Experience and Earnings”, NBER Working Paper, NewYork.
Murmis Miguel, 1996. “Pobreza rural y ocupación: revisión de algunos datos inéditos”. InRevista estudios del trabajo N 12.
Mwabu, Germano and T. Paul, Schultz, 1996, “Education Returns Across Quantiles of theWage Function: Alternative Explanations for Returns to Education by Race in SouthAfrica”, American Economic Review, vol. 86 (2), pp. 335-339.
Neiman Guillermo, 2000. “Crecimiento y exclusión. Nuevas y viejas formas de pobrezarural en Argentina”. In Pobres, pobreza y Exclusión social. CEIL 2000.
______ 2003. “Los salarios de los trabajadores comprendidos en el regimen nacional detrabajo agrario” ILO.
Nussbaumer, Beatriz, 2004. “Towards Millennium Development Goals: Migration andPoverty Reproduction in rural Places. Cases of the Chaco Region in Argentina.”
Oxford Analytica; http://www.oxweb.com.
PRODERNOA, 2003. “Estudio de base PRODERNOA, provincia de Catamarca. Mimeo.
PROINDER, 2005. Information provided by the Coordination Unit. ______ , 2003. “Estudio de base PRODERNOA”, provincia de Formosa. Mimeo.
Schiovani Lidia, 2000. “Aportes de hijas e hijos a las estrategias de vida familiar. Familias pobres urbanas y rurales en la provincia de Misiones”.
Taylor, J. E. and A. Yuwez-Naude, 2000. "The Returns From Schooling In A DiversifiedRural Economy", American Journal of Agriculture Econ. 82, May. pp. 287-297.
Verner, Dorte 2004. “Rural Poverty in Mexico During 1992-2002”, The World Bank,Washington, DC. Mimeo.
8/6/2019 Argentina Rural Poverty Labor Market 062105 2
University of La Plata 2004: web page (http:// www.depeco.econo.unlp.edu.ar .
Wiens, Tom 1998. “Rural Poverty in Argentina”, World Bank :Washington, DC.
World Bank 2004 “Rural Infrastructure in Argentina: Its Challenges, Key Issues andOptions for its Development” Report No. 26271. World Bank :Washington, DC.