24
City College of San Francisco Argos Training Documentation Prepared by Edgar Coronel – Strata Information Group Updated March 21, 2013

City College of San Francisco
Argos Training Documentation
Prepared by Edgar Coronel – Strata Information Group
Updated March 21, 2013

Page 1
Contents
Login into Argos ........................................................................................................................................ 2
Navigation Area......................................................................................................................................... 3
Explorer view ........................................................................................................................................ 3
Shortcuts View ...................................................................................................................................... 4
DataBlocks ................................................................................................................................................. 4
Running a Dashboard ................................................................................................................................ 5
Navigation within a Dashboard Block ....................................................................................................... 6
Save Results .......................................................................................................................................... 6
Edit Sort ................................................................................................................................................. 7
Edit Filter ............................................................................................................................................... 8
Dashboard Options ............................................................................................................................... 9
OLAP - On-Line Analytical Processing ..................................................................................................... 10
Overview ............................................................................................................................................. 10
Measures ............................................................................................................................................. 11
Dimensions .......................................................................................................................................... 11
Dimension Toolbar .............................................................................................................................. 11
Dimension Items ................................................................................................................................. 12
Measures Toolbar ............................................................................................................................... 13
Activate Global Measure Manager ..................................................................................................... 13
Calculated Measures Manager ........................................................................................................... 15
Measure Items .................................................................................................................................... 15
Activate Individual Measure Manager ................................................................................................ 15
Exporting data to Excel ....................................................................................................................... 16
Save OLAP Settings.............................................................................................................................. 17
Printing the OLAP ................................................................................................................................ 18
Schedule of Classes Dashboard............................................................................................................... 19
Schedule of Classes OLAP ....................................................................................................................... 19
Student Enrollment Dashboard .............................................................................................................. 20
Student Enrollment OLAP ....................................................................................................................... 21
Budget Status Dashboard ....................................................................................................................... 21
Budget Status OLAP ................................................................................................................................ 23

Page 2
Login into Argos
A link to log into Argos has been added to the Banner Portal Page (http://www.ccsf.edu/Organizations/Banner_Users/INB/)
Click on the Argos Signon link. Argos runs on a Java platform (is should use Java version 6 which should also be compatible with Banner) so the system may ask you to install Java the first time you log in.
Note: Argos requires Java 6 and a Windows computer to run. It works best on Internet Explorer 8 but should be able to run on Chrome or Firefox. At this point it does not run on a Mac.
If you are logging into Argos for the first time on this computer you may see the follow warning message:
Click the “Always trust” button and click Run.
When Java completes installing you should see the following logon window:

Page 3
Enter your Windows/Network username and password to log in (Note: Mac users may need to use a special Argos is which ITS will create).
Argos has been designed with an intelligent interface that knows your user type and configures menus and buttons to show only those actions permitted. Most users will see only the folders that they have access to and DataBlocks, Dashboards and Reports that they have been given access to run.
Navigation Area
This area contains the objects that you can perform actions on. There are three different views you can use for the Navigation area by clicking the desired tab (Explorer or Shortcuts). Each of these views is described below.
Explorer view
The Explorer is the default view for the Navigation area, in which a simple menu of available folders and objects is displayed. Argos objects that can be found in the Explorer include:
Folders – Contains objects, including other folders
DataBlocks – The “parent” object for one or more reports
Dashboards - Display-only reports for quick reference.
CSV Report – A comma-separated values report
Banded Report – A fully-formatted report
Extract Report - A text report that meets pre-defined specifications
Schedule – Reports may be scheduled to run automatically
Some objects can be flagged as private. Private objects will not show up in the Explorer for users other than the creator and the administrator. These objects will have the “private eye” icon like the sample private Banded report icon on the list to the right.
Within the Explorer tree, reports always reside beneath a DataBlock parent. A DataBlock can have many “child” reports. Any object that has child objects will have a “+” next to it. Simply click the “+” to expand the object to view its children.

Page 4
Shortcuts View
This view can be very convenient as it shows only your available shortcuts. You can even rename a shortcut to something other than the original name. To find the original object in the Explorer view, right-click a shortcut and choose “Locate” (see figure on the right). Deleting or renaming a shortcut has no effect on the original object.
DataBlocks
Although Report Viewers do not create DataBlocks, an understanding of the components of the DataBlock aids the Report Viewer in understanding the relationship between DataBlocks and the various report types.
The DataBlock is the foundation from which all reports are created and contains Forms and Queries. Only users with DataBlock Designer privileges can create DataBlocks. At this point only ITS will have the ability to create DataBlocks.
The Queries obtain data from a database. When results of a query are displayed on a form, this is called a Dashboard. In the case of CSV, Banded, and Extract Reports, the results of the query are input to the report design with the results displayed or stored elsewhere. Within the Argos Explorer tree, reports exist as "child" objects of a DataBlock.

Page 5
The Form, created by the DataBlock Designer using the Argos DataBlock Designer, is used for two purposes:
To obtain input selections from the user executing the report. The input selections can be passed to the queries to limit the results.
To display the results of the report. Dashboards can display results on the form.
Whenever a user executes a report, the form designed as part of a DataBlock will be displayed. The input selections made by the user become query parameters.
Any report type (Dashboard, CSV, Banded, and Extract) can use the data obtained from the queries. The tree structure shown on the right denotes that all report types underneath the DataBlock will obtain the same results from the queries, but of course each report type will print the data using methods available to the given report type.
Running a Dashboard
To run a Dashboard click on the Dashboard icon associated with the DataBlock that you want to run and click on the Run Dashboard icon on the main area.
The Dashboards for CCSF have been designed with certain parameters to be defaulted (such as Term_Code), provide the ability for users to enter their own parameters and with a “Run” button which must be click in order to the query to execute.

Page 6
Navigation within a Dashboard Block
When the number of fields and rows are larger than what can be seen within the block, slide bars are available on the right side and bottom of the block to navigate to additional information.
You can sort by any single field by clicking on the field header. You can also move the order of a field by clicking, holding and dragging the field.
Additional options are available by clicking the right button on your mouse while the cursor is anywhere on the dashboard block. The following options are available:
Save Results
The Save Results option gives you the ability to export data to either a .csv or .txt file. You can also click the Launch button to have it automatically open. This window also allows you to default the fields to extract.

Page 7
Regardless of the selected option, the Save Grid Results window will open up to allow you to select the directory and to enter file name and format.
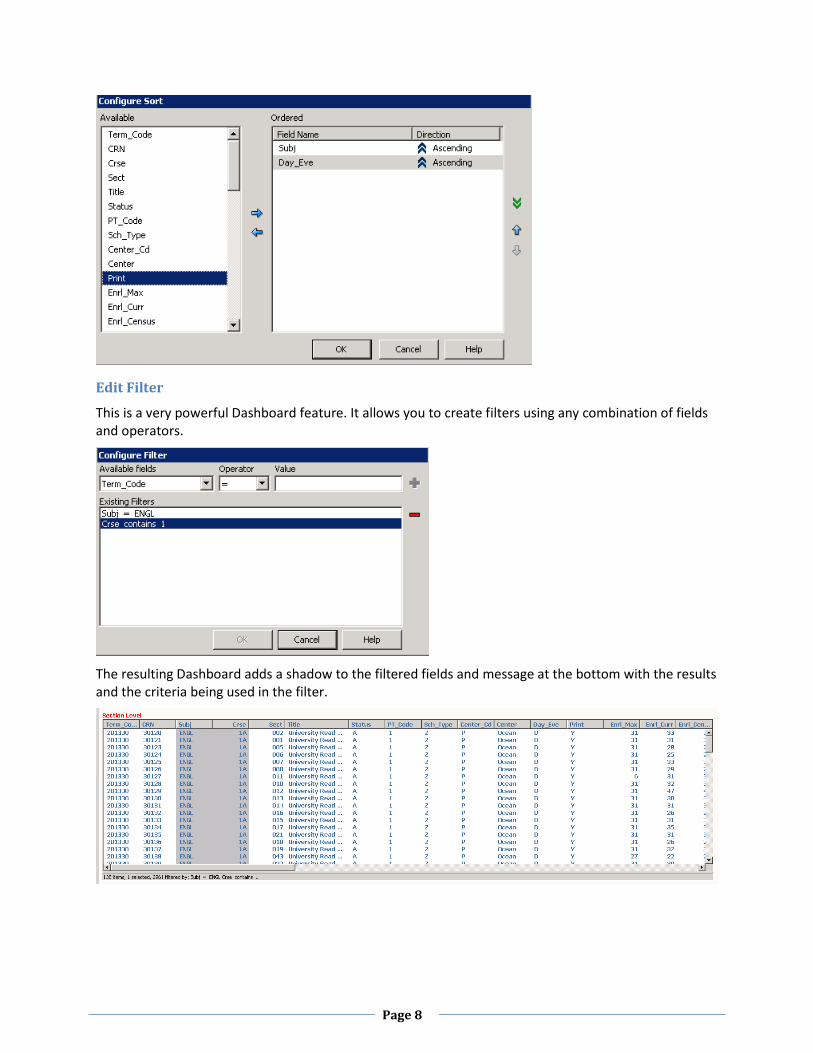
Edit Sort
The Edit Sort option allows you to sort the data by any combination of fields.
Page 8
Edit Filter
This is a very powerful Dashboard feature. It allows you to create filters using any combination of fields and operators.
The resulting Dashboard adds a shadow to the filtered fields and message at the bottom with the results and the criteria being used in the filter.

Page 9
Dashboard Options
Dashboard options provide the ability to save settings that you may want to reuse periodically such as Center or Dashboard filters.
I usually like to create a default setting in order to restore this setting without having to rerun the Dashboard. To create a New Saved Setting set the parameters and filters that you want to save. In the case of the Default Settings do not change anything when first opening the Dashboard. Click on Save Current Settings from the Dashboard Options Menu and the following window should display.
Here is an example of saved settings for all French courses at the Downtown center.

Page 10
OLAP - On-Line Analytical Processing
Dashboards can be designed to include OLAP cubes. OLAP cubes are data structures which can be manipulated by the report viewer to produce a wide variety of views of data. The following describes OLAP and how the report viewer can work with OLAP cubes.
Overview
OLAP is a specific way to represent statistical data for administrators, managers and analysts. It is designed to aid in decision-making and better information understanding. The main idea is to answer the user’s questions, arising at the work time, on-the-fly, quickly. A popular definition is “A million spreadsheets in a box.” The key to OLAP is its ability to allow the end user to configure different views of the same data.
An OLAP system allows user to get into details and generalize, filter, sort and regroup data at the time of analysis. Intermediate and final totals are recalculated instantly.
The user is presented data in an electronic spreadsheet format. By moving rows and columns or clicking them, the user makes the system perform calculations and show data in different aspects. Thus, the user can produce many reports out of a single dataset on their own, without any assistance from IT-specialists.
OLAP breaks data into two groups: facts (numbers, also called measures) and dimensions (descriptions). Facts (Measures) are aggregated in a given slice by some algorithm while the user defines grouping and aggregation depth by using Dimensions.

Page 11
Measures
Measures are the numbers in the OLAP spreadsheet or cube. They can also be referred to as Facts. The Measures are displayed in the cells of the cube. Measures are stored in what are called Fact Tables.
Fact tables typically contain the following types of fields:
Key fields to join the Fact table to Dimension tables.
Measure fields containing numeric values.
Dimensions
Fields by which data records are grouped are called Dimensions. Dimensions can contain values of various types: strings, dates, numbers, and so on. A dimension lists members, all of which are perceived by the user to be similar types of data. A dimension is the answer to “How do you want to see your data.” For example, a Time dimension might include members for years, quarters, months, and weeks. A Sales dimension could include product names, sales territories, and names of salespersons. When running the cube, the end user can select to group the data by any or all the defined dimensions.
Dimensions have levels that allow for drilling down. For example, if looking at enrollment by center, you could drill down to get more information as to the makeup of the enrollment (such as by subject, method of attendance, etc).
Dimensions can be pulled from the Fact Table but typically are stored in Dimension Tables. Dimension tables have the following types of fields:
Key fields, used to join the dimension tables to the fact table (star schema).
Level name fields, used to store the member names for the levels. For example, the Time dimension table could have a field called Month, which would have values such as January, February, March, etc.
Level Order Key fields, used to store integer values used to order the members of the levels (if necessary). For example, the Time dimension table could have a field called Month Order Key, which could have a value of 1 for January, 2 for February, 3 for March, etc.
Member Property fields, used to store the member property information. A Time dimension could have a field called Day Count, which would store the number of days for each month.
Dimension Toolbar
The dimension toolbar is used to manipulate the dimensions on the cube.

Page 12
Expand/Collapse Toolbar
You can collapse the dimension toolbar in order to have a bigger display area for the Cube Grid. The button acts as a toggle.
Dimension Items
The dimensions that are displayed are obtained from the list of available dimensions the designer added to the cube. All dimensions are displayed, except for those already added to the dimension rows or column toolbars. If any of the dimensions were added by the designer to be columns or rows, they will not be listed here.
The order of the items on the dimension toolbar has no significance. The order is determined by the order they were added by the designer. The user can also rearrange by dragging them to the dimension rows or dimension columns.
Dimension Item Labels
The dimension labels are obtained from the Display Name property of the defined dimension.
Activate Dimension Editor
To Activate the Dimension editor, click the down arrow on one of the dimensions.
The dimension editor allows the user running the report to ‘override’ or change some of the default settings defined by the creator of the DataBlock.
The Dimension editor allows the user to ‘filter’ the data or resort the data.
To filter the data to display only the items selected, change the green check mark to a blue or red check mark by clicking on the current value.
In addition you can change the sort order by clicking on the ‘Sort Dimension’ icon on the bottom tool bar. You can select to sort by Name, Key value, or not sort at all. You can also group within the

Page 13
Dimension editor. Click on the folder with a plus sign - Add Hierarchy group. Name it, then drag and drop choices onto it to create a folder of choices. Any dimensions you want to group (i.e. states into west and east regions) you can.
You can also quickly get totals on the fly. Hold shift and click on a column in the OLAP cube, the totals will be highlighted in yellow.
Measures Toolbar
The measure toolbar allows the end user to modify the default settings for the added measures.
Expand/Collapse Toolbar
You can collapse the measure toolbar in order to have a bigger display area. The button acts as a toggle.
Activate Global Measure Manager
To activate the global measure manager click the global message manager icon shown in the above figure.

Page 14
The measure manager is used to easily set the attributes of each measure item. Among the attributes you can set are the visibility of each measure, the displayed measure value and the filtered valued. On the example, to display the unit price measure, click on the red x to change to a green check mark.
When a measure item is not displayed on the measures toolbar, use the global measure manager to set its state to visible again.
You can also add a new calculated measure by using the calculator icon on the bottom toolbar. This will bring up the same form as the ‘Activate Calculated Measures Manager’ button.

Page 15
Calculated Measures Manager
In this example a new measure was added that multiplies the quantity sold by the unit price.
The calculated measures manager dialog box is used to add additional measures. The value of these calculated measures may use the values of the defined measures, much like how calculated fields are used in a database table.
Measure Items
Display the ‘visible’ or active measures.
Activate Individual Measure Manager
The individual measure manager is used to set the attributes of the selected measure. It is identical to the global measure manager, except that you can only set the attributes of the selected measure. To activate the individual Measure manager, click on the down arrow of the measure of interest. See the sidebar on this page.

Page 16
Exporting data to Excel
You are able to export OLAP data into Excel. To enable this functionality right click while your mouse is on the body of the OLAP
Select the Export to Excel option which will enable the following box
When the export is completed an Excel window similar to the one below will open up. Note that Excel must be installed on the local computer.
Page 17
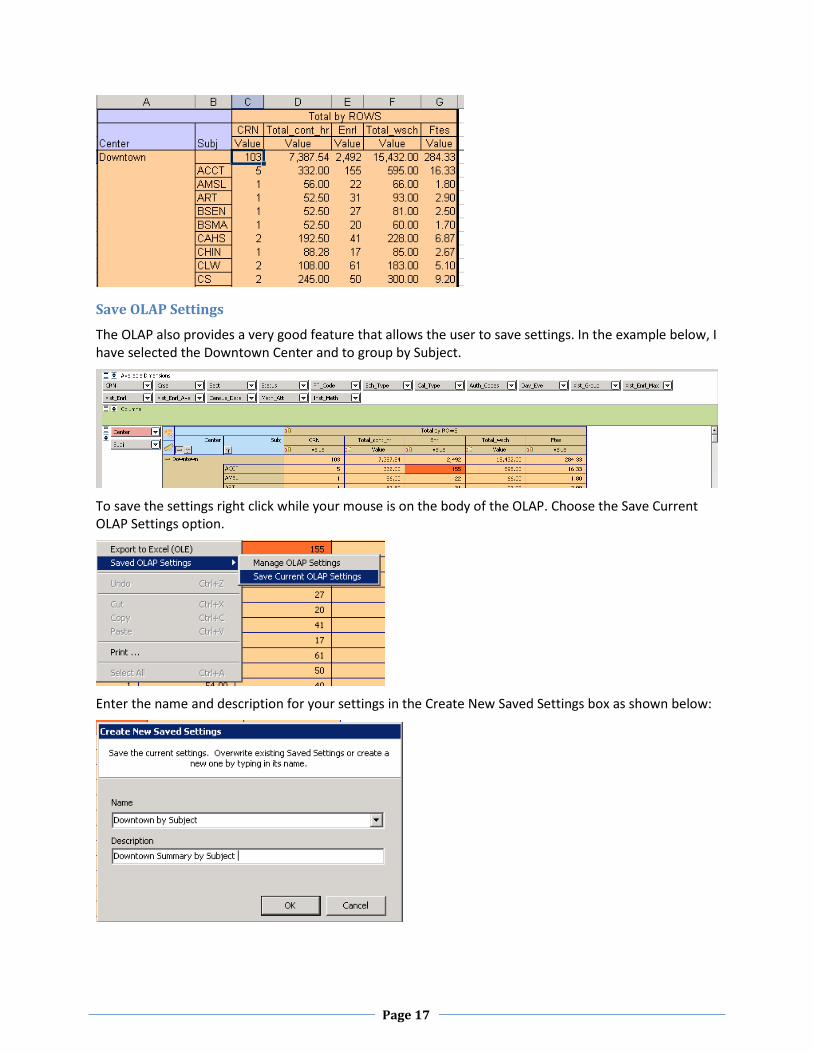
Save OLAP Settings
The OLAP also provides a very good feature that allows the user to save settings. In the example below, I have selected the Downtown Center and to group by Subject.
To save the settings right click while your mouse is on the body of the OLAP. Choose the Save Current OLAP Settings option.
Enter the name and description for your settings in the Create New Saved Settings box as shown below:

Page 18
To recall the settings, right click while your mouse is on the body of the OLAP and your saved settings will be available on the menu as shown below:
Printing the OLAP
To enable this functionality, right click while your mouse is on the body of the OLAP.

Page 19
Schedule of Classes Dashboard
This Dashboard is designed to default to the current term (ITS will update), all CRNs and all Centers, however, the user is able to enter their own desired parameters. The default is also setup to include only active courses.
The first block in the Dashboard displays section level information (as entered in the Course tab of SSASECT). The second block displays session level information (as enter in Meeting Time and Instructor tabs of SSASECT) associated with the CRN where the cursor is active. The third block will display Instructor level information, if available, for the session active in the second block.
Schedule of Classes OLAP
Enable the OLAP by clicking the OLAP button from the Dashboard. The OLAP will run with the parameters selected in the Dashboard. It is recommended that, since additional filtering is available in the OLAP, you run the OLAP with the default parameters.
Click the Run button for the OLAP to execute or the Data button to go to the Dashboard.
The Schedule of Classes OLAP uses the same information found in the Section level block of the Dashboard.

Page 20
Student Enrollment Dashboard
This Dashboard uses similar parameters and defaults as the Schedule of Classes one. The first block is also similar in that it displays Section level information (as entered in the Course tab of SSASECT) except that it does not bring 320 level data. Instead, it provides a block with registration detail from the registration tables (as displayed in SFAREGS or SFRSTCR), a registration summary block and a 320 information detail for each day that the data was generated.
Page 21
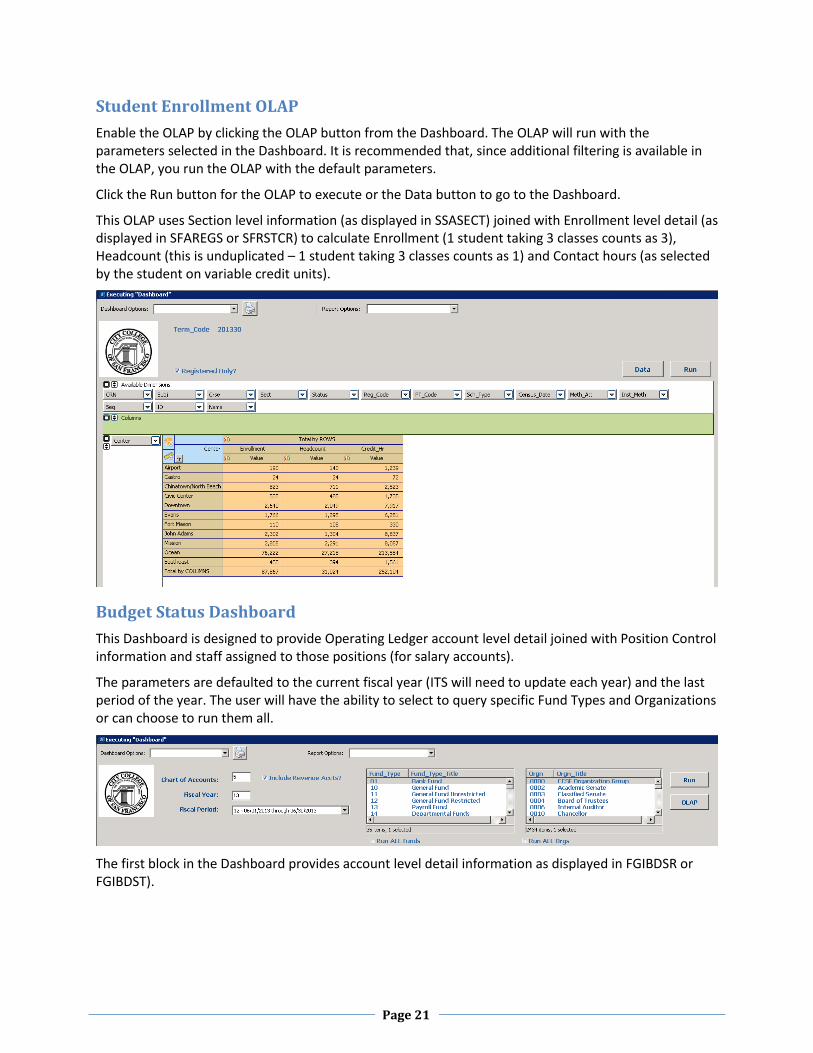
Student Enrollment OLAP
Enable the OLAP by clicking the OLAP button from the Dashboard. The OLAP will run with the parameters selected in the Dashboard. It is recommended that, since additional filtering is available in the OLAP, you run the OLAP with the default parameters.
Click the Run button for the OLAP to execute or the Data button to go to the Dashboard.
This OLAP uses Section level information (as displayed in SSASECT) joined with Enrollment level detail (as displayed in SFAREGS or SFRSTCR) to calculate Enrollment (1 student taking 3 classes counts as 3), Headcount (this is unduplicated – 1 student taking 3 classes counts as 1) and Contact hours (as selected by the student on variable credit units).
Budget Status Dashboard
This Dashboard is designed to provide Operating Ledger account level detail joined with Position Control information and staff assigned to those positions (for salary accounts).
The parameters are defaulted to the current fiscal year (ITS will need to update each year) and the last period of the year. The user will have the ability to select to query specific Fund Types and Organizations or can choose to run them all.
The first block in the Dashboard provides account level detail information as displayed in FGIBDSR or FGIBDST).

Page 22
The second block is designed to display all the positions that have been assigned to the account distribution (FOAP – Fund, Org, Acct, Prog) in which the cursor is active in the Account Detail block. In the example below, the cursor is active in account U-7112-1120-0900.
Thus the Position Budget block will display all the active positions associated with this FOAP for the budget year.
The third block is designed to display all the account distributions associated with the position where the cursor is active in the Position Budget block. Positions 100% funded by a FOAP should only have 1 line, however, positions funded by multiple FOAPs should display all the various account assignments in this block.
The source of the data for the second and third blocks is the Salary Budget and Account Distribution tabs of NBAPBUD.
The fourth block displays the staff assigned to the position as entered in NBAJOBS. The job information will default to the start of the fiscal year but the user could select to query to the current record or as of any point in time.
If data is not returned in any of the blocks it means that no records are available (e.g. No data in the fourth block indicates that no active NBAJOBS record exists for the position. No data in the second and third blocks indicates that no active positions are assigned to the FOAP for the fiscal year.

Page 23
Budget Status OLAP
Enable the OLAP by clicking the OLAP button from the Dashboard. The OLAP will run with the parameters selected in the Dashboard. It is recommended that, since additional filtering is available in the OLAP, you run the OLAP with the default parameters.
Click the Run button for the OLAP to execute or the Data button to go to the Dashboard.
This OLAP uses Operating Ledger account level data to summarize information at Fund Type and Major Account level.


