Arianna Legovini, Lead Impact Evaluation Specialist Edit V. Velenyi, MIEP Coordinator Africa Impact Evaluation Initiative (AIM) Malaria Impact Evaluation Program (MIEP). - PowerPoint PPT Presentation
24
Bank Netherlands Partnership Program (BNPP) HD Learning Week November 13, 2008 Arianna Legovini, Lead Impact Evaluation Specialist Edit V. Velenyi, MIEP Coordinator Africa Impact Evaluation Initiative (AIM) Malaria Impact Evaluation Program (MIEP)
Transcript
Bank Netherlands Partnership Program (BNPP)HD Learning WeekNovember 13, 2008
Arianna Legovini, Lead Impact Evaluation SpecialistEdit V. Velenyi, MIEP Coordinator
Africa Impact Evaluation Initiative (AIM)Malaria Impact Evaluation Program (MIEP)
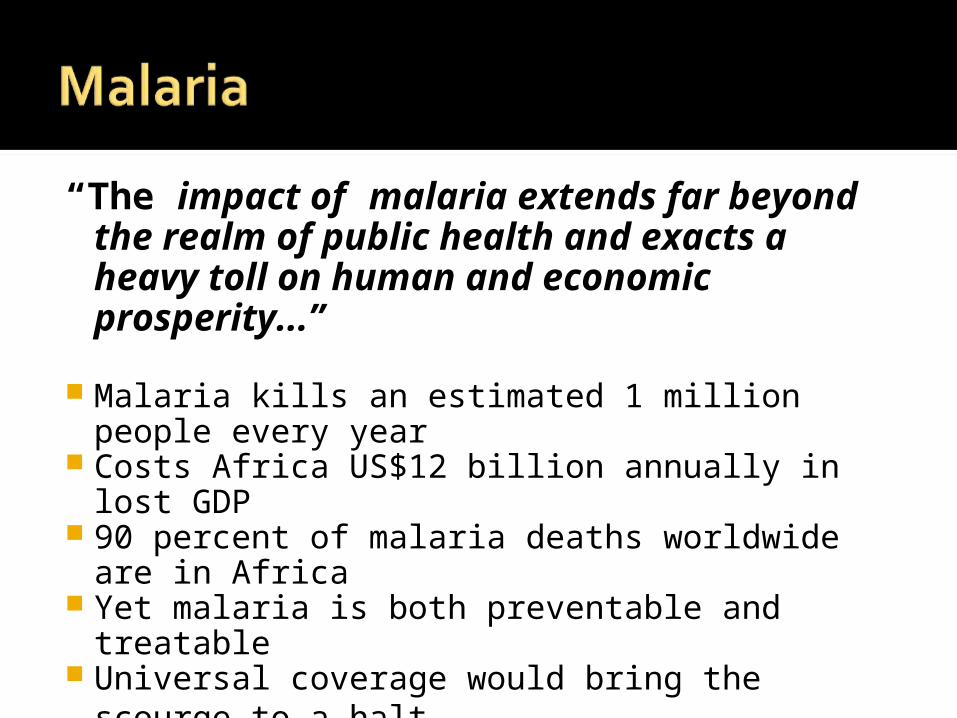
“The impact of malaria extends far beyond the realm of public health and exacts a heavy toll on human and economic prosperity...”
Malaria kills an estimated 1 million people every year
Costs Africa US$12 billion annually in lost GDP 90 percent of malaria deaths worldwide are in
Africa Yet malaria is both preventable and treatable Universal coverage would bring the scourge to
a halt
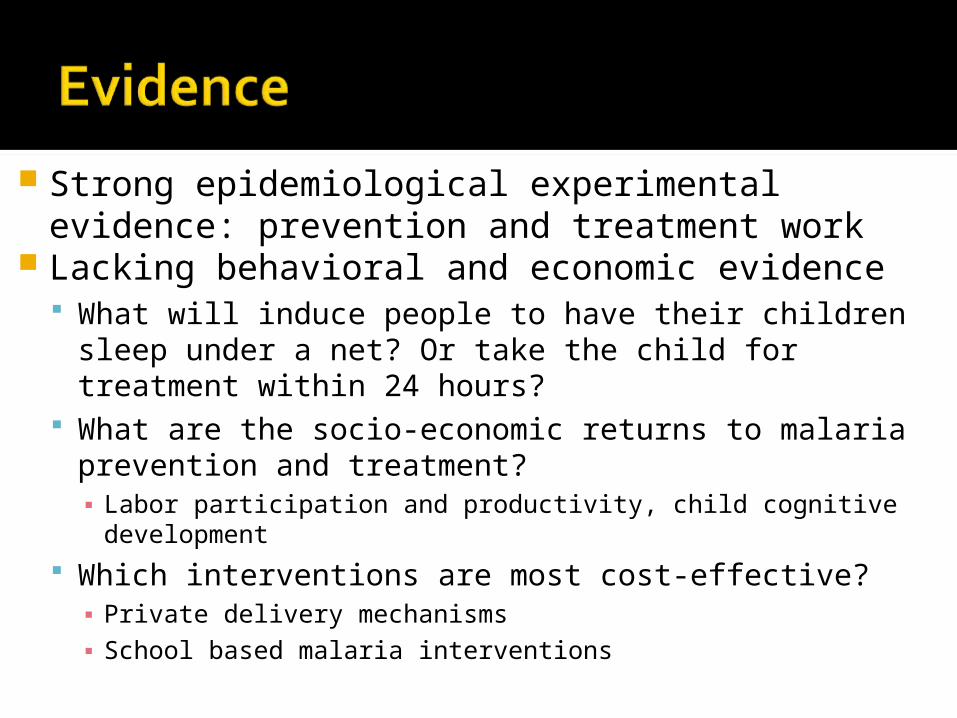
Strong epidemiological experimental evidence: prevention and treatment work
Lacking behavioral and economic evidence What will induce people to have their children sleep
under a net? Or take the child for treatment within 24 hours?
What are the socio-economic returns to malaria prevention and treatment?▪ Labor participation and productivity, child cognitive
development
Which interventions are most cost-effective?▪ Private delivery mechanisms▪ School based malaria interventions
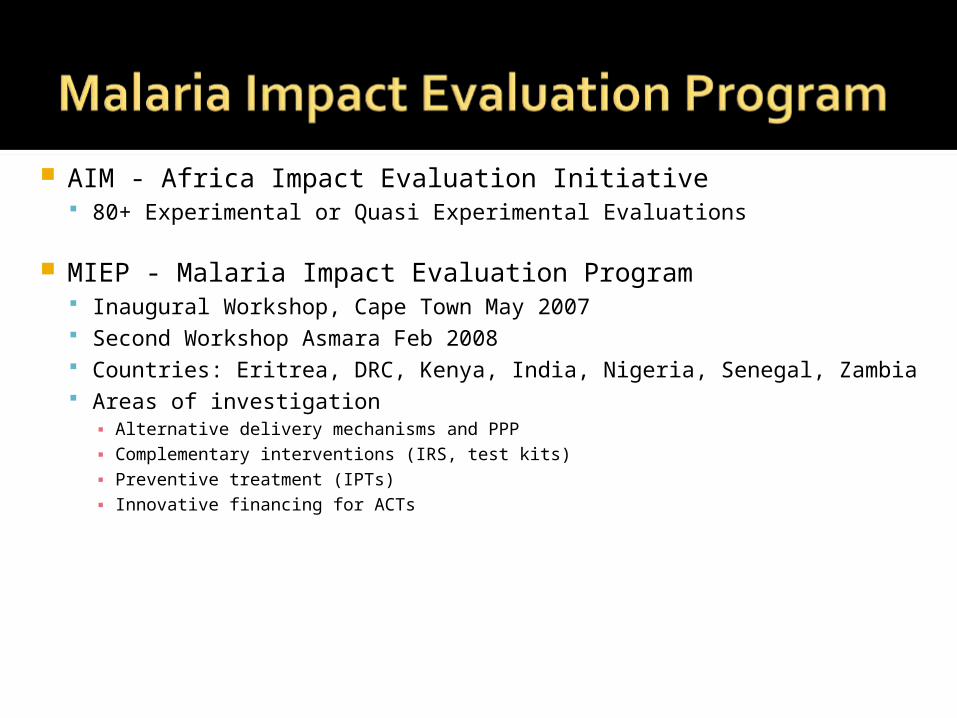
AIM - Africa Impact Evaluation Initiative 80+ Experimental or Quasi Experimental Evaluations
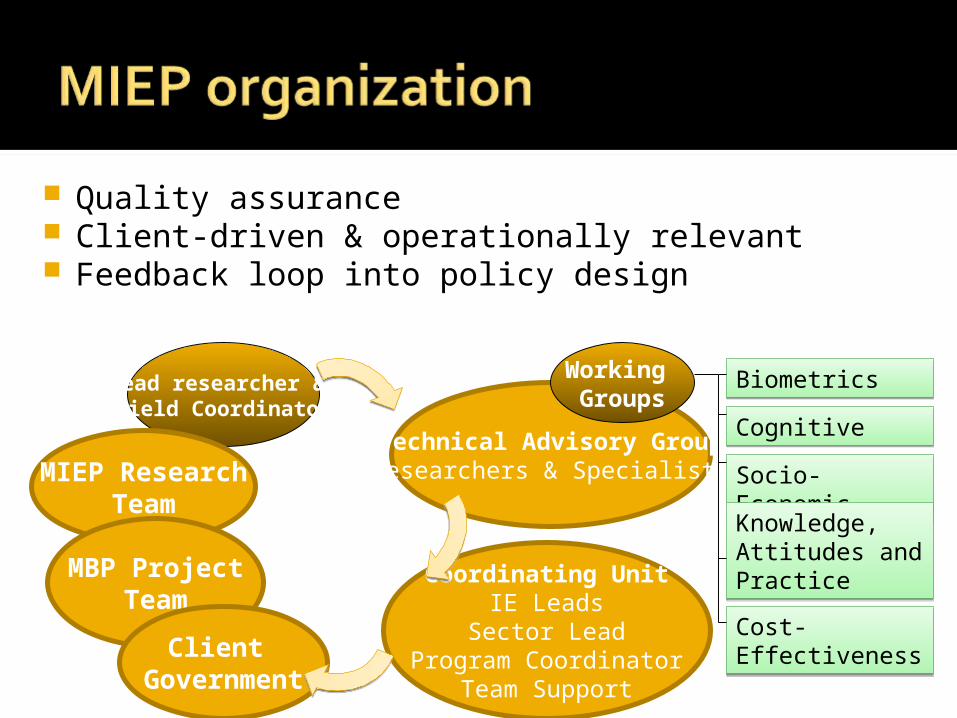
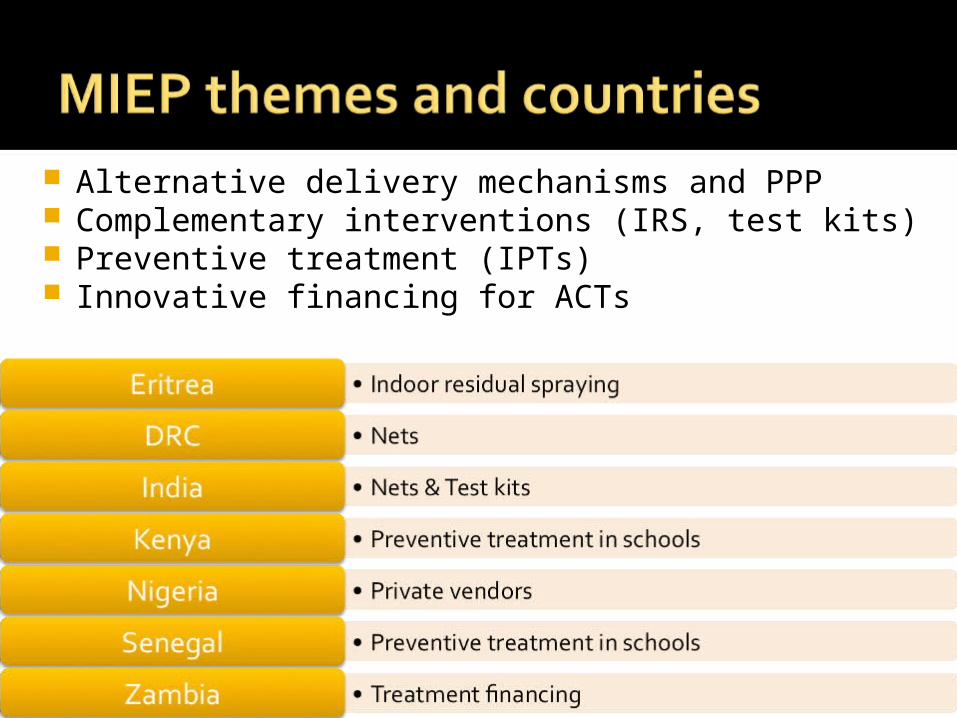
MIEP - Malaria Impact Evaluation Program Inaugural Workshop, Cape Town May 2007 Second Workshop Asmara Feb 2008 Countries: Eritrea, DRC, Kenya, India, Nigeria, Senegal, Zambia Areas of investigation
▪ Alternative delivery mechanisms and PPP▪ Complementary interventions (IRS, test kits)▪ Preventive treatment (IPTs)▪ Innovative financing for ACTs
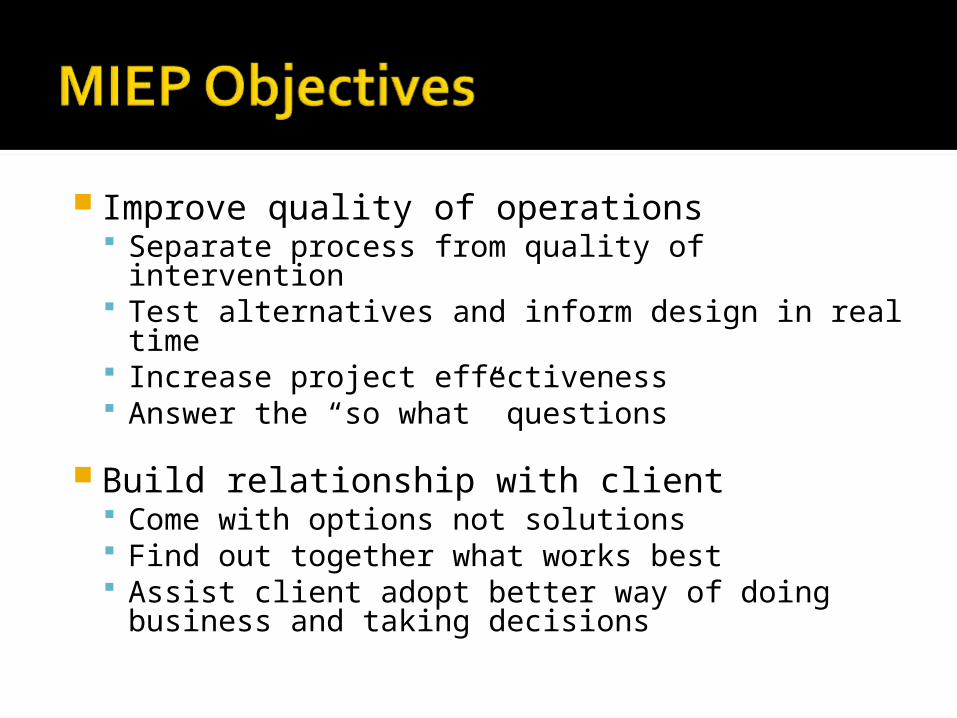
Improve quality of operations Separate process from quality of intervention Test alternatives and inform design in real
time Increase project effectiveness Answer the “so what” questions
Build relationship with client Come with options not solutions Find out together what works best Assist client adopt better way of doing
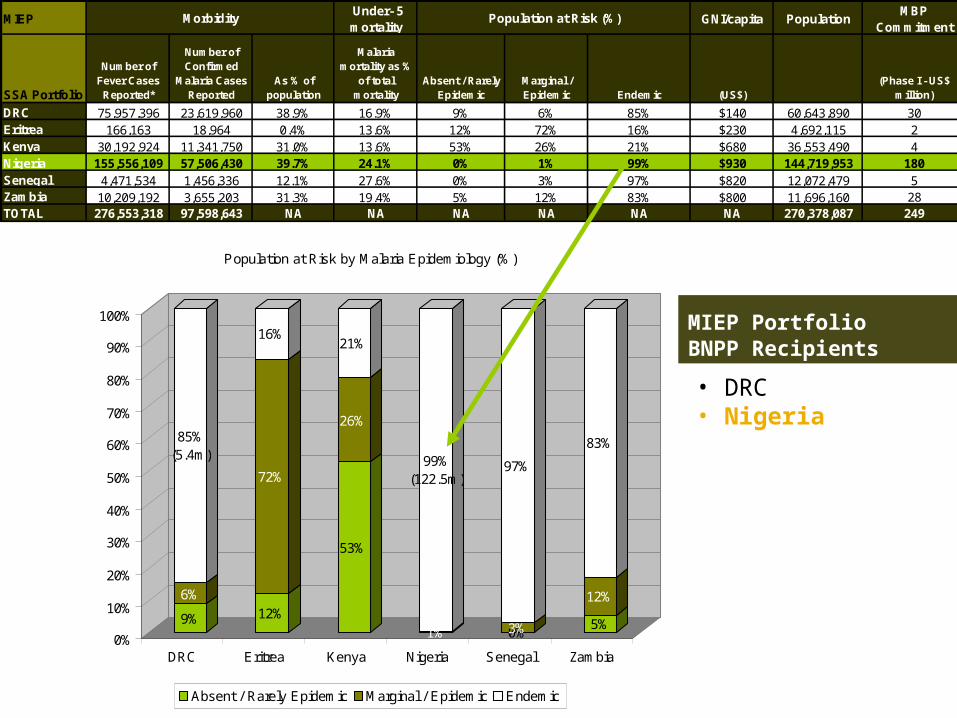
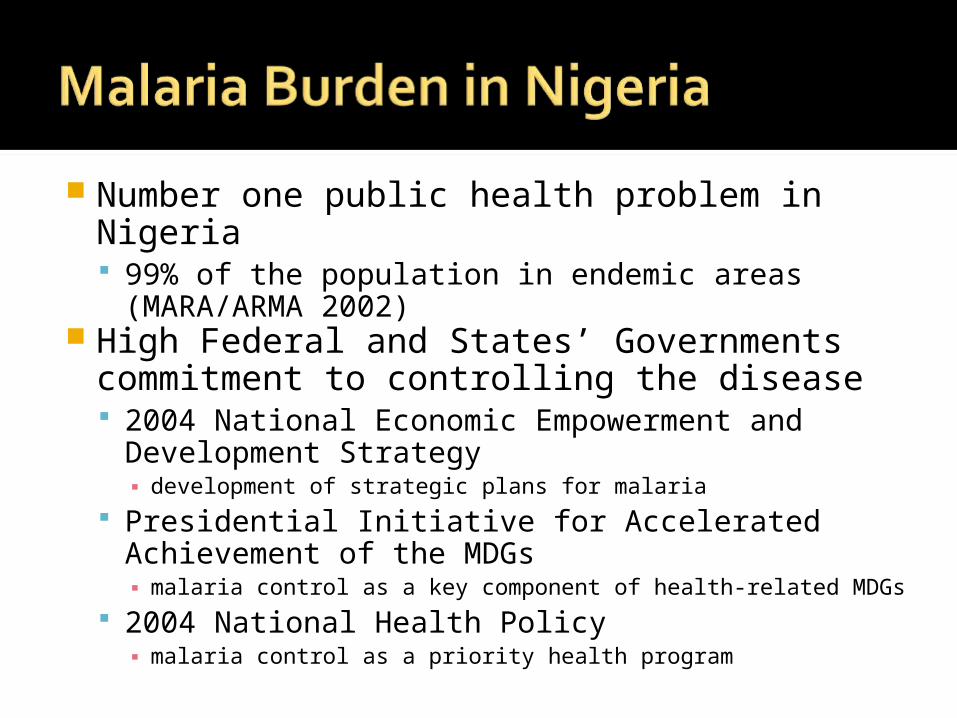
Number one public health problem in Nigeria 99% of the population in endemic areas
(MARA/ARMA 2002) High Federal and States’ Governments
commitment to controlling the disease 2004 National Economic Empowerment and
Development Strategy▪ development of strategic plans for malaria
Presidential Initiative for Accelerated Achievement of the MDGs ▪ malaria control as a key component of health-related MDGs
2004 National Health Policy ▪ malaria control as a priority health program
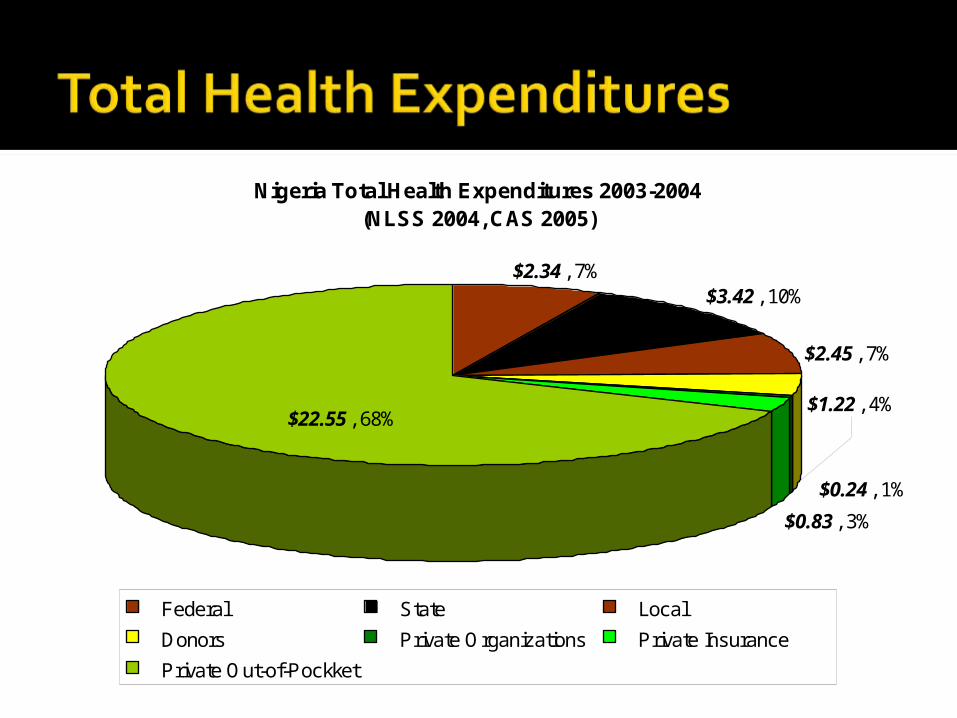
Nigeria Total Health Expenditures 2003-2004 (NLSS 2004, CAS 2005)
$2.34 , 7%$3.42 , 10%
$2.45 , 7%
$1.22 , 4%$22.55 , 68%
$0.24 , 1%
$0.83 , 3%
Federal State Local
Donors Private Organizations Private Insurance
Private Out-of-Pockket
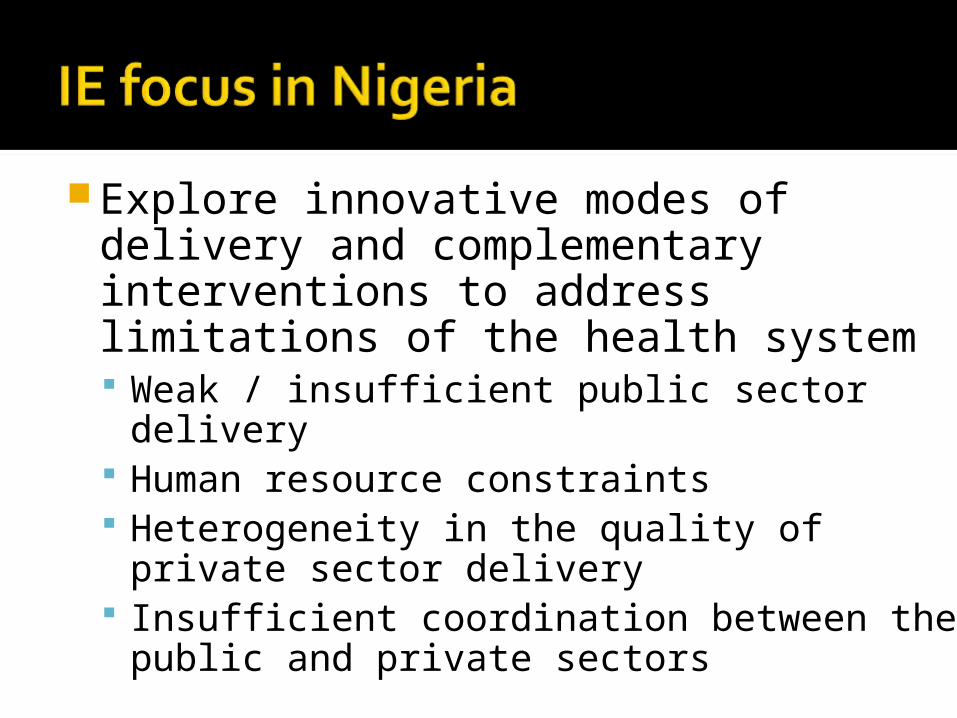
Explore innovative modes of delivery and complementary interventions to address limitations of the health system Weak / insufficient public sector delivery Human resource constraints Heterogeneity in the quality of private
sector delivery Insufficient coordination between the public
and private sectors
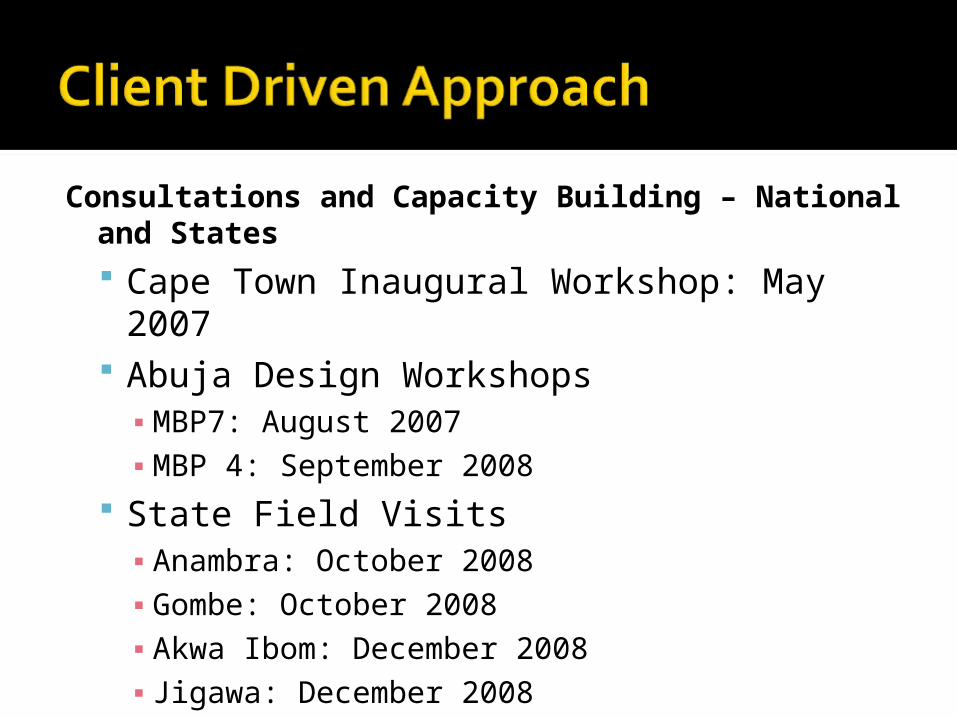
Consultations and Capacity Building – National and States Cape Town Inaugural Workshop: May 2007 Abuja Design Workshops
▪ MBP7: August 2007 ▪ MBP 4: September 2008
State Field Visits▪ Anambra: October 2008▪ Gombe: October 2008▪ Akwa Ibom: December 2008▪ Jigawa: December 2008
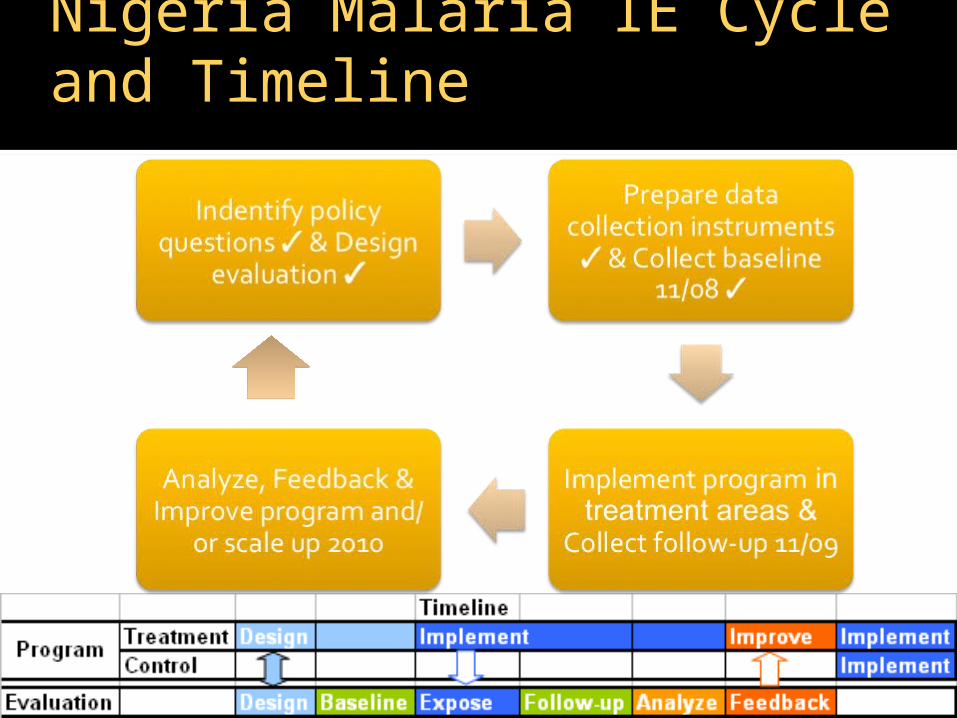
Nigeria Malaria IE Cycle and Timeline
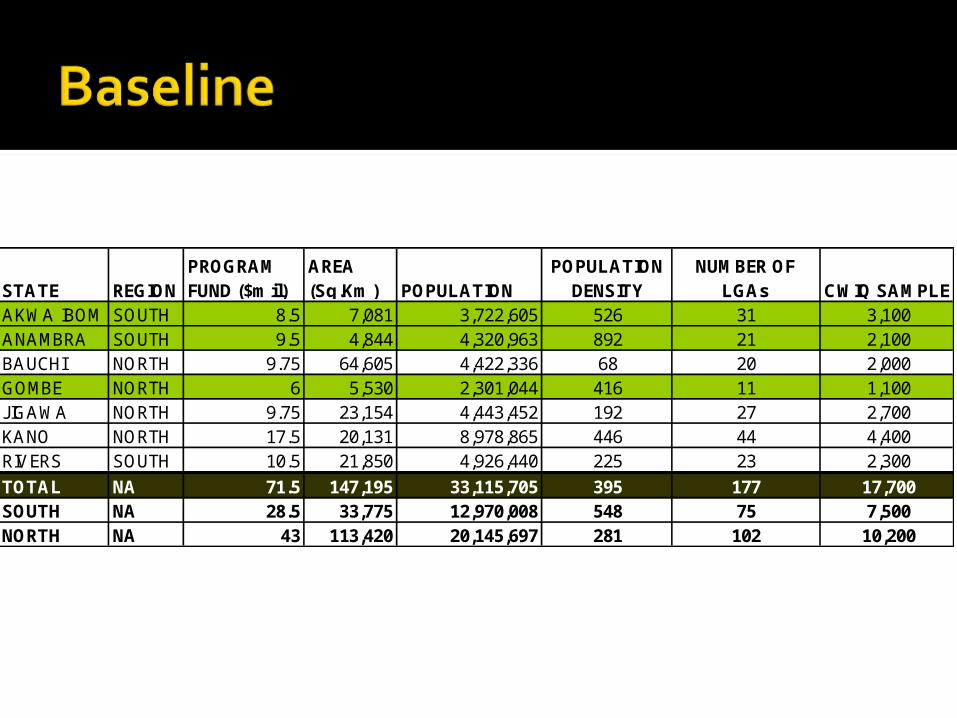
STATE REGIONPROGRAM FUND ($mil)
AREA (Sq.Km) POPULATION
POPULATION DENSITY
NUMBER OF LGAs CWIQ SAMPLE
AKWA IBOM SOUTH 8.5 7,081 3,722,605 526 31 3,100ANAMBRA SOUTH 9.5 4,844 4,320,963 892 21 2,100BAUCHI NORTH 9.75 64,605 4,422,336 68 20 2,000GOMBE NORTH 6 5,530 2,301,044 416 11 1,100JIGAWA NORTH 9.75 23,154 4,443,452 192 27 2,700KANO NORTH 17.5 20,131 8,978,865 446 44 4,400RIVERS SOUTH 10.5 21,850 4,926,440 225 23 2,300
TOTAL NA 71.5 147,195 33,115,705 395 177 17,700SOUTH NA 28.5 33,775 12,970,008 548 75 7,500NORTH NA 43 113,420 20,145,697 281 102 10,200
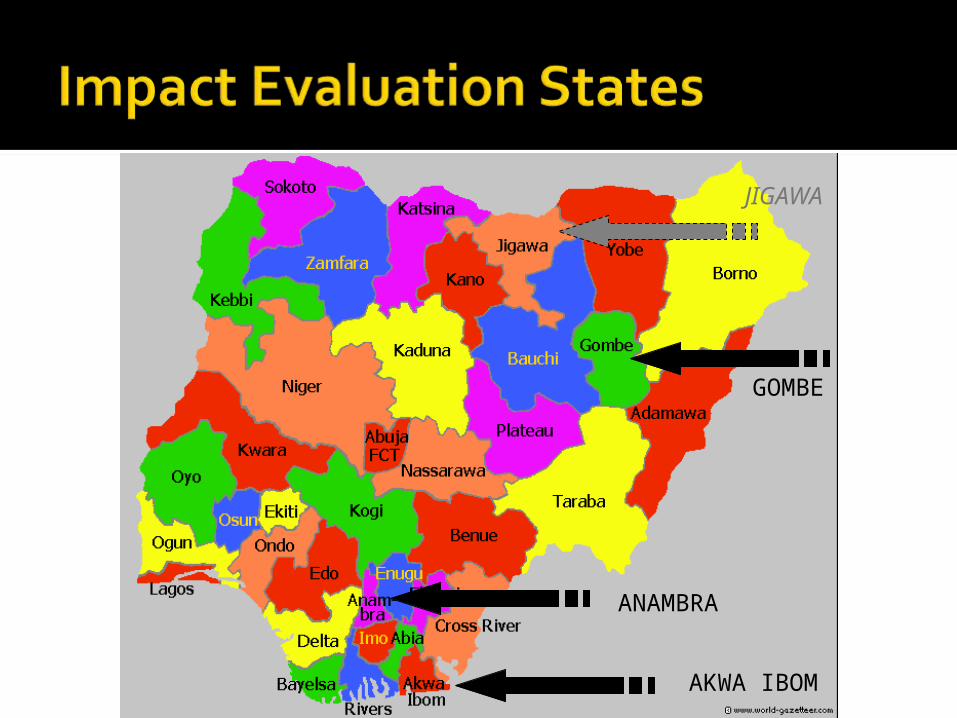
ANAMBRA
AKWA IBOM
GOMBE
JIGAWA
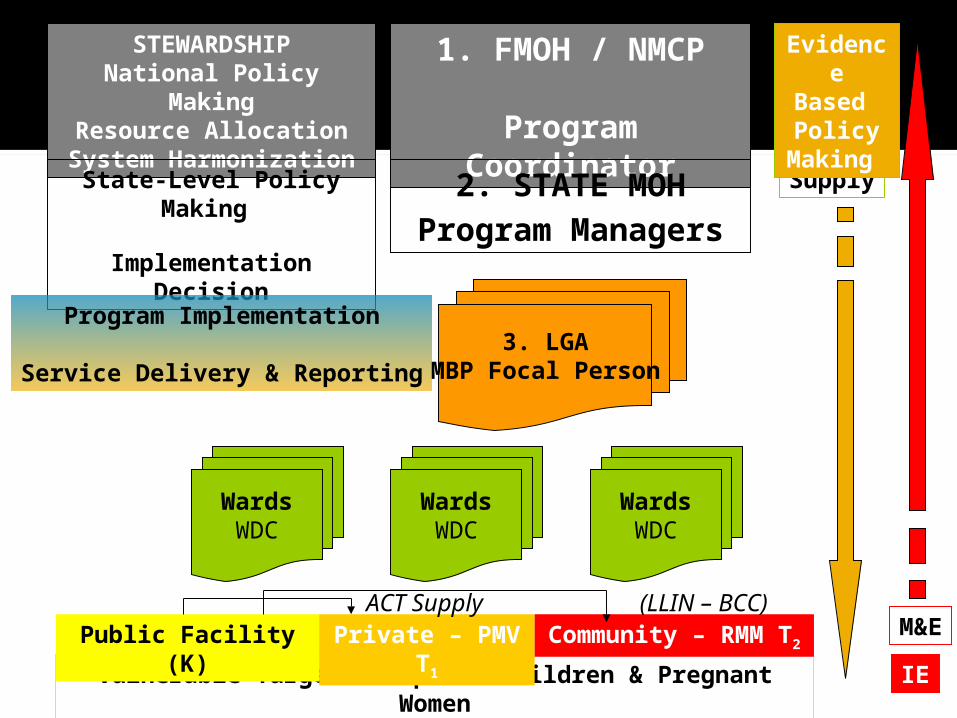
1. FMOH / NMCP
Program Coordinator
2. STATE MOH
Program Managers
3. LGAMBP Focal Person
WardsWDC
WardsWDC
WardsWDC
Vulnerable Target Group: U5 Children & Pregnant Women
Public Facility (K) Private – PMV T1 Community – RMM T2
ACT Supply
STEWARDSHIPNational Policy Making
Resource AllocationSystem Harmonization
State-Level Policy Making
Implementation Decision
Supply
M&E
Program Implementation
Service Delivery & Reporting
IE
EvidenceBased Policy
Making
(LLIN – BCC)
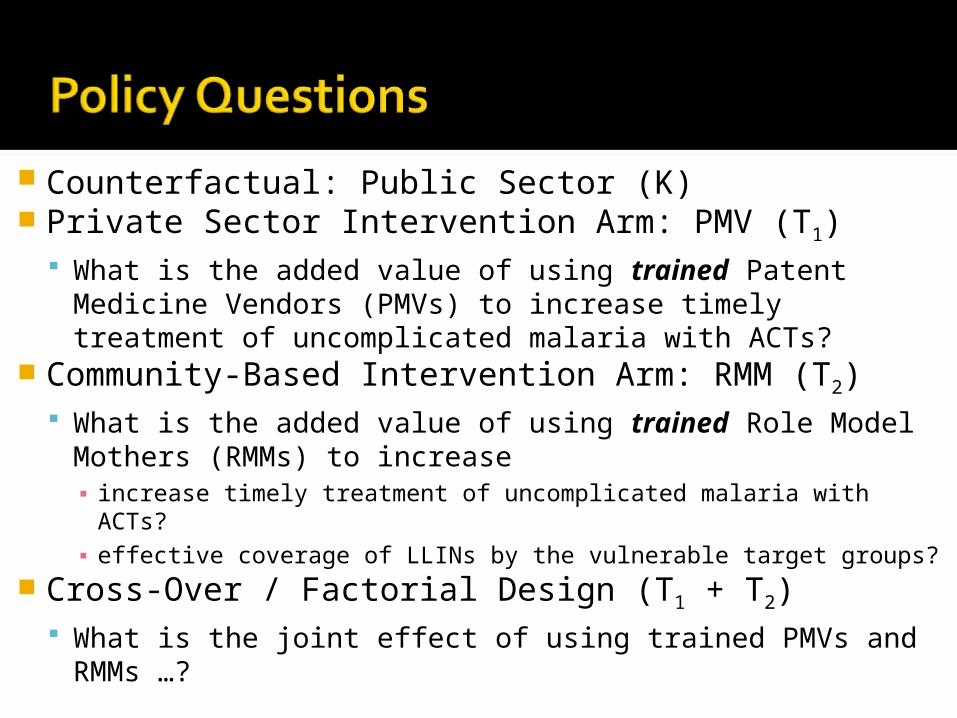
Counterfactual: Public Sector (K) Private Sector Intervention Arm: PMV (T1)
What is the added value of using trained Patent Medicine Vendors (PMVs) to increase timely treatment of uncomplicated malaria with ACTs?
Community-Based Intervention Arm: RMM (T2) What is the added value of using trained Role Model
Mothers (RMMs) to increase▪ increase timely treatment of uncomplicated malaria with ACTs?▪ effective coverage of LLINs by the vulnerable target groups?
Cross-Over / Factorial Design (T1 + T2) What is the joint effect of using trained PMVs and
RMMs …?
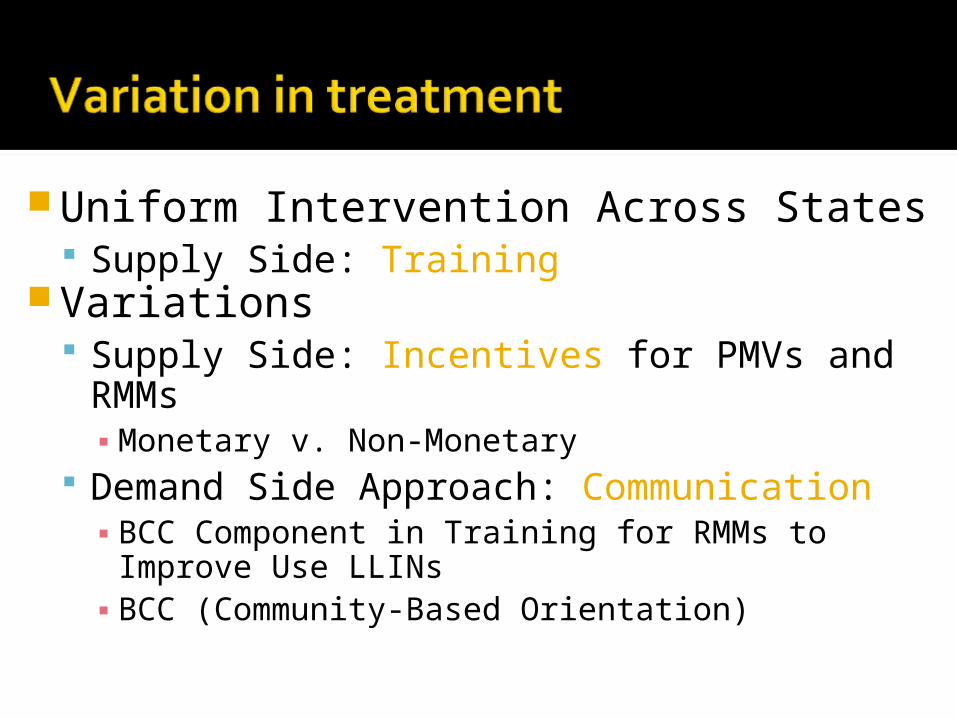
Uniform Intervention Across States Supply Side: Training
Variations Supply Side: Incentives for PMVs and RMMs
▪ Monetary v. Non-Monetary Demand Side Approach: Communication
▪ BCC Component in Training for RMMs to Improve Use LLINs
▪ BCC (Community-Based Orientation)
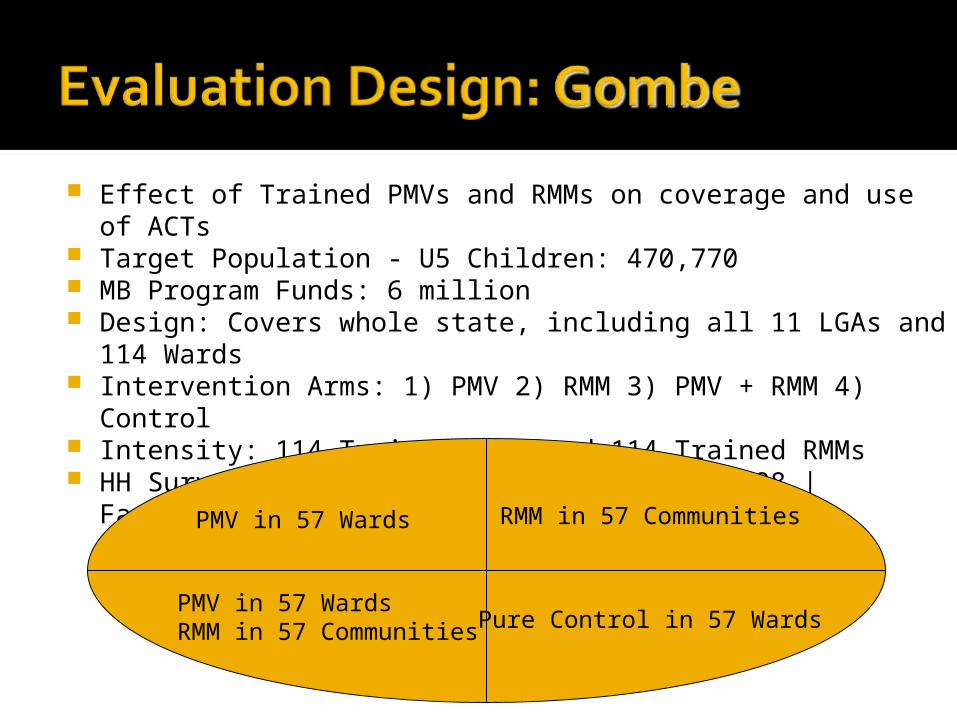
Effect of Trained PMVs and RMMs on coverage and use of ACTs Target Population - U5 Children: 470,770 MB Program Funds: 6 million Design: Covers whole state, including all 11 LGAs and 114 Wards Intervention Arms: 1) PMV 2) RMM 3) PMV + RMM 4) Control Intensity: 114 Trained PMVs and 114 Trained RMMs HH Survey: 2,280 HH | Community Survey: 228 | Facility Survey | MIS
PMV in 57 Wards
PMV in 57 WardsRMM in 57 Communities Pure Control in 57 Wards
RMM in 57 Communities
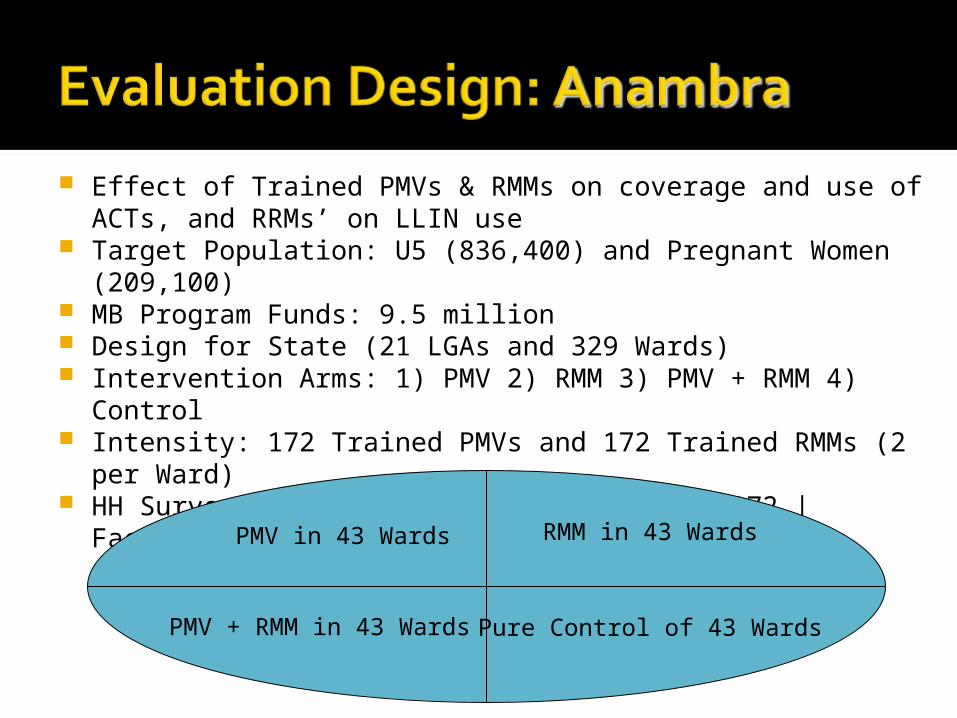
Effect of Trained PMVs & RMMs on coverage and use of ACTs, and RRMs’ on LLIN use
Target Population: U5 (836,400) and Pregnant Women (209,100) MB Program Funds: 9.5 million Design for State (21 LGAs and 329 Wards) Intervention Arms: 1) PMV 2) RMM 3) PMV + RMM 4) Control Intensity: 172 Trained PMVs and 172 Trained RMMs (2 per Ward) HH Survey: 2,064 HH | Community Survey: 172 | Facility Survey | MIS
PMV in 43 Wards
PMV + RMM in 43 Wards Pure Control of 43 Wards
RMM in 43 Wards
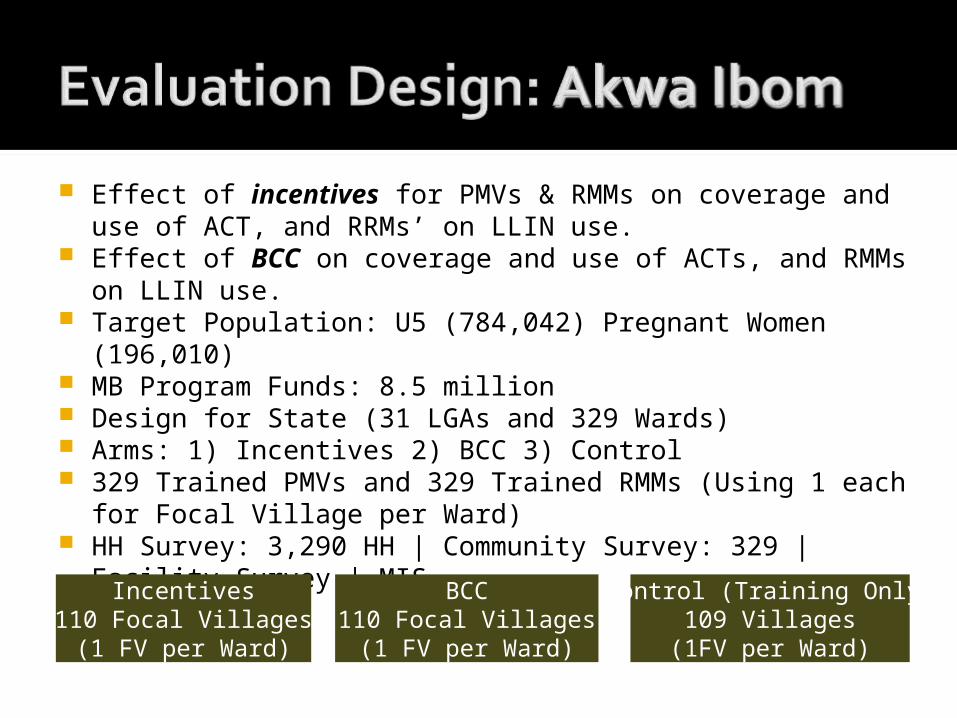
Effect of incentives for PMVs & RMMs on coverage and use of ACT, and RRMs’ on LLIN use.
Effect of BCC on coverage and use of ACTs, and RMMs on LLIN use. Target Population: U5 (784,042) Pregnant Women (196,010) MB Program Funds: 8.5 million Design for State (31 LGAs and 329 Wards) Arms: 1) Incentives 2) BCC 3) Control 329 Trained PMVs and 329 Trained RMMs (Using 1 each for Focal
Village per Ward) HH Survey: 3,290 HH | Community Survey: 329 | Facility Survey | MIS
Incentives110 Focal Villages(1 FV per Ward)
Control (Training Only)109 Villages
(1FV per Ward)
BCC110 Focal Villages(1 FV per Ward)
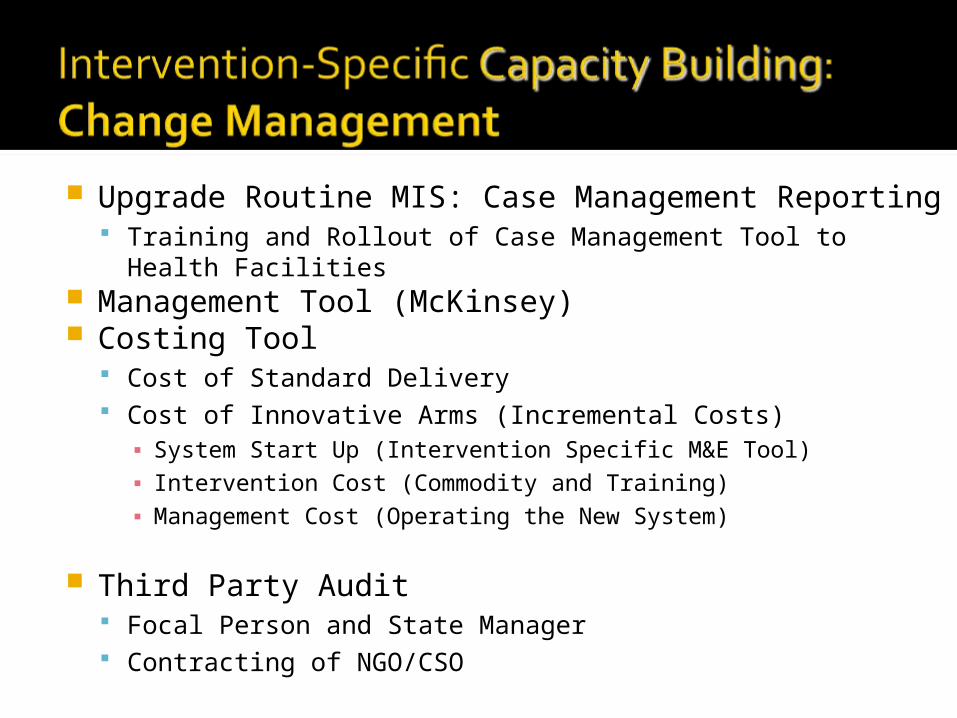
Upgrade Routine MIS: Case Management Reporting Training and Rollout of Case Management Tool to Health Facilities
Management Tool (McKinsey) Costing Tool
Cost of Standard Delivery Cost of Innovative Arms (Incremental Costs)
▪ System Start Up (Intervention Specific M&E Tool)
▪ Intervention Cost (Commodity and Training)
▪ Management Cost (Operating the New System)
Third Party Audit Focal Person and State Manager Contracting of NGO/CSO
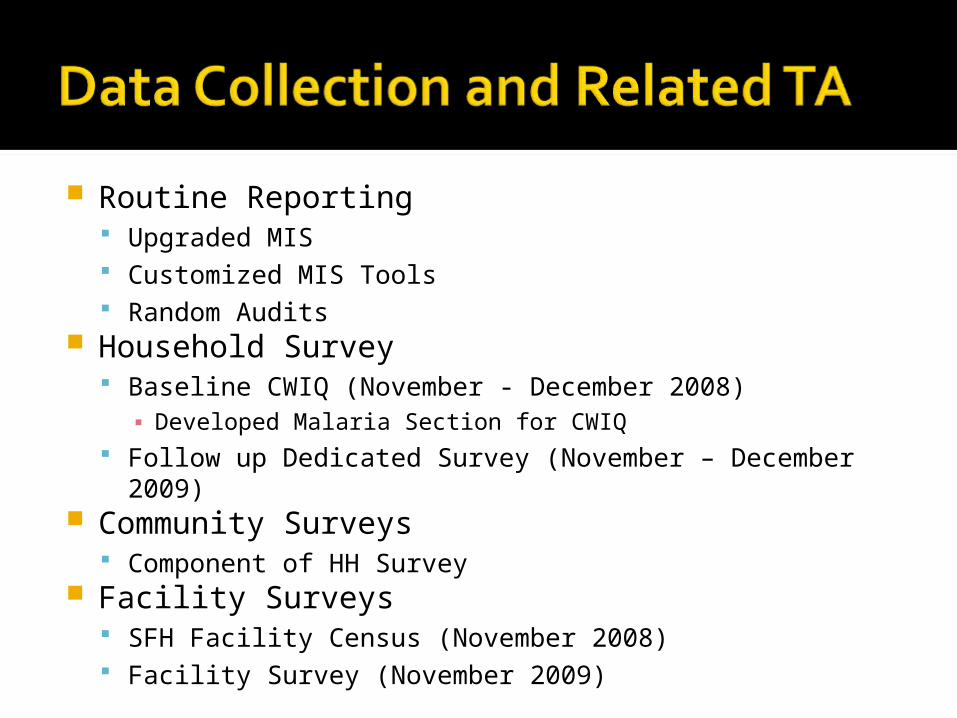
Routine Reporting Upgraded MIS Customized MIS Tools Random Audits
Household Survey Baseline CWIQ (November - December 2008)
▪ Developed Malaria Section for CWIQ Follow up Dedicated Survey (November – December 2009)


![PA E SCHOOLHOUSE NEWS 34 High School - Amazon S3confronts me at every turn. This evening, when Bep [Bep and Miep are secretaries who work in the building] was still here, the doorbell](https://static.documents.pub/doc/80x56/5f768c71566f6023bb77e9bb/pa-e-schoolhouse-news-34-high-school-amazon-s3-confronts-me-at-every-turn-this.jpg)


