115
Arizona Air Quality Designations Boundary Recommendations for the 2008 8-Hour Ozone National Ambient Air Quality Standard Air Quality Division March 12, 2009
| Date post: | 18-Aug-2018 |
| Category: |
Documents |
| Upload: | duongkhanh |
| View: | 219 times |
| Download: | 0 times |

Arizona Air Quality Designations
Boundary Recommendations for the 2008
8-Hour Ozone National Ambient Air Quality Standard
Air Quality Division
March 12, 2009


i
TABLE OF CONTENTS Page
EXECUTIVE SUMMARY ..................................................................... ES-1 I BACKGROUND ........................................................................... 1 II AREA DESIGNATION CRITERIA ........................................................................... 3 III AREA DESIGNATION CRITERIA ANALYSIS .......................................................................... 4
III.A FOR THOSE AREAS RECOMMENDED FOR
ATTAINMENT/UNCLASSIFIABLE ........................................................................... 4 III.A.1 Air Quality Data ........................................................................... 4
III.A.2 Emissions Data ........................................................................... 7
III.A.3 Population Data ......................................................................... 10 III.A.4 Commuting Patterns ......................................................................... 12
III.A.5 Jurisdictional Boundaries ......................................................................... 13 III.A.6 Attainment/Unclassifiable Area Summary of Criteria Analysis ......................................................................... 13
III.B FOR THOSE AREAS RECOMMENDED FOR
NONATTAINMENT ......................................................................... 14
III.B.1 Air Quality Data ......................................................................... 15
III.B.2 Emissions Data ......................................................................... 20
III.B.3 Population Density and Degree of Urbanization ................................................. 28 III.B.4 Traffic and Commuting Patterns ......................................................................... 33
III.B.5 Growth Rates and Patterns ......................................................................... 34
III.B.6 Meteorology ......................................................................... 41
III.B.7 Geography/Topography ......................................................................... 55
III.B.8 Jurisdictional Boundaries ......................................................................... 57
III.B.9 Level of Control of Emissions Sources ............................................................... 58 III.B.10 Nonattainment Area Summary of Criteria Analysis ......................................................................... 61

ii
IV. AREA DESIGNATION RECOMMENDATIONS ....................................................................... 64 IV.A ATTAINMENT/UNCLASSIFIABLE AREAS................................................................ 64 IV.B NONATTAINMENT AREA ......................................................................... 65
LIST OF FIGURES
Page ES1 8-Hour Ozone Nonattainment Area Recommendation................................................. ES-4 III.1 Ozone Ambient Monitoring Networks in 2008 .................................................................. 5 III.2 Arizona Counties and Cities ......................................................................... 11 III.3 Phoenix Area Ozone Monitoring Network ....................................................................... 16 III.4 Ozone Trends at Phoenix Monitors - Central ................................................................... 17 III.5 Ozone Trends at Phoenix Monitors - Central Average..................................................... 18 III.6 Ozone Trends at Phoenix Monitors - East ........................................................................ 19 III.7 Ozone Trends at Phoenix Monitors - East Average.......................................................... 20 III.8 Anthropogenic VOC Emissions ......................................................................... 21 III.9 Anthropogenic NOx Emissions ......................................................................... 22 III.10 Planned and Existing Power Plants ......................................................................... 27 III.11 Population Density 2005 ......................................................................... 29 III.12 Maricopa County Employment 2005 ......................................................................... 30 III.13 Gila County Employment 2005 ......................................................................... 30 III.14 Pinal County Employment 2005 ......................................................................... 31 III.15 Land Ownership ......................................................................... 32 III.16 Annual Average Daily Traffic ......................................................................... 34 III.17 Maricopa County Population 2005 ......................................................................... 35 III.18 Maricopa County Population 2030 ......................................................................... 35 III.19 Gila County Population 2005 ......................................................................... 36 III.20 Gila County Population 2030 ......................................................................... 36 III.21 Pinal County Population 2005 ......................................................................... 37 III.22 Pinal County Population 2030 ......................................................................... 37 III.23 Maricopa County Employment 2030 ......................................................................... 38 III.24 Gila County Employment 2030 ......................................................................... 38 III.25 Pinal County Employment 2030 ......................................................................... 39 III.26 Anthropogenic VOC Emissions ......................................................................... 40 III.27 Anthropogenic NOx Emissions ......................................................................... 41 III.28 Smog Cycles ......................................................................... 43 III.29 Urban/Rural Temperature Profile ......................................................................... 44 III.30 Backward Trajectory July 1, 2006 ......................................................................... 47 III.31 Backward Trajectory July 17, 2006 ......................................................................... 48 III.32 Backward Trajectory July 8, 2008 ......................................................................... 50 III.33 Two Parcel Backward Trajectory July 1, 2006................................................................. 51 III.34 Two Parcel Backward Trajectory June 12, 2008 .............................................................. 52 III.35 Backward Trajectory April 24, 2008 ......................................................................... 53 III.36 Morning Wind Pattern ......................................................................... 54 III.37 Afternoon Wind Pattern ......................................................................... 54 III.38 Phoenix Area Topography ......................................................................... 56 IV.1 8-Hour Ozone Nonattainment Area Recommendation..................................................... 66

iii
LIST OF TABLES Page
ES1 Recommended Attainment/Unclassifiable and Nonattainment Areas for Arizona ..................................................................... ES-5 I.1 Comparison of Ozone National Ambient Air Quality Standards ....................................... 1 III.1 2006-2008 8-Hour Ozone Design Values for Arizona Counties ........................................ 6 III.2 Arizona State and County Emissions Data - VOC ............................................................. 8 III.3 Arizona State and County Emissions Data - NOx .............................................................. 9 III.4 Selected Arizona Demographic Data 2008 and 2000 ....................................................... 10 III.5 Commute Statistics ......................................................................... 12 III.6 2006-2008 8-Hour Ozone Design Values for Maricopa, Pinal, and Gila Counties .......... 15 III.7 National Emissions Inventory for Gila County................................................................. 23 III.8 National Emissions Inventory for Maricopa County ........................................................ 24 III.9 National Emissions Inventory for Pinal County ............................................................... 25 III.10 Planned and Existing Power Plants ......................................................................... 26 III.11 Population Densities in Selected Arizona Counties and Places........................................ 28 III.12 2006 VMT Estimates for the MAG Planning Area .......................................................... 33 III.13 Exceedances July 1, 2006 ......................................................................... 46 III.14 Exceedances July 17, 2006 ......................................................................... 48 III.15 Exceedances July 7, 2008 ......................................................................... 49 III.16 Exceedances July 8, 2008 ......................................................................... 49 III.17 Existing Control Measures ......................................................................... 59 IV.1 Recommended Attainment/Unclassifiable and Nonattainment Areas for Arizona ......................................................................... 67

iv
APPENDICES Initial Reference Page A. Memo from Robert J. Meyers to EPA Regional Administrators, Area Designations for the 2008 Revised Ozone National Ambient Air Quality Standards, December 4, 2008 ..................................................................... ES-1 B. Arizona Ozone Monitoring Sites ........................................................................... 4 C. Annual Fourth Highest 8-Hour Ozone Concentrations 1995-2008 ................................................. 6 D. Three-Year Average of the Annual Fourth Highest 8-Hour Ozone Concentrations 1995-2008 ........................................................................... 6

ES-1
Arizona Air Quality Designations Boundary Recommendations for the 2008
8-Hour Ozone National Ambient Air Quality Standard EXECUTIVE SUMMARY Arizona recommends the majority of the State be designated attainment/unclassifiable for the 2008 8-hour ozone national ambient air quality standard (NAAQS). The one recommended nonattainment area consists of the greater Phoenix metropolitan area, including from the west, the power plants near Gila Bend and west of Tonopah, and continuing east covering the rest of eastern Maricopa County and portions of Pinal County which have experienced substantial growth. This recommendation follows a stakeholder process, the purpose of which was to develop an understanding of the new ozone standard, requirements for designation of nonattainment areas, and options available to the State for implementing the standard. One of the primary reasons for preparing this document is to demonstrate the impracticability of and lack of environmental benefit from designating the nonattainment area boundary based on EPA’s default area definition, which is the core based statistical area (CBSA). According to EPA's guidance, the "presumptive" nonattainment area boundary for areas violating the air quality standard or contributing to a violation in a nearby area is the CBSA (see Appendix A). Core Based Statistical Area is a "collective" term that refers to both metropolitan statistical areas (MSAs) and micropolitan statistical areas. Accordingly, the default boundaries for a potential nonattainment area would be the Phoenix-Mesa-Scottsdale MSA, which includes all of Maricopa and Pinal Counties, and the Payson micropolitan statistical area, which includes all of Gila County. Large portions of the Phoenix-Mesa-Scottsdale MSA and the Payson micropolitan statistical area are rural and sparsely populated and not appropriate for inclusion in the nonattainment area. Although tribal representatives participated in the Arizona Department of Environmental Quality’s (ADEQ’s) stakeholder process, Arizona is not making a recommendation for any tribal lands as tribal lands are not within the State’s jurisdiction. ADEQ respects tribal sovereignty and has worked to develop cooperative relationships with tribal air quality programs throughout the State. Nothing in this analysis should be interpreted to affect the designation of Indian Country. Background On December 4, 2008, The U.S. Environmental Protection Agency (EPA) issued guidance for states to use as they developed their recommendations, Area Designations for the 2008 Revised Ozone National Ambient Air Quality Standards. In addition, Section 107(d)(1)(A)(i) of the Clean Air Act (CAA) defines a nonattainment area as “… any area that does not meet (or that contributes to ambient air quality in a nearby area that does not meet) the national primary or secondary ambient air quality standard for the pollutant…” The December 4, 2008, guidance stated Core Based Statistical Areas, as defined by the U.S. Office of Management and Budget, would be the presumptive default boundary for nonattainment areas. In order to avoid the default, a state must address the following nine criteria listed in the guidance: 1) Air quality data, 2) Emissions data (location of sources and contribution to ozone concentrations), 3) Population density and degree of urbanization (including commercial development), 4) Traffic and commuting patterns,

ES-2
5) Growth rates and patterns, 6) Meteorology (weather and air movement patterns), 7) Geography/topography (mountain ranges or other air basin boundaries), 8) Jurisdictional boundaries (e.g., counties, air districts, existing nonattainment areas, Indian
Reservations, metropolitan planning organizations), 9) Level of control of emission sources. The Phoenix-Mesa-Scottsdale MSA and Payson Micropolitan Statistical Area Are Not Appropriate Nonattainment Area Boundaries The Phoenix-Mesa-Scottsdale MSA includes a total of 14,573 square miles, with Maricopa County accounting for 9,203 square miles and Pinal County with 5,370 square miles. Gila County, the Payson micropolitan statistical area, is 4,768 square miles. Both the Phoenix-Mesa-Scottsdale MSA and Payson micropolitan statistical area include large expanses of undeveloped public lands or agricultural development, and isolated rural communities. A major portion of Pinal County includes two surface water basins that are relatively isolated from the greater Phoenix area. In addition, vast tracts of undeveloped desert and agricultural areas in the south and southeastern part of Pinal County predominate, and are not a significant source of ozone precursors. Prevailing winds during the ozone season greatly limit the impact of emissions from the urbanized Phoenix area on these non-urbanized portions of Pinal County. Southwestern Maricopa County is also largely undeveloped, and although in the same hydrologic basin as the western portion of the greater Phoenix area, is neither a receptor of ozone pollution nor includes significant sources of ozone precursors. Similarly, Gila County does not contain significant sources of ozone precursors and is largely isolated from the Phoenix metropolitan area by mountainous, complex terrain. The air quality record demonstrates that areas where violations of the eight-hour ozone standard are measured are concentrated in the Phoenix urban core and areas to the north and east. With respect to the boundaries of the Phoenix-Mesa-Scottsdale MSA and Payson micropolitan statistical area, this area is confined to the north and eastern portions of Maricopa County, northeast Pinal County, and along the Maricopa County/Gila County border. This border area which includes extreme western Gila County is more closely associated with the Phoenix area hydrologic basin, and as noted above, is geographically isolated from rest of Gila County. Anthropogenic sources of ozone precursors are located in the most heavily urbanized part of the Phoenix-Mesa-Scottsdale MSA. The highest emission densities are collocated with the densest residential and commercial development. While biogenic emissions of ozone precursors are distributed throughout the Phoenix-Mesa-Scottsdale MSA and Payson micropolitan statistical area these sources are less important than anthropogenic emissions in contributing to exceedances of the eight-hour ozone standard measured in and near the Phoenix metropolitan area. Land ownership patterns have greatly influenced development patterns in the Phoenix-Mesa-Scottsdale MSA and Payson micropolitan statistical area and are expected to continue to do so. Only 29 percent of Maricopa County, 27 percent of Pinal County, and less than 4 percent of Gila County are privately owned. Indian reservations as well as State and federal lands create barriers to contiguous expansion of the urbanized core beyond the north central portion of the Phoenix-Mesa-Scottsdale MSA. As a result, the majority of the Phoenix-Mesa-Scottsdale MSA and the Payson micropolitan statistical area are expected to remain as neither a source nor a receptor of ozone pollution.

ES-3
Recommended Alternative Eight-Hour Ozone Nonattainment Area Boundary The nonattainment area recommended by Arizona is smaller than the Phoenix-Mesa-Scottsdale MSA and Payson micropolitan statistical area, and it addresses the criteria identified in EPA’s December 2008 guidance. The recommended area encompasses the existing 8-hour ozone nonattainment area (1997 standard), areas to the west and southwest where new power plants are located and the area to the southeast of the urban core that has experienced substantial residential growth and a new power plant is planned. Weather and transport patterns, location of emissions sources and potential for growth, as well as jurisdictional boundaries all support the exclusion of Gila County from the nonattainment area. The recommended area also excludes the Gila River Indian Community, Salt River Pima Maricopa Indian Community and the Fort McDowell Yavapai Nation over which Arizona has no jurisdiction. Arizona’s alternative recommendation includes an attainment/unclassifiable designation for the rest of the State, as explained in Section III.A. Figure ES1 illustrates the recommended 8-hour nonattainment area. Table ES1 describes by county and township the areas of the State recommended Attainment/Unclassifiable and Nonattainment.

ES-4
Figure ES1: 8-Hour Ozone Nonattainment Area Recommendation
ES-5
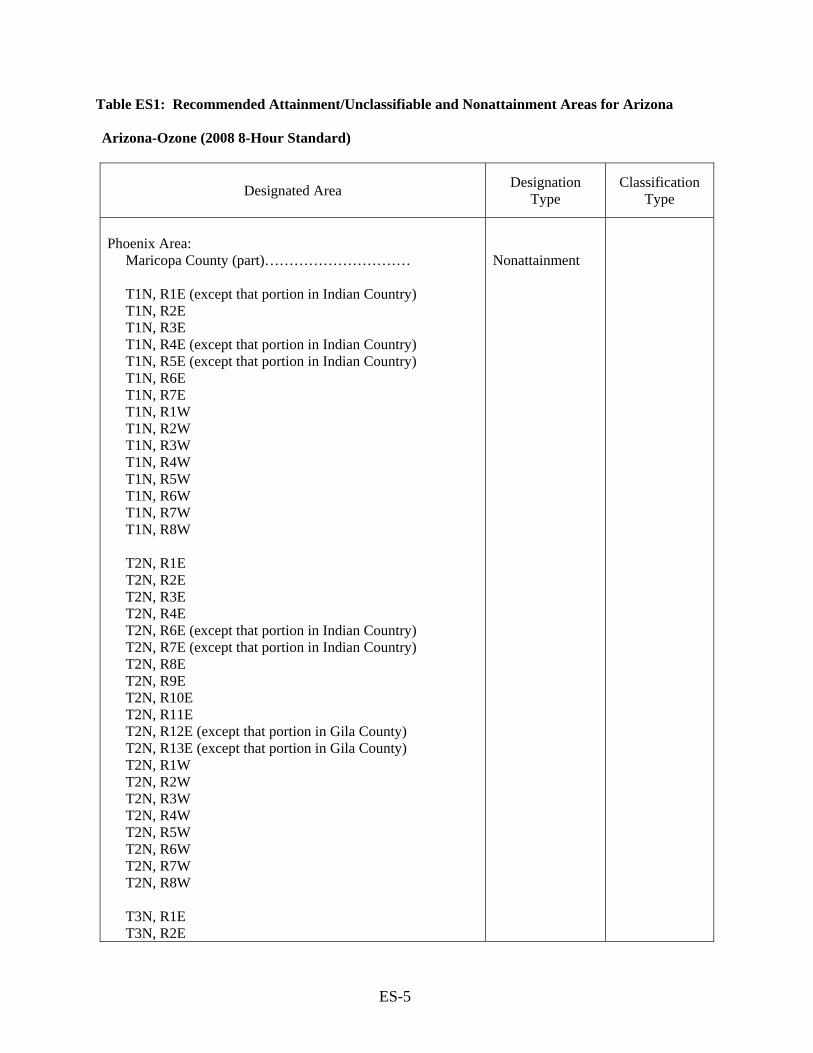
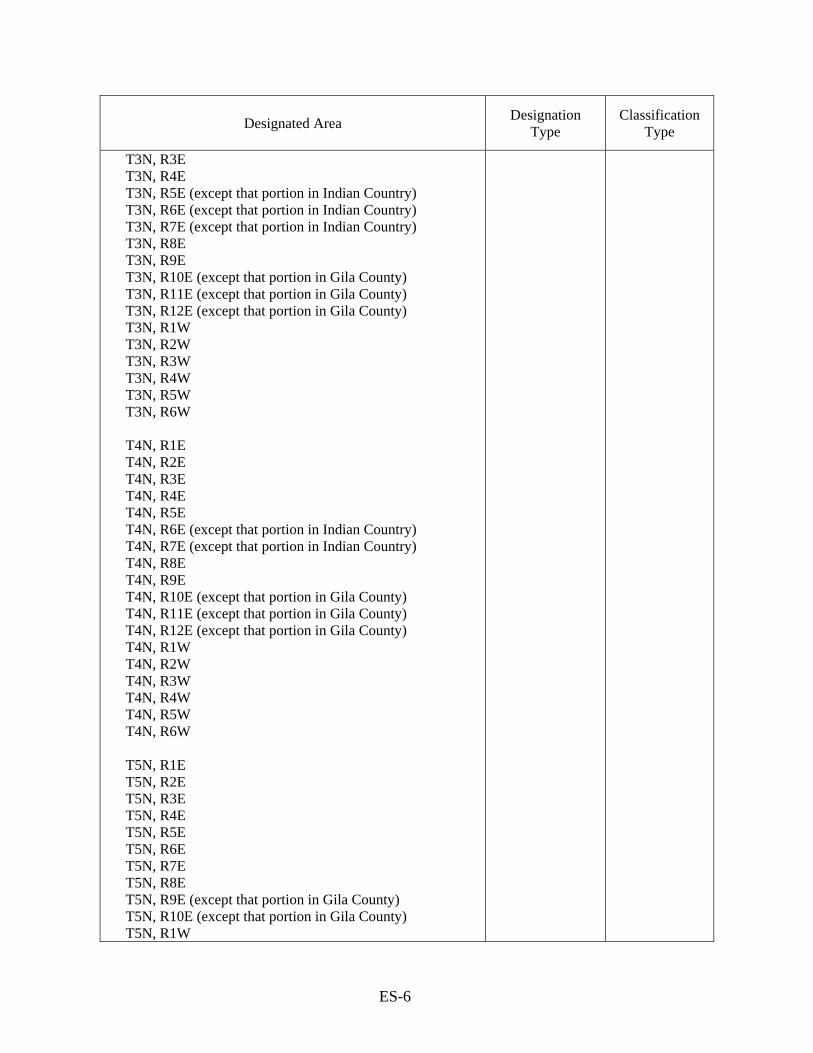
Table ES1: Recommended Attainment/Unclassifiable and Nonattainment Areas for Arizona Arizona-Ozone (2008 8-Hour Standard)
Designated Area
Designation Type
Classification Type
Phoenix Area: Maricopa County (part)………………………… T1N, R1E (except that portion in Indian Country) T1N, R2E T1N, R3E T1N, R4E (except that portion in Indian Country) T1N, R5E (except that portion in Indian Country) T1N, R6E T1N, R7E T1N, R1W T1N, R2W T1N, R3W T1N, R4W T1N, R5W T1N, R6W T1N, R7W T1N, R8W T2N, R1E T2N, R2E T2N, R3E T2N, R4E T2N, R6E (except that portion in Indian Country) T2N, R7E (except that portion in Indian Country) T2N, R8E T2N, R9E T2N, R10E T2N, R11E T2N, R12E (except that portion in Gila County) T2N, R13E (except that portion in Gila County) T2N, R1W T2N, R2W T2N, R3W T2N, R4W T2N, R5W T2N, R6W T2N, R7W T2N, R8W T3N, R1E T3N, R2E
Nonattainment
ES-6
Designated Area
Designation Type
Classification Type
T3N, R3E T3N, R4E T3N, R5E (except that portion in Indian Country) T3N, R6E (except that portion in Indian Country) T3N, R7E (except that portion in Indian Country) T3N, R8E T3N, R9E T3N, R10E (except that portion in Gila County) T3N, R11E (except that portion in Gila County) T3N, R12E (except that portion in Gila County) T3N, R1W T3N, R2W T3N, R3W T3N, R4W T3N, R5W T3N, R6W T4N, R1E T4N, R2E T4N, R3E T4N, R4E T4N, R5E T4N, R6E (except that portion in Indian Country) T4N, R7E (except that portion in Indian Country) T4N, R8E T4N, R9E T4N, R10E (except that portion in Gila County) T4N, R11E (except that portion in Gila County) T4N, R12E (except that portion in Gila County) T4N, R1W T4N, R2W T4N, R3W T4N, R4W T4N, R5W T4N, R6W T5N, R1E T5N, R2E T5N, R3E T5N, R4E T5N, R5E T5N, R6E T5N, R7E T5N, R8E T5N, R9E (except that portion in Gila County) T5N, R10E (except that portion in Gila County) T5N, R1W

ES-7
Designated Area
Designation Type
Classification Type
T5N, R2W T5N, R3W T5N, R4W T5N, R5W T6N, R1E (except that portion in Yavapai County) T6N, R2E T6N, R3E T6N, R4E T6N, R5E T6N, R6E T6N, R7E T6N, R8E T6N, R9E (except that portion in Gila County) T6N, R10E (except that portion in Gila County) T6N, R1W (except that portion in Yavapai County) T6N, R2W T6N, R3W T6N, R4W T6N, R5W T7N, R1E (except that portion in Yavapai County) T7N, R2E (except that portion in Yavapai County) T7N, R3E T7N, R4E T7N, R5E T7N, R6E T7N, R7E T7N, R8E T7N, R9E (except that portion in Gila County) T7N, R1W (except that portion in Yavapai County) T7N, R2W (except that portion in Yavapai County) T8N, R2E (except that portion in Yavapai County) T8N, R3E (except that portion in Yavapai County) T8N, R4E (except that portion in Yavapai County) T8N, R5E (except that portion in Yavapai County) T8N, R6E (except that portion in Yavapai County) T8N, R7E (except that portion in Yavapai County) T8N, R8E (except that portion in Yavapai and Gila
Counties) T8N, R9E (except that portion in Yavapai and Gila
Counties) T1S, R1E (except that portion in Indian Country) T1S, R2E (except that portion in Pinal County and in Indian
Country)

ES-8
Designated Area
Designation Type
Classification Type
T1S, R3E T1S, R4E T1S, R5E T1S, R6E T1S, R7E T1S, R1W T1S, R2W T1S, R3W T1S, R4W T1S, R5W T1S, R6W T2S, R1E (except that portion in Indian Country) T2S, R5E T2S, R6E T2S, R7E T2S, R1W T2S, R2W T2S, R3W T2S, R4W T2S, R5W T3S, R1E T3S, R1W T3S, R2W T3S, R3W T3S, R4W T3S, R5W T4S, R1E T4S, R1W T4S, R2W T4S, R3W T4S, R4W T4S, R5W T5S, R4W (Sections 1 through 22 and 27 through 34) Pinal County (part) ………………………… T1N, R8E T1N, R9E T1N, R10E T1S, R8E T1S, R9E T1S, R10E
Nonattainment

ES-9
Designated Area
Designation Type
Classification Type
T2S, R8E T2S, R9E T2S, R10E (Sections 1 through 12) T3S, R7E T3S, R8E T3S, R9E Rest of State (except those portions in Indian Country) ……………………………………… Apache County Cochise County Coconino County Gila County Graham County Greenlee County La Paz County Maricopa County (part) Remainder of County Mohave County Navajo County Pima County Pinal County (part) Remainder of County Santa Cruz County Yavapai County Yuma County
Attainment/ Unclassifiable

This page intentionally left blank.

1
Arizona Air Quality Designations Boundary Recommendations for the 2008 8-Hour Ozone National Ambient Air Quality Standard
I BACKGROUND The U.S. Environmental Protection Agency (EPA) is charged with developing air quality standards for the protection of human health and the environment. As required by the Clean Air Act (CAA), EPA set primary and secondary National Ambient Air Quality Standards (NAAQS) for six common air pollutants.1 Maximum pollution levels or limits that are based on human health are called primary standards. Limits intended to prevent environmental and property damage are called secondary standards. EPA is also required to periodically evaluate those standards and revise them if scientific analyses indicate new standards would be more protective of public health and welfare. Among the pollutants for which EPA has set air quality standards is ground-level ozone. Ozone is created by chemical reactions between oxides of nitrogen (NOx) and volatile organic compounds (VOC) in the presence of sunlight. Emissions from industrial facilities, motor vehicle exhaust, gasoline vapors, and chemical solvents are frequent sources of the ozone precursors NOx and VOC. Breathing ozone can trigger a variety of health problems including chest pain, throat irritation, and congestion. Ozone can inflame the linings of the lungs and reduce lung function and worsen bronchitis, emphysema, and asthma. Repeated exposure may permanently scar lung tissue. Children are considered among those most at risk from exposure to ozone because they are active outdoors when ozone concentrations are highest. Adults who are outdoors and active during the summer months, as well as those with asthma or respiratory illnesses, are also at risk when exposed to relatively low ozone levels during periods of moderate exertion. Ground-level ozone also damages vegetation and ecosystems and is responsible for reduced crop production. In 2008 EPA completed an analysis of the 8-hour ozone standard and adopted a revised standard to provide more protection for children and other ‘‘at risk’’ populations from exposure to elevated levels of ozone pollution. EPA lowered the primary 8-hour standard (adopted in 1997) from 0.08 parts per million (ppm) to 0.075 ppm (73 FR 16436; March 27, 2008). The secondary standard (for protection of the environment) was revised to a level identical to the primary standard. Table I.1 compares the level of the 1997 ozone standard to the new 2008 standard.
Table I.1: Comparison of Ozone National Ambient Air Quality Standards
Standard Level Averaging Time Form (attainment test)
1997 Standard 0.08 ppm 8 hours Three-year average of the annual fourth highest 8-hour average concentration,
calculated for each monitor
2008 Standard 0.075 ppm 8 hours Three-year average of the annual fourth highest 8-hour average concentration,
calculated for each monitor
1 See http://www.epa.gov/air/criteria.html for a complete list of National Ambient Air Quality Standards.

2
Because of rounding conventions the 1997 8-hour ozone standard translates into a numerical value of 0.084 ppm and any value of 0.085 ppm and above is considered an exceedance. A three-year average of the annual fourth-highest concentration equal to or greater than 0.085 ppm is considered the level of a violation. The 2008 standard is expressed as the three-year average of the annual fourth-highest concentration, not to exceed 0.075 ppm. A level of 0.076 ppm is considered a violation of the 2008 standard. The new standard does not allow for rounding. Information on the data handling conventions and computations necessary for determining whether the 8-hour ambient air quality standards for ozone are met are contained in 40 CFR Part 50, Appendix P.

3
II AREA DESIGNATION CRITERIA Under Clean Air Act (CAA) Section 107(d), states must make recommendations for areas that meet or do not meet new or revised National Ambient Air Quality Standards within one year following the promulgation of such standards. State recommendations for the 2008 8-hour ozone standard are due by March 12, 2009. EPA anticipates promulgation of final ozone designations by March 12, 2010.2 Specifically, states must submit to EPA, attainment (meets or does not contribute to ambient air quality in areas that do not meet the air quality standard), unclassifiable (cannot be classified as meeting or not meeting the standard based on available information), and nonattainment recommendations for all areas of the state. Section 107(d)(1)(A)(i) of the Clean Air Act (CAA) defines a nonattainment area as … any area that does not meet (or that contributes to ambient air quality in a nearby area that does not meet) the national primary or secondary ambient air quality standard for the pollutant… On December 4, 2008, EPA issued guidance, Area Designations for the 2008 Revised Ozone National Ambient Air Quality Standards, for states to use as they develop their recommendations (see Appendix A). EPA recommends "that the Core Based Statistical Area (CBSA) or Combined Statistical Area (CSA) (which includes two or more adjacent CBSAs) associated with the violating monitor(s) serve as the starting point or 'presumptive' boundary for evaluating the geographic boundaries of an ozone nonattainment area." A CBSA is a county containing an urban core plus adjacent counties that have a high degree of social and economic integration with the urban core, measured by commuting ties. If a violating monitor is not located in a CBSA or CSA, EPA recommends "that the boundary of the county containing the monitor serve as the starting point for considering the extent of the nonattainment area." To refine nonattainment boundaries for more appropriate recommendations (either larger or smaller boundaries than the CBSA) a state must perform an area-specific analysis that addresses nine criteria or factors listed in the guidance as follows: 1) Air quality data, 2) Emissions data (location of sources and contribution to ozone concentrations), 3) Population density and degree of urbanization (including commercial development), 4) Traffic and commuting patterns, 5) Growth rates and patterns, 6) Meteorology (weather and air movement patterns), 7) Geography/topography (mountain ranges or other air basin boundaries), 8) Jurisdictional boundaries (e.g., counties, air districts, existing nonattainment areas, Indian
Reservations, metropolitan planning organizations), 9) Level of control of emission sources. In addition, the nonattainment area analysis should show that: "1) violations are not occurring in nearby portions that are excluded from the recommended area, and 2) the excluded nearby portions do not contain emission sources that contribute meaningfully to the observed violations." The guidance further advises that "States and tribes may submit additional information they believe is relevant for EPA to consider." The Arizona Department of Environmental Quality (ADEQ) used these factors in developing the recommended attainment, unclassifiable, and nonattainment boundaries, as detailed in Section III.
2 See EPA's guidance, Area Designations for the 2008 Revised Ozone National Ambient Air Quality Standards, December 4, 2008, in Appendix A.

4
III AREA DESIGNATION CRITERIA ANALYSIS III.A For Those Areas Recommended For Attainment/Unclassifiable As presented in Sections III.A.1 through III.A.6, Arizona’s recommendation for the State’s attainment/unclassifiable areas is based primarily on guidance criteria related to ambient monitoring data, emissions information from EPA’s national emissions inventory, population data, commuting patterns, and jurisdictional boundaries. Sections III.B.1 through III.B.10 summarize the data and information supporting the nonattainment area recommendation. III.A.1 Air Quality Data Arizona Ozone Monitoring Networks In 2008, forty ozone monitoring sites were in operation in ten counties across Arizona. These networks were established according to Code of Federal Regulations (CFR), Title 40, Part 58, Subpart B, Monitoring Network, and are operated by ADEQ, Maricopa County Air Quality Department (MCAQD), the National Park Service (NPS), Pima County Department of Environmental Quality (PDEQ), and Pinal County Air Quality Control District (PCAQCD). Ambient data provides information on population exposure, pollutant transport, background concentrations (non-urban and wilderness areas), and for air quality forecasting. Monitor locations are illustrated in Figure III.1. A list of the monitoring sites, responsible agencies, and monitor operation start and end dates are included in Appendix B. Because Arizona has no jurisdiction in Indian Country, ozone monitoring sites operated by tribes are not included. All network monitors are operated according to the requirements of 40 CFR 58, updated December 2006, including applicable appendices: • Appendix A - Quality Assurance Requirements for State and Local Air Monitoring Stations
(SLAMS), special purpose monitors (SPMs), and prevention of significant deterioration (PSD) air monitoring,
• Appendix C - Ambient Air Quality Monitoring Methodology, • Appendix D - Network Design Criteria for Ambient Air Quality Monitoring, and • Appendix E - Probe and Monitoring Path Siting Criteria for Ambient Air Quality Monitoring.
Some monitors are operated seasonally (April through October) with approval from the EPA Regional Administrator. Most population exposure monitors were established in the Phoenix and Tucson metropolitan areas because of the size of their populations, although the Yuma area has also had a long-term monitor operated on a seasonal basis. In 2008, ADEQ established seasonal monitors in Flagstaff and Prescott to meet the minimum monitoring requirements for these areas. Per 40 CFR Part 58, the agencies annually submit to EPA network monitoring plans. These plans identify the purpose of each monitor and provide evidence that both the siting and the operation of each monitor meet the network design, quality assurance, and other federal requirements. The results of air quality monitoring conducted throughout Arizona are contained in ADEQ's Air Quality Annual Reports available at http://www.azdeq.gov/function/forms/reports.html.

5
Figure III.1: Ozone Ambient Monitoring Networks in 2008

6
Analysis of Ozone Network Data Hourly ambient data from all monitors are collected and reported to EPA's Air Quality System (AQS) database by each responsible agency. Data collected in 2008 must be reported to the AQS no later than March 31, 2009. Responsible agencies must certify that 2008 air quality data reported to the AQS are accurate and meet quality assurance requirements by July 1, 2009. Because each agency is responsible for reviewing and quality assuring their data prior to reporting to the AQS, however, reported data meet certification criteria at the time of reporting. Following the procedures in 40 CFR Part 50 Appendix P, monitoring network design values for the 2008 8-hour ozone standard were determined through the following steps: 1) Hourly ambient ozone concentrations were recorded for each of the monitoring sites across Arizona and reported to the AQS. 2) For each monitor, the daily maximum 8-hour average ozone concentrations were calculated and the fourth highest values for each year were determined by the AQS. The three-year averages of the annual fourth highest values were calculated for the period 2006-2008 per the instructions in Appendix P. 3) The maximum three-year averages for each county containing an ambient ozone monitoring network were compared to the NAAQS of 0.075 ppm for the 8-hour standard. Appendices C and D contain Arizona ambient monitoring data, including summaries of exceedances and violations of the 8-hour standard from 1995 through 2008. The 2006-2008 design values for all Arizona counties including those recommended for attainment/unclassifiable designations are shown in Table III.1.
Table III.1: 2006-2008 8-Hour Ozone Design Values for Arizona Counties County Design Value (ppm)
Apache n/a Cochise 0.069 Coconino 0.070 Gila 0.078 Graham n/a Greenlee n/a La Paz 0.073 Maricopa 0.081 Mohave n/a Navajo 0.070 Pima 0.074 Pinal 0.080 Santa Cruz n/a Yavapai n/a * Yuma 0.074
* ADEQ established an ozone monitor in Prescott in 2008, the only monitor in Yavapai County. Design values are not available for 2006-2008.
Review of the monitored air quality data demonstrates that only Gila, Maricopa, and Pinal Counties have recorded violations of the 8-hour standard for the period 2006 through 2008. The ambient monitors exceeding the standard in Gila, Maricopa, and Pinal Counties are within or near the boundary of the

7
existing Maricopa/Pinal 8-hour ozone nonattainment area (1997 standard) and are discussed further in Section III.B. III.A.2 Emissions Data Section 107 of the Clean Air Act requires that areas contributing to violations of ambient air quality standards in a nearby area be included as part of a nonattainment area. County emissions data show that while it is the 5th largest county, Maricopa County sources emit nearly 3 times the VOC emissions of any other county in the State (Excluding Navajo County which had elevated emissions due to wildfires. See notes for Table III.2.). Similarly, as indicated in Table III.3, Maricopa County NOx emissions were nearly 2 1/2 times higher than any other county. Pinal County, which with Maricopa County comprises the Phoenix-Mesa-Scottsdale Metropolitan Statistical Area (MSA), a Core Based Statistical Area, is 10th out of 15 in size, and only 1.9 percent of statewide VOC and 4.0 percent of NOx emissions emanates from that County.3 Emissions for Gila County, which borders the Phoenix-Mesa-Scottsdale MSA to the east, equate to 1.2 percent of total VOC and 0.5 percent of total NOx emissions. The data also indicate an overall reduction in NOx and VOC emissions for the period 2002-2005, presumably as a result of implementation of federal, state, and local emission control requirements.
3 See Section III.B for discussion of Core Based Statistical Areas and the Phoenix-Mesa-Scottsdale Metropolitan Statistical Area.

8
Table III.2: Arizona State and County Emissions Data (tons) - Volatile Organic Compounds (VOC)
County/State Size Ranking
Area (square miles)
Emissions 2002
Percent of Total 2002
Emissions 2005
Percent of Total 2005
Emissions Change 2002
to 2005
Percent Change
Apache 3 11,204.9 5,168 1.1% 4,433 1.0% -734 -14.2% Cochise 8 6,169.4 9,938 2.1% 9,185 2.0% -753 -7.6% Coconino 1 18,617.4 11,610 2.4% 11,031 2.4% -579 -5.0% Gila 11 4,767.7 5,799 1.2% 5,539 1.2% -260 -4.5% Graham 12 4,629.3 1,841 0.4% 1,717 0.4% -124 -6.7% Greenlee 14 1,847.0 1,307 0.3% 1,259 0.3% -48 -3.7% La Paz 13 4,499.9 2,793 0.6% 2,512 0.5% -281 -10.1% Maricopa 5 9,203.1 115,441 24.3% 110,608 24.0% -4,833 -4.2% Mohave 2 13,311.6 15,645 3.3% 14,191 3.1% -1,454 -9.3% Navajo* 4 9,953.2 231,164 48.7% 230,687 50.1% -477 -0.2% Pima 6 9,186.3 41,603 8.8% 38,624 8.4% -2,979 -7.2% Pinal 10 5,369.6 9,057 1.9% 8,749 1.9% -308 -3.4% Santa Cruz 15 1,237.6 6,292 1.3% 5,987 1.3% -305 -4.8% Yavapai 7 8,123.3 9,235 1.9% 8,631 1.9% -604 -6.5% Yuma 9 5,514.1 7,426 1.6% 7,101 1.5% -325 -4.4% Arizona Total 113,634.6 474,317 100% 460,253 100% -14,065 -3.0%
Source: U.S. Environmental Protection Agency, National Emission Inventory (NEI) databases for 2002 and 2005 * In 2002, the Rodeo-Chediski wildfire, the largest forest fire recorded in Arizona's history, burned more than 467,000 acres of woodland across east-central Arizona (most of the acres burned were in Navajo County, with some damage occurring in contiguous Coconino, Apache, and Gila Counties). The effect of this extraordinary event is evidenced by its impact on the 2002 emission inventory. In 2002 the “Miscellaneous” source category, which includes all types of fires, comprised more than 97 percent of the entire VOC inventory for Navajo County. While the 2002 NEI emission estimates were based on spatially and temporally detailed wildfire data, the 2005 inventory is based on growth factor assumptions applied to the 2002 data set. Consequently, elevated 2005 VOC emission estimates for Navajo County are likely the result of the projection of extreme emissions levels due to one-time wildfire in 2002.

9
Table III.3: Arizona State and County Emissions Data (tons) - Nitrogen Oxides (NOx)
County/State Size Ranking
Area (square miles)
Emissions 2002
Percent of Total 2002
Emissions 2005
Percent of Total 2005
Emissions Change 2002
to 2005
Percent Change
Apache 3 11,204.9 31,888 9.3% 26,345 8.4% -5,543 -17.4% Cochise 8 6,169.4 16,489 4.8% 16,271 5.2% -219 -1.3% Coconino 1 18,617.4 50,032 14.6% 46,080 14.7% -3,952 -7.9% Gila 11 4,767.7 1,971 0.6% 1,661 0.5% -310 -15.7% Graham 12 4,629.3 1,003 0.3% 997 0.3% -6 -0.6% Greenlee 14 1,847.0 474 0.1% 432 0.1% -41 -8.8% La Paz 13 4,499.9 3,772 1.1% 3,003 1.0% -769 -20.4% Maricopa 5 9,203.1 117,977 34.5% 108,088 34.5% -9,889 -8.4% Mohave 2 13,311.6 14,191 4.1% 13,013 4.2% -1,178 -8.3% Navajo 4 9,953.2 30,016 8.8% 30,808 9.8% 792 2.6% Pima 6 9,186.3 33,953 9.9% 30,674 9.8% -3,279 -9.7% Pinal 10 5,369.6 13,616 4.0% 12,493 4.0% -1,123 -8.2% Santa Cruz 15 1,237.6 2,451 0.7% 1,702 0.5% -748 -30.5% Yavapai 7 8,123.3 14,484 4.2% 12,656 4.0% -1,828 -12.6% Yuma 9 5,514.1 9,947 2.9% 9,262 3.0% -684 -6.9% Arizona Total 113,634.6 342,264 100% 313,486 100% -28,778 -8.4%
Source: U.S. Environmental Protection Agency, National Emission Inventory (NEI) databases for 2002 and 2005

10
III.A.3 Population Data Consistent with emissions patterns, the level of population density is low throughout the State with the exception of Maricopa County. By 2008 estimates, Maricopa County contained 60 percent of the State's total population and population density was nearly 4 times higher than the next highest county. Table III.4 summarizes information on county population and density, and identifies the largest city for each county. Figure III.2 illustrates Arizona counties and largest cities within those counties.
Table III.4: Selected Arizona Demographic Data: 2008 and 2000
County/Largest City 2008 Population
2000 Census Population
2008 Density (persons per square mile)
Area (square miles)
Apache County 76,156 69,423 6.8 11,204.9 Eagar 4,810 4,033 Cochise County 139,434 117,755 22.6 6,169.4 Sierra Vista 45,908 37,775 Coconino County 135,613 116,320 7.3 18,617.4 Flagstaff 64,693 52,894 Gila County 57,361 51,335 12.0 4,767.7 Payson 16,965 13,620 Graham County 38,633 33,489 8.3 4,629.3 Safford 9,982 9,232 Greenlee County 8,950 8,547 4.8 1,847.0 Clifton 2,616 2,596 La Paz County 21,544 19,715 4.8 4,499.9 Quartzsite 3,692 3,354 Maricopa County 3,987,942 3,072,149 433.3 9,203.1 Phoenix 1,561,485 1,321,045 Mohave County 205,862 155,032 15.5 13,311.6 Lake Havasu City 55,429 41,938 Navajo County 114,780 97,470 11.5 9,953.2 Show Low 12,315 7,695 Pima County 1,014,023 843,746 110.4 9,186.3 Tucson 543,959 486,699 Pinal County 350,558 179,727 65.3 5,369.6 Casa Grande 45,116 25,224 Santa Cruz County 47,471 38,381 38.4 1,237.6 Nogales 21,709 20,878 Yavapai County 227,348 167,517 28.0 8,123.3 Prescott 43.280 33,938 Yuma County 203,779 160,026 37.0 5,514.1 Yuma 93,719 77,515 Arizona Total 6,629,455 5,130,632 58.3 113,634.6
Source: U.S. Census Bureau, Census 2000, http://factfinder.census.gov/; http://quickfacts.census.gov/qfd/states/; Arizona Department of Commerce, Population Statistics Unit, December 12, 2008.

11
Figure III.2: Arizona Counties and Cities

12
III.A.4 Commuting Patterns As part of the analysis for determining appropriate boundary recommendations, EPA's guidance advises examination of factors that may serve as an indicator of the levels of activities generating ozone precursor emissions, including traffic and commuting patterns. Because the air quality record demonstrates that areas where violations of the eight-hour ozone standard are measured are concentrated in and near the Phoenix metropolitan area, ADEQ reviewed commuting patterns as a measure of the degree of economic integration of the metropolitan area with other counties in the State. The greater Phoenix metropolitan area is part of a Core Based Statistical Area and the basis of the Phoenix-Mesa-Scottsdale Metropolitan Statistical Area (MSA) as defined by the U.S. Office of Management and Budget. The MSA includes all of Maricopa and Pinal Counties.4 Table III.5 describes the number of commuters by residence county that are employed in Maricopa and Pinal Counties. Although total numbers of commuters and proportions have likely changed since the 2000 census, particularly within the MSA, the data illustrate that commuting levels from counties outside the MSA are far below those found between Maricopa and Pinal Counties.
Table III.5: Inter-County Employment Commute Statistics for Maricopa and Pinal Counties from U.S. Census Bureau, April, 2000 Census Employment County Residence County Number of Commuters
Apache 289 Cochise 221
Coconino 859 Gila 1,059
Graham 145 Greenlee 16 La Paz 146
Maricopa 1,381,732 Mohave 269 Navajo 646 Pima 1,838 Pinal 19,918
Santa Cruz 38 Yavapai 3,615 Yuma 231
Maricopa
Total 1,411,022 Apache 7 Cochise 43
Gila 333 Graham 3 Greenlee 6 Maricopa 7,751 Mohave 7 Navajo 7 Pima 1,974 Pinal 35,961
Santa Cruz 11 Yavapai 25 Yuma 13
Pinal
Total 46,141
4 See footnote 3.

13
III.A.5 Jurisdictional Boundaries In its analysis, ADEQ included consideration of existing political boundaries such as county lines and existing control measure applicability areas. For example, the existing 8-hour ozone nonattainment area includes numerous pollution control programs that are applied to address attainment and maintenance of the NAAQS in the Phoenix area. The applicability of Phoenix area emissions control programs for defining the boundaries of the Greater Phoenix nonattainment area is addressed in Section III.B, below. For attainment/unclassifiable recommendations, ambient monitoring data, emissions information, population data, and commuting patterns were considered within the context of county boundaries. Additionally, as the State has no jurisdiction within the interior boundaries of Indian reservations, Arizona is not making a recommendation for any tribal lands. Nothing in this analysis should be interpreted to affect the designation of Indian Country. III.A.6 Attainment/Unclassifiable Area Summary of Criteria Analysis Those areas recommended for attainment/unclassifiable designations are primarily counties where no monitored violations have occurred in the analysis period or where levels of emissions, population density, and commuting patterns indicate that these areas do not contribute to ambient air quality that does not meet the standard. The following entire counties meet these criteria: Apache County, Cochise County, Coconino County, Gila County, Graham County, Greenlee County, La Paz County, Mohave County, Navajo County, Pima County, Santa Cruz County, Yavapai County, and Yuma County. Although the monitor located at the Tonto National Monument in Gila County has recorded ambient concentrations in violation of the standard, this monitor is only 2 miles from the existing nonattainment area boundary and the Maricopa County line. Analysis of topography and transport patterns, land ownership and potential for growth, commuting patterns, location of sources, and jurisdictional boundaries all support its exclusion from the Phoenix nonattainment area. In addition, only portions of Maricopa and Pinal Counties are recommended nonattainment. Gila, Maricopa, and Pinal Counties are discussed in further detail in Section III.B.

14
III.B For Those Areas Recommended For Nonattainment According to EPA's guidance, the "presumptive" nonattainment area boundary for areas violating the air quality standard or contributing to a violation in a nearby area is the Core Based Statistical Area (CBSA). Core Based Statistical Area is a "collective" term that refers to both metropolitan statistical areas (MSAs) and micropolitan statistical areas. Three counties in Arizona contain ambient monitors violating the 2008 8-hour ozone standard for the period 2006-2008: Gila, Maricopa, and Pinal. Accordingly, the default boundaries would be the Phoenix-Mesa-Scottsdale MSA which includes all of Maricopa and Pinal Counties, and the Payson micropolitan statistical area, which includes all of Gila County. The Phoenix-Mesa-Scottsdale MSA includes a total of 14,573 square miles, with Maricopa County accounting for 9,203 square miles and Pinal County with 5,370 square miles. Gila County, the Payson micropolitan statistical area, is 4,768 square miles. By comparison, the Phoenix-Mesa-Scottsdale MSA alone is substantially larger than the land area of Massachusetts, Rhode Island, and Connecticut combined. Both the Phoenix MSA and the Payson micropolitan statistical area include large expanses of undeveloped public lands or agricultural development, and isolated rural communities. The vast tracts of undeveloped and agricultural areas are sources of naturally occurring biogenic emissions but not significant sources of anthropogenic ozone precursors. Prevailing winds during the ozone season greatly limit the impact of emissions from the urbanized Phoenix area on non-urbanized portions of Pinal County. Southwestern Maricopa County is largely undeveloped. Although it is in the same hydrologic basin as the western portion of the greater Phoenix area, it is neither a receptor of ozone pollution nor a significant source of ozone precursors. Gila County is largely isolated from the Phoenix metropolitan area by mountainous, complex terrain. This terrain, which delineates the Maricopa County/Gila County boundary, can also limit the impact of emissions from the urbanized Phoenix area on non-urbanized portions of Gila County. The air quality record demonstrates that areas where violations of the eight-hour ozone standard are measured are concentrated in the Phoenix urban core and areas to the north and east. With respect to the boundaries of the Phoenix MSA and the Payson micropolitan statistical area, the violating area is confined to the north and eastern portions of Maricopa County, northeast Pinal County, and along the Maricopa County/Gila County border. This border area, which includes extreme western Gila County, is more closely associated with the Phoenix area hydrologic basin, and as noted above, is geographically isolated from the rest of Gila County (the violating Gila County monitor is located directly adjacent to the Phoenix MSA, 2 miles east of the Maricopa County/Gila County boundary). Anthropogenic sources of ozone precursors are located in the most heavily urbanized part of the Phoenix MSA. The highest emission densities are collocated with the greatest residential and commercial development. While biogenic emissions of ozone precursors are distributed throughout the three Counties, these emissions are less important than anthropogenic emissions in contributing to exceedances of the eight-hour ozone standard measured in and near the Phoenix metropolitan area. Land ownership patterns have greatly influenced development patterns in both the Phoenix-Mesa-Scottsdale MSA and Payson micropolitan statistical area and are expected to continue to do so. Only 29 percent of Maricopa County, 27 percent of Pinal County, and less than 4 percent of Gila County are privately owned. Indian reservations as well as State and federal lands create barriers to contiguous expansion of the urbanized core beyond the north central portion of the Phoenix-Mesa-Scottsdale MSA. As a result, the majority of the Phoenix-Mesa-Scottsdale MSA and the Payson micropolitan statistical area are expected to remain as neither a source nor a receptor of ozone pollution.

15
This recommendation addresses the 9 factors or criteria outlined in EPA's guidance to determine a more appropriate nonattainment area boundary. What follows is an explanation of how each of the nine criteria were addressed in the decision-making. III.B.1 Air Quality Data Phoenix Area Ozone Monitoring Networks The Maricopa County Air Quality Department, Pinal County Air Quality Control District, and ADEQ operate an extensive network of ozone monitors in and around the Greater Phoenix Area. Currently, 24 monitors are in operation, mostly in the urbanized area, but several are located in rural and even remote locations as far as 50 miles from central Phoenix (e.g. Humboldt Mountain monitor). Since the implementation of the 8-hour ozone network, some sites have been closed and others moved, with EPA’s concurrence, to attempt to create a better understanding of the spatial distribution of the pollutant. Review of 2006-2008 ambient data shows three counties with design values that violate the 2008 8-hour ozone NAAQS: Gila, Maricopa, and Pinal. Table III.6 lists the maximum calculated values by county. In total, 13 monitors recorded violations of the 2008 standard for this period. Appendices C and D contain complete summaries of ambient monitoring data for all monitoring sites. Of the 13 monitors, only two are located outside the existing Maricopa/Pinal 8-hour ozone nonattainment area: Tonto National Monument in Gila County and Queen Valley in Pinal County. The current nonattainment area boundary was designated for the 1997 standard and is centered on and associated with the Phoenix metropolitan area. The Tonto monitoring site is located in complex terrain 2 miles east of the existing nonattainment boundary and the Queen Valley site is approximately 12 miles southeast. Monitor locations, county boundaries, and the current nonattainment area boundary are presented in Figure III.3. Table III.6: 2006-2008 8-Hour Ozone Design Values for Maricopa, Pinal, and Gila Counties Monitor Site County Design Value (ppm) Tonto National Monument Gila 0.078 North Phoenix Maricopa 0.081 Apache Junction Pinal 0.080
The density and distribution of ozone monitors in the urbanized area is adequate to determine compliance with the standard. Distances between monitors in rural areas are relatively large. Extensive areas with mountainous and complex terrain, particularly along the north and eastern Maricopa County boundary, complicate the interpretation of the measurement data and may require the consideration of such phenomenon as plume impingement on high terrain. To determine the spatial representation of each monitor requires a careful review of the measurements record of each monitor and consideration of topographic influences, airflow patterns, and ozone formation dynamics. The following section includes analysis of ozone trends across the greater metropolitan area. Sections III.6 and III.7 discuss the impact of meteorology and topography on the transport of ozone and its precursors.

16
Nonattainment Area (1997 standard)
Figure III.3: Phoenix Area Ozone Monitoring Network

17
Analysis of Ozone Monitoring Data - Ambient Trends To better understand the temporal and spatial distribution of ozone concentrations in the greater Phoenix area, this section examines the ambient trends of the 8-hour standard in the Maricopa County, Pinal County, and ADEQ networks. To provide a more complete picture of the long term trends in 8-hour ozone concentrations, the 1995-2008 portion of the monitoring record was used in the development of the recommendation. Because of the large number of ozone monitoring sites and the role of weather on spatial variation of ozone concentrations, providing a graphic that will allow interpretation of the presence or absence of a trend is best accomplished by averaging and comparing "urban center" and "downwind" sites. Despite increases in population and expansion of the urban area, peak ozone concentrations have decreased in the Phoenix area as is evident by the attainment of the 1-hour standard since 1997 and attainment of the 1997 8-hour standard beginning in 2005. Figure III.4 displays the three-year averages of the fourth highest values for eight long term (1995-2008) monitoring sites in the Phoenix area. These monitors are generally representative of the urbanized area. Although there is considerable site-to-site variability and recent concentrations (since 2003-2005) are slightly higher (with the exception of the North Phoenix monitor), it is clear that ambient concentration values have decreased through time. The Apache Junction monitor has only been in existence since 2002 but, unlike recent network trends, is displaying an increase in values since the 2003-2005 averaging period. Under the old standard of 0.08 ppm, all monitors in Figure III.4 would be in compliance in 2006-2008. Under the new standard of 0.075 ppm, only two monitors would be in compliance during the 2006-2008 monitoring seasons.
Figure III.4: Ozone Trends at Phoenix Monitors - Central
0.065
0.070
0.075
0.080
0.085
0.090
0.095
95-97 96-98 97-99 98-00 99-01 00-02 01-03 02-04 03-05 04-06 05-07 06-08
3-yr
Avg
. 8-h
our
ozon
e C
onc.
(ppm
)
WEST PHOENIXNORTH PHOENIXGLENDALECENTRAL PHOENIXSOUTH SCOTTSDALEJLG SUPERSITEFALCON FIELDAPACHE JUNCTION
Old Standard = 0.08
New Standard = 0.075

18
Figure III.5 illustrates the maximum value and average values among these 8 sites. The trend line for the "maximum 3-year average of the annual fourth high" consists of the highest 3-year average selected from any of the 8 monitors in each of the averaging periods. It clearly indicates decreasing concentrations with an overall drop of 0.010 ppm for the 1995-2008 period. The "average 3-year average of the 4th high" line represents the average of all or any of the 8 sites with sufficient recorded data in each of the 3-year periods. The trend of this statistic is decreasing overall but the difference between the 1995-1997 and the 2006-2008 averages presents a smaller decrease of 0.006 ppm.
0.070
0.075
0.080
0.085
0.090
0.095
95-97 96-98 97-99 98-00 99-01 00-02 01-03 02-04 03-05 04-06 05-07 06-08
3-yr
Avg
. 8-h
our
ozon
e C
onc.
(ppm
)
Maximum 3-Year Avg of 4th High Average 3-Year Avg of 4th High
New Standard = 0.075 ppm
Old Standard = 0.08 ppm
Figure III.6 compares 1995-2008 data from monitors located east of the urban core and generally considered to be downwind of the center of Phoenix (see Section III.B.6 for a discussion of the meteorology of the Phoenix area). There is not as much year-to-year variability but as with the "urban core" monitors ambient concentration values have decreased through time. The Blue Point site values have decreased dramatically since the 2003-2005 averaging period. For the 2006-2008 period, all monitors depicted in Figure III.6 would have been in compliance under the 1997 8-hour standard. Under the new standard, only two of the monitors are in compliance.
Figure III.5: Ozone Trends at Phoenix Monitors - Central Average
19
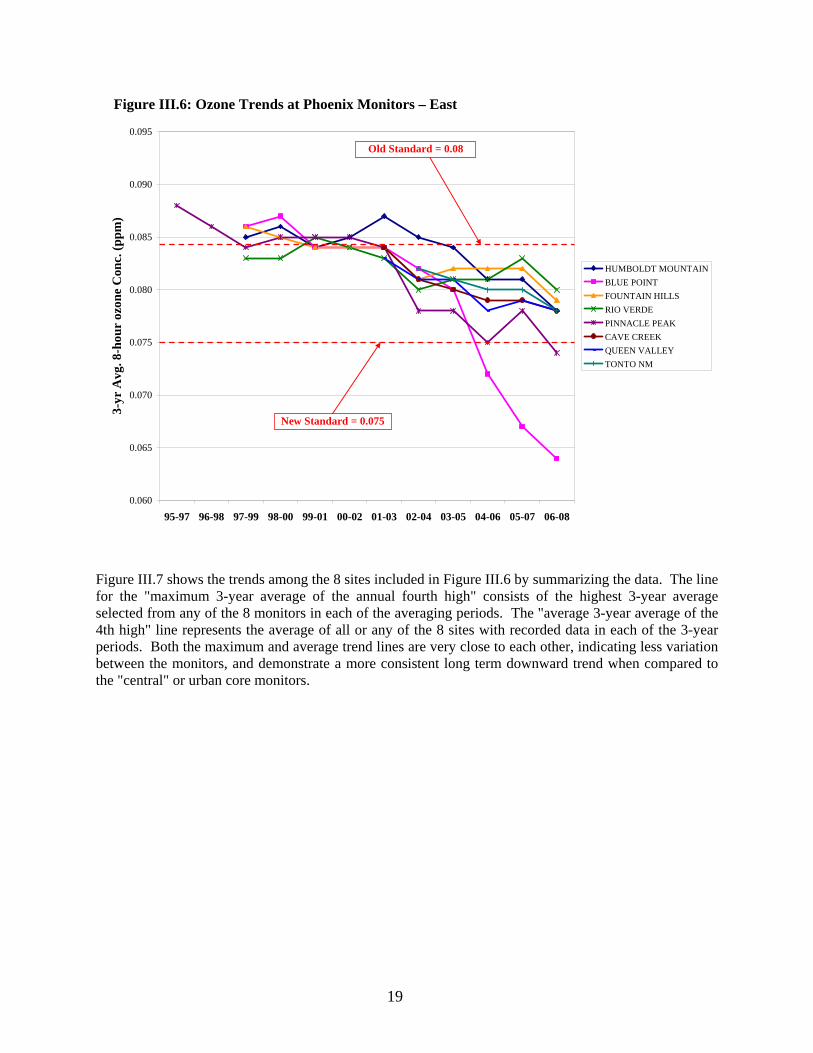
Figure III.6: Ozone Trends at Phoenix Monitors – East
0.060
0.065
0.070
0.075
0.080
0.085
0.090
0.095
95-97 96-98 97-99 98-00 99-01 00-02 01-03 02-04 03-05 04-06 05-07 06-08
3-yr
Avg
. 8-h
our
ozon
e C
onc.
(ppm
)
HUMBOLDT MOUNTAINBLUE POINTFOUNTAIN HILLSRIO VERDEPINNACLE PEAKCAVE CREEKQUEEN VALLEYTONTO NM
Old Standard = 0.08
New Standard = 0.075
Figure III.7 shows the trends among the 8 sites included in Figure III.6 by summarizing the data. The line for the "maximum 3-year average of the annual fourth high" consists of the highest 3-year average selected from any of the 8 monitors in each of the averaging periods. The "average 3-year average of the 4th high" line represents the average of all or any of the 8 sites with recorded data in each of the 3-year periods. Both the maximum and average trend lines are very close to each other, indicating less variation between the monitors, and demonstrate a more consistent long term downward trend when compared to the "central" or urban core monitors.

20
0.070
0.075
0.080
0.085
0.090
95-97 96-98 97-99 98-00 99-01 00-02 01-03 02-04 03-05 04-06 05-07 06-08
3-yr
Avg
. 8-h
our
ozon
e C
onc.
(ppm
)
Maximum 3-Year Avg of 4th High Average 3-Year Avg of 4th High
New Standard = 0.075 ppm
Old Standard = 0.08 ppm
III.B.2 Emissions Data (location of sources and contribution to ozone concentrations) Section 107 of the Clean Air Act requires that areas not contribute to violations of ambient air quality in a nearby area. Activities within Maricopa County constitute the largest source of emissions of ozone precursors in the area and most of these emissions are concentrated in and around the more densely populated Phoenix urban area. Eastern and southwest Maricopa County, southern and eastern Pinal County, and western Gila County are otherwise relatively undeveloped and not a significant source area for ozone precursor emissions. This section examines the general distribution of emissions, the source categories, and the location of electric generation facilities for Maricopa, Pinal, and Gila Counties. Emissions Distribution Modeling Emissions, meteorological, and air quality modeling for the greater Phoenix area were conducted by the Maricopa Association of Governments for the November 2008, Draft Eight-Hour Ozone Redesignation Request and Maintenance Plan for the Maricopa Nonattainment Area. The plan's modeling analysis was performed to demonstrate maintenance of the 1997 8-hour ozone standard through 2025. Selection of the air quality modeling domain for these simulations considered "the existing 8-hour ozone nonattainment area boundaries, the distribution of major emissions sources, the locations of meteorological and air quality monitoring sites, and regional ozone transport patterns in the vicinity" of the nonattainment area. A full description of the modeling methodology is contained in the November 2008, Draft Technical Support Document for Ozone Modeling in support of the Eight-Hour Ozone Redesignation Request and Maintenance Plan for the Maricopa Nonattainment Area. Figures III.8 and III.9 below illustrate analysis results for anthropogenic emissions of the two ozone precursors, VOC and NOx, and provide an example
Figure III.7: Ozone Trends at Phoenix Monitors – East Average

21
of the distribution of emissions in the greater Phoenix metropolitan area. The greatest level of VOC emissions closely follows the developed urban core and to a lesser extent major transportation corridors in the study area. The distribution of NOx emissions display a similar pattern with highest values concentrated in the phoenix urban area and along transportation routes. The highest densities for both pollutants are located within the existing 8-hour ozone boundary.
Source: Maricopa Association of Governments, November 2008, Draft Technical Support Document for Ozone Modeling in support of the Eight-Hour Ozone Redesignation Request and Maintenance Plan for the Maricopa Nonattainment Area, "Anthropogenic VOC Emissions for a Tuesday in July, 2005."
Figure III.8: Anthropogenic VOC Emissions

22
Emissions Source Categories Tables III.7 through III.9 present 2002 and 2005 emissions inventories by source category for Gila, Maricopa, and Pinal Counties. A review of the data demonstrates that Gila County VOC emissions are 5 percent of Maricopa County totals and Pinal County VOC emissions are approximately 8 percent of those for Maricopa County. Similarly, Gila and Pinal County NOx emissions are significantly lower than those from Maricopa County. Notably, Gila County NOx emissions are 0.5 percent of Statewide emissions and 1.5 percent of Maricopa County totals. Highway and off-highway vehicles comprise the largest source category for both VOC and NOx emissions in Gila and Pinal Counties. By comparison, Maricopa County emissions show a more diversified source distribution with storage and transport and solvent utilization processes important contributors to the inventory. Electric utilities are significant for NOx emissions in Maricopa County. The data indicate an overall reduction in NOx and VOC emissions in all three Counties for the period 2002-2005. The largest decreases in emissions are estimated for the highway vehicles source category in all three Counties, and electric utility fuel combustion sources in Maricopa and Pinal Counties. Reductions in emissions are likely the result of implementation of a variety of federal, State, and local emission control requirements, because both population and economic activity increased during that time period.
Source: Maricopa Association of Governments, November 2008, Draft Technical Support Document for Ozone Modeling in support of the Eight-Hour Ozone Redesignation Request and Maintenance Plan for the Maricopa Nonattainment Area, "Anthropogenic NOx Emissions for a Tuesday in July, 2005."
Figure III.9: Anthropogenic NOx Emissions

23
Table III.7: National Emissions Inventory Tier 3 Summary for Gila County (tons)
Volatile Organic Compounds (VOC)
Emissions Source Category Emissions 2002 Emissions 2005 Emissions Change 2002 to 2005 Percent Change
Chemical & Allied Product Manufacturing 62 62 0 0% Fuel Combustion Electric Utility Fuel Combustion Industrial 1 1 0 0% Fuel Combustion Other 158 158 0 0% Highway Vehicles 1,060 787 -273 -26% Metals Processing 2 2 0 0% Miscellaneous 823 838 15 2% Off-Highway 2,559 2,572 13 1% Other Industrial Processes 64 64 0 0% Solvent Utilization 690 690 0 0% Storage & Transport 259 259 0 0% Waste Disposal & Recycling 120 120 0 0% Total 5,799 5,554 -245 -4%
Nitrogen Oxides (NOx) Chemical & Allied Product Manufacturing 2 2 0 0% Fuel Combustion Electric Utility Fuel Combustion Industrial 47 47 0 0% Fuel Combustion Other 48 48 0 0% Highway Vehicles 1,387 1,103 -284 -20% Metals Processing 39 39 0 0% Miscellaneous 36 36 0 0% Off-Highway 378 352 -26 -7% Other Industrial Processes 2 2 0 0% Solvent Utilization Storage & Transport Waste Disposal & Recycling 32 32 0 0% Total 1,971 1,661 -310 -16%

24
Table III.8: National Emissions Inventory Tier 3 Summary for Maricopa County (tons)
Volatile Organic Compounds (VOC)
Emissions Category Emissions 2002 Emissions 2005 Emissions Change 2002 to 2005 Percent Change
Chemical & Allied Product Manufacturing 37 37 0 0% Fuel Combustion Electric Utility 60 38 -22 -36% Fuel Combustion Industrial 99 99 0 0% Fuel Combustion Other 3,201 3,201 0 0% Highway Vehicles 36,581 35,057 -1,524 -4% Metals Processing 132 132 0 0% Miscellaneous 129 129 0 0% Off-Highway 26,959 23,672 -3,287 -12% Other Industrial Processes 1,757 1,757 0 0% Petroleum & Related Industries 9 9 0 0% Solvent Utilization 35,517 35,517 0 0% Storage & Transport 10,255 10,255 0 0% Waste Disposal & Recycling 703 703 0 0% Total 115,441 110,608 -4,833 -4%
Nitrogen Oxides (NOx) Chemical & Allied Product Manufacturing 1 1 0 0% Fuel Combustion Electric Utility 3,112 2,240 -872 -28% Fuel Combustion Industrial 1,293 1,293 0 0% Fuel Combustion Other 3,888 3,888 0 0% Highway Vehicles 76,783 69,239 -7,543 -10% Metals Processing 52 52 0 0% Miscellaneous 33 33 0 0% Off-Highway 32,676 31,202 -1,474 -5% Other Industrial Processes 31 31 0 0% Petroleum & Related Industries 10 10 0 0% Solvent Utilization Storage & Transport 5 5 0 0% Waste Disposal & Recycling 93 93 0 0% Total 117,977 108,088 -9,889 -8%

25
Table III.9: National Emissions Inventory Tier 3 Summary for Pinal County (tons)
Volatile Organic Compounds (VOC)
Emissions Category Emissions 2002 Emissions 2005 Emissions Change 2002 to 2005 Percent Change
Chemical & Allied Product Manufacturing 11 11 0 0% Fuel Combustion Electric Utility 35 23 -12 -35% Fuel Combustion Industrial 1 1 0 0% Fuel Combustion Other 108 108 0 0% Highway Vehicles 4,077 3,738 -339 -8% Metals Processing 0 0 0 Miscellaneous 367 367 0 0% Off-Highway 1,738 1,780 43 2% Other Industrial Processes 192 192 0 0% Solvent Utilization 993 993 0 0% Storage & Transport 839 839 0 0% Waste Disposal & Recycling 695 695 0 0% Total 9,057 8,749 -308 -3%
Nitrogen Oxides (NOx) Chemical & Allied Product Manufacturing 0 0 Fuel Combustion Electric Utility 304 178 -126 -42% Fuel Combustion Industrial 81 81 0 0% Fuel Combustion Other 90 90 0 0% Highway Vehicles 8,500 7,604 -896 -11% Metals Processing 0 0 0 Miscellaneous 21 21 0 0% Off-Highway 4,295 4,194 -101 -2% Other Industrial Processes 76 76 0 0% Solvent Utilization Storage & Transport Waste Disposal & Recycling 249 249 0 0% Total 13,616 12,493 -1,123 -8%

26
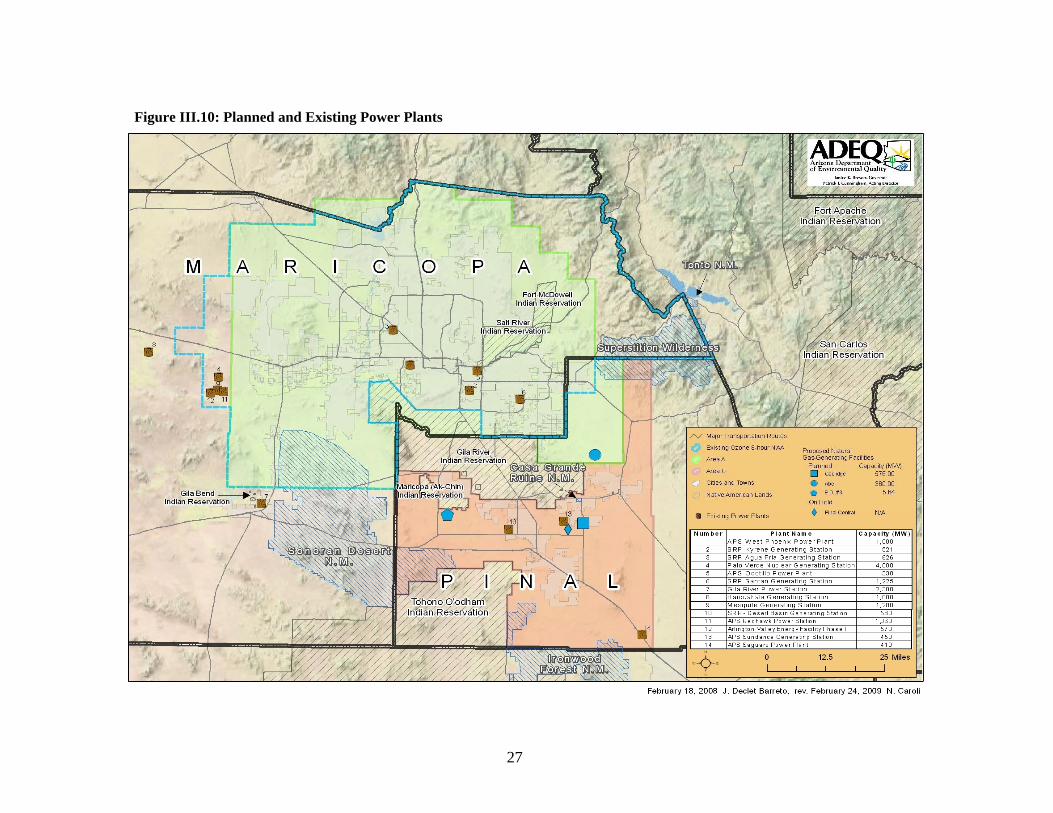
Stationary Sources - Electric Generating Facilities Fuel combustion at electric utilities can be a significant contributor to emissions of ozone precursors, particularly emissions of NOx. Figure III.10 depicts the location of planned and existing power plants located in Maricopa and Pinal Counties. Table III.10 lists the capacities and allowable NOx and VOC emissions for each facility in tons per year (tpy). Of the 14 existing power plants, 9 are located within the existing 8-hour ozone nonattainment area boundary. Two facilities, Harquahala and Gila River, are located to the west and southwest of the nonattainment area. Based on prevailing wind patterns, these facilities are generally considered to be upwind sources and contribute to elevated ozone levels within the Phoenix nonattainment area. Facilities to the south, immediately adjacent to the Phoenix urban core (i.e. Abel) may also impact air quality in eastern Maricopa and northeast Pinal Counties. Section III.B.6 describes the transport meteorology affecting emissions from sources west and south of the Phoenix area. Based on transport patterns, it is appropriate to include the Harquahala, Gila River, and Abel facilities within the recommended nonattainment area boundary.
Table III.10: Planned and Existing Power Plants Allowable Emissions
Name Capacity (MW) NOx (tpy) VOC (tpy)
Maricopa County APS Ocotillo Power Plant 330 135 19 APS West Phoenix Power Plant 1,000 405 56 APS Redhawk Power Station 1,060 1,452 242 Palo Verde Nuclear Generating Station 4,000 SRP Agua Fria Generating Station 626 160 35 SRP Kyrene Generating Station 521 141 26 SRP Santan Generating Station 1,225 1,269 94 Harquahala Generating Station 1,000 324 102 Mesquite Generating Station 1,200 408 295 Dynergy Energy Arlington Valley 570 242 123 Gila River Power Station 2,300 860 144
Pinal County SRP Desert Basin Generating Station 580 214 104 APS Sundance Generating Station 450 351 165 APS Saguaro Power Plant 410 9,442 80 Transcanada Coolidge Generating Station (planned) 576 245 245
SRP Abel Generating Station (planned) 360 95 45 Electrical District No. 3 (planned) <6 24 15 Pinal Central (on hold) n/a n/a n/a
27
Figure III.10: Planned and Existing Power Plants

28
III.B.3 Population Density and Degree of Urbanization (including commercial development) For this criterion population density, employment, and land ownership were examined throughout the study area. These data and information provide an indicator of the levels of activity that may contribute to emissions of ozone precursors as well as population exposed to elevated ozone concentrations. Table III.11 contains selected population and density information at county and city levels. A review of population data shows that population densities are greatest in Maricopa County. To illustrate, Maricopa County population density is nearly 7 times higher than Pinal County and 36 times higher than Gila County. Only about 12 percent of Maricopa County can be considered urban, however, and the highest populations and densities are centered in the urban core of the greater Phoenix area.5 Figure III.11 depicts estimated 2005 population density by census tract based on 2000 U.S. Census Bureau data.
Table III.11: Population Densities in Selected Arizona Counties and Places
County/Place Land Area In Square Miles
Persons Per Square Mile
Population 2000 Census
Pinal County 5,369.59 33.5 179,727 Apache Junction 34.23 922.9 31,814 Casa Grande 48.17 523.6 25,224 Coolidge 5.03 1,549.1 7,786 Eloy 71.67 144.8 10,375 Florence 8.29 2,056.2 17,054 Maricopa CDP 4.04 257.6 1,040 Gila County 4,767.70 10.8 51,335 Globe 18.02 415.5 7,486 Hayden 1.25 715.3 892 Miami 1,936 2,008.0 1,936 Payson 19.47 699.6 13,620 Maricopa County 9,203.14 333.8 3,072,149 Tempe 40 3,959.7 158,625 Phoenix 474 2,782 1,321,045 Surprise 69 443.9 30,848
5 See Greater Phoenix Regional Atlas, Arizona State University, 2003.

29
Figure III.11: Population Density 2005
Sources: U.S. Census Bureau, ESRI.
Employment is another of the surrogate factors that may serve as an indicator of the degree of activities generating ozone precursor emissions. Figures III.12 through III.14 present total employment and employment per square mile in Maricopa, Gila, and Pinal Counties. As expected, Maricopa County records the highest total employment values. To compare, Maricopa County 2005 employment is estimated at 1,747,500 with Gila County totaling 11,900 and Pinal County 45,000. Higher employment densities are concentrated in the centers of towns and cities, and to a lesser extent along transportation corridors. Though dispersed throughout the urban core, the highest rates are centered on downtown Phoenix. Population density and employment patterns closely reflect the distribution of anthropogenic emissions as illustrated in Figures III.8 and III.9.

30
Figure III.12: Maricopa County Employment 2005
Source: Arizona Department of Transportation (Building A Quality Arizona) Figure III.13: Gila County Employment 2005
Source: Arizona Department of Transportation (Building A Quality Arizona)

31
Figure III.14: Pinal County Employment 2005
Source: Arizona Department of Transportation (Building A Quality Arizona) Figure III.15 shows a broad range of land ownership in the study area. Land ownership patterns have greatly influenced development patterns in the greater Phoenix area and are expected to continue to do so. Only 29 percent of Maricopa County and 27 percent of Pinal County are privately owned. Corporate and private ownership comprise less than 4 percent of Gila County. Indian reservations as well as State and federal lands create barriers to contiguous expansion of the urbanized core beyond the north central portion of the Phoenix MSA. This pattern of ownership is evident in the distribution of population density and employment as illustrated in Figures III.11 through III.14. For example, the greatest population and employment densities follow areas of private land ownership as depicted in Figure III.15. The lowest levels coincide with state and federal land ownership as seen in eastern Maricopa and western Gila Counties. Similarly, the distribution of Indian land in south central Maricopa County and northwest Pinal County are also consistent with areas of low population and employment densities. The existence of public lands and Indian reservations has directed and is expected to continue to direct where growth occurs in the greater Phoenix area.

32
Figure III.15: Land Ownership
Source: Arizona Land Resource Information System

33
III.B.4 Traffic and Commuting Patterns The greater Phoenix area has developed and continues to develop with a concentrated urban center. That is to say the majority of economic activity and employment occurs in the urban core and following major corridors, radiating from the urban core (see Figures III.12-III.14). These employment centers are surrounded by concentric development of residential areas mixed with commercial development designed to serve the local populations. As a result, the traffic and commuting patterns involve movement of vehicles from throughout the urbanized area toward the urban core in the morning (morning “rush-hour”), continued traffic concentrated in the urban core during business hours, and the return of vehicles to residential areas from the urban core in the evening (evening “rush-hour”). This pattern is demonstrated in the MAG Regional Freeway Bottleneck Study, Task 5, Traffic Data Working Paper (May 7, 2002), which shows highest freeway traffic volumes in the urban core, and from 7 to almost 10 percent of traffic volume on freeways in the urban core occurs on inbound lanes during peak morning hour and outbound lanes during the peak evening hour. In addition, interstate traffic moves along Interstate 10, which connects California markets to Arizona and other southern states, and Interstate 17, which connects Interstate 40, another major east-west conduit, to Interstate 10. The vast majority of the traffic and vehicle miles traveled in the greater Phoenix area, however, are locally generated Figure III.16 illustrates where traffic is concentrated in the greater Phoenix area. In addition, vehicle miles traveled (VMT) estimates for 2006 in the MAG Carbon Monoxide Redesignation Request and Maintenance Plan for the Maricopa County Nonattainment Area, May 2003, demonstrate this fact (see Table III.12 below).
Table III.12: 2006 VMT Estimates for the MAG Planning Area Freeways Arterials Collectors Locals Total
30,090,000 47,679,000 2,919,000 9,329,000 90,017,000 33.4% 53.0% 3.2% 10.4% 100%
About two-thirds of all traffic occurs off of the freeways, and the majority of freeway traffic is of local origin as well. This mode of traffic is expected to continue into the future. As is characteristic of concentric development around an urban core, development expanding beyond the urban fringe will result in greater average home-to-work commute distances. It may be concluded that, given the commuting and traffic patterns in the greater Phoenix area, the size of the nonattainment area should be sufficiently large to include the expected suburban frontier at the end of the maintenance period. Since on-road vehicles are the largest anthropogenic source category and account for more than 30 percent of VOC emissions and 60 percent of the NOx inventories in Maricopa and Pinal Counties (see Tables III.8 and III.9), it may be necessary to assure that appropriate Clean Air Act regulations apply to as many of these vehicles as possible.

34
Figure III.16: Annual Average Daily Traffic
Sources: Arizona Department of Transportation (Highway Performance Management System, 2007)
III.B.5 Growth Rates and Patterns In its analysis of population density and the degree of urbanization, ADEQ took a long-term view, anticipating that a maintenance plan would be developed demonstrating that attainment would continue to be achieved for a growing urban area. For this criterion, changes in total population and density and employment patterns were reviewed for the period through 2030. Projected emissions throughout the area were examined through 2025. Figures III.17 through III.22 compare estimated changes in the distribution of population and densities in Maricopa, Gila, and Pinal Counties from 2005 through 2030. As noted in Section III.B.3, land ownership patterns have greatly influenced development patterns in the Phoenix MSA and are expected to continue to do so (see Figure III.15). Indian reservations as well as State and federal lands create barriers to contiguous expansion of the urbanized core. As a result, the majority of growth is expected to continue to be in areas of private land ownership, primarily to the west and southeast of the Phoenix urban core. The greatest projected growth in Maricopa County is along the western fringe of the Phoenix urban area, with little growth expected in the eastern part of the County. Pinal County growth generally occurs in the north central portion of the County in areas contiguous with the urban core (Apache Junction and Queen Creek areas). Additional growth follows the I-10 and I-8 corridors, south of the Gila River and Ak-Chin Indian Reservations. Little or no increase in persons per square mile is expected throughout most of Gila County. The majority of the remainder of the Phoenix MSA and the Payson micropolitan statistical area are expected to continue as neither a source nor a receptor of ozone pollution. The analysis was narrowed to look at future employment patterns as shown in Figures III.23 through III.25. As expected, the growth in employment closely follows the projected population patterns.

35
Figure III.17: Maricopa County Population 2005
Source: Arizona Department of Transportation (Building A Quality Arizona) Figure III.18: Maricopa County Population 2030
Source: Arizona Department of Transportation (Building A Quality Arizona)

36
Figure III.19: Gila County Population 2005
Source: Arizona Department of Transportation (Building A Quality Arizona) Figure III.20: Gila County Population 2030
Source: Arizona Department of Transportation (Building A Quality Arizona)
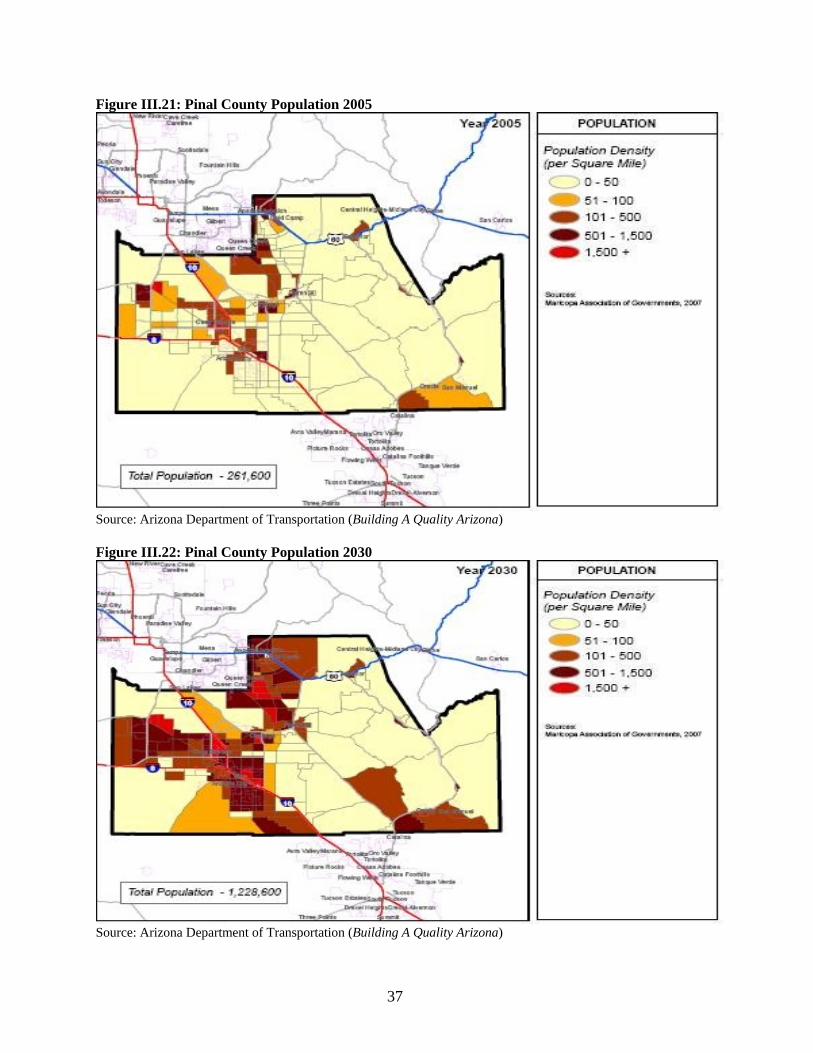
37
Figure III.21: Pinal County Population 2005
Source: Arizona Department of Transportation (Building A Quality Arizona) Figure III.22: Pinal County Population 2030
Source: Arizona Department of Transportation (Building A Quality Arizona)

38
Figure III.23: Maricopa County Employment 2030
Source: Arizona Department of Transportation (Building A Quality Arizona) Figure III.24: Gila County Employment 2030
Source: Arizona Department of Transportation (Building A Quality Arizona)

39
Figure III.25: Pinal County Employment 2030
Source: Arizona Department of Transportation (Building A Quality Arizona) As part of MAG's analysis to demonstrate maintenance of the 1997 8-hour ozone standard in the November 2008, Draft Eight-Hour Ozone Redesignation Request and Maintenance Plan for the Maricopa Nonattainment Area, emissions were projected through 2025. Figures III.26 and III.27 below, illustrate analysis results for anthropogenic emissions of the two ozone precursors, VOC and NOx, and provide an example of the distribution of emissions in the greater Phoenix metropolitan area for the selected 2025 analysis period. As in the 2005 example (see Figures III.8 and III.9), the greatest level of VOC emissions closely follows the developed urban core. The distribution of NOx emissions display a similar pattern with highest values concentrated in the Phoenix urban area and along transportation routes. Although population and other economic activity is expected to increase, in the example provided, 2025 NOx emissions have decreased compared to the 2005 analysis period.

40
Figure III.26: Anthropogenic VOC Emissions
Source: Maricopa Association of Governments, November 2008, Draft Technical Support Document for Ozone Modeling in support of the Eight-Hour Ozone Redesignation Request and Maintenance Plan for the Maricopa Nonattainment Area, "Anthropogenic VOC Emissions for a Tuesday in July, 2025."

41
Figure III.27: Anthropogenic NOx Emissions
III.B.6 Meteorology (weather/air movement patterns) Meteorological patterns play a critical role in the formation and distribution of ozone. Both synoptic flows and topographically-driven surface winds influence the distribution of ozone and ozone precursor emissions. Ultimately, since there is little variation in day-to-day emissions, the daily meteorological variation determines which days and which areas will experience elevated ozone. Ozone in Phoenix is largely driven by three meteorological patterns; (1) valley flows, (2) synoptic flows, and (3) monsoon driven flows. The choice of design dates was determined by meteorological conditions that were conducive to elevated ozone concentrations. July 1 and July 17, 2006, were chosen, in-part, due to meteorological conditions that resulted in high ozone concentrations in central and northeast parts of the network. July 7 and July 8, 2008, were chosen for meteorology that resulted in high ozone concentrations in the central and northern parts of the network. This analysis discusses the Phoenix ozone biogeochemical, photochemical and in particular, meteorological driving forces in the Phoenix area, which contribute to both the concentration and distribution of ground level ozone. Phoenix Ozone Chemical byproducts of industrial processes, including gas stations, chemical manufacturers, power generators, dry cleaners, painting processes in addition to transportation and natural sources are emitted to
Source: Maricopa Association of Governments, November 2008, Draft Technical Support Document for Ozone Modeling in support of the Eight-Hour Ozone Redesignation Request and Maintenance Plan for the Maricopa Nonattainment Area, "Anthropogenic NOx Emissions for a Tuesday in July, 2025."

42
the Phoenix urban atmospheric boundary layer every day. NOX (NOx=NO+NO2) and VOCs (and to a lesser degree CO) are included in these byproducts and are compounds which play an important role in the production of photochemical smog and ozone. Almost all NOX emissions are products of transportation (on-road and non-road sectors) and stationary-source fuel combustion while VOC emissions are generally dominated by industrial processing, solvent utilization and on-road and non-road vehicles (see 2005 Periodic Emission Inventory for Ozone Precursors for the Maricopa County, Arizona, Nonattainment Area, September 2008, Maricopa County Air Quality Department and Eight-Hour Ozone Plan for the Maricopa Nonattainment Area, June 2007, Maricopa Association of Governments). Daily and weekly profiles for traffic and industrial processes imply that ozone precursor emissions begin their journey to the atmosphere in the early daylight hours, continue through the afternoon and begin to reduce after sundown. The period for peak 8-hour ozone concentrations generally begin around noon, with elevated 1-hour ozone concentrations measured well into the late afternoon, when ambient temperature and sunlight intensity are at their peak. Absent the photochemical process, ozone precursors can accumulate over time and when conditions are right, rapid ozone production can occur. Wind patterns in Phoenix suggest that ozone and ozone precursors can be transported in the morning from the far west and southern portions of the valley and impact monitors in the Phoenix valley. The NOX and VOC rich air mass can become photochemically aged during the transport process and begin to produce ozone. When the air parcel finally drifts into the Phoenix metropolitan area, the NOX and VOC rich air can mix with the NOX and VOC rich Phoenix air, and depending on the conditions (Sunlight, heat, VOC/NOX mixing ratios) ozone concentrations can begin to climb. The complex chemical and kinetic processes that influence the distribution and production of ground level ozone make this air pollutant particularly hard to predict. Although models like CMAQ (Community Multi-Scale Air Quality Model) and Environ’s CAMx® model are effective tools to help scientists better understand the formation and distribution of ozone, more work needs to be done before the states and other regulatory agencies, charged with the responsibility of regulating ozone, are able to efficiently predict and control ozone and its precursors. Ozone Formation Mechanism The chemical mechanism which drives ozone production is fairly well understood and little effort will be dedicated to this discussion. The illustration (Figure III.28) below was taken from “Chemistry of the Environment”, second edition, by Spiro and Stigliani, 2003, and illustrates how ozone is produced within the planetary boundary layer, from the oxidation of VOCs (and CO, not illustrated here) by hydroxyl radicals (·OH) in the presence of NOX.

43
Figure III.28: Mobile source emissions are used in this example to illustrate how
smog is formed (O3 is an ingredient of smog). The aldehydes, acids and peroxyacetyl nitrate (PAN) are common smog constituents and eye irritants.
The VOCs (RH in the illustration) are oxidized by ·OH (hydroxyl radicals) and combine with O2 to produce peroxyl radicals which create more NOx (NO and NO2 in the illustration) and a handful of eye irritant, toxic compounds found in smog. The NO2 is photolyzed to form O3. It is worth mentioning that VOC/NOx mixing ratios play an important role in instantaneous O3 production rates and O3 concentrations can increase or decrease based in-part on that ratio and other factors, including ambient air temperature. Temperature and Ozone Studies suggest a nonlinear relationship between temperature and ozone concentrations at ground level: below temperatures of 70-80°F (22-26°C), there is no relationship between ozone concentrations and temperature; above 90°F (32°C), there is a strong positive relationship (Watson, et al., 2000 “The Regional Impacts of Climate Change”). In particular, in areas like Phoenix, where summertime temperatures can reach well above 100ºF a positive correlation can be observed. In fact, a study in Los Angeles suggests that for every 1ºF increase in temperature above 70ºF, the incidence of smog increases by 3% (DOE 1996). The high temperatures for July 1 and 17, 2006, were 110°F and 106°F, respectively, and the average high temperature for the month of July in 2006 was 106.6°F. For 2008 the data is similar, with July 7 and July 8 measuring a maximum temperature of 107°F and 109°F respectively. The average high temperature for the month of July 2008 was 105.7°F. In 2006, there were 49 exceedances. The lowest maximum daily temperature was 88° F (April 29, and May 28). In 2007, there were 20 exceedances. The lowest maximum daily temperature was 90° F (June 7). In 2008, there were 28 exceedances. The lowest

44
maximum daily temperature was 84° F (April 21). There were no exceedances below 88° F, 90° F and 84° F in 2006, 2007 and 2008, respectively. The data suggests that elevated temperatures may have contributed to the elevated ozone concentrations on those days. A recent study, Polimetrics: the quantitative study of urban systems (and its applications to atmospheric and hydro environments) (Fernando, H. Environmental Fluid Mechanics), suggests that the temperature in Phoenix has continued to rise in recent years and has increased by as much as 11° C, in some areas. The paper analyzes the Phoenix urban area and shows that urban surfaces, air conditioners and burning all contribute to raising the ambient temperature in Phoenix (see also Figure III.29).
Efforts to lower the temperature of Phoenix may have a benefit in reducing smog and ozone. Planting trees and utilizing energy deflecting surfaces for rooftops and roadways may help lower the temperature by lessening the heat island effect and thus reduce our exposure to ozone. Geography of the Phoenix Ozone Nonattainment Area The Phoenix metropolitan area lies in a valley bordered by the Superstition Mountains to the east, the New River Mountains to the north and northeast, the Hieroglyphic Mountains to the northwest near Lake Pleasant, the White Tank Mountains in the west, the Estrella Mountains to the southwest, and the South Mountains to the south. The Salt River runs through the southern part of the metropolitan area and exits to the southwest with the Gila and Agua Fria Rivers joining it near Goodyear, and the Hassayampa River joining west of Palo Verde. Phoenix Metropolitan Area Mountain-Valley Flow The mountain-valley flow defines the daily surface wind patterns in the Phoenix area in the absence of synoptic weather systems with associated cold fronts. As a result, Phoenix has a typical diurnal wind pattern that exists nearly year-round due to its geographical position within the valley. When the sun rises over the Superstitions in the east, the east-facing mountains in the west valley such as the White Tank Mountains begin to heat up. As the morning progresses, an energy imbalance is created where the warmer air over the White Tank Mountains rises while the cooler air over the east mountains such as the Superstition mountains sinks. This causes the surface winds across the valley to move from east to west, replacing the rising air heated by the sun’s rays over the western mountains. As sun moves overhead, equal heating takes place and there is little horizontal movement of air. This is realized by
Figure III.29: U.S. EPA, 2008. This figure shows a temperature profile, where late afternoon (max temp.) measurements of temperature are compared to land use. Rural and rural farmland measure the lowest temperature, while downtown areas are among the highest.
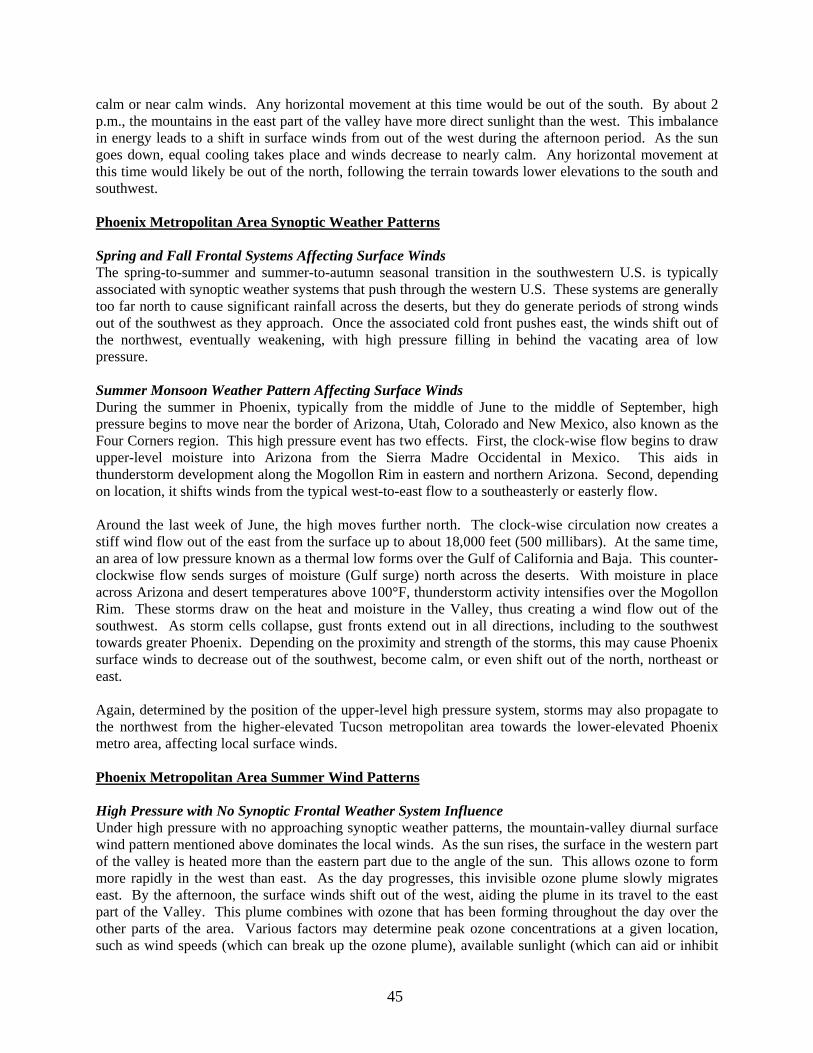
45
calm or near calm winds. Any horizontal movement at this time would be out of the south. By about 2 p.m., the mountains in the east part of the valley have more direct sunlight than the west. This imbalance in energy leads to a shift in surface winds from out of the west during the afternoon period. As the sun goes down, equal cooling takes place and winds decrease to nearly calm. Any horizontal movement at this time would likely be out of the north, following the terrain towards lower elevations to the south and southwest. Phoenix Metropolitan Area Synoptic Weather Patterns Spring and Fall Frontal Systems Affecting Surface Winds The spring-to-summer and summer-to-autumn seasonal transition in the southwestern U.S. is typically associated with synoptic weather systems that push through the western U.S. These systems are generally too far north to cause significant rainfall across the deserts, but they do generate periods of strong winds out of the southwest as they approach. Once the associated cold front pushes east, the winds shift out of the northwest, eventually weakening, with high pressure filling in behind the vacating area of low pressure. Summer Monsoon Weather Pattern Affecting Surface Winds During the summer in Phoenix, typically from the middle of June to the middle of September, high pressure begins to move near the border of Arizona, Utah, Colorado and New Mexico, also known as the Four Corners region. This high pressure event has two effects. First, the clock-wise flow begins to draw upper-level moisture into Arizona from the Sierra Madre Occidental in Mexico. This aids in thunderstorm development along the Mogollon Rim in eastern and northern Arizona. Second, depending on location, it shifts winds from the typical west-to-east flow to a southeasterly or easterly flow. Around the last week of June, the high moves further north. The clock-wise circulation now creates a stiff wind flow out of the east from the surface up to about 18,000 feet (500 millibars). At the same time, an area of low pressure known as a thermal low forms over the Gulf of California and Baja. This counter-clockwise flow sends surges of moisture (Gulf surge) north across the deserts. With moisture in place across Arizona and desert temperatures above 100°F, thunderstorm activity intensifies over the Mogollon Rim. These storms draw on the heat and moisture in the Valley, thus creating a wind flow out of the southwest. As storm cells collapse, gust fronts extend out in all directions, including to the southwest towards greater Phoenix. Depending on the proximity and strength of the storms, this may cause Phoenix surface winds to decrease out of the southwest, become calm, or even shift out of the north, northeast or east. Again, determined by the position of the upper-level high pressure system, storms may also propagate to the northwest from the higher-elevated Tucson metropolitan area towards the lower-elevated Phoenix metro area, affecting local surface winds. Phoenix Metropolitan Area Summer Wind Patterns High Pressure with No Synoptic Frontal Weather System Influence Under high pressure with no approaching synoptic weather patterns, the mountain-valley diurnal surface wind pattern mentioned above dominates the local winds. As the sun rises, the surface in the western part of the valley is heated more than the eastern part due to the angle of the sun. This allows ozone to form more rapidly in the west than east. As the day progresses, this invisible ozone plume slowly migrates east. By the afternoon, the surface winds shift out of the west, aiding the plume in its travel to the east part of the Valley. This plume combines with ozone that has been forming throughout the day over the other parts of the area. Various factors may determine peak ozone concentrations at a given location, such as wind speeds (which can break up the ozone plume), available sunlight (which can aid or inhibit

46
ozone formation), remnant ozone precursors from the day before and similar factors. Under this type of scenario, we would typically expect far-east valley locations, such as Blue Point, Rio Verde, Apache Junction and Queen Valley, to record the highest 8-hour concentrations. Ozone Formation under the Influence of Monsoonal Wind Flow On a typical Monsoon day in the Phoenix ozone nonattainment area, ozone begins to form in the west part of the Valley. Depending on the position of the Four Corners high pressure system, surface and upper-level winds may be out of the northeast, east, or southeast the entire day. This slows the eastward migration of the ozone plume, holding it near the central part of the Valley. As thunderstorms develop along the Mogollon Rim and draw on the Valley’s surface heat energy and moisture, the air and ozone within it is pulled towards the north and northeast. This would cause highest ozone concentrations to be in the north, northeast, or east part of the nonattainment area. Such cases include five sites exceeding the standard on Monday, July 17, 2006 (highest at Fountain Hills with .089 ppm). If the storms remain too far away to influence the winds in the valley, the highest ozone concentrations would likely be over the central part of the nonattainment area (West Phoenix, Phoenix Supersite, Central Phoenix, North Phoenix, Cave Creek). Such cases include seven sites exceeding the standard on Saturday, July 1, 2006 (highest at North Phoenix with .094 ppm), seven sites exceeding on Monday, July 7, 2008 (West Phoenix with .081 ppm), and five sites exceeding on Tuesday, July 8, 2008 (West Phoenix with .081 ppm). There is typically a spike in concentrations to near or exceeding the standard on the first day easterly winds are realized across the area. Close Look at Four High Ozone Days within the Ozone Nonattainment Area Saturday, July 1, 2006 High pressure at 500 millibars (mb), or approximately 18,000 ft, was centered over southwestern Colorado on this day, providing Arizona with a flow out of the west at this height. Wind speeds however, were only 10 to 15 knots, not strong enough to override the surface diurnal wind pattern. At the surface, the thermal low pressure system was well established, anchored over Baja and southwestern California. This annual feature produces a flow from the south across the deserts. The thermal low is responsible for moisture surges (called Gulf surges) that spread northeast from the Gulf of California through Yuma and into the Phoenix area. It can also aid in the movement of locally-generated ozone from the southwest towards the northeast. The HYSPLIT model (see Figure III.30) for this day supports this movement. Seventeen locations had concentrations of 0.076 ppm or greater. From highest to lowest, they were:
Table III.13: Exceedances July 1, 2006 Site Name ppm Site Name ppm Site Name ppm North Phoenix 0.094 West Phoenix 0.085 Queen Valley 0.080Apache Junction 0.090 Glendale 0.084 South Scottsdale 0.080Central Phoenix 0.089 Humboldt Mountain 0.084 Dysart 0.079Tempe 0.087 Rio Verde 0.084 Fountain Hills 0.079West Chandler 0.087 Cave Creek 0.083 Pinnacle Peak 0.079Phoenix Supersite 0.085 Falcon Field 0.082
From this list, the majority of the high concentrations were located in the central metropolitan Phoenix area rather than the mountainous locations of the far-east Valley.

47
The peak 1-hr concentration at North Phoenix occurred at 2 p.m. Apache Junction reached its peak at 4 p.m. Fountain Hills (which is west of Apache Junction) peaked at 5 p.m. The reason for this late afternoon shift in the ozone plume can be attributed to outflow thunderstorms to the southeast. The strongest hourly winds at Sky Harbor were 23 mph from the southeast at about 4 p.m. These outflow winds likely assisted in keeping ozone from continuing to migrate towards the northeast. Thus, Tonto National Monument did not exceed the standard on this day.
Figure III.30: This map illustrates the movement of an air parcel beginning at 7 p.m., June 30, 2006, Pacific Daylight Time in the Sea of Cortez and ending at 7 p.m., July 1, 2006, Mountain Standard Time in Phoenix, Arizona.
Monday, July 17, 2006 On this day, high pressure at 500 mb was located over the panhandle of Texas. This still gave Arizona an upper-level flow out the southeast, but did not translate down to the surface. Again, the thermal low was situated over much of southern California. The counter-clockwise flow was generating surface winds from the southwest across the deserts, as supported by the HYSPLIT model for this day (see Figure III.31). Thunderstorm activity along the Mogollon Rim was spotty and likely did not play a role in ozone movement across the Phoenix forecast area.

48
Twelve monitor locations exceeded the 0.075 ppm federal ozone NAAQS. From highest to lowest, they were:
Highest concentrations on this day were generally located in the east and northeast part of the Phoenix forecast area. This was due to the southwest flow generated by the thermal low, combined with the typical diurnal valley flow and lack of thunderstorm outflow from the east.
Figure III.31: This map illustrates the movement of an air parcel beginning at 8 p.m., July 16, 2006, Pacific Daylight Time near the Sea of Cortez and ending at 8 p.m., July 17, 2006, Mountain Standard Time in Phoenix, Arizona.
Table III.14: Exceedances July 17, 2006 Site Name ppm Site Name ppm Fountain Hills 0.089 Tempe 0.081 Apache Junction 0.087 Tonto 0.081 South Scottsdale 0.086 Central Phoenix 0.081 North Phoenix 0.085 Pinnacle Peak 0.077 Falcon Field 0.085 West Chandler 0.077 Rio Verde 0.081 West Phoenix 0.077

49
Monday and Tuesday, July 7-8, 2008 Arizona was situated between two areas of high pressure at 500 mb. The high pressure to the west was more dominant on Tuesday, producing upper-level winds out of the north around 10 to 15 knots. By Tuesday, those winds turned out of the northeast. At the surface, the Baja thermal low remained firmly in place. The surface flow, however, was now out of the southeast as supported by the HYSPLIT back-trajectory model (see Figure III.32). Evident by peak hourly winds out of the east of 24 and 25 knots on these two days, there was thunderstorm outflow. No rain was recorded at Phoenix Sky Harbor Airport. Seven exceedances of the current 8-hour ozone standard were recorded on July 7, 2008. From highest to lowest, they were:
Table III.15: Exceedances July 7, 2008 Site Name ppm Site Name ppm West Phoenix 0.081 North Phoenix 0.077 Phoenix Supersite 0.079 South Phoenix 0.077 Central Phoenix 0.078 Tempe 0.076 Glendale 0.077
Five exceedances were recorded on July 8, 2008. From highest to lowest, they were:
Table III.16: Exceedances July 8, 2008 Site Name ppm Site Name ppm West Phoenix 0.081 Phoenix Supersite 0.078 North Phoenix 0.080 Cave Creek 0.077 Glendale 0.079
On both days, the highest ozone levels were concentrated in the central and northern part of the Valley. Thunderstorm outflow winds combined with upper-level wind flow out of the north and northeast, along with surface winds out of the southeast likely kept the locally-generated ozone plume from migrating to the far-east part of the valley. Thus, Tonto National Monument did not exceed the health standard on either of these days and actually recorded some of the lowest ozone levels on the 7th and 8th (0.062 ppm and 0.064 ppm, respectively).

50
Figure III.32: This map illustrates the movement of an air parcel beginning at 8 p.m., July 7, 2008, Pacific Daylight Time near the U.S., Mexico border and ending at 8 p.m., July 8, 2008, Mountain Standard Time in Phoenix, Arizona.
Impact from Sources Outside the Ozone Nonattainment Area In the previous discussion, Phoenix area meteorology was examined and showed that ozone can be transported long distances, where it can eventually cause or contribute to an ozone violation. Since the publication of the existing ozone boundary, additional NOX and VOC sources have been put into operation. The Gila River Power Plant and Harquahala Generating Station are two power plants which are located outside the existing 8-hour nonattainment area boundary. In addition, the Queen Valley monitor, located in Pinal County, is an ozone monitor also located outside the existing nonattainment area boundary and has measured a number of exceedances over the past three years. Reverse trajectory analysis were examined for two days, July 1, 2006, and June 12, 2008, to help investigate any impacts associated with the two additional sources and to better understand how ozone may be affecting the Queen Valley monitor. The trajectory analysis for each of the two days revealed: (1) an air parcel moving from west Phoenix to downtown Phoenix on July 1, 2006, and (2) an air parcel passing across the Phoenix metropolitan area to the Queen Valley ozone monitor on June 12, 2008. Figure III.33 illustrates the movement of air through west Phoenix, where a handful of power plants are

51
located and into the Phoenix metropolitan area. Figure III.34 illustrates impacts on the Queen Valley monitor, originating from the Phoenix metropolitan area.
Figure III.33: Illustrates the trajectory of two air parcels. The red line is an air parcel moving from west to east at 500 meters above ground level, starting at 11 a.m. on July 1, 2006, and ending at 7 p.m. the same day. The blue line is an air parcel moving from west to east at 2 meters above ground level, starting at 9 a.m. and ending at 7 p.m.
The trajectories suggest that the ozone precursors, NOX and VOCs, can be transported from the power plants in the west valley and impact monitors in Central Phoenix. The Harquahala Generating Station and the Gila River Power Station are currently located outside the existing nonattainment area boundary and it is proposed that the new nonattainment area boundary be extended to include these two power plant facilities. The Queen Valley monitor is located just outside the south-eastern portion of the existing nonattainment area boundary, in Pinal County, Arizona. This monitor has measured high ozone concentrations over the last three years and violates the new ozone standard. Back trajectory analyses indicate that pollution affecting this monitor can originate from or pass over the Phoenix metropolitan area. Figure III.34 illustrates a back trajectory analysis on June 12, 2008, where an air parcel moved across Phoenix and impacted the Queen Valley monitor.

52
Figure III.34: The Queen Valley monitor back trajectory analysis shows two different air parcels moving over the Phoenix metropolitan area towards the Queen Valley monitor. The red trajectory is at 500 meters above ground level, starts at 3 a.m. and moves from west to east, ending at 7 p.m. at the Queen Valley monitor. The blue trajectory is at 2 meters above ground level, starts at 3 a.m. and moves from west to east, ending at 7 p.m. at the Queen Valley monitor.
Tonto Monitor Exclusion The Tonto ozone monitor is located in Gila County, just west of Roosevelt Lake, east of metropolitan Phoenix and approximately 90 km from downtown Phoenix. The specific location is 33.365 Latitude and -111.109 Longitude at 2500 feet in elevation. The majority of existing ozone monitors are all located in the Valley (including the Queen Valley monitor, which is proposed to be included in the new nonattainment area) and are subject to ozone pollution generated, in large part, by local sources from the Phoenix valley and outlying areas to the west and south. In contrast, the Tonto monitor is situated in Gila County at 2,500 feet, well above and to the east of the Phoenix metropolitan area. Emissions inventory data demonstrates that there are no sources in Gila County, near the Tonto monitor, and given the proximity to downtown Phoenix, one would conclude that the ozone violations measured at the Tonto monitor are a result of transport during synoptic frontal weather systems and accumulation during sloshing and not by sources near the monitor. Figure III.35 illustrates a HYSPLIT back trajectory for April 24, 2008, showing the trajectory of an air parcel, moving from west to east across the Valley and impacting the Tonto monitor. Ozone sloshing and formation under a synoptic frontal weather system are discussed below.

53
Figure III.35: The Tonto Monitor back trajectory analysis shows impacts originating from west Phoenix. Start time is 10 a.m. and end time is 10 p.m.
Sloshing Effect of Ozone A number of studies have been conducted to look at the migration of locally-generated ozone in the Phoenix forecast area. Because Phoenix lies within a valley, a typical mountain-valley diurnal wind pattern takes place. Absent any overriding weather pattern, winds typically start out from the east in the morning (see Figure III.36), become near calm around noon, and shift out of the southwest and west during the afternoon (see Figure III.37). On days where there is additional help from the thermal low situated over Baja, the afternoon southwest flow may have enough momentum to push the ozone plume up and over the mountains to the east. When there is little influence from the thermal low, these afternoon westerly (out of the west) winds may not have the momentum to get over the mountains, and thus fall back down to the west. This is often evident by a secondary spike at several locations late at night. For example, ozone levels at Fountain Hills may increase steadily throughout the day, peaking around 4 p.m. in the afternoon. After this, concentrations begin to decrease through the night. Around 10 p.m., there is a brief spike in ozone before resuming its decline. At 11 p.m., Tempe, located west of Fountain Hills, may experience a similar spike before resuming its downward trend. This is the idea behind the slosh effect discussed in a paper entitled A Case Study of the Climatic Mechanisms Contributing to the Transport of Lower Atmospheric Ozone Across Metropolitan Phoenix, Arizona, USA (Ellis, Hilenbrandt, Thomas, Fernando 1999). On days that there is enough momentum to get over the mountains, this late night secondary spike is very minimal if it occurs at all.

54
Figure III.36: This illustration shows topography and flow patterns in the urban Phoenix area. The high mountain slopes to the west of Phoenix are heated in the morning and surface air is drawn towards the west.
Figure III.37: This illustration shows topography and flow patterns in the urban Phoenix area. The high mountain slopes to the east of Phoenix are heated in the late afternoon and surface air is drawn towards the east.

55
Ozone Formation under the Influence of a Synoptic Frontal Weather System During the spring-to-summer and summer-to-fall transition periods, high pressure tends to give way to synoptic weather systems from the Pacific Ocean. Sometimes these systems can dip far enough south that the associated cold from pushes through the deserts of California and Arizona. This creates a surface flow out of the southwest. Under such a scenario, ozone concentrations tend to approach or exceed the health standard in the Phoenix ozone nonattainment area up to a day before the front pushes through. Further investigations show high concentrations a day earlier Yuma, Arizona, and across southern California two to three days before the elevated levels are recorded in Phoenix. Some studies attribute this to “transport” of ozone and/or precursor such as NOx and VOCs across the southwest deserts of the U.S. and Mexico. Others suggest that the ozone is locally generated as usual, but enhanced by up-wind precursors due to vegetation of agricultural land. Locations in the northeast part of the Valley, such as Tonto, tend to have the highest concentrations in the network under this transport scenario. III.B.7 Geography/Topography (mountain ranges or other air basin boundaries) Although in the broad and mostly flat Salt River Valley, metropolitan Phoenix lies close to mountainous, complex terrain. The valley is bordered by several mountain chains including: the Mazatzal and Superstition Mountains to the east, the New River Mountains to the north and northeast, the Hieroglyphic Mountains to the northwest near Lake Pleasant, the White Tank Mountains in the west, the Estrella Mountains to the southwest, and the South Mountains to the south. Elevations range from about 1000 feet above sea level near downtown Phoenix to nearly 8000 feet along the Maricopa County border with Gila County and Yavapai County. This higher terrain, located to the north and east, forms a natural boundary between the Salt River Valley and complex terrain beyond the County border. Figure III.38 illustrates the topographical features of Maricopa, Pinal, and Gila Counties. In the absence of major storm fronts, topography dictates the strength and direction of surface winds and drives the diurnal wind shift and flow. Eastern Maricopa County typically receives the Phoenix urban plume because of the prevailing late daytime and early evening valley-to-mountain surface winds out of the southwest. The impact of topography on local and area scale meteorology and transport of pollutants is discussed in Section III.B.6.

56
Figure III.38: Phoenix Area Topography
57
III.B.8 Jurisdictional Boundaries [e.g., counties, air districts, existing nonattainment areas, Reservations, metropolitan planning organizations (MPOs)]
EPA's guidance advises analysis of jurisdictional boundaries including consideration of counties, air districts, existing nonattainment areas, and metropolitan planning organizations as criteria for determining an appropriate nonattainment area boundary. In its analysis, ADEQ included consideration of these factors as well as existing control measure applicability areas where pollution control programs are applied to address nonattainment with National Ambient Air Quality Standards in the greater Phoenix area. The applicability of Phoenix area emissions control programs for defining the boundaries of the Greater Phoenix nonattainment area is addressed detail in Section III.B.9, below. Four major issues were taken into consideration relating to jurisdictional boundaries:
• Indian reservations; • County boundaries; • Existing air pollution control programs; and • Existing institutions and conventions for air quality and transportation planning.
As the State has no jurisdiction within the interior boundaries of Indian reservations, the recommended nonattainment area excludes all of Indian Country. The three Indian reservations that are located within or adjacent to the proposed nonattainment area are the Salt River Pima-Maricopa Indian Community and the Fort McDowell Yavapai Nation, which are adjacent to each other and located in the eastern portions of the proposed nonattainment area; and the Gila River Indian Community, which lies along most of the southern boundary of the proposed nonattainment area. Eastern Maricopa County and portions of Pinal County that are contiguous to the Phoenix urban core are included in the recommended nonattainment area. The Maricopa County line was selected for the recommended outer boundary of the proposed nonattainment area on the east and northern sides. One issue that complicates this choice is that the ambient air quality monitoring record documents exceedances and violations of the 8-hour average ozone NAAQS at the Tonto National Monument in Gila County. This monitor, however, is only 2 miles from the existing nonattainment area boundary, which is the Maricopa County line. Although exceedances and violations have occurred along the eastern Maricopa County boundary, due to the complex terrain, it is not possible at this time to determine with any confidence how far beyond the Maricopa County line to draw a nonattainment area boundary. Gila County should be excluded from the nonattainment area because:
• The Maricopa County/Gila County line also forms the eastern boundary of the existing 8-hour ozone nonattainment area where ozone pollution control programs are already required;
• Western Gila County consists primarily of public lands, has very limited potential for growth, and
is not expected to contain significant, new anthropogenic sources of ozone precursors into the distant future, and inclusion of the area would not provide substantial benefit for bringing the greater Phoenix area into attainment;
• Three Federal agencies have jurisdiction over portions of eastern Maricopa County and western
Gila County. The National Park Service has jurisdiction over Tonto National Monument, directly

58
north of the Superstition Wilderness Area. The U.S. Bureau of Land Management, an agency within the U.S. Department of Interior, has jurisdiction over the Superstition Wilderness Area. The Forest Service (U.S. Department of Agriculture) has jurisdiction over the Tonto National Forest, an area that encompasses the northern tip of Maricopa County, extending into Gila County. Gila County includes Sierra Ancha Wilderness Area, an area also under USDA Forest Service jurisdiction. The Mazatzal Wilderness Area, in the northern portion of the Tonto National Forest, is also under the jurisdiction of the USDA Forest Service.
State and Federal regulatory programs operate in and around these areas to reduce the impact of visibility impairing pollutants. Visibility impairing pollutants include some of the precursors to the formation of ozone. The Sierra Ancha and Mazatzal Wilderness areas are part of the Regional Haze program for mandatory Federal Class I areas in the U.S. The State of Arizona’s Enhanced Smoke Management Plan along with fire programs at the Federal level specifically address the reduction of emissions from fire at not only the wilderness areas, but Superstition Wilderness Area and Tonto National Monument.
• Gila County is not a member of the Maricopa Association of Governments (MAG). Arizona
statutes ARS § 49-406(A), 23 USCA §134, and Governor Bolin's 1978 certification designate MAG as the planning agency for air quality and transportation planning in the Phoenix metropolitan and Maricopa County areas. A nonattainment area that includes Gila County would greatly complicate air quality and transportation planning, and would require development of new institutional arrangements for accomplishing these required tasks.
III.B.9 Level of Control of Emission Sources In its analysis ADEQ considered existing control measure applicability areas. In general, emissions control programs are currently implemented in areas of greatest emissions. For example, the existing 8-hour ozone nonattainment area requires numerous pollution control measures to address ozone precursors in the Phoenix area. The Vehicle Emissions Inspection and Maintenance program is implemented to address NAAQS nonattainment and maintenance in the greater Phoenix and Tucson areas, Areas A and B, respectively (see ARS §49-541). Arizona's Cleaner Burning Gasoline program is required in Maricopa County, Area A, and Area C (see ARS §49-541). Other federally enforceable control measures were included in the 1-Hour Ozone Nonattainment Area State Implementation Plan (SIP) submitted to EPA in December 2000 and 8-Hour Ozone Nonattainment Area SIP submitted to EPA in June 2007. Federally enforceable measures that have ozone-reducing co-benefits were also included in the 2000 Maricopa County Carbon Monoxide (CO) SIP, the 2002 Maricopa County CO Maintenance Plan, and the 2001 Maricopa County PM10 SIP. Most of the existing control measures shown in Table III.17 below are required by law to be implemented throughout Area A, which includes a portion of Pinal County and is larger in size than the current 8-hour ozone nonattainment area. Some of the programs listed are voluntary but have an impact on reducing ozone concentrations. As the new 8-hour ozone plan is developed, the status and scope of implementation for each control measure will be reviewed. This list also includes several existing federally-implemented control measures, focused on vehicle engine and fuel standards. One new mass transit route, a 20 mile Light Rail route from Tempe to Bethany Home Road and 19th Avenue in Phoenix, opened the last weekend in December 2008. Ridership exceeds 30,000 per day according to its operator Valley Metro in February 2009.

59
Table III.17: Existing Control Measures
MEASURE Area of Application
Vehicle Emissions Inspection program components, including: --Phased In Emission Test Cutpoints --Enhanced Emission Testing of Constant Four Wheel Drive Vehicles --Increased Waiver Repair Limit Options --Catalytic Converter Replacement Program --Voluntary Vehicle Repair and Retrofit Program --Tougher Enforcement of Vehicle Registration and Emissions Test Compliance --Snap Acceleration Test for Heavy Duty Diesel --One-Time Waiver from Vehicle Emissions Test --Gross Polluter Option for I/M Program Waivers --Liquid Fuel Leak Test
Area A
Arizona Cleaner Burning Gasoline (Summer Fuel Reformulation: California Phase 2 and Federal Phase II Reformulated Gasoline with 7 psi from May 1 through September 30)
Maricopa County, non-Maricopa County portion of Area A, Area C
Expansion of Area A Boundaries (HB 2538) Area A Ban Open Burning During Ozone Season Area A Require Pre-1988 Heavy-Duty Diesel Commercial Vehicles (>26,GVWR) Operating in Area A To Meet 1988 Federal Emissions Standards By 2004
Area A
Area A Non-resident Commuter Emissions Testing Area A Limit Sulfur Content of non-road Diesel Fuel to 500 ppm Area A Stage II Vapor Recovery Program Area A Alternative Fuel Vehicles for Local Governments, School Districts and Federal Government/Low Emission Vehicle Requirements
Area A
Coordinate Traffic Signal Systems Area A Trip Reduction Program for Employers with 50 or more Employees at a Work Site
Area A
Voluntary Lawn and Garden Equipment Replacement Program Area A Oxidation Catalyst for Heavy Duty Diesel Vehicles One Hour Ozone NA Mass Transit Alternatives One Hour Ozone NA Develop Intelligent Transportation Systems One Hour Ozone NA Special Event Controls - Required Implementation from List of Approved Strategies
One Hour Ozone NA
Encourage the Use of Temporary Electrical Power Lines Rather than Portable Generators at Construction Sites
One Hour Ozone NA
Defer Emissions Associated With Governmental Activities One-Hour Ozone NA Encourage Limitations on Vehicle Idling One-Hour Ozone NA Voluntary No-Drive Days One-Hour Ozone NA Expansion of Public Transportation Programs One-Hour Ozone NA Employer Rideshare Program Incentives One-Hour Ozone NA Preferential Parking for Carpools and Vanpools One-Hour Ozone NA Reduce Traffic Congestion at Major Intersections One-Hour Ozone NA Site-Specific Transportation Control Measures One-Hour Ozone NA Encouragement of Bicycle Travel One-Hour Ozone NA Development of Bicycle Travel Facilities One-Hour Ozone NA Alternative Work Schedules One-Hour Ozone NA Land Use/Development Alternatives One-Hour Ozone NA Encouragement of Pedestrian Travel One-Hour Ozone NA Restrictions on the Use of Gasoline-Powered Blowers for Landscaping One-Hour Ozone NA

60
Table III.17: Existing Control Measures
MEASURE Area of Application
Maintenance Alternative Fuels for Fleets One-Hour Ozone NA Area-wide Public Awareness Programs (Clean Air Campaign) One-Hour Ozone NA Encouragement of Vanpooling One-Hour Ozone NA Park and Ride Lots One-Hour Ozone NA Encouragement of Telecommuting, Teleworking, and Teleconferencing One-Hour Ozone NA Promotion of High Occupancy Vehicle Lanes and By-Pass Ramps One-Hour Ozone NA Improved Rule Effectiveness, Area Sources One-Hour Ozone NA State Procurement Code-Request for Low or No Volatile Organic Compound Products
One-Hour Ozone NA
Vehicle Idling Restriction Ordinances for Engines that Propel Heavy Duty Diesel Vehicles equal to or greater than to 14,000 lbs GVWR
Maricopa County and Area A Portion of Pinal County
New Source Performance Standards Maricopa County Rule 360 ADEQ Arizona Administrative Code, Title 18, Chapter, 2, Article 9
Maricopa County
Maricopa County Rules: Permit Requirements for New Major Sources and Major Modifications to Existing Major Sources Rule 240 Permits for New Sources and Modifications to Existing Sources Rule 241 Municipal Solid Waste Landfills Rule 321 General VOC Rule 330 Solvent Cleaning Operations Rule 331 Petroleum Solvent Dry Cleaning Rule 333 Rubber Sport Ball Manufacturing Rule 334 Architectural Coatings Rule 335 Aerospace Surface Coating Rule 336 Graphic Arts Rule 337 Semiconductor Manufacturing Rule 338 Vegetable Extraction Processes Rule 339 Cutback and Emulsified Asphalt Rule 340 Metal Investment Casting Rule 341 Wood Coating Rules 342 and 346 Commercial Bread Bakeries Rule 343 Windshield Washer Fluid Rule 344 Vehicle and Mobile Equipment Coating (aka Automobile Refinish Coatings) Rule 345 Ferrous Sand Casting Rule 347 Aerospace Manufacturing and Rework Operations Rule 348 Pharmaceutical, Cosmetic, and Vitamin Manufacturing Operations Rule 349 Storage of Organic Liquids at Bulk Plants and Terminals Rule 350 Loading of Organic Liquids Rule 351 Gasoline Delivery Vessel Testing and Use Rule 352 Gasoline in Stationary Dispensing Tanks Rule 353 Federal Hazardous Air Pollutant Program Rule 370
Maricopa County
ADEQ Rules: New Source Review Rules R18-2-401 thru 407 Existing Stationary Source Performance Standards R18-2-701 thru 732
Statewide (for sources under ADEQ’s jurisdiction)
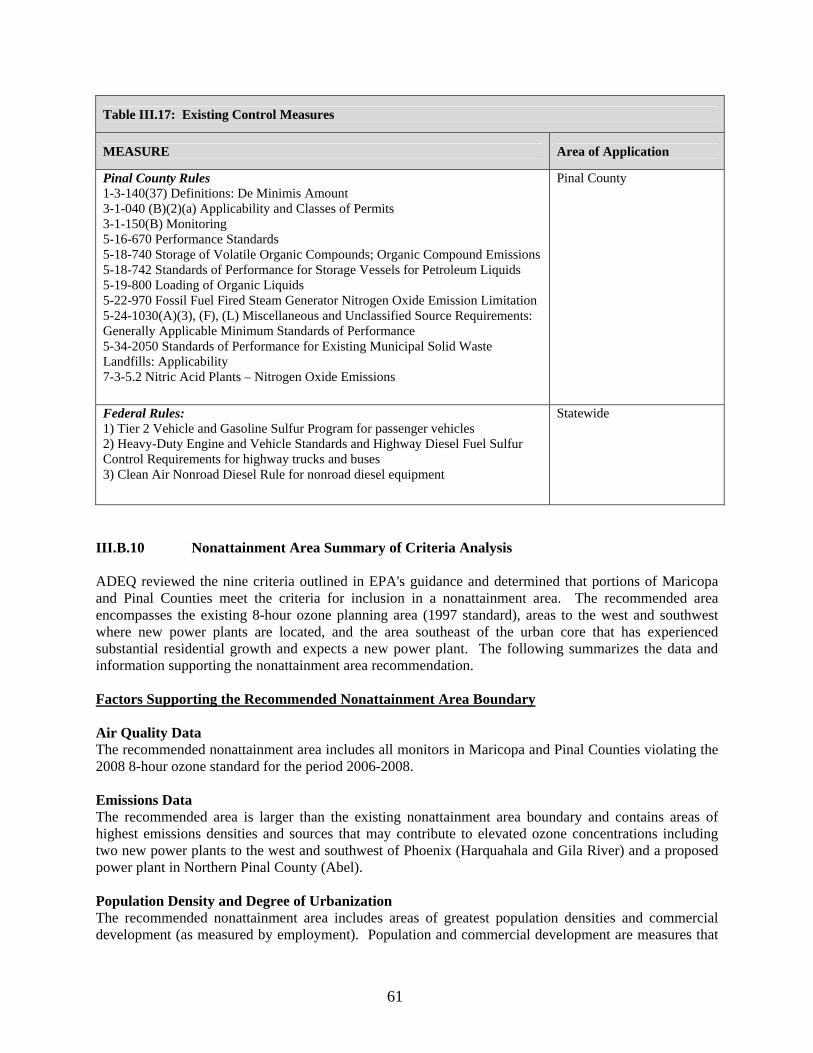
61
Table III.17: Existing Control Measures
MEASURE Area of Application
Pinal County Rules 1-3-140(37) Definitions: De Minimis Amount 3-1-040 (B)(2)(a) Applicability and Classes of Permits 3-1-150(B) Monitoring 5-16-670 Performance Standards 5-18-740 Storage of Volatile Organic Compounds; Organic Compound Emissions 5-18-742 Standards of Performance for Storage Vessels for Petroleum Liquids 5-19-800 Loading of Organic Liquids 5-22-970 Fossil Fuel Fired Steam Generator Nitrogen Oxide Emission Limitation 5-24-1030(A)(3), (F), (L) Miscellaneous and Unclassified Source Requirements: Generally Applicable Minimum Standards of Performance 5-34-2050 Standards of Performance for Existing Municipal Solid Waste Landfills: Applicability 7-3-5.2 Nitric Acid Plants – Nitrogen Oxide Emissions
Pinal County
Federal Rules: 1) Tier 2 Vehicle and Gasoline Sulfur Program for passenger vehicles 2) Heavy-Duty Engine and Vehicle Standards and Highway Diesel Fuel Sulfur Control Requirements for highway trucks and buses 3) Clean Air Nonroad Diesel Rule for nonroad diesel equipment
Statewide
III.B.10 Nonattainment Area Summary of Criteria Analysis ADEQ reviewed the nine criteria outlined in EPA's guidance and determined that portions of Maricopa and Pinal Counties meet the criteria for inclusion in a nonattainment area. The recommended area encompasses the existing 8-hour ozone planning area (1997 standard), areas to the west and southwest where new power plants are located, and the area southeast of the urban core that has experienced substantial residential growth and expects a new power plant. The following summarizes the data and information supporting the nonattainment area recommendation. Factors Supporting the Recommended Nonattainment Area Boundary Air Quality Data The recommended nonattainment area includes all monitors in Maricopa and Pinal Counties violating the 2008 8-hour ozone standard for the period 2006-2008. Emissions Data The recommended area is larger than the existing nonattainment area boundary and contains areas of highest emissions densities and sources that may contribute to elevated ozone concentrations including two new power plants to the west and southwest of Phoenix (Harquahala and Gila River) and a proposed power plant in Northern Pinal County (Abel). Population Density and Degree of Urbanization The recommended nonattainment area includes areas of greatest population densities and commercial development (as measured by employment). Population and commercial development are measures that

62
may indicate the type and levels of activity that could contribute to emissions of ozone precursors. Inclusion of these areas ensures that appropriate controls will apply to limit emissions contributing to violations of the air quality standards. The Tonto Monument is not economically integrated with the Phoenix urbanized core. Traffic and Commuting Patterns The recommended area includes freeways and local roadways recording the highest traffic volumes in the contiguous Phoenix urbanized area. Since on-road vehicles are the largest anthropogenic emissions source category, inclusion of these areas ensures that appropriate Clean Air Act regulations will apply to as many vehicles as possible. Commuting from Gila County into urbanized Phoenix is minimal. Growth Rates and Patterns Projected changes in population, employment, and modeled emissions were examined for a long enough period to include a potential maintenance period (2030). The recommended nonattainment area contains those portions of Maricopa and Pinal Counties expected to experience substantial residential growth contiguous to the Phoenix urban core, as well as a planned new power plant in northern Pinal County that may impact emissions and air quality in the surrounding area. Inclusion of growth areas ensures that appropriate measures will apply to reduce emissions contributing to violations of the air quality standards. Meteorology Meteorological forces in the Phoenix area contribute to the concentration and distribution of ground level ozone. The recommended nonattainment area includes areas of Maricopa and Pinal Counties where transport of emissions likely contribute to elevated ambient ozone concentrations. Geography/Topography Mountain ranges impact the surface flow and generally define the air basin boundaries of the greater Phoenix area. Local topography was considered relative to its effects on weather and transport patterns. Jurisdictional Boundaries Boundaries of counties, air districts, existing nonattainment and control measure applicability areas, and metropolitan planning organizations were considered for determining an appropriate nonattainment area boundary. In addition, because the State has no jurisdiction within the interior boundaries of Indian reservations, the recommended nonattainment area excludes all Indian Country. The recommended nonattainment area includes the existing 8-hour ozone nonattainment area (1997 standard) and the Maricopa and Pinal County portions of Area A where ozone control measure programs are already implemented in areas of highest emissions densities. The recommended nonattainment area includes areas where the existing metropolitan planning organization is currently certified for air quality and transportation planning. The recommendation maintains jurisdictional cohesiveness and requires no new institutional arrangements for accomplishing required tasks. Level of Control of Emission Sources The existing 8-hour ozone nonattainment area requires numerous pollution control measures to address nonattainment with the NAAQS in the Phoenix area. Additional programs are implemented across all of Maricopa County and in Areas A and C in Pinal County (see ARS §49-541). These control measure programs are applied in all areas of highest emissions densities and where sources are shown to contribute to elevated ambient ozone concentrations. In addition, commuters into Area A are required to have their vehicles tested under the Vehicle Emission Inspections and Maintenance program. The effectiveness of

63
these measures is demonstrated through trends in monitored concentrations which on average have been decreasing for the period 1995-2008. Factors Supporting the Exclusion of Gila County Although the Tonto National Monument in Gila County has recorded ambient concentrations in violation of the standard, this monitor is only 2 miles from the existing nonattainment area boundary and the Maricopa County line. Analysis of topography and transport patterns, land ownership and potential for growth, commuting patterns, location of sources, and jurisdictional boundaries all support its exclusion from the Phoenix nonattainment area. No part of Gila County is recommended nonattainment for the reasons outlined below. Emissions Data Gila County contains few emissions sources and the western portion of the County near the Tonto monitor has among the lowest emissions densities in the analysis area and does not contribute significantly to elevated ozone concentrations. Emissions for Gila County equate to 1.2 percent of total VOC and 0.5 percent of total NOx emissions in Arizona. Population Density and Degree of Urbanization Gila County has very low population and employment densities, factors that indicate low levels of activity that could contribute to emissions of ozone precursors. The highest levels of population and employment densities follow areas of private land ownership, however, less than 4 percent of Gila County is under private or corporate ownership. The lowest population levels coincide with state and federal land ownership as seen in eastern Maricopa and western Gila Counties. Traffic and Commuting Patterns The highest traffic volumes are centered in the Phoenix urban core and contained within the recommended nonattainment area boundary. A review of commuting patterns as a measure of the degree of economic activity with the Phoenix urban core showed little integration between Gila County and the Phoenix area. Commuters traveling between Gila County and either Maricopa or Pinal Counties totaled 5 percent of those commuting between Maricopa and Pinal Counties. Growth Rates and Patterns Growth is expected to continue in areas of private land ownership. As noted above, less than 4 percent of Gila County is under private or corporate ownership and State and federal lands in eastern Maricopa and Western Gila Counties create barriers to expansion of the Phoenix urbanized core. Due to these land ownership patterns, Gila County has low potential for growth of activities contributing to precursor emissions. Meteorology Larger scale synoptic systems and the more common southwesterly terrain driven upslope winds during the ozone season dictate the transport of emissions from the urbanized Phoenix area. Although Gila County is largely isolated from the Phoenix metropolitan area by mountainous, complex terrain, transport during synoptic frontal weather systems or afternoon upslope flow can at times have enough momentum to push the ozone plume (elevated concentrations) up and over the mountains to the east of the Phoenix metropolitan area. Analysis reasonably concludes that ozone violations measured at the Tonto monitor are the result of transport from outside Gila County and not due to sources near the monitor. Geography/Topography Mountain ranges impact the surface flow and generally define the air basin boundaries of the greater Phoenix area. Gila County is largely isolated from the Phoenix metropolitan area by mountainous,

64
complex terrain. This terrain, which delineates the Maricopa County/Gila County boundary, can also limit the impact of emissions from the urbanized Phoenix area on non-urbanized portions of Gila County. Jurisdictional Boundaries Gila County is not a member of the Maricopa Association of Governments (MAG). Arizona statutes ARS § 49-406(A), 23 USCA §134, and Governor Bolin's 1978 certification designate MAG as the planning agency for air quality and transportation planning in the Phoenix metropolitan and Maricopa County areas. A nonattainment area that includes Gila County would greatly complicate air quality and transportation planning, and would require development of new institutional arrangements for accomplishing these required tasks. Level of Control of Emission Sources Emissions control programs are already implemented in areas of highest emissions densities. Because there are few emissions sources and little expected growth, inclusion of Gila County in the nonattainment area would not provide substantial benefit for bringing the greater Phoenix area into attainment.

65
IV. AREA DESIGNATION RECOMMENDATIONS IV.A Attainment/Unclassifiable Areas Arizona recommends that all of the following counties (except for Indian Country) be designated attainment for the 8-hour ozone NAAQS:
Apache County Cochise County Coconino County Gila County Graham County Greenlee County La Paz County Mohave County Navajo County Pima County Santa Cruz County Yavapai County Yuma County
In addition, Arizona recommends that Maricopa County and Pinal County (except for Indian Country), except for those portions described in Section IV.B be designated attainment for the 8-hour ozone NAAQS. IV.B Nonattainment Area The nonattainment area recommended by Arizona is smaller than the MSA, but still addresses the criteria identified in EPA’s March 2000 guidance. The recommended area encompasses the existing 8-hour ozone nonattainment area, the area to the west and southwest where new power plants are located and growth areas to the southeast. The recommended area excludes the Gila River Indian Community, Salt River Pima Maricopa Indian Community and the Fort McDowell Yavapai Nation. In the absence of conclusive air quality modeling and additional monitoring, it is not possible at this time to determine the precise extent of nonattainment beyond the Maricopa County line. Arizona’s alternative recommendation includes an attainment/unclassifiable designation for the rest of the State, as explained in Section IV.A. Figure IV.1 illustrates the recommended 8-hour nonattainment area. Table IV.1 describes by county and township the areas of the State recommended for Attainment/Unclassifiable and Nonattainment.

66
Figure IV.1: 8-Hour Ozone Nonattainment Area Recommendation

67
Table IV.1: Recommended Attainment/Unclassifiable and Nonattainment Areas for Arizona
Arizona-Ozone (2008 8-Hour Standard)
Designated Area
Designation Type
Classification Type
Phoenix Area: Maricopa County (part)………………………… T1N, R1E (except that portion in Indian Country) T1N, R2E T1N, R3E T1N, R4E (except that portion in Indian Country) T1N, R5E (except that portion in Indian Country) T1N, R6E T1N, R7E T1N, R1W T1N, R2W T1N, R3W T1N, R4W T1N, R5W T1N, R6W T1N, R7W T1N, R8W T2N, R1E T2N, R2E T2N, R3E T2N, R4E T2N, R6E (except that portion in Indian Country) T2N, R7E (except that portion in Indian Country) T2N, R8E T2N, R9E T2N, R10E T2N, R11E T2N, R12E (except that portion in Gila County) T2N, R13E (except that portion in Gila County) T2N, R1W T2N, R2W T2N, R3W T2N, R4W T2N, R5W T2N, R6W T2N, R7W T2N, R8W T3N, R1E T3N, R2E
Nonattainment

68
Designated Area
Designation Type
Classification Type
T3N, R3E T3N, R4E T3N, R5E (except that portion in Indian Country) T3N, R6E (except that portion in Indian Country) T3N, R7E (except that portion in Indian Country) T3N, R8E T3N, R9E T3N, R10E (except that portion in Gila County) T3N, R11E (except that portion in Gila County) T3N, R12E (except that portion in Gila County) T3N, R1W T3N, R2W T3N, R3W T3N, R4W T3N, R5W T3N, R6W T4N, R1E T4N, R2E T4N, R3E T4N, R4E T4N, R5E T4N, R6E (except that portion in Indian Country) T4N, R7E (except that portion in Indian Country) T4N, R8E T4N, R9E T4N, R10E (except that portion in Gila County) T4N, R11E (except that portion in Gila County) T4N, R12E (except that portion in Gila County) T4N, R1W T4N, R2W T4N, R3W T4N, R4W T4N, R5W T4N, R6W T5N, R1E T5N, R2E T5N, R3E T5N, R4E T5N, R5E T5N, R6E T5N, R7E T5N, R8E T5N, R9E (except that portion in Gila County) T5N, R10E (except that portion in Gila County) T5N, R1W

69
Designated Area
Designation Type
Classification Type
T5N, R2W T5N, R3W T5N, R4W T5N, R5W T6N, R1E (except that portion in Yavapai County) T6N, R2E T6N, R3E T6N, R4E T6N, R5E T6N, R6E T6N, R7E T6N, R8E T6N, R9E (except that portion in Gila County) T6N, R10E (except that portion in Gila County) T6N, R1W (except that portion in Yavapai County) T6N, R2W T6N, R3W T6N, R4W T6N, R5W T7N, R1E (except that portion in Yavapai County) T7N, R2E (except that portion in Yavapai County) T7N, R3E T7N, R4E T7N, R5E T7N, R6E T7N, R7E T7N, R8E T7N, R9E (except that portion in Gila County) T7N, R1W (except that portion in Yavapai County) T7N, R2W (except that portion in Yavapai County) T8N, R2E (except that portion in Yavapai County) T8N, R3E (except that portion in Yavapai County) T8N, R4E (except that portion in Yavapai County) T8N, R5E (except that portion in Yavapai County) T8N, R6E (except that portion in Yavapai County) T8N, R7E (except that portion in Yavapai County) T8N, R8E (except that portion in Yavapai and Gila
Counties) T8N, R9E (except that portion in Yavapai and Gila
Counties) T1S, R1E (except that portion in Indian Country) T1S, R2E (except that portion in Pinal County and in Indian
Country)

70
Designated Area
Designation Type
Classification Type
T1S, R3E T1S, R4E T1S, R5E T1S, R6E T1S, R7E T1S, R1W T1S, R2W T1S, R3W T1S, R4W T1S, R5W T1S, R6W T2S, R1E (except that portion in Indian Country) T2S, R5E T2S, R6E T2S, R7E T2S, R1W T2S, R2W T2S, R3W T2S, R4W T2S, R5W T3S, R1E T3S, R1W T3S, R2W T3S, R3W T3S, R4W T3S, R5W T4S, R1E T4S, R1W T4S, R2W T4S, R3W T4S, R4W T4S, R5W T5S, R4W (Sections 1 through 22 and 27 through 34) Pinal County (part) ………………………… T1N, R8E T1N, R9E T1N, R10E T1S, R8E T1S, R9E T1S, R10E
Nonattainment

71
Designated Area
Designation Type
Classification Type
T2S, R8E T2S, R9E T2S, R10E (Sections 1 through 12) T3S, R7E T3S, R8E T3S, R9E Rest of State (except those portions in Indian Country) ……………………………………… Apache County Cochise County Coconino County Gila County Graham County Greenlee County La Paz County Maricopa County (part) Remainder of County Mohave County Navajo County Pima County Pinal County (part) Remainder of County Santa Cruz County Yavapai County Yuma County
Attainment/ Unclassifiable

This page intentionally left blank.

APPENDIX A
Memo from Robert J. Meyers to EPA Regional Administrators, Area Designations for the 2008 Revised Ozone National Ambient Air
Quality Standards, December 4, 2008


APPENDIX B
Arizona Ozone Monitoring Sites


Appendix B: Arizona Ozone Monitoring Sites
Monitoring Site Start Date End Date Responsible Agency *
EPA AQS ID Number
Craycroft Jan 1, 1973 PDEQ 04-019-1011 Alamo Lake May 20, 2005 ADEQ 04-012-8000 Apache Junction Jan. 1, 1992 PCAQCD 04-021-3001 Blue Point Feb. 1, 1994 MCAQD 04-013-9702 Buckeye Aug. 1, 2004 MCAQD 04-013-4011 Casa Grande Jan. 1, 1991 PCAQCD 04-021-3003 Cave Creek Jan. 1, 2001 MCAQD 04-013-4008 Central Phoenix Jan. 1, 1961 MCAQD 04-013-3002 Children's Park Aug. 1, 1997 PDEQ 04-019-1028 Chiricahua National Monument Jan. 1, 2000 NPS 04-003-8001
Coachline Jan. 1, 2000 PDEQ 04-019-1034 Combs May 1, 2002 PCAQCD 04-021-3009 Dysart Jul. 16, 2003 MCAQD 04-013-4010 Emergency Management Nov. 1, 1993 Jun. 30, 2001 MCAQD 04-013-3004 Falcon Field Jul. 1, 1989 MCAQD 04-013-1010 Flagstaff Middle School Mar. 13, 2008 ADEQ 04-005-1008 Fountain Hills Apr. 1, 1996 MCAQD 04-013-9704 Glendale Jan. 1, 1990 MCAQD 04-013-2001 Grand Canyon National Park -The Abyss Jan. 1, 2000 NPS 04-005-8001
Green Valley Jul. 1, 2003 PDEQ 04-019-1030 Hillside Apr. 26, 1996 Jun. 3, 2005 ADEQ 04-025-0005 Humboldt Mountain Oct. 3, 2000 MCAQD 04-013-9508 JLG Supersite Jul. 1, 1993 ADEQ 04-013-9997 Lake Pleasant May 26, 1998 Jun. 30, 2001 MCAQD 04-013-9805 Maricopa May 1, 2002 PCAQCD 04-021-3010 Maryvale Oct. 1, 1993 Nov. 3, 2003 MCAQD 04-013-3006 Mesa Oct. 1, 1993 Nov. 30, 2002 MCAQD 04-013-1003 Mount Ord #1 Jun. 14, 1995 Oct. 27, 1999 MCAQD 04-013-9701 Mount Ord #2 May 19, 2000 Dec. 31, 2001 ADEQ 04-013-9701 North Phoenix Jan. 1, 1975 MCAQD 04-013-1004 Palo Verde Jul. 25, 1996 Nov. 1, 2004 ADEQ 04-013-9993 Petrified Forest National Park Oct. 1, 2002 NPS 04-017-0119
Pinal Air Park Jan. 1, 2002 PCAQCD 04-021-3007 Pinnacle Peak Jan. 1, 1998 MCAQD 04-013-2005 Prescott College Mar. 25, 2008 ADEQ 04-025-8033 Queen Valley Jan. 1,1 998 ADEQ 04-021-8001 Rio Verde Jan. 1, 1994 MCAQD 04-013-9706 Rose Elementary Jan. 1, 2001 PDEQ 04-019-1032 Rye Jan. 1, 1997 Dec. 31, 1999 ADEQ 04-007-9993 Saguaro National Park East Apr. 1, 1987 PDEQ 04-019-0021
Salt River Pima Jan. 1, 1992 Sep. 30, 1998 ADEQ 04-013-9994 South Phoenix Oct. 1, 1999 MCAQD 04-013-4003

Appendix B: Arizona Ozone Monitoring Sites
Monitoring Site Start Date End Date Responsible Agency *
EPA AQS ID Number
South Scottsdale Jan. 1, 1997 MCAQD 04-013-3003 Surprise Jan. 1, 1993 Jul. 16, 2003 MCAQD 04-013-4007 Tangerine Nov. 1, 1989 PDEQ 04-019-1018 Tempe Jul. 1, 1993 MCAQD 04-013-4005 Tonto National Monument May 22, 2002 ADEQ 04-007-0010
Tucson Downtown Jan. 1, 1968 PDEQ 04-019-0002 Tucson Fairgrounds Oct. 1, 1989 PDEQ 04-019-1020 West Chandler Oct. 1, 2000 MCAQD 04-013-4004 West Chandler Jan. 1, 1995 May 31, 2000 MCAQD 04-013-3009 West Phoenix Jan. 1, 1984 MCAQD 04-013-0019 Yuma City Yard Jan. 1, 1995 Dec. 31, 2001 ADEQ 04-027-0003 Yuma Game & Fish Apr. 14, 2003 Oct. 31, 2008 ADEQ 04-027-0006 Yuma Supersite May 6, 2008 ADEQ 04-027-8011
* ADEQ – Arizona Department of Environmental Quality, MCAQD – Maricopa County Air Quality Department, NPS – National Park Service, PCAQCD – Pinal County Air Quality Control District, PDEQ – Pima Department of Environmental Quality

APPENDIX C
Annual Fourth Highest 8-Hour Ozone Concentrations 1995-2008


Appendix C: Annual Fourth Highest 8-Hour Ozone Concentration in Parts per Million*
Monitor Site 1995 1996 1997 1998 1999 2000 2001 2002 2003 2004 2005 2006 2007 2008
Apache County
No Sites
Cochise County
Chiricahua National Monument 0.069 0.072 0.065 0.067 0.072 0.071 0.067 0.074 0.071 0.070 0.072 0.074 0.067 0.068
Coconino County
Flagstaff Middle School n/a n/a n/a n/a n/a n/a n/a n/a n/a n/a n/a n/a n/a 0.074
Grand Canyon National Park - The Abyss
0.069 0.075 0.072 0.072 0.076 0.071 0.070 0.079 0.073 0.072 0.079 0.070 0.069 0.071
Gila County
Tonto National Monument n/a n/a n/a n/a n/a n/a n/a 0.087 0.084 0.077 0.084 0.081 0.076 0.078
Rye n/a n/a 0.056 0.065 0.080 n/a n/a n/a n/a n/a n/a n/a n/a n/a
Graham County
No Sites
Greenlee County
No Sites
La Paz County
Alamo Lake n/a n/a n/a n/a n/a n/a n/a n/a n/a n/a 0.071 0.073 0.072 0.076
Maricopa County
Arrowhead n/a n/a 0.059 n/a n/a n/a n/a n/a n/a n/a n/a n/a n/a n/a

Appendix C: Annual Fourth Highest 8-Hour Ozone Concentration in Parts per Million*
Monitor Site 1995 1996 1997 1998 1999 2000 2001 2002 2003 2004 2005 2006 2007 2008
Maricopa County (continued)
Blue Point n/a n/a 0.083 0.089 0.087 0.087 0.080 0.086 0.086 0.075 0.081 0.062 0.058 0.074
Buckeye n/a n/a n/a n/a n/a n/a n/a n/a n/a 0.058 0.065 0.067 0.064 0.068
Cave Creek n/a n/a n/a n/a n/a n/a 0.083 0.086 0.083 0.076 0.082 0.080 0.077 0.078
Central Phoenix 0.085 0.076 0.077 0.079 0.078 0.076 0.075 0.076 0.079 0.074 0.075 0.080 0.070 0.072
Dysart n/a n/a n/a n/a n/a n/a n/a n/a 0.073 0.065 0.066 0.072 0.065 0.066
Emergency Management n/a n/a 0.085 0.081 0.086 0.070 0.063 n/a n/a n/a n/a n/a n/a n/a
Falcon Field n/a n/a 0.081 0.083 0.082 0.075 0.081 0.084 0.079 0.070 0.076 0.079 0.073 0.075
Fountain Hills n/a n/a 0.088 0.086 0.086 0.085 0.083 0.086 0.083 0.075 0.088 0.084 0.074 0.079
Glendale 0.080 0.072 0.076 0.070 0.081 0.081 0.078 0.083 0.085 0.076 0.076 0.078 0.071 0.074
Humboldt Mountain n/a n/a 0.081 0.090 0.086 0.082 0.085 0.090 0.087 0.078 0.087 0.079 0.078 0.077
Lake Pleasant n/a n/a n/a 0.082 0.081 0.082 0.073 n/a n/a n/a n/a n/a n/a n/a
Maryvale n/a n/a 0.078 0.086 0.080 0.080 0.073 0.084 0.083 n/a n/a n/a n/a n/a
Mesa 0.092 0.090 0.084 0.080 0.083 0.075 0.074 0.072 n/a n/a n/a n/a n/a n/a
Mt. Ord #1 n/a n/a 0.084 0.088 0.087 n/a n/a n/a n/a n/a n/a n/a n/a n/a
Mt. Ord #2 n/a n/a n/a n/a n/a 0.090 0.077 n/a n/a n/a n/a n/a n/a n/a
North Phoenix 0.092 0.095 0.091 0.089 0.084 0.086 0.086 0.085 0.086 0.080 0.084 0.085 0.078 0.080
Palo Verde n/a 0.071 0.078 0.080 0.080 0.080 0.074 0.078 0.075 0.072 n/a n/a n/a n/a
Pinnacle Peak 0.091 0.091 0.082 0.086 0.084 0.086 0.085 0.084 0.083 0.068 0.083 0.076 0.075 0.073

Appendix C: Annual Fourth Highest 8-Hour Ozone Concentration in Parts per Million*
Monitor Site 1995 1996 1997 1998 1999 2000 2001 2002 2003 2004 2005 2006 2007 2008
Maricopa County (continued)
Rio Verde n/a n/a 0.085 0.079 0.086 0.086 0.083 0.085 0.083 0.074 0.087 0.083 0.079 0.079
Roosevelt n/a n/a 0.084 n/a n/a n/a n/a n/a n/a n/a n/a n/a n/a n/a
Salt River Pima 0.092 0.092 0.082 0.087 0.082 n/a n/a n/a n/a n/a n/a n/a n/a n/a
South Phoenix - Old 0.084 0.091 0.075 0.080 0.075 n/a n/a n/a n/a n/a n/a n/a n/a n/a
South Phoenix n/a n/a n/a n/a 0.063 0.083 0.076 0.081 0.076 0.072 0.076 0.069 0.072 0.076
South Scottsdale 0.089 0.087 0.076 0.078 0.072 0.080 0.079 0.079 0.079 0.073 0.077 0.080 0.077 0.076
Supersite n/a 0.087 0.080 0.079 0.046 0.076 0.079 0.076 0.075 0.072 0.076 0.076 0.076 0.078
Surprise n/a n/a n/a n/a n/a n/a 0.071 0.079 0.066 n/a n/a n/a n/a n/a
Tempe n/a n/a n/a n/a n/a 0.078 0.079 0.080 0.080 0.071 0.076 0.079 0.076 0.078
Vehicle Emissions 0.092 0.080 n/a n/a n/a n/a n/a n/a n/a n/a n/a n/a n/a n/a
West Chandler n/a n/a n/a n/a n/a 0.077 0.078 0.083 0.078 0.070 0.075 0.081 0.072 0.077
West Chandler - Fire Station n/a n/a 0.077 0.074 0.069 0.074 n/a n/a n/a n/a n/a n/a n/a n/a
West Phoenix 0.084 0.081 0.078 0.086 0.091 0.081 0.075 0.084 0.077 0.072 0.068 0.082 0.074 0.078
Mohave County
No Sites
Navajo County
Petrified Forest National Park n/a n/a n/a n/a n/a n/a n/a 0.055 0.074 0.071 0.070 0.071 0.069 0.072
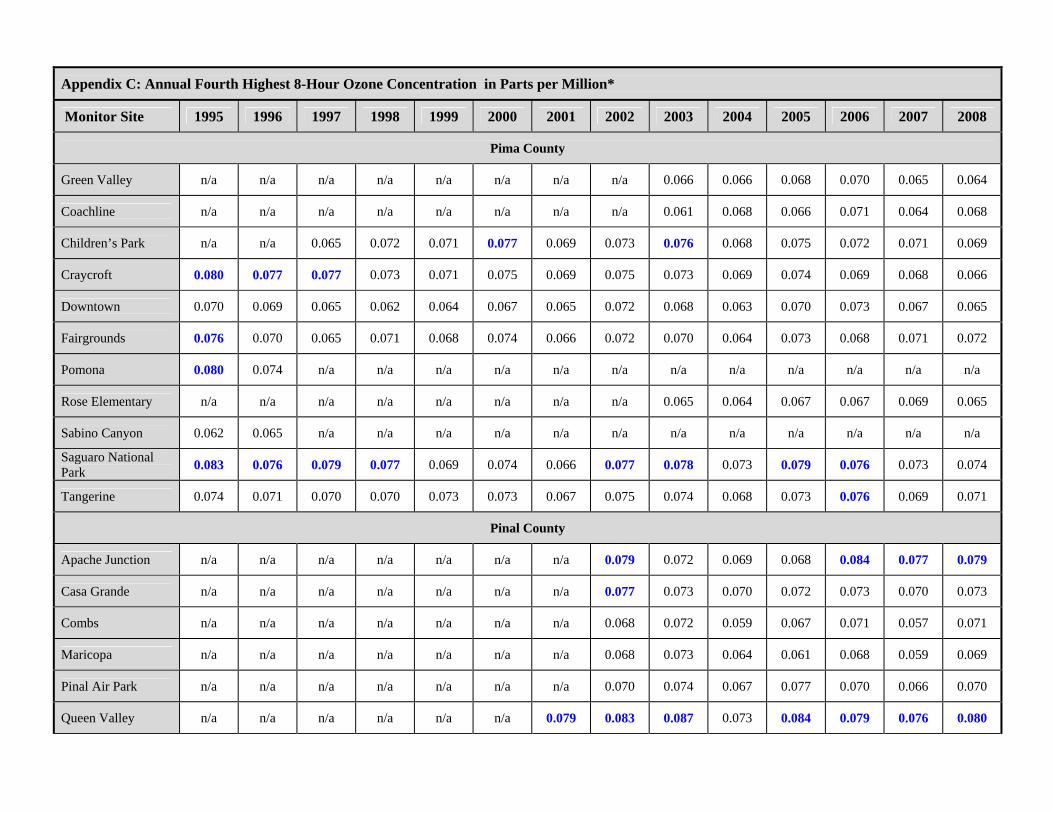
Appendix C: Annual Fourth Highest 8-Hour Ozone Concentration in Parts per Million*
Monitor Site 1995 1996 1997 1998 1999 2000 2001 2002 2003 2004 2005 2006 2007 2008
Pima County
Green Valley n/a n/a n/a n/a n/a n/a n/a n/a 0.066 0.066 0.068 0.070 0.065 0.064
Coachline n/a n/a n/a n/a n/a n/a n/a n/a 0.061 0.068 0.066 0.071 0.064 0.068
Children’s Park n/a n/a 0.065 0.072 0.071 0.077 0.069 0.073 0.076 0.068 0.075 0.072 0.071 0.069
Craycroft 0.080 0.077 0.077 0.073 0.071 0.075 0.069 0.075 0.073 0.069 0.074 0.069 0.068 0.066
Downtown 0.070 0.069 0.065 0.062 0.064 0.067 0.065 0.072 0.068 0.063 0.070 0.073 0.067 0.065
Fairgrounds 0.076 0.070 0.065 0.071 0.068 0.074 0.066 0.072 0.070 0.064 0.073 0.068 0.071 0.072
Pomona 0.080 0.074 n/a n/a n/a n/a n/a n/a n/a n/a n/a n/a n/a n/a
Rose Elementary n/a n/a n/a n/a n/a n/a n/a n/a 0.065 0.064 0.067 0.067 0.069 0.065
Sabino Canyon 0.062 0.065 n/a n/a n/a n/a n/a n/a n/a n/a n/a n/a n/a n/a
Saguaro National Park 0.083 0.076 0.079 0.077 0.069 0.074 0.066 0.077 0.078 0.073 0.079 0.076 0.073 0.074
Tangerine 0.074 0.071 0.070 0.070 0.073 0.073 0.067 0.075 0.074 0.068 0.073 0.076 0.069 0.071
Pinal County
Apache Junction n/a n/a n/a n/a n/a n/a n/a 0.079 0.072 0.069 0.068 0.084 0.077 0.079
Casa Grande n/a n/a n/a n/a n/a n/a n/a 0.077 0.073 0.070 0.072 0.073 0.070 0.073
Combs n/a n/a n/a n/a n/a n/a n/a 0.068 0.072 0.059 0.067 0.071 0.057 0.071
Maricopa n/a n/a n/a n/a n/a n/a n/a 0.068 0.073 0.064 0.061 0.068 0.059 0.069
Pinal Air Park n/a n/a n/a n/a n/a n/a n/a 0.070 0.074 0.067 0.077 0.070 0.066 0.070
Queen Valley n/a n/a n/a n/a n/a n/a 0.079 0.083 0.087 0.073 0.084 0.079 0.076 0.080

Appendix C: Annual Fourth Highest 8-Hour Ozone Concentration in Parts per Million*
Monitor Site 1995 1996 1997 1998 1999 2000 2001 2002 2003 2004 2005 2006 2007 2008
Santa Cruz County
No Sites
Yavapai County
Hillside n/a 0.085 0.076 0.083 0.084 0.083 0.076 0.089 0.067 0.077 0.074 n/a n/a n/a
Prescott College n/a n/a n/a n/a n/a n/a n/a n/a n/a n/a n/a n/a n/a 0.069
Yuma County
Arizona Western College n/a n/a 0.079 0.089 0.079 0.060 0.068 n/a n/a n/a n/a n/a n/a n/a
City Yard 0.073 0.083 n/a n/a n/a n/a n/a n/a n/a n/a n/a n/a n/a n/a
Game and Fish n/a n/a n/a n/a n/a n/a n/a n/a 0.078 0.073 0.078 0.073 0.074 0.076
Supersite n/a n/a n/a n/a n/a n/a n/a n/a n/a n/a n/a n/a n/a 0.077
*Values in blue indicate an exceedance according to the level of the 2008 8-hour ozone standard. Ambient values prior to 2008 are included for comparison. Sources: Arizona Department of Environmental Quality, Maricopa County Air Quality Department, U.S. National Park Service, Pima County Department of Environmental Quality, Pinal County Air Quality Control District


APPENDIX D
Three-Year Average of the Annual Fourth Highest 8-Hour Ozone Concentrations 1995-2008


Appendix D: Three-Year Average of the Annual Fourth Highest 8-Hour Ozone Concentration in Parts per Million*
Monitor Site 1995-1997
1996-1998
1997-1999
1998-2000
1999-2001
2000-2002
2001-2003
2002-2004
2003-2005
2004-2006
2005-2007
2006-2008
Apache County
No Sites
Cochise County
Chiricahua National Monument 0.068 0.068 0.068 0.070 0.070 0.070 0.070 0.071 0.071 0.072 0.071 0.069
Coconino County
Flagstaff Middle School n/a n/a n/a n/a n/a n/a n/a n/a n/a n/a n/a n/a Grand Canyon National Park - The Abyss
0.072 0.073 0.073 0.073 0.072 0.073 0.074 0.074 0.074 0.073 0.072 0.070
Gila County
Tonto National Monument n/a n/a n/a n/a n/a n/a n/a 0.082 0.081 0.080 0.080 0.078
Rye n/a n/a 0.067 n/a n/a n/a n/a n/a n/a n/a n/a n/a
Graham County
No Sites
Greenlee County
No Sites
La Paz County
Alamo Lake n/a n/a n/a n/a n/a n/a n/a n/a n/a n/a 0.072 0.073
Maricopa County
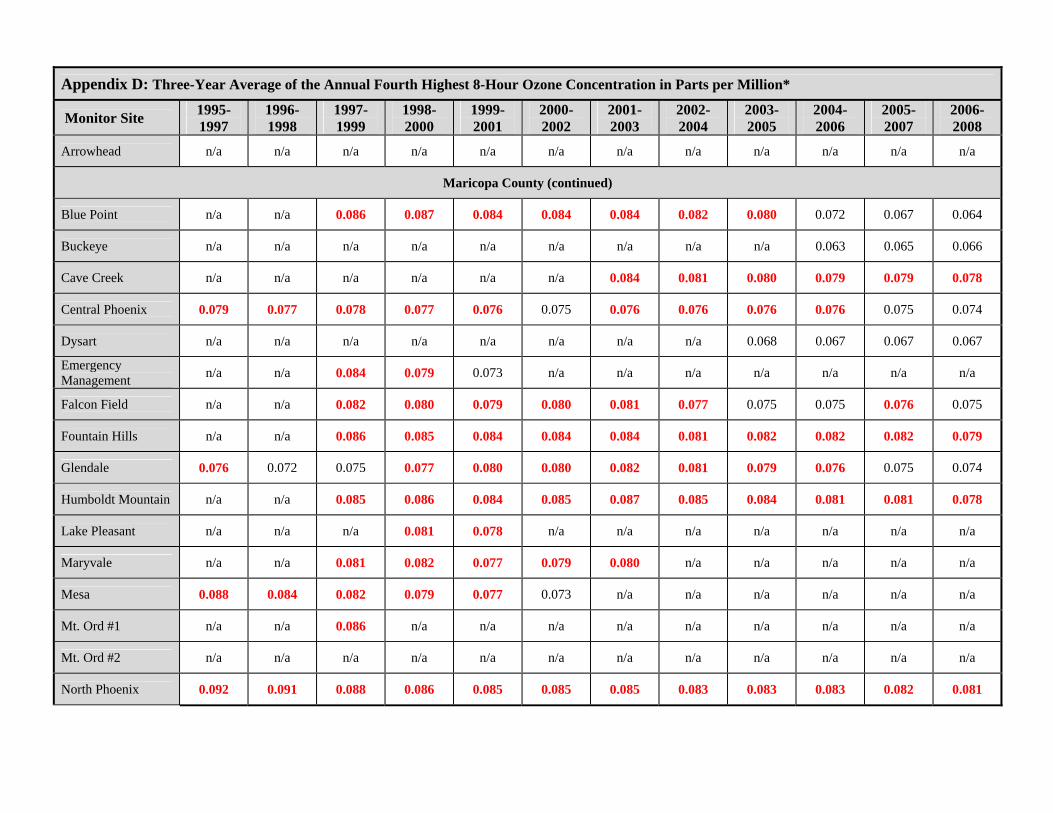
Appendix D: Three-Year Average of the Annual Fourth Highest 8-Hour Ozone Concentration in Parts per Million*
Monitor Site 1995-1997
1996-1998
1997-1999
1998-2000
1999-2001
2000-2002
2001-2003
2002-2004
2003-2005
2004-2006
2005-2007
2006-2008
Arrowhead n/a n/a n/a n/a n/a n/a n/a n/a n/a n/a n/a n/a
Maricopa County (continued)
Blue Point n/a n/a 0.086 0.087 0.084 0.084 0.084 0.082 0.080 0.072 0.067 0.064
Buckeye n/a n/a n/a n/a n/a n/a n/a n/a n/a 0.063 0.065 0.066
Cave Creek n/a n/a n/a n/a n/a n/a 0.084 0.081 0.080 0.079 0.079 0.078
Central Phoenix 0.079 0.077 0.078 0.077 0.076 0.075 0.076 0.076 0.076 0.076 0.075 0.074
Dysart n/a n/a n/a n/a n/a n/a n/a n/a 0.068 0.067 0.067 0.067
Emergency Management n/a n/a 0.084 0.079 0.073 n/a n/a n/a n/a n/a n/a n/a
Falcon Field n/a n/a 0.082 0.080 0.079 0.080 0.081 0.077 0.075 0.075 0.076 0.075
Fountain Hills n/a n/a 0.086 0.085 0.084 0.084 0.084 0.081 0.082 0.082 0.082 0.079
Glendale 0.076 0.072 0.075 0.077 0.080 0.080 0.082 0.081 0.079 0.076 0.075 0.074
Humboldt Mountain n/a n/a 0.085 0.086 0.084 0.085 0.087 0.085 0.084 0.081 0.081 0.078
Lake Pleasant n/a n/a n/a 0.081 0.078 n/a n/a n/a n/a n/a n/a n/a
Maryvale n/a n/a 0.081 0.082 0.077 0.079 0.080 n/a n/a n/a n/a n/a
Mesa 0.088 0.084 0.082 0.079 0.077 0.073 n/a n/a n/a n/a n/a n/a
Mt. Ord #1 n/a n/a 0.086 n/a n/a n/a n/a n/a n/a n/a n/a n/a
Mt. Ord #2 n/a n/a n/a n/a n/a n/a n/a n/a n/a n/a n/a n/a
North Phoenix 0.092 0.091 0.088 0.086 0.085 0.085 0.085 0.083 0.083 0.083 0.082 0.081

Appendix D: Three-Year Average of the Annual Fourth Highest 8-Hour Ozone Concentration in Parts per Million*
Monitor Site 1995-1997
1996-1998
1997-1999
1998-2000
1999-2001
2000-2002
2001-2003
2002-2004
2003-2005
2004-2006
2005-2007
2006-2008
Palo Verde n/a 0.076 0.079 0.080 0.078 0.077 0.075 0.075 n/a n/a n/a n/a
Pinnacle Peak 0.088 0.086 0.084 0.085 0.085 0.085 0.084 0.078 0.078 0.075 0.078 0.074
Maricopa County (continued)
Rio Verde n/a n/a 0.083 0.083 0.085 0.084 0.083 0.080 0.081 0.081 0.083 0.080
Roosevelt n/a n/a n/a n/a n/a n/a n/a n/a n/a n/a n/a n/a
Salt River Pima 0.088 0.087 0.083 n/a n/a n/a n/a n/a n/a n/a n/a n/a
South Phoenix - Old 0.083 0.082 0.076 n/a n/a n/a n/a n/a n/a n/a n/a n/a
South Phoenix n/a n/a n/a n/a 0.074 0.080 0.077 0.076 0.074 0.072 0.072 0.072
South Scottsdale 0.084 0.080 0.075 0.076 0.077 0.079 0.079 0.077 0.076 0.076 0.078 0.077
Supersite n/a 0.082 0.068 0.067 0.067 0.077 0.076 0.074 0.074 0.074 0.076 0.076
Surprise n/a n/a n/a n/a n/a n/a 0.072 n/a n/a n/a n/a n/a
Tempe n/a n/a n/a n/a n/a 0.079 0.079 0.077 0.075 0.075 0.077 0.077
Vehicle Emissions n/a n/a n/a n/a n/a n/a n/a n/a n/a n/a n/a n/a
West Chandler n/a n/a n/a n/a n/a 0.079 0.079 0.077 0.074 0.075 0.076 0.076
West Chandler - Fire Station n/a n/a 0.073 0.072 n/a n/a n/a n/a n/a n/a n/a n/a
West Phoenix 0.081 0.081 0.085 0.086 0.082 0.080 0.078 0.077 0.072 0.074 0.074 0.078
Mohave County
No Sites

Appendix D: Three-Year Average of the Annual Fourth Highest 8-Hour Ozone Concentration in Parts per Million*
Monitor Site 1995-1997
1996-1998
1997-1999
1998-2000
1999-2001
2000-2002
2001-2003
2002-2004
2003-2005
2004-2006
2005-2007
2006-2008
Navajo County
Petrified Forest National Park n/a n/a n/a n/a n/a n/a n/a 0.066 0.071 0.070 0.070 0.070
Pima County
Green Valley n/a n/a n/a n/a n/a n/a n/a n/a 0.066 0.068 0.067 0.066
Coachline n/a n/a n/a n/a n/a n/a n/a n/a 0.065 0.068 0.067 0.067
Children’s Park n/a n/a 0.069 0.073 0.072 0.073 0.072 0.072 0.073 0.071 0.072 0.070
Craycroft 0.078 0.075 0.073 0.073 0.071 0.073 0.072 0.072 0.072 0.070 0.070 0.067
Downtown 0.068 0.065 0.063 0.064 0.065 0.068 0.068 0.067 0.067 0.068 0.070 0.068
Fairgrounds 0.070 0.068 0.068 0.071 0.069 0.070 0.069 0.068 0.069 0.068 0.070 0.070
Pomona n/a n/a n/a n/a n/a n/a n/a n/a n/a n/a n/a n/a
Rose Elementary n/a n/a n/a n/a n/a n/a n/a n/a 0.065 0.066 0.067 0.067
Sabino Canyon n/a n/a n/a n/a n/a n/a n/a n/a n/a n/a n/a n/a Saguaro National Park 0.079 0.077 0.075 0.073 0.069 0.072 0.073 0.076 0.076 0.076 0.076 0.074
Tangerine 0.071 0.070 0.071 0.072 0.071 0.071 0.072 0.072 0.071 0.072 0.072 0.072
Pinal County
Apache Junction n/a n/a n/a n/a n/a n/a n/a 0.073 0.069 0.073 0.076 0.080
Casa Grande n/a n/a n/a n/a n/a n/a n/a 0.073 0.071 0.071 0.071 0.072
Combs n/a n/a n/a n/a n/a n/a n/a 0.066 0.066 0.065 0.065 0.066

Appendix D: Three-Year Average of the Annual Fourth Highest 8-Hour Ozone Concentration in Parts per Million*
Monitor Site 1995-1997
1996-1998
1997-1999
1998-2000
1999-2001
2000-2002
2001-2003
2002-2004
2003-2005
2004-2006
2005-2007
2006-2008
Maricopa n/a n/a n/a n/a n/a n/a n/a 0.068 0.066 0.064 0.062 0.065
Pinal Air Park n/a n/a n/a n/a n/a n/a n/a 0.070 0.072 0.071 0.071 0.068
Queen Valley n/a n/a n/a n/a n/a n/a 0.083 0.081 0.081 0.078 0.079 0.078
Santa Cruz County
No Sites
Yavapai County
Hillside n/a 0.081 0.081 0.083 0.081 0.082 0.077 0.077 0.072 n/a n/a n/a
Prescott College n/a n/a n/a n/a n/a n/a n/a n/a n/a n/a n/a n/a
Yuma County
Arizona Western College n/a n/a 0.082 0.076 0.069 n/a n/a n/a n/a n/a n/a n/a
City Yard n/a n/a n/a n/a n/a n/a n/a n/a n/a n/a n/a n/a
Game and Fish n/a n/a n/a n/a n/a n/a n/a n/a 0.076 0.074 0.075 0.074
Supersite n/a n/a n/a n/a n/a n/a n/a n/a n/a n/a n/a n/a
*Values in red indicate a violation according to the level of the 2008 8-hour ozone standard. Ambient values prior to 2008 are included for comparison. Sources: Arizona Department of Environmental Quality, Maricopa County Air Quality Department, U.S. National Park Service, Pima County Department of Environmental Quality, Pinal County Air Quality Control District


