21
ARL 1 Accomplishments Towards Improving the NOAA National Air Quality Forecast Modeling Capability August 23, 2016 NOAA/OAR/ARL and NWS/NCEP/EMC Air Quality Team
| Date post: | 17-Jun-2018 |
| Category: |
Documents |
| Upload: | hoangtuyen |
| View: | 213 times |
| Download: | 0 times |

ARL
1
Accomplishments Towards Improving the NOAA National Air Quality Forecast
Modeling Capability
August 23, 2016 NOAA/OAR/ARL and NWS/NCEP/EMC
Air Quality Team

ARL
2
NCEP AQ Project Team • Marina Tsidulko - PBL & Chemistry Verification • - High Res. Met modeling
• Youhua Tang - Regional In-line NEMS AQ development • - Lateral Boundary Condition studies
• Jianping Huang - Improved Met-chem coupling • - National AQF System Design & Implementation - U.S. Hysplit Smoke/Dust testing & CMAQ AOD verification • Sarah Lu - Global radiative feedback testing • - NEMS inline aerosols development
• Ho-Chun Huang - Global aerosol system Sources • - Global aerosol data assimilation
• Mariusz Pagowski - Regional chemical data assimilation
• Jeff McQueen - AQF System Evaluation - DOD Dispersion & PBL analysis support
• Geoff Manikin - Hysplit Smoke testing & implementation
• Binbin Zhou & • Perry Shafran – Dispersion/ensemble modeling for H.S.
2

Outline
• NAQFC Model Evaluation – Implementing EPA Community Air Quality Forecast System
• Driving Met processes – air-sfc interactions Dry Deposition, biogenic emissions – boundary layer mixing – Radiation Chemistry photolysis – Clouds aqueous chemistry
• Emphasis – High resolution NMMB Prediction – Evaluation of met errors important for AQ
• Surface fluxes, Low level winds, temperature, moisture • Boundary layer turbulence, evolution • Orographic flow features & timing • Cloud, convection, precip evolution, timing • weak & strong frontal features
• Suspended: • Upgrades to CMAQ (eg: V4.7.1, coupling) • High resolution AQ (eg : 4 km) • Inclusion of smoke/dust in CMAQ
3

NEMS Component Structure MAIN
EARTH(1:NM)
Ocean Atm Ice Below the dashed line, the source codes are organized by the model developers.
FIM
Dyn Phy Wrt
NEMS
Ensemble Coupler
GFS
Dyn Phy Wrt
NMM
Dyn Phy
Domains(1:ND)
Wrt
All boxes represent ESMF components (now supported by NOAA/ESRL). NEMS
LAYER
ARW
Dyn Phy Wrt
WRF-Chem NGAC CMAQ

5
October 2011 NAM Upgrade Old NAM
• WRF-NMM (E-grid) • GSI analysis • 4/Day = 6 hr update • Forecasts to 84 hours • 12 km horizontal • 12 hr pre-forecast
assimilation period with 3hr updates (catch-up)
New NAM • NEMS based NMMB • B-grid replaces E-grid • Parent remains 12 km to 84 hr • Multiple Nests Run to 60 hr
– 4 km CONUS nest – 6 km Alaska nest – 3 km HI & PR nests
• Single locatable ~1.33-1.5 km FireWeather/IMET/DHS run to 36hr

12 km Terrain 4 km
Dots represent water points Domain is San Francisco Bay
GFS ~27km

Land Data Set: Land-Use and Improved Model Performance
Land-use type (1-km, MODIS)
7
• New land-use (vegetation type) data set based on MODIS used by Noah land model in NAM.
• Better surface representation yields better surface fluxes and temperature forecasts in NAM.

Near Real Time Burned Area Product
Zhang and Kondragunta, RSE, in press
Small agricultural fires Forest fires
• Derived from GOES at 30-minute interval for every fire pixel
• Data from 2002 – present available (for product access contact [email protected])
• Product to become operational in Spring 2008 which will allow users to obtain this data in near real time. Product will be archived and can be accessed from NOAA/ NCDC

New Cloud Fraction reduced for cold, high clouds
GOES W Vis GOES W IR
NAM Total Cloud Fraction (%) New Total Cloud Fraction (%)

NAM-CMAQ NAQFC Current Configuration Ozone and PM2.5 Predictions
http://www.weather.gov/aq
Emissions: • EPA CEM anthropogenic inventories • 2005 base year projected to current year w/ EGU • BEIS V3 Biogenic Emissions
Met Model: • North American Model (NAM) • Non-hydrostatic Multi-scale Model (NEMS/NMMB) •12 km 60 Levels AQ Model: •EPA Community Model For Air Quality
•CMAQ V4.6: 12 km/L22 CONUS Domain •Operational: CB04 gas-phase •Exper: CB05 gas-phase/ Aero-4 aerosols
Access •Output available on National Digital Guidance Database
•48 hour forecasts from 06/12 UTC Cycles • PM graphics, GRIB files from EMC
Black: NAM-CMAQ CB IV
Red: NMMB-CMAQ CB IV
Dashed: NMMB-CMAQ CB05 combo1
8 hour max ozone day 2 bias over CONUS
10

Air Quality Forecast 2011 Verification July 29, 2011 case
• NAM-B CMAQ: Significant improvement over Mid-Atlantic
NAM-CMAQ CB-IV chemistry NAMB-CMAQ CB-IV chemistry
12

Air Quality Forecast 2012 Verification Daily 8 hr Max ozone. Errors for Day 2
NAM - CMAQ 12 km
Fraction Correct > 75 PPB by day
Fraction Correct by Threshold

NMMB West vs East 2 m Max Temperature vs 8 h Max ozone
Day 2
• West : Temperatures & Ozone underpredicted • East : Slightly cooler, Ozone overpredicted
EAST WEST
14

NMMB West vs East 2 m Dew Point T vs 8hr Max ozone 33 hour forecasts valid 21:00 UTC
• West : Dewpoint dryer than observed • East : Dew points good
EAST WEST
15

NMMB West vs East 2m RH vs 8h Max ozone
33 hour forecasts valid 21:00 UTC
• NMMB RH forecasts good • High RH correlated with lower ozone
• Clouds ?
EAST WEST
16

NMMB Gulf and SE States 2m RH vs 8h Max ozone
• High RH can be correlated with lower observed ozone and largest model overprediction
• Esp. over SE 17
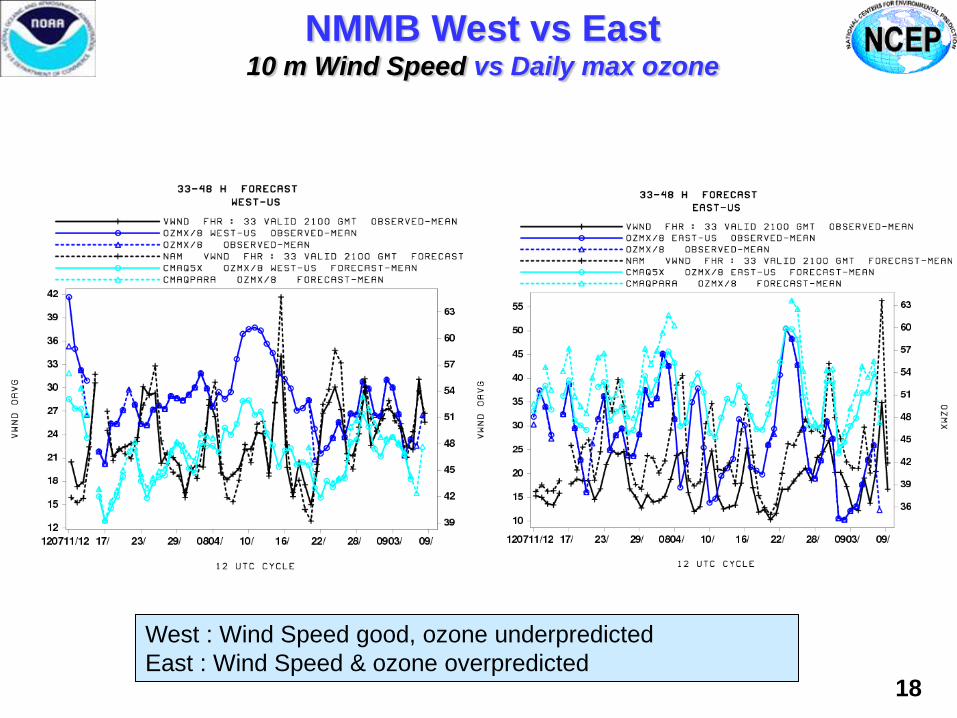
West : Wind Speed good, ozone underpredicted East : Wind Speed & ozone overpredicted
EAST WEST
NMMB West vs East 10 m Wind Speed vs Daily max ozone
18
19
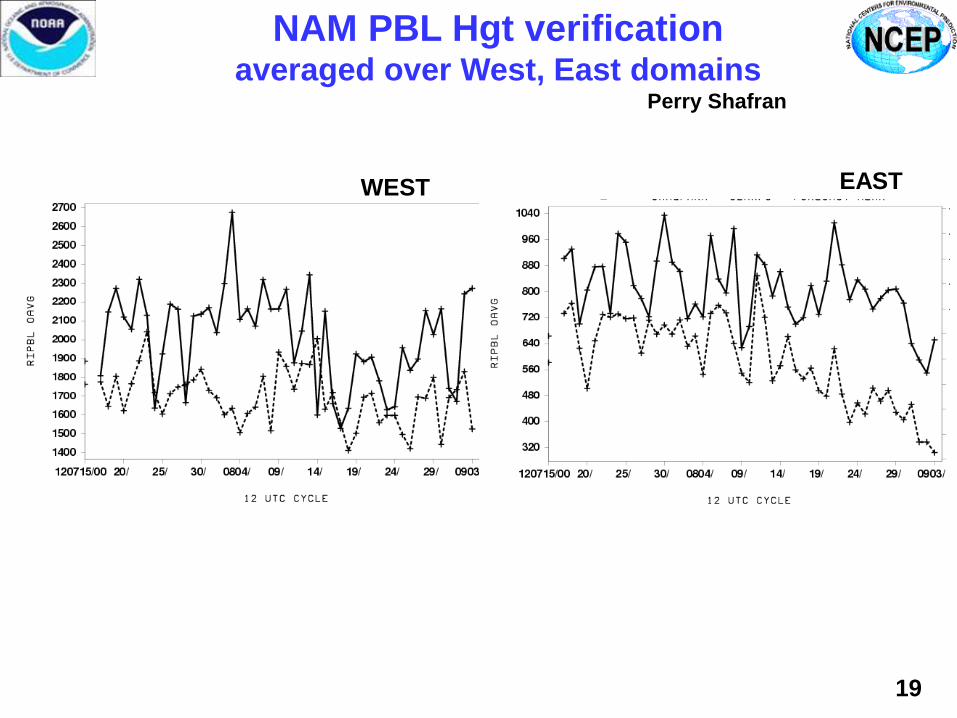
NAM PBL Hgt verification averaged over West, East domains
Perry Shafran
WEST EAST
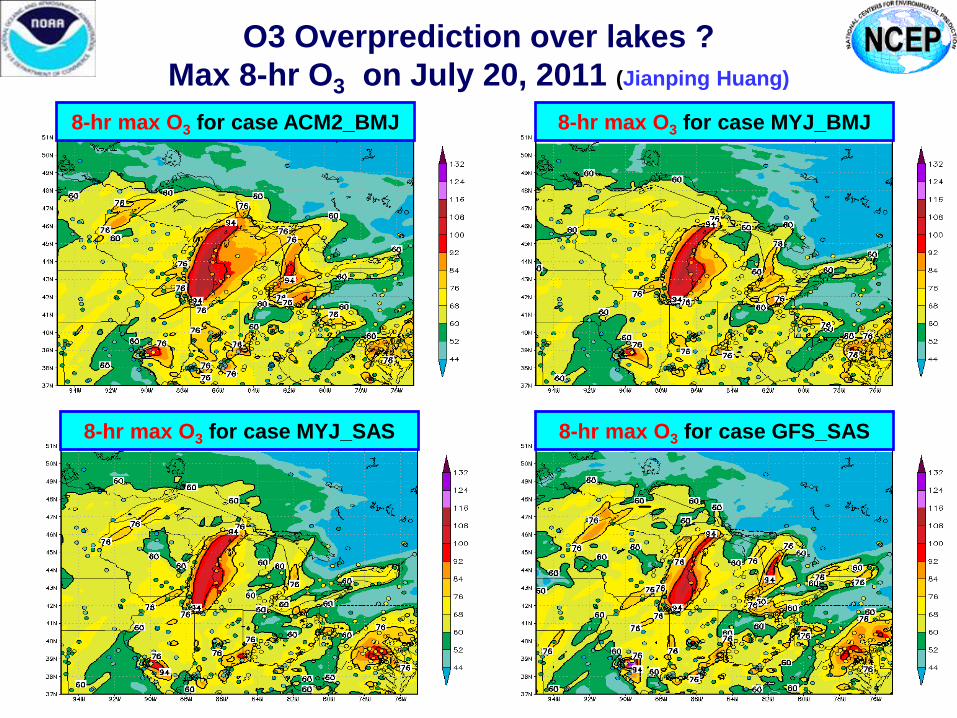
O3 Overprediction over lakes ? Max 8-hr O3 on July 20, 2011 (Jianping Huang)
8-hr max O3 for case GFS_SAS
8-hr max O3 for case ACM2_BMJ 8-hr max O3 for case MYJ_BMJ
8-hr max O3 for case MYJ_SAS

• 120-hr dust-only forecast once per day (00Z) • ICs: Aerosols from previous day forecast and meteorology from operational GDAS • 3-hourly products: 3d distribution of dust aerosols (5 bins from 0.1 – 10 µm) • Automatic output archive, post-processing and web update since June 11, 2011 • Same physics and dynamics as operational GFS with the following exceptions:
– Lower resolution (T126 L64) – Use Relaxed Arakawa-Schubert scheme [Moorthi and Suarez, 1999] with
convective transport and tracer scavenging – Turn off aerosol-radiation feedback
Operational on Sept. 11, 2012 Sarah Lu, NCEP/EMC
Operational NGAC
21

Summary Met Model Characteristics Continue to have a Large Impact on AQ
NEMS NMMB Behaviors
• West: Strong underpredicton of Max Temperatures in West • East : Good T, Td forecasts, winds overpredicted • PBLH underpredicted everywhere at 00 UTC
Met Impacts on AQ
• In East, O3 overprediction sometimes correlated to high RH conditions • In West, O3 underprediction may be related to cooler temperature predictions
Inclusion of intermittent sources Suspended • Plume rise calibrations • Inclusion of dust • Inclusion of external sources from boundaries
Improved metrices required – AQME II • FC strongly forced by non-events • Vertical profiles of PBL and AQ
22


