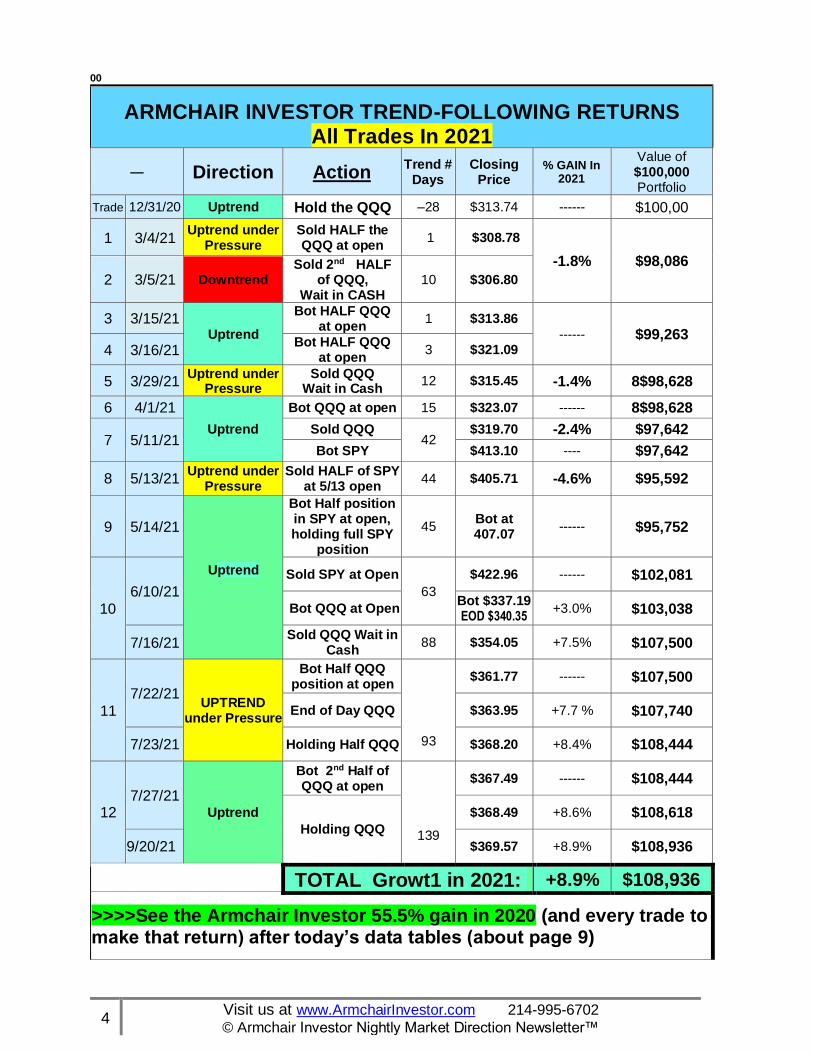
Armchair Investor 2021 Returns: See trades on page 2
>>> +8.9% year-to-date
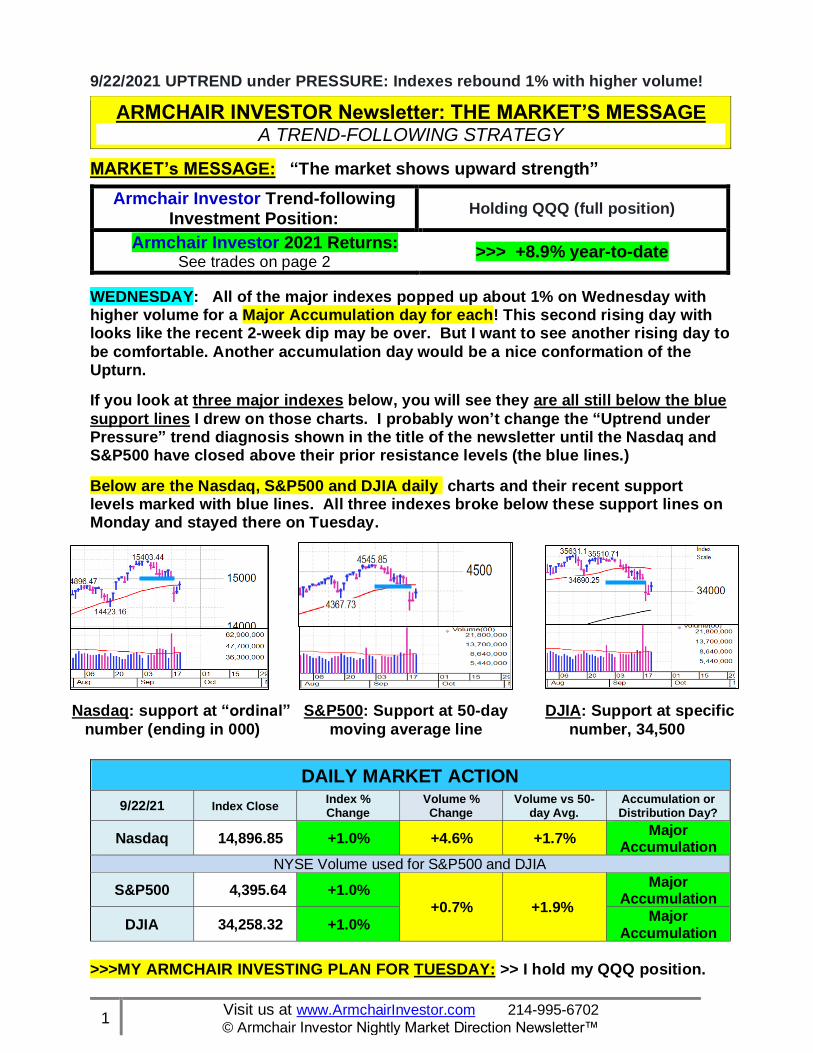
WEDNESDAY: All of the major indexes popped up about 1% on Wednesday with higher volume for a Major Accumulation day for each! This second rising day with looks like the recent 2-week dip may be over. But I want to see another rising day to
be comfortable. Another accumulation day would be a nice conformation of the Upturn.
If you look at three major indexes below, you will see they are all still below the blue
support lines I drew on those charts. I probably won’t change the “Uptrend under Pressure” trend diagnosis shown in the title of the newsletter until the Nasdaq and S&P500 have closed above their prior resistance levels (the blue lines.)
Below are the Nasdaq, S&P500 and DJIA daily charts and their recent support levels marked with blue lines. All three indexes broke below these support lines on Monday and stayed there on Tuesday.
Nasdaq: support at “ordinal” S&P500: Support at 50-day DJIA: Support at specific
number (ending in 000) moving average line number, 34,500
DAILY MARKET ACTION
9/22/21 Index Close Index % Change
Volume % Change
Volume vs 50-day Avg.
Accumulation or Distribution Day?
Nasdaq 14,896.85 +1.0% +4.6% +1.7% Major
Accumulation NYSE Volume used for S&P500 and DJIA
S&P500 4,395.64 +1.0% +0.7% +1.9%
Major Accumulation
DJIA 34,258.32 +1.0% Major
Accumulation
>>>MY ARMCHAIR INVESTING PLAN FOR TUESDAY: >> I hold my QQQ position.
ARMCHAIR INVESTOR Newsletter: THE MARKET’S MESSAGE A TREND-FOLLOWING STRATEGY
STEP 1: In an Uptrend, hold the QQQ, a Nasdaq100 ETF
Find the market direction diagnosis every night in this newsletter.
• In the Uptrend, buy the QQQ the next morning if you don’t yet have that position. This newsletter will alert you to the Uptrend signal! The QQQ follows the ups and downs of the Nasdaq100, allowing you to grab the rises of an Uptrend.
• With some additional positive action, you may decide to switch to the double QQQ ETF (QLD) or triple QQQ (TQQQ). I do not recommend these moves for the first-time investor.
Just in case protection: When you receive your confirmation of the purchase, place an 8% STOP LOSS order to protect your portfolio from a sudden market reversal (executing this sale is rare – I almost always sell when the market goes into “under pressure” or Downtrend – see Step 2 below). Your broker can help you set up this order.
This upward ride is the most exciting part of trend-following – Ride the escalator up, up, up as the market rises. Exit when the market starts to show significant weakness (read this newsletter nightly! Although not every Uptrend signal generates a positive return, most do. History shows you will earn the highest returns if you act fast to buy the QQQ when the market signals a clear Uptrend (as happened on Thursday 9/5) Enjoy your ETF investment as it increases with the rise of the market.
STEP 2: When the Uptrend slows down: “Uptrend under Pressure”
“Uptrend under Pressure” is a Warning Message and means:
• The market is showing significant distribution (selling pressure.) Investors should: o Be concerned about the strength of this Uptrend.
During an Uptrend under Pressure, this newsletter may move into CASH position to avoid possible losses.
o Check on the health of your investments each night! Many investors do not buy new stock positions during this period due to higher failure rates.
• From STEP 2, “Uptrend under Pressure,” the market diagnosis will go one of two ways: o Rise and return to Uptrend – (STEP 1), or o Add more distribution days and fall into Downtrend(correction)
• Watch the market behavior carefully during Uptrend under Pressure. It
can move back into Uptrend or fail quickly now.
STEP 3: When the market diagnosis goes to “Downtrend”
Market in “Downtrend” – a time to capture your gains by selling your UPtrend d ETF position (QQQ, SPY, QLD or TQQQ) when the market diagnosis goes into Downtrend.
• After exiting the Uptrend ETF, wait in cash until the next Uptrend signal.
o Although a few Downtrends are tradeable (like March 2020). Most Downtrends have been short term and not tradable. By the time you have confidence to short the market, it may already have finished its correction.
NOTE: Not every market direction signal ends with a positive return.
But overall, this Market Tracking Strategy has outperformed the market when traded according to these signals.
BONUS: Plus, the market direction signals will help you by indicating when it is most effective to consider adding individual stocks to your portfolio (with a strong uptrending market.)
I track the Nasdaq's price-volume because it usually leads the market direction.
Market Direction
Uptrend under Pressure Uptrend, Under Pressure, Downtrend
Nasdaq Accumulation & Distribution Days (last 20 days) Accumulation
Days Distribution
Days
Only accumulation and distribution days since the last market direction change are in this count.
4 3
Count of Up Days and Down Days in last 10 days Up Days Down Days
3 5
Only days that move at least + or - 0.2% are included in the Up/Down count
which does not always, therefore, add up to 10 days.
Rising/Falling Ratio of Leader Stocks with High Volume
1.3 Nasdaq 10-day ratio
The above indicator looks at the HEALTH of leading stocks (high RS rating) with strong financials (high EPS rating). Uptrend indicator: 1.5 or higher. Neutral:
1.0 to 1.49. Downtrend: less than 1.0
Market Accumulation/Distribution Ratings Nasdaq E
"A": heavy accumulation, "B": moderate accumulation, "C": neutral, "D": moderate distribution, "E": heavy distribution.
S&P 500 E
Accumulation = Institutions are BUYING, Distribution = Inst are SELLING
DJIA E
Are Major Indexes Above or Below Moving Averages? 50-Day 200-Day
Nasdaq At Above
"At" is within 1% above or below the moving average. S&P 500 At Above
JOIN ME AS MY GUEST! Chose a class to visit: 3 class each week Monday 7 - 9 p.m., Tuesday 2 - 4 p.m. and Wednesday 10 a.m.- noon. (Central time)
Register for 2 weeks of FREE CLASSES by clicking on this link:
ARMCHAIR INVESTOR MEETUPSll checks
But this week we are having an intensive 2-hour WORKSHOP on SELLING. You are invited to join us for $49.
>>>> The Armchair Investor newsletter is produced every day the market is
open, as it has for the last 20 years (I’ve missed less than 1 day a year (average) –
traveling in jungles in South American, no internet when cruise ship parked behind
mountains in Alaska, flying across the Atlantic before on-flight internet, a few days
too sick, 1 day computer problem. Not a bad record!)
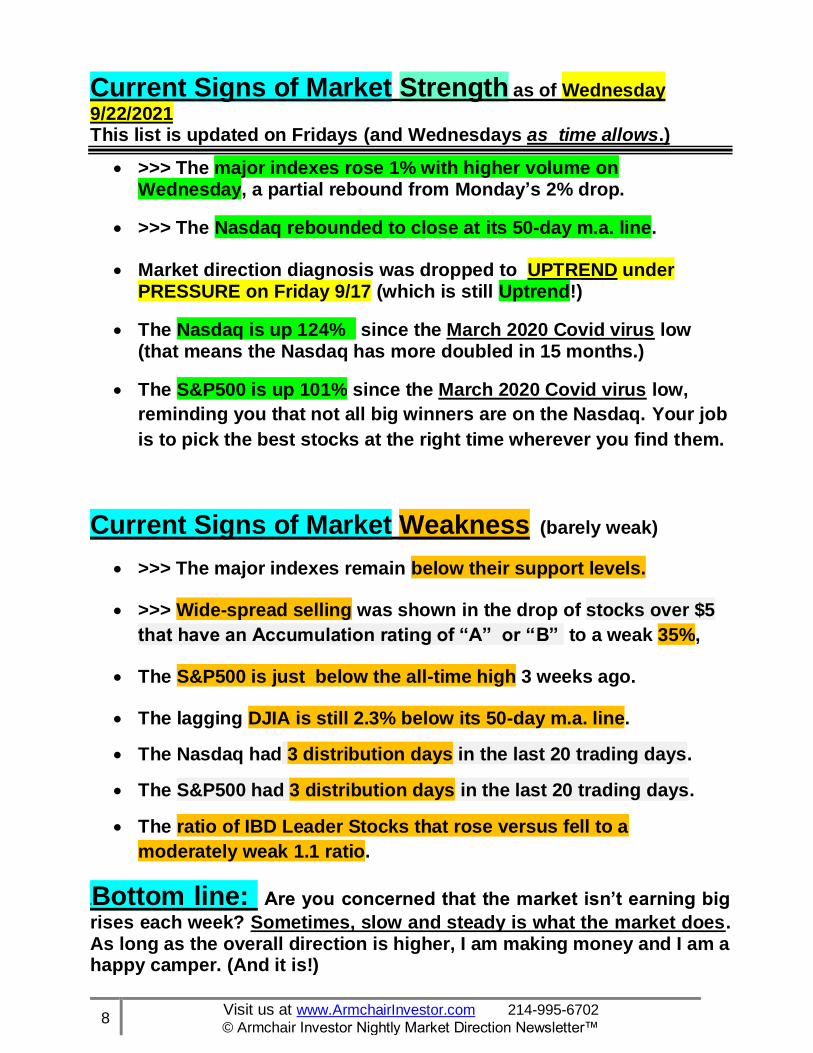
PROGRESS IN ACCUMULATION/DISTRIBUTION RATINGS
A B C D E As + Bs
4 weeks ago 8/25 6% 35% 25% 24% 7% 41%
3 weeks ago 8/31 8% 39% 25% 21% 7% 47%
2 weeks ago 9/8 8% 40% 25% 21% 6% 48%
1 week ago 9/15 6% 35% 27% 23% 8% 41%
Today 9/22 5% 30% 26% 27% 12% 35%
# Stocks in each rating
Count: 366 2363 2022 2131 925 7807
As + Bs continue to be over-weighted (See rightmost column) showing an underlying strength in the market. The sum of As and Bs is still over 40% of all stocks--finding stocks with strong accumulation ratings should not be hard.
NOTE: The Accumulation/Distribution ratings are complex, number crunching calculations and are NOT completed before the day’s Big Picture column is published. Therefore, the Monday Acc/Dist ratings are actually Friday’s. Knowing
the one-day delay explains why they day’s Acc/Dist changes do not always seem to match the current day’s activity.
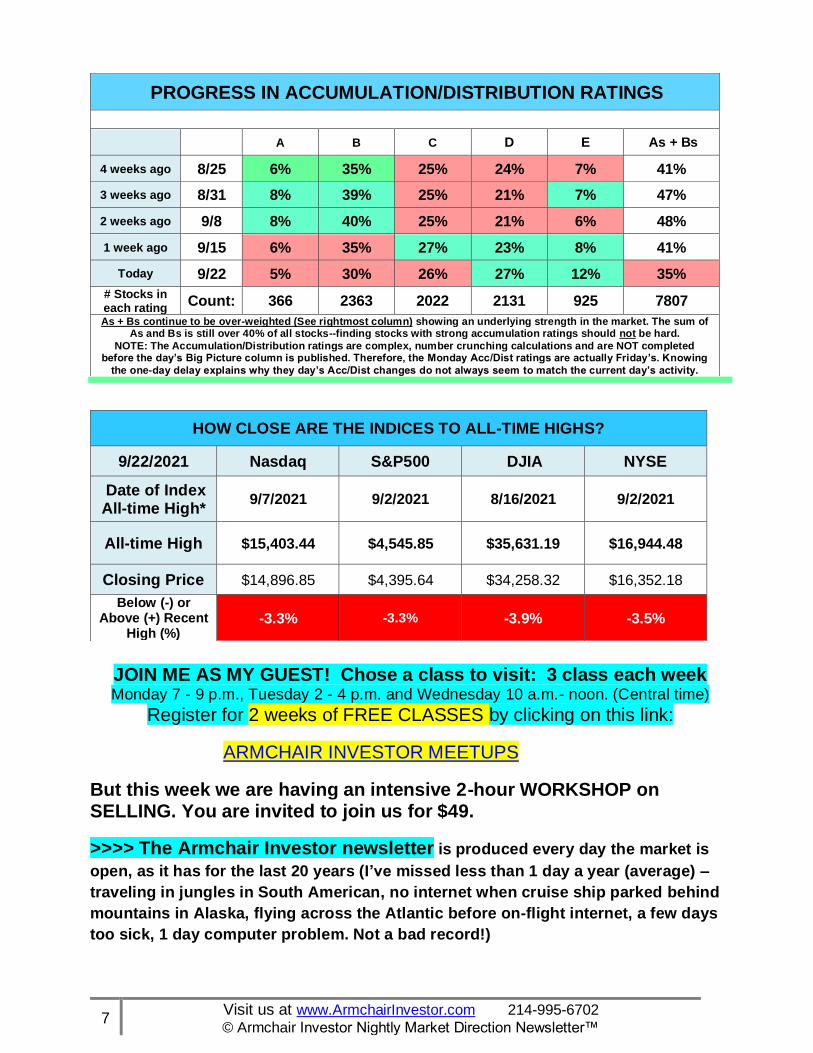
HOW CLOSE ARE THE INDICES TO ALL-TIME HIGHS?
9/22/2021 Nasdaq S&P500 DJIA NYSE
Date of Index All-time High*
9/7/2021 9/2/2021 8/16/2021 9/2/2021
All-time High $15,403.44 $4,545.85 $35,631.19 $16,944.48
9/22/2021 This list is updated on Fridays (and Wednesdays as time allows.)
• >>> The major indexes rose 1% with higher volume on Wednesday, a partial rebound from Monday’s 2% drop.
• >>> The Nasdaq rebounded to close at its 50-day m.a. line.
• Market direction diagnosis was dropped to UPTREND under PRESSURE on Friday 9/17 (which is still Uptrend!)
• The Nasdaq is up 124% since the March 2020 Covid virus low (that means the Nasdaq has more doubled in 15 months.)
• The S&P500 is up 101% since the March 2020 Covid virus low,
reminding you that not all big winners are on the Nasdaq. Your job
is to pick the best stocks at the right time wherever you find them.
Current Signs of Market Weakness (barely weak)
• >>> The major indexes remain below their support levels.
• >>> Wide-spread selling was shown in the drop of stocks over $5
that have an Accumulation rating of “A” or “B” to a weak 35%,
• The S&P500 is just below the all-time high 3 weeks ago.
• The lagging DJIA is still 2.3% below its 50-day m.a. line.
• The Nasdaq had 3 distribution days in the last 20 trading days.
• The S&P500 had 3 distribution days in the last 20 trading days.
• The ratio of IBD Leader Stocks that rose versus fell to a
moderately weak 1.1 ratio.
0Bottom line: Are you concerned that the market isn’t earning big
rises each week? Sometimes, slow and steady is what the market does. As long as the overall direction is higher, I am making money and I am a happy camper. (And it is!)
I am looking forward to the Armchair Investor and IBD LIVE Meetups in 2021, but not yet!
At the end of 2020. Charlotte wrote:
Since 2003, I have had the honor of presenting the ARMCHAIR INVESTOR weekly classes and the monthly INVESTOR’S BUSINESS DAILY Meetups in Dallas and in Fort Worth.
A special “Thanks!” to all of you who support us, showing up early to set up the rooms, greet guests and the necessary food tasters at our Christmas parties (but not this year.) I look forward to enlisting your help when we start back with LIVE Meetups!
I especially thank you to:
• Fred Richards for his amazing market insights and presentations to the group. He is in the process of moving to a new home in the area and I expect to have him join us in the future.
• Ron Shaw for tirelessly greeting guests (one of the most organized, happy guys I know) and handing out the printed copies of the class notes.
• Nick Pollard for setting up so many great restaurant meeting rooms. (RIP)
• And all the others who greeted first time guests, substituted for Ron, found meeting space or stepped in at the last minute to find extension cords, extra tables and chairs, etc. etc. etc.
• The good news, with Wi-Fi, I plan on continuing the Live and Online Meetup!
• It takes a village! Thank you.
Join the next combined Dallas and Fort Worth Investor’s Business Daily’s ONLINE Meetup 6:30 – 8:30 p.m. usually on the fourth or last Wednesday of each month.
Register below. This is a combined ONLINE Meetup:
o Register for the Dallas IBD Meetup o Register for the Fort Worth IBD Meetup
THE 2020 COVID MARKET earned 55%. The Armchair Investor strategy
caught an outstanding 55.5% gain in 2020. (See all trades in 2020 on the next page).
After such an extraordinary rise, a slowdown in 2021 was not a surprise. This
year’s market also added an unusual number of tight swings in market direction.
Since we are conservative and willing to step to cash when the market shows weakness, the 2021 Armchair Investor strategy is flat today. The Armchair investor
strategy has put together a 55% gain since the beginning of 2020.
ARMCHAIR INVESTOR TREND-FOLLOWING RETURNS
All Trades in 2020 Market
Direction Signal Change
Direction Action #
Days Price
% GAIN – Each Trend (See note)
Armchair Investor GAIN
In 2020
Value of $100,000 Portfolio
Trade 12/31/19 Uptrend Hold the QQQ 55 $212.61 +4.3% +4.3% $100,000
1 2/24/20 Uptrend under
Pressure
Sold QQQ at Open
Wait in CASH 3 $221.84 0% +4.3% $104,341
2 2/27/20 Downtrend Bot PSQ at
Open 38 $24.65 +5.6% +10.2% $110,183
3 4/6/20 Attempted Uptrend
Sold PSQ at Open
Wait in CASH 2 $26.03 0% +10.2% $110,183
4 4/8/20 Uptrend Bot QQQ at
Open 155 $198.08 +39.1% +53.3% $153,270
5 9/9/20 Uptrend under
Pressure
Sold QQQ at Open Wait in
CASH 9 $275.54 0% +53.3% $153,270
6 9/18/20 Downtrend Bot PSQ at
Open 13 $17.01 -4.1% +47.0% $146,963
7 10/1/20 Attempted Uptrend
Sold PSQ at Open
Wait in CASH 1 $16.31 0% +47.0% $146,963
8 10/2/20 Uptrend Bot QQQ at
Open 27 $276.01 -1.1% +45.4% $145,381
9 10/29/20 Downtrend Sold QQQ at
Open Wait in CASH
27 $273.04 0% +45.4% $145,381
10 11/5/20 Uptrend Bot QQQ at
Open 7 $293.41 0% +45.4% $145,381
11 11/13/20 Uptrend under
Pressure
Sold QQQ at Open Wait in
CASH 4 $290.01 -1.2% +43.6% $143,613
12 11/17/20 Uptrend Bot QQQ at
Open -- $293.40 +0% +45.4% $143.613
12/31/20 Uptrend Hold the QQQ 44 $313.74 +6.9% +55.5% $155,460
One of the features I like about Investors.com’s MarketSmith charts is that I can draw in my own channel lines.
Did you know annotations stay on the MarketSmith charts! Bravo to the designers. My notations will stay on the MarketSmith charts for years! I can go back and visit how I saw
the market in 2000, 2008, 2015-16, etc.
That is one of MarketSmith’s many truly unique and valuable features! I don’t have to figure out what happened in those past periods again
My annotations are there! Verticle red lines identify distribution days (down days with
higher volume indicating serious selling.)
>>>> I HIGHLY RECOMMEND IBD’s MarketSmith for your investing CHARTS! Note the excellent annotations and markups I have added on the chart below.
All my distribution day notations (pink verticle lines) will be visible on my charts for years! I recently went back to the 2000 market high. And, Yes! The annotations were there! The
vertical red lines I have drawn in indicate “distribution days” – days of serious selling shown by a drop in the index with higher volume. (I don’t annotate all the blue accumulation days except in a Downtrend to help me and my readers see the market
upward reversal.)
All MarketSmith charts include a bumpy blue horizontal line that compares how the price
of this financial instrument (stock, ETF, etc.) rises and falls compared to the S&P500. With this valuable tool, you can see if the fiancial (I’ll call them “stocks” for the rest of this article) instrument you are exploring is outperforming or underperforming the S&P500.
Nasdaq chart covers 2/1/2020 to 9/17/2021 – a look at the whole pandemic impact
MarketSmith is my favorite charting system, available ONLY on INVESTORS.COM.
When the RS line is rising,… the stock/index price is rising faster than the S&P500
and you are making more money invested in this stock than if you were invested in the S&P500.
And if the RS line is falling, you are making less money than if you were invested in the S&P500.
Thus, an investment in the S&P500 or the Nasdaq would have earned the same return. Of course, you can’t invest in the Nasdaq, but you can get close using the QQQ (Nasdaq100).
NOTICE: There are times when the S&P500 under-performs or equals the Nasdaq and, occassionally, shorter periods when the S&P500 out-performs the Nasdaq.
S&P500 chart covers 2/1/2020 to 9/17/2021 – a look at the whole pandemic impact:
REMEMBER: BUY & HOLD IS NOT A STRONG INVESTING STRATEGY. Imagine the difference in returns in the chart above if you had just sold your market ETF
waited in cash as the market falls and get back in as it starts back up!
• It isn’t necessary to get in at the bottom or out at the top! Just stepping out of the market somewhere near the top and getting back in near the
bottom has had a HUGE IMPACT on my portfolio.
An EXAMPLE OF HOW “BUY-AND-HOLD” COSTS YOU BIG BUCKS.
• Over 2020, a “buy and hold” strategy has earned 16.2% for the S&P500. “Buy
and hold” worked better for the Nasdaq earning 43.6%.
But wait….
• If you invested with the Armchair Investor strategy, you were UP 55.5% for
2020. Twelve trades for an extra 11.9%! That is the total the market makes in
some years.
• Where do you want your money invested? Here’s where many answer: “The
Armchair Investor strategy!”
S&P500 chart from 2/1/2020 to 9/17/2021 – a look at the whole pandemic impact
• Do you miss buying a great stock at the price you knew was right?
• Do you sell too early and watch it continue to rise without you?
• Do you hold on too long and lose the gains you just had?
• Or are you just starting out and want a simple, proven method that has outperformed the market in just 5 minutes a day?
• Either way, we have an ARMCHAIR INVESTOR class for you!
PICK THE ARMCHAIR INVESTOR ONLINE CLASS THAT’S
RIGHT FOR YOU:
Be sure to register for you classes – occasionally they change. No Tuesday class this week. Register by clicking the BLUE LINK at the bottom of this page. SUNDAY’S 5-Minute Investor with Market Analysis. This 1-hour class about Market Direction is foundational – If you get the market direction wrong, you are much more likely to lose money. Attended by beginners and experts alike. FREE to all (at the moment). Once you learn this strategy, it’s yours for life!
3 TIMES A WEEK Armchair Investor Workshops Learn how to buy the best stocks at the right time. And then, learn how to track them to identify the right time to take your profits to the bank!
Choose the BEST CLASS for you: Join us on MONDAY 7 – 9 P.M. Tuesday 2:30 – 4:30 p.m. or Wednesday (10 a.m. – noon) for an online Armchair Investor class
<<. Are you new to the Armchair Investor classes? Visit for 2 weeks FREE as my guest! Call or text me at 214-995-6702 to let me know you are coming.
Click here to register for 2 weeks of FREE Armchair Investor Online Classes
<<. Are you new to the Armchair Investor classes? Visit for 2 weeks FREE as my guest! Please call or text me at 214-995-6702 to let me know you are coming. Here is why you should visit.
SUNDAY: Learn to be a 5-Minute Investor! This strategy has earned over 55% last year – following my 9 trades. The weekly 1-hour class about Market Direction is foundational – If you get the market direction wrong, you are much more likely to lose money. Attended by beginners and experts alike. Open to all (at the
moment). We meet every-other Sunday with some adjustments around holiday weekend, and other commitments. Join us by clicking here: online Armchair Investor class.
MONDAY, TUESDAY or WEDNESDAY Armchair Investor Stock analysis 2-HOUR CLASS This class is given 3 times each week. Choose the BEST TIME for you: Join us on MONDAY 7 – 9 P.M. Tuesday 2:30 – 4:30 p.m. or Wednesday (10 a.m. – noon) for an online Armchair Investor class Be sure to check for the date your wish to visit. The class meets 11 weeks each quarter (2 weeks off for research and fun).
To join us for a class, click here: online Armchair Investor class Once you register online – the link to your online meeting will be revealed on the Armchair Investor Meetup site. When you register for an online Armchair Investor class, suggest a few stocks review in the class! Please choose profitable growing stocks. If you own a stock and are considering SELLING THAT STOCK, please note “SELL?” after the ticker.
The chart below shows the last 24-MONTH returns (in percent growth) of the Nasdaq and the S&P500. These results are why I focus on the Nasdaq and QQQ for my trend-following strategy: For the long-term the Nasdaq has always outperformed the S&P500.
Where should you go shopping for a winning bundle of stocks? The answer for me? Nasdaq (QQQ) for long-term hold to grab most of the market! And, yes! I will buy a top stock wherever I find it!
REMEMBER: BUY & HOLD IS NOT A STRONG INVESTING STRATEGY.
Imagine the difference in returns in the chart above if you had just sold your market ETF ted in cash as the market falls and get back in as it starts back up!
• It isn’t necessary to get in at the bottom or out at the top!
• Just stepping out of the market somewhere near the top and getting back in near the bottom has had a HUGE IMPACT on my portfolio.
It can take YEARS to complete a market Downtrend (correction) then recover back to
where you were.
An EXAMPLE OF HOW “BUY-AND-HOLD” COSTS YOU BIG BUCKS.
• Over 2020, a “buy and hold” strategy has earned 8% for the S&P500.
“Buy and hold” worked better for the Nasdaq earning 43.6%.
But wait….
• If you invested with the Armchair Investor strategy, you were UP 55.5%
for 2020. Twelve trades for an extra 11.9%! That is the total the market
makes in some years.
• Where do you want your money invested? Here’s where many answers:
“The Armchair Investor strategy! It’s fast and beats many other
The MarketSmith Relative Strength Line – My favorite!
Go to any chart on the Investors.com web page. You will see the bumpy line labeled RS for Relative Strength. This line moves up or down with each price bar showing if this stock or index rose more or less than the S&P500. Look at the Nasdaq daily chart (0NDQC) and notice that the RS line has risen since the Oct 2019 low, indicating it has earned higher returns. Go to the monthly chart and note that the S&P500 has consistently outperformed the S&P500 (not ever month but most). The S&P500 does have some great stocks. That rising RS line tells us that, over time, the Nasdaq as a whole has done better than the S&P500. But just like shopping for groceries, I will buy from the market that has the best fruit, on any given day. The Nasdaq continues to outperform the S&P500. Watch the RS line on Investors.com charts. This important line shows you how a stock or index is performing comparted to the S&P500. A rising line indicates that stock or index has risen faster than the S&P500 (measured in percentage change.)
Note: Do not confuse IBD’s RS line with the RSI line some charting system use. The RS measures how a stock is moving compared to the S&P500. Rising faster gives a higher rating. Investopedia.com states: The relative strength index (RSI) is a
momentum indicator that measures the magnitude of recent price changes to evaluate “overbought” or” oversold” conditions in the price of a stock or other asset.
The problem I have found with the RSI line is that some of the best, rising stocks can push an RSI line to the top of the rating (indicating overbought) just when I have a buy signal. As always, I tell you to use the indicators you find useful (profitable).
I am excited about the settling down in market volume. But I continue to be concerned about the sustained day-to-day price volatility. It is surely affected by the
uncertainty of the upcoming earnings announcements. BE SURE YOUR STOPS ARE IN PLACE.
Every Day’s Lesson: Whether you agree with your stock’s daily results or not…
• YOUR JOB is to monitor its daily results and adjust your action accordingly. o Monday: Monitor…..and…..adjust. o Tuesday: Monitor…..and…..adjust. o Wednesday: Monitor…..and…..adjust.
o Thursday: Monitor…..and…..adjust. o Friday: Monitor…..and…..adjust. o Next week: (repeat)
When the market (or your stock) dies – whether that is in a year, a month or tomorrow, the Armchair Investor Strategy will NOT “stay the course” and we won’t ride a falling market down. Instead, we will use our 20 years of market direction experience to identify optimum times to be in the market and times to be out of the market. (No guaranties!) (PS I love horses. They are amazing companions.)
Using my day-to-day price-volume analysis, my students and I have consistently been able to make money by:
“Getting IN near the bottom” and “Getting OUT near the top.”
The Armchair Investor strategy has allowed me to earn well-above-average returns since the 2000 top!
MARKET ACTION 2021 YEAR-TO-DATE
9/22/21 2020 Closing Price Current Price Index % Change Year-
to-Date
Nasdaq 12888.28 14,896.85 +15.6%
S&P 500 3756.07 4,395.64 +17.0%
DJIA 30606.38 34,258.32 +11.9%
“Knowledge is Power”
THE LESSON: Riches await the patient investor.
The start of 2021 was volatile for the Nasdaq: A rising month and a half, taking it all and more back in the nest month, rising to the prior high over the next 2 months, giving back most of it in the next 2 weeks. The reward for your patience was the 2-month rise of 13.1% ending up . The half year results: +14.1%.
Meanwhile, the slow but steadily rising S&P500 beat the Nasdaq to rise +16.3%.
The Lesson: Both indexes had admirable half year returns!
I expect a major shift in how we do business: more online appointments, more working from home, reduced business travel (with reduced costs to businesses) We might actually see this lockdown period as a slingshot into a new, sleeker way of conducting business. And each of those new trends will help some business (online meetings, internet providers, online schools, casual clothing, healthy ready-to-eat food….) >>>>>>>>> I would like to hear your ideas of where the big gains will occur!
Which industry groups and specific companies will thrive and? which will dive in the after pandemic new economy???
WILL HISTORY REPEAT ITSELF? In the financial crisis of 2007, it took the market 2 1/2 years to recover the 56% drop. Worse yet was the reaction to the dot.com 90’s market over-inflation that crashed in March of 2000 and took 19 years for the market to “break even.”
WHAT CAN WE (INDIVIDUAL INVESTORS) DO NOW? ONE lesson I have learned from every greatest investor I have studied:
HUMAN NATURE DOESN’T CHANGE.
That is why the cups and handles, double bottoms, etc. continue to work. HUMAN NATURE DOESN’T CHANGE. Human’s nature is to survive and we are, therefore, fear and greed driven. And that is what cups and handles, double bottoms, etc. are all about. Stick with the Armchair Investor non-emotional, fact-based analysis to ride the market as it rises and exit as it falls. I have never been ashamed of exiting a failing market or stock…. or of riding a winner up, no matter what “they” say.
A SIMILAR TIME IN HISTORY I’ve been looking for past examples and see a close one in 1998: a 33% drop during the “dotcom” rally in 1998, Everyone was sure 1998 was the top and got out. When it turned around, they all jumped in again. When the 2000 crash occurred, their brokers told them to stay in because, “…It always comes back! Just look at 1998. When this market fails, I will just say, “GET OUT.”
Reminder: I do not make recommendations - just ideas to consider.
CALL ME IF YOU ARE STUCK! Charlotte – 214-995-6702 >>>>>I’m just hanging around the house waiting for your call!
Look at a Nasdaq or S&P500 daily chart as it crashed off the February 2020 all-time highs. (Charts are at the end of this newsletter.)
Notice the DOWN-TRENDING pattern of:
• frequent higher volume DOWN days (serious selling) and
• frequent lower volume UP days (lack of commitment to the upward move).
NOW NOTICE A SHIFT IN the PRICE-VOLUME PATTERN AS THE MARKET SLOWED DOWN AND THEN STARTED RISING:
• More consecutive rising days with higher volume (Nasdaq)
• A fresh upward move of 4 rising days in a row (Nasdaq)
• Those moves in the last week bring hope that this Uptrend is gathering steam AND it brings a concern that irrational exuberance may be driving this Uptrend.
• EITHER WAY – I am happy to ride this Uptrend until it dies… next week, next month or next year. STAY TUNED!
This “change in personality” is common when a Downtrend becomes an Uptrend.
DISTRIBUTION DAYS: >>> Scan across the volume over the last four weeks
on a daily chart below. You will see almost all the tall volume bars (sticking up above their neighbors) are …. RED, showing higher volume on down days. T
HOW TO SEE DISTRIBUTION ON 2-COLOR CHARTS! Distribution action is easiest to see when you are on a chart with two color volume lines, usually red for falling price days and green (or blue) for rising days. The fastest way to get a sense of the accumulation/distribution going on in a stock or index is to swing your eyes across the volume bars – noting the color of the highest bars - the red volume bar indicates the price dropped that day. The taller bar indicates the volume was higher. (MarketSmith and other IBD charts have this 2-color feature!
REMEMBER:
THE MARKET CONTINUES IN THE DIRECTION IT IS GOING,
…. UNTIL IT DOESN’T!
>>>>But be sure to watch each stock in your portfolio for additional distribution days to signal an exit point. See selling rules chapter of “How to Make Money in Stocks” by William O’Neil, founder of Investor’s Business Daily.
A Simple and Powerful Tool to Increase Your Returns
Armchair Investor Mantra: • Be IN the market when it is going up
• Be OUT of the market when it is going down
• Protect your portfolio with 8% stops.
The primary purpose of this Armchair Investor newsletter is to let you, the reader, earn bigger returns riding the trend of the market.
By following the best (most reliable) market change signals, you can:
• Get in the market near the bottom of a new bull market
• Exit the market near the top, and o Capture more of the gains, o Avoid more of the losses and, thus o Earn higher returns than the “buy-and-hold” strategy recommended
by many brokers and money managers!
Why a “Buy-and-Hold” strategy doesn’t work well: When the market has topped and starts to fall, do you really want to let your profits fade away as the market falls – sometimes for years? Of course not! Selling your uptrend position allows you to capture your gains and store them safely away in cash. What is
the right time to exit? This newsletter will show you the market’s signal.
Most downtrends (also called corrections) fall faster than the uptrends rise. I am not willing to sit in a sick, falling market and lose my hard-earned gains!
Cash is a safer position!
Here are the three signals I will give you in this newsletter for the three market conditions:
• Uptrends: When the market rises into an Uptrend, buy and hold the QQQ, a stock that rises with the general market.
• Uptrend showing Weakness: As a market Uptrend starts to fall, you will receive the signal to exit the QQQ and safely wait in cash.
• Downtrends: If the market continues down, you will receive a signal to buy the PSQ, a stock that rises while the market falls.
FINALLY – For individual stocks: Use these market signals to help you when buying individual stocks. You increase your likelihood of a successful stock purchase if you only buy stocks when the market is in an Uptrend. Lesson: Don’t fight the market trend!
"A": heavy accumulation, "B": moderate accumulation, "C": neutral, "D": moderate distribution, "E": heavy distribution.
S&P 500 D-
Accumulation = Institutions are BUYING, Distribution = Inst are SELLING
DJIA C-
The Nasdaq as a whole, continues to lag the other indexes. But remember, just 8 days ago, it had an "E" distribution rating. I focus on the growth to D+.
Are Major Indexes Above or Below Moving Averages? 50-Day 200-Day
Nasdaq Above Above
"At" is within 1% above or below the moving average. S&P 500 Above Above
DJIA At Above
NYSE Above Above
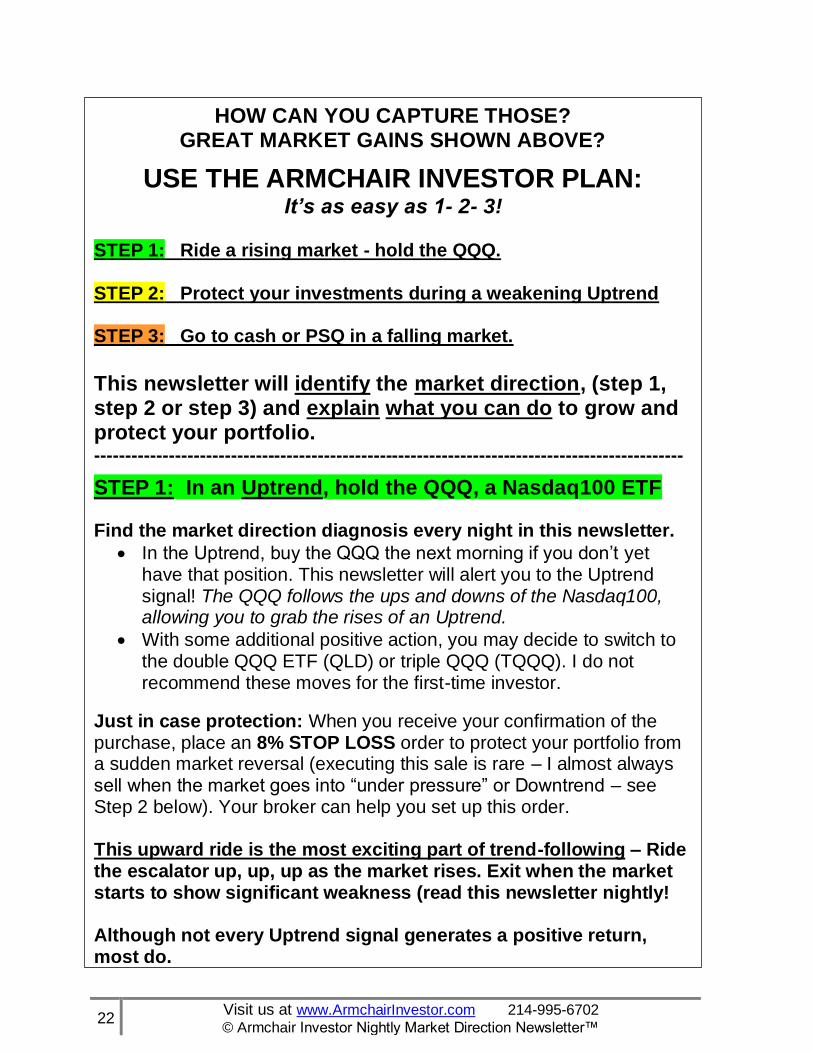
HOW CAN YOU CAPTURE THOSE? GREAT MARKET GAINS SHOWN ABOVE?
USE THE ARMCHAIR INVESTOR PLAN: It’s as easy as 1- 2- 3!
STEP 1: Ride a rising market - hold the QQQ. STEP 2: Protect your investments during a weakening Uptrend STEP 3: Go to cash or PSQ in a falling market.
This newsletter will identify the market direction, (step 1, step 2 or step 3) and explain what you can do to grow and protect your portfolio. -----------------------------------------------------------------------------------------------
STEP 1: In an Uptrend, hold the QQQ, a Nasdaq100 ETF
Find the market direction diagnosis every night in this newsletter.
• In the Uptrend, buy the QQQ the next morning if you don’t yet have that position. This newsletter will alert you to the Uptrend signal! The QQQ follows the ups and downs of the Nasdaq100, allowing you to grab the rises of an Uptrend.
• With some additional positive action, you may decide to switch to the double QQQ ETF (QLD) or triple QQQ (TQQQ). I do not recommend these moves for the first-time investor.
Just in case protection: When you receive your confirmation of the purchase, place an 8% STOP LOSS order to protect your portfolio from a sudden market reversal (executing this sale is rare – I almost always sell when the market goes into “under pressure” or Downtrend – see Step 2 below). Your broker can help you set up this order. This upward ride is the most exciting part of trend-following – Ride the escalator up, up, up as the market rises. Exit when the market starts to show significant weakness (read this newsletter nightly! Although not every Uptrend signal generates a positive return, most do. History shows you will earn the highest returns if you act fast to buy the QQQ when the market signals a clear Uptrend (as happened on Thursday 9/5) Enjoy your ETF investment as it increases with the rise of the market.
STEP 2: When the Uptrend slows down: “Uptrend under Pressure”
“Uptrend under Pressure” is a Warning Message and means:
• The market is showing significant distribution (selling pressure.) Investors should: o Be concerned about the strength of this Uptrend.
During an Uptrend under Pressure, this newsletter may move into CASH position to avoid possible losses.
o Check on the health of your investments each night! Many investors do not buy new stock positions during this period due to higher failure rates.
• From STEP 2, “Uptrend under Pressure,” the market diagnosis will go one of two ways: o Rise with price and volume strength, and return to Uptrend –
(STEP 1), or o Continue to add more distribution days and fall into a
Downtrend (correction)
• This is a time to pay attention to the market behavior.
STEP 3: When the market diagnosis goes to “Downtrend”
Capture much of the gains from the Uptrend by selling your
Uptrend ETF position (QQQ, QLD or TQQQ) when the market diagnosis goes into Downtrend to capture much of the gains earned in Steps 1 & 2 above.
After exiting the Uptrend ETF, wait in cash until the next Uptrend signal. More recent Downtrends have been short term and not tradable. The Uptrend has been years long and strong. The market is due for a long dive. I will invest in the PSQ (inverse QQQ) ETF which makes profits as the market falls!
NOTE: Not every market direction signal end with a positive return.
But overall, this Market Tracking Strategy has outperformed the market when traded according to these signals.
BONUS: Plus, the market direction signals will help you by indicating when it is most effective to consider adding individual stocks to your portfolio (with a strong uptrending market.
Always consider taking some profit if significant distribution is showing up for your individual stocks. However, many individual stocks are
rising with gusto! Look at all the lists in the Investor’s Business Daily newspaper for stocks breaking out with high volume. They are there!
To get a deeper sense of the health of the market, look at the MARKET FACTORS, COUNTS & RATINGS table included each day in the FULL Armchair Investor newsletter. It looks at 7 key market direction factors and highlights the leaning of each:
• If the factor leans toward the Uptrend, that box will be green
• If the factor leans toward the Downtrend, that box will be orange or red
To schedule a class visit: Contact Charlotte Hudgin at 214-995-6702
One of the reasons I pay so much attention to the Investor’s Business Daily strategies and books (How to Make Money in Stocks series) is that they work consistently.
Visit an ARMCHAIR INVESTOR CLASS
We have 3 live classes given each week in Dallas. These classes will be given ONLINE until we are cleared to meet in person. Visit any class this week and next as my guest (2 free visits!). Register at the Armchair Investor Meetup class site to join the class you are interested in. Click on one of the links below to register. I occasionally take off for a class (or a week of them) for my own education or fun. If that is the case, those days will not be available for registration on Meetup.
WHAT HAPPENED LAST WEEK? This weekly review is shown near the front of the Armchair Investor newsletter only on the weekend edition. It is always shown near the end of the newsletter for the rest of the week as a reference.
9/17/2021 WEEKLY REVIEW: The market held near recent highs.
• Both major indexes (Nasdaq and S&P500) pulled back to support levels and held there.
LAST WEEK’S TOTAL MARKET ACTION
9/17/21 Weekly Index %
Change Weekly Volume %
Change Volume Above/ Below
10-week Avg
Nasdaq -0.5% +43.7% +48.0%
NYSE Volume
S&P 500 -0.6% +54.4% +26.0%
DJIA -0.1%
• Both major indexes showed weakness in their Accumulation/ Distribution ratings last week:
o The Nasdaq‘s Accumulation/Distribution stayed at D- (indicating selling) o The S&P500 and DJIA rose from E (the weakest rating) to D- (just a little
better.)
o Note: The Acc/Dist rating is an IBD Proprietary feature that shows whether institutions are buying (A or B) or selling (D or E) the stock or market over the recent 13-week (1 quarter).
LAST WEEK’S DAILY MARKET ACTION
MONDAY TUESDAY WEDNESDAY THURSDAY FRIDAY
FOR THE
WEEK
9/13 9/14 9/15 9/16 9/17
Nasdaq -0.1% -0.5% +0.8% +0.1% -0.9% -0.5%
Volume +2.9% -2.4% -2.6% -17.4% +69.8%
Type of Day
Neither Neither Neither Neither Minor
distribution
A Major Accumulation Day: Price RISES at least 1.0% or more with higher Volume than prior day. A Major Distribution Day: Price FALLS at least 1.0% or more with higher Volume than the day before.
A Minor accumulation Day: Price RISES at least 0.2% and less than 1% with strong Volume (either higher than the day before or is well-above average volume).
A Minor distribution Day: Price FALLS at least 0.2% and less than 1% with strong Volume (either higher than the day before or is well-above average volume).
A Neither day: Price/volume action does not meet accumulation or distribution criteria
** Even though the Nasdaq volume on 1/28/21 was below the day before, it was still the second highest daily volume ever! (on MarketSmith’s data). The highest volume was on 1/27/21 (the day before).
I’m updating my 2021 spreadsheet and calendars to note the
days the market is closed and has an early close. I thought you might want to update also.
the 2021 holiday and early closure schedule for the NYSE and Nasdaq:
The Nasdaq Stock Market and New York Stock Exchange (NYSE) close for nine holidays each year and two “early closure” days (sometimes misnamed “half days”):
Here is the 2021 holiday closure schedule for the NYSE and Nasdaq:
• New Year's Day: Friday, Jan. 1
• Martin Luther King Jr. Day: Monday, Jan. 18
• Presidents Day: Monday, Feb. 15
• Good Friday: Friday, April 2
• Memorial Day: Monday, May 31
• Independence Day: Monday, July 5 (July 4 falls on a Sunday)
• Labor Day: Monday, Sept. 6
• Thanksgiving: Thursday, Nov. 25
• Black Friday Friday, Nov 26 (early close at 1 p.m.)
• Day Before Christmas Thursday, Dec. 23 (early close at 1 p.m.)
• Christmas:
• Day Before Christmas Thursday, Dec. 23 (early close at 1 p.m.)
o Friday, Dec. 24 (12/25 falls on a Saturday)
On regular trading days, the main trading session runs the normal schedule of 9:30 a.m. to
4 p.m. (New York City time, i.e., Eastern time)
On early close trading days, the main trading session runs from 9:30 a.m. to 1 p.m. ET.
When a holiday falls on a Saturday, the NYSE and Nasdaq close on the Friday before. Holidays that land on a Sunday are observed on the following Monday.
Access the FULL ARMCHAIR Investor newsletter each night in just 2 clicks: WWW.ARMCHAIRINVESTOR.COM The go down to the bottom of the page – click on ARCHIVE The Archive will be open until we work out the new subscription-only access system. To guarantee your continued access to this newsletter, sign up for a newsletter subscription or for the weekly classes (which include the newsletter)
Wishing you "Many Happy Returns,"
Charlotte Hudgin, 214-995-6702, Editor, the Armchair Investor
DISCLAIMER, “Buyer Beware” WARNING: This newsletter shares the ideas I use in my investing. It is not investing advice but should be taken as education only. Your investment decisions are your responsibility as are the results. If you are not comfortable with or do not understand a strategy completely, I recommend that your paper-trade until you are successful and can sleep well at night.
Call me to explore your investing questions!
Charlotte Hudgin, 214-995-6702
See additional definitions on the following pages….
DO INVESTORS IN INDIVIDUAL STOCKS BEAT THE MARKET?
The research shows Most investors didn’t come close to beating the S&P 500 (as stated by CNBC.)
But what you should really be concerned about is ….IS THIS MARKET HEALTHY? My answer: Follow the accumulation and distribution days!
• A market with just a few accumulation days (or none) in the last 20 trading days is not showing broad market buying. Then look for distribution days. You can see the recent 4-week price-volume history of the Nasdaq on this newsletter’s MARKET ACTION (Nasdaq) OVER THE LAST 20 DAYS table.
• Explanation: When an index rises 5% or move above the close of a distribution day, then that day is considered, “NO LONGER RELEVANT!” The market is hot-dogging higher and those distribution days are long gone from the rear-view mirror.
• A steadily rising market is more sustainable! Watch for additional distribution days.
• The current up-channel is not quite as steep as last year’s 5-month rising channel. That could mean that it won’t last as long. Or that, because of the gentler rise, it will last longer.
How long will the rise run? (You know my answer: The market will continue higher until…… it doesn’t.)
The Armchair Investor Strategy earned extraordinary returns for
2020 (see the table on prior page). And YOU could have earned
this return shown below if you followed this nightly newsletter and
made these 12 trades, all broadcast at the end of the day for your
action the following morning. Read this newsletter and reap the
A Major Accumulation Day: Price RISES 1.0% or more with higher Volume than the day before. A Minor accumulation Day: Price RISES 0.2% and less than 1% with strong Volume (either higher than the day before or is well-above average volume). A Major Distribution Day: Price FALLS 1.0% or more with higher Volume than the day before. A Minor distribution Day: Price FALLS 0.2% and less than 1%with strong Volume (either higher than the day before or is well-above average volume). If the day's price/volume action does not meet the accumulation or distribution definitions above, it is a neither day.
** The Recent Trend Gains/Losses column calculates how far each index has moved from the recent trend change assuming you purchased the index (in an Uptrend) or sold the index (in a Downtrend) at the opening price on the day after the signal. Although not every year outperforms the common “buy and hold” strategy, using these signals has significantly OUTPERFORMED the buy-and-hold strategy in total since 1/1/2000.
Why are my Final Volumes sometimes Different than Yours? Why do the volume numbers on this table not always match other web sites? The 4:00 close of the market immediately shows an accurate final price. But the volume figures continue to trickle in for hours. At some time, the accumulation of volume numbers has to be cut off and different sites use different cut-offs. Also, some sources include the volume of stocks listed on one exchange but traded on another (e.g., Apple stock listed on Nasdaq but also traded on other exchanges.) And some sources do not. The most important rule is to consistently use only one source for volume.
Always consider taking some profit if significant distribution is showing up for your individual stocks. However, many individual stocks are rising with
gusto! Look at all the lists in the Investor’s Business Daily newspaper for stocks breaking out with high volume. They are there!
To get a deeper sense of the health of the market, look at the MARKET FACTORS, COUNTS & RATINGS table included each day in the FULL Armchair Investor newsletter. It looks at 7 key market direction factors and highlights the leaning of each:
• If the factor leans toward the Uptrend, that box will be green
• If the factor leans toward the Downtrend, that box will be orange or red
To schedule a class visit: Contact Charlotte Hudgin at 214-995-6702
One of the reasons I pay so much attention to the Investor’s Business Daily strategies and books (How to Make Money in Stocks series) is that they work consistently.
Visit an ARMCHAIR INVESTOR CLASS
We have 3 live classes given each week in Dallas and one on-demand ONLINE class. Visit a class as my guest
• Monday nights, 7 – 9 p.m.
• Tuesday afternoons 2:30 – 4:30 p.m.
• Wednesday mornings 10:00 a.m. to noon
• Classes meet ONLINE. When the virus risk is past some classes will resume in north Dallas.
• Online classes and consultations available by appointment – Call me for a FREE introduction!
Newsletter readers get a FREE class visit: Monday evening, Tuesday afternoon or Wednesday morning in Dallas.
Call or text me to set up your visit.
Pre-REGISTRATION REQUIRED FOR YOUR FREE VISIT Just Call or Text me: 214-995-6702
CALL EARLY: Seating is limited to no more than 3 guests at each session to ensure the paid subscribers receive full value.