STUDY INTO THE ESTABLISHMENT OF AN AROMA AND FRAGRANCE FINE CHEMICALS VALUE CHAIN IN SOUTH AFRICA (TENDER NUMBER T79/07/03) FINAL REPORT (Submission date: 15 September 2004) Part Three/Four Report: Aroma Chemicals Derived from Petrochemical Feedstocks Study conducted by: Triumph Venture Capital (Pty) Limited In conjunction with Dr Lorraine Thiel and Mr Fadl Hendricks (“the Consultant”)
Transcript
STUDY INTO THE ESTABLISHMENT OF AN AROMA AND FRAGRANCE FINE CHEMICALS VALUE CHAIN IN SOUTH AFRICA (TENDER NUMBER T79/07/03) FINAL REPORT (Submission date: 15 September 2004) Part Three/Four Report: Aroma Chemicals Derived from Petrochemical Feedstocks
Study conducted by: Triumph Venture Capital (Pty) Limited In conjunction with Dr Lorraine Thiel and Mr Fadl Hendricks (“the Consultant”)
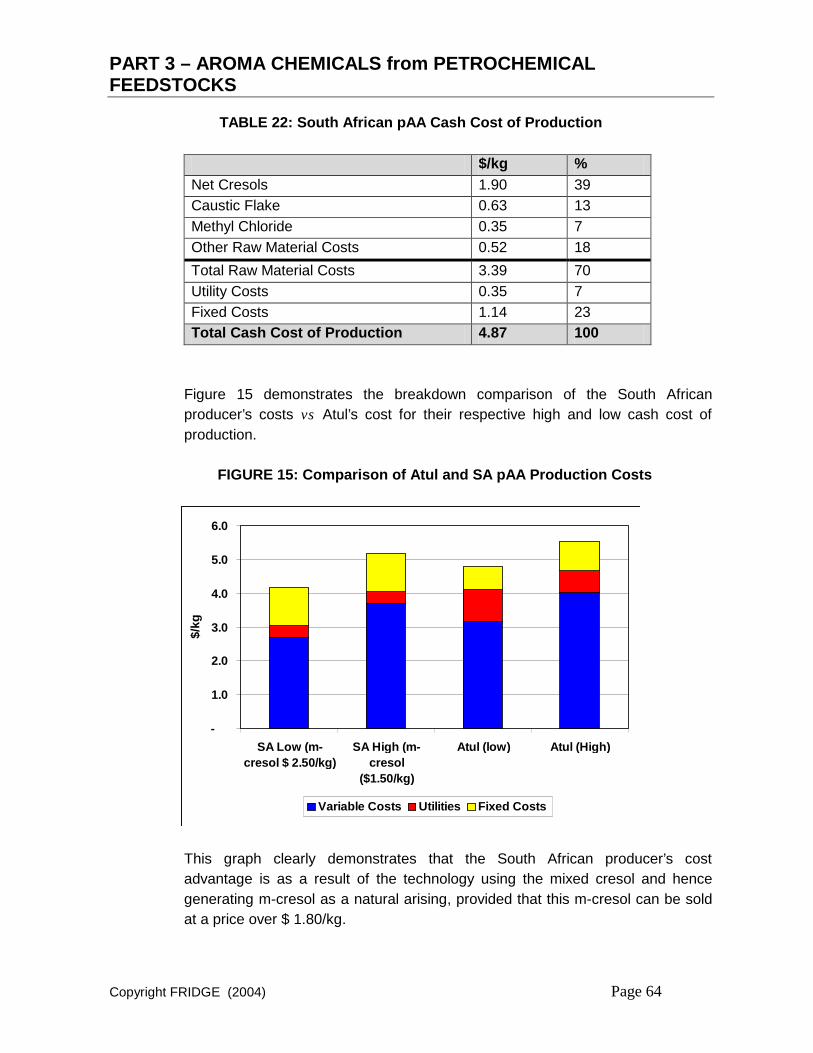
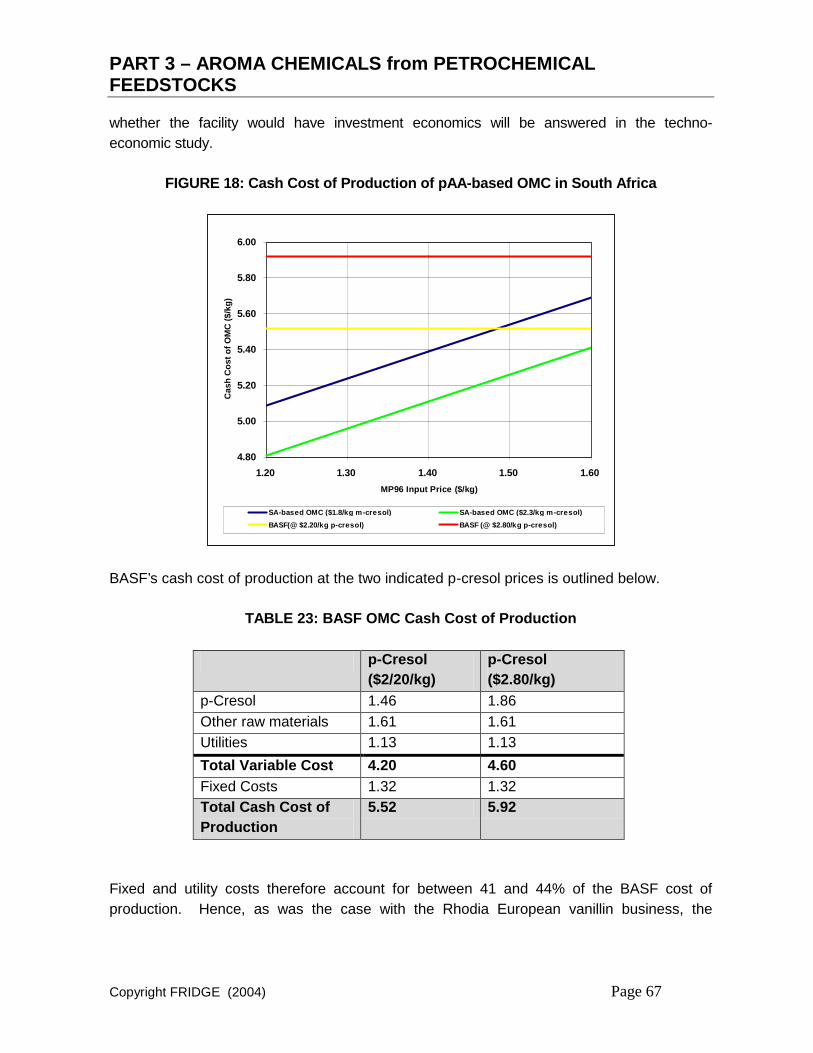
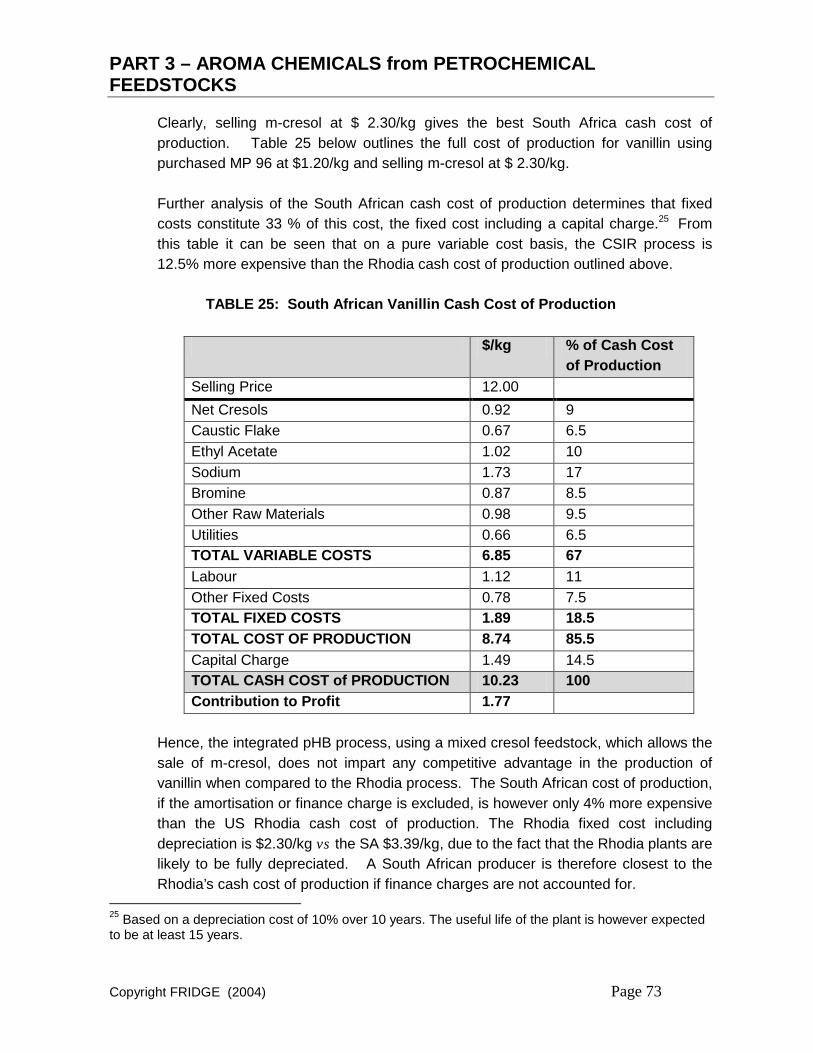
PART 3 – AROMA CHEMICALS from PETROCHEMICAL FEEDSTOCKS
This Report has been divided into four separate Parts. Each Part is self-contained and self-explanatory.
Part One- Executive Summary Part Two- Report: Aroma Chemicals Derived from Effluent from the Paper and Pulp Industry Part Three- Report: Aroma Chemicals Derived from Petrochemical Feedstocks Part Four - Report: Aroma Chemicals Derived from Essential Oils NOTE: This Study was conducted for and on behalf of FRIDGE. FRIDGE holds the copyright in this report. Whilst care and due diligence has been observed to ensure the accuracy of all information contained herein and the correctness of all conclusions drawn, neither FRIDGE nor the Consultants shall be liable for any harm suffered by any person who relies upon the contents of this report.
PART 3 – AROMA CHEMICALS from PETROCHEMICAL FEEDSTOCKS
INDEX
1 OVERVIEW of the AROMA CHEMICAL INDUSTRY......................................... 1
1.1 The South African Chemical Industry......................................................................1
1.2 Overview of the International Flavour and Fragrance Industry ................................6
1.3 The South African Flavour and Fragrance Industry...............................................16
2 PROJECT HISTORY ........................................................................................ 18
3 INDUSTRY and MARKET ANALYSIS ............................................................. 20
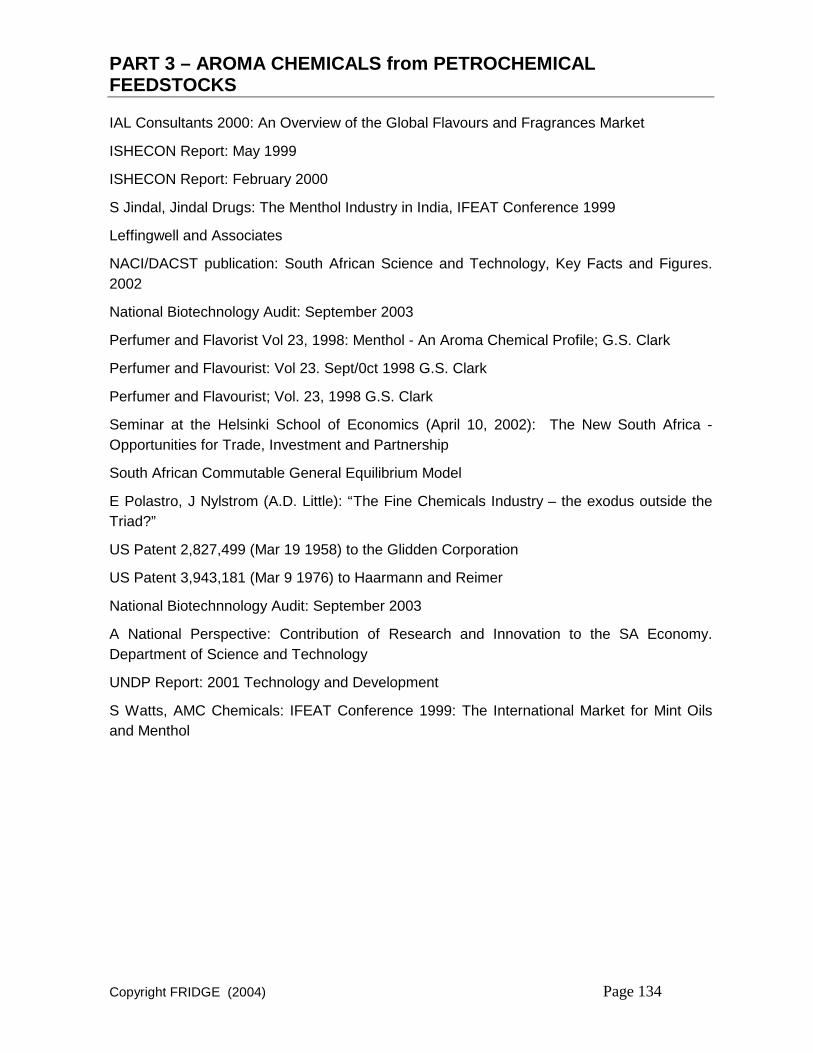
REFERENCES and BIBLIOGRAPHY ................................................................... 133
PART 3 – AROMA CHEMICALS from PETROCHEMICAL FEEDSTOCKS
APPENDICES:
Appendix “1” Value Chain Analysis
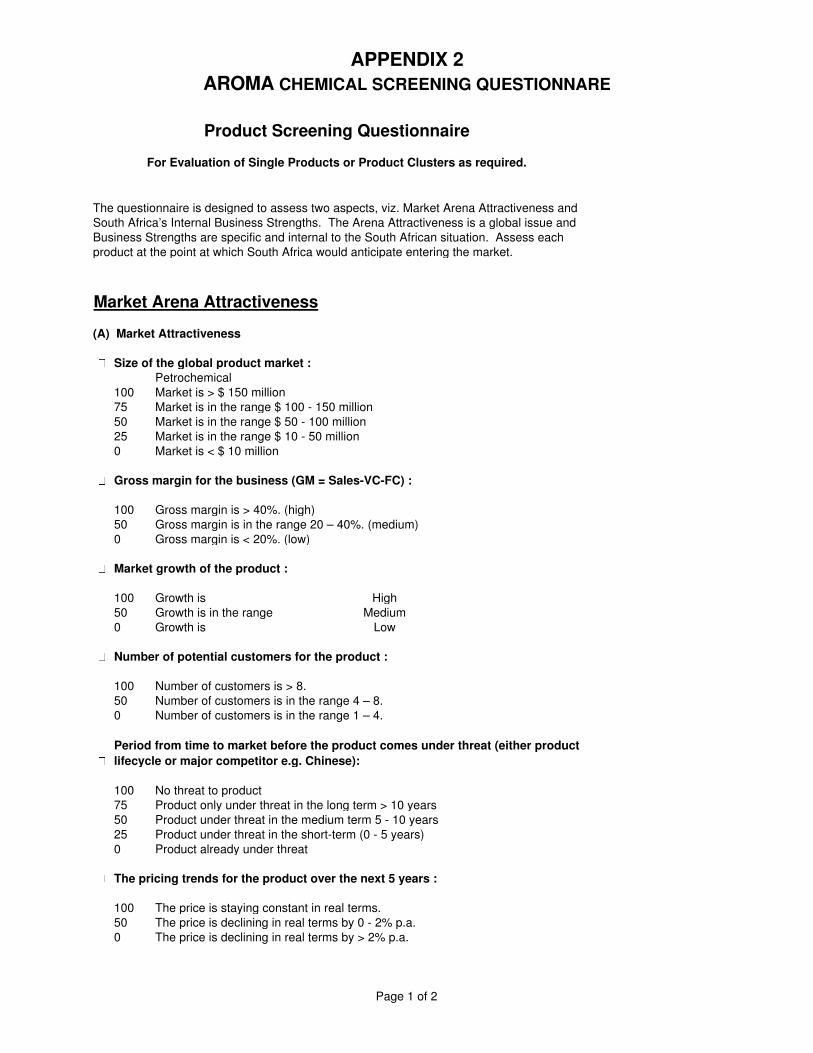
Appendix “2” Petrochemical Aroma Chemical Screening Questionnaire
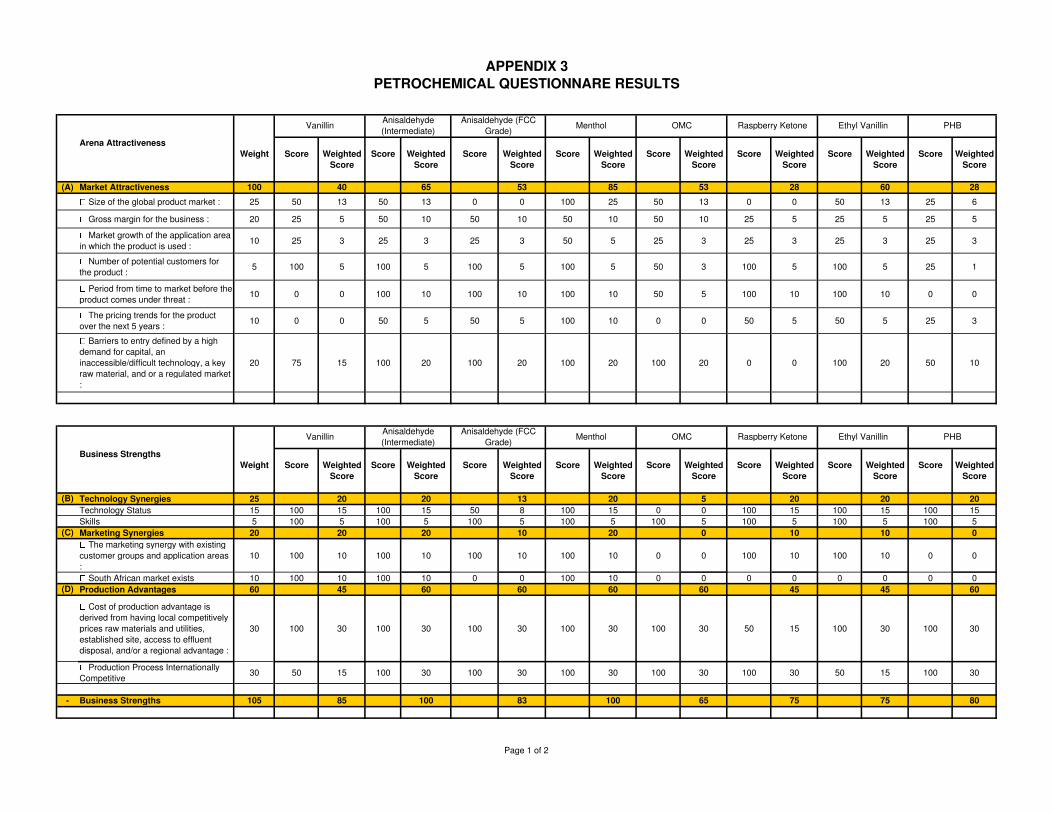
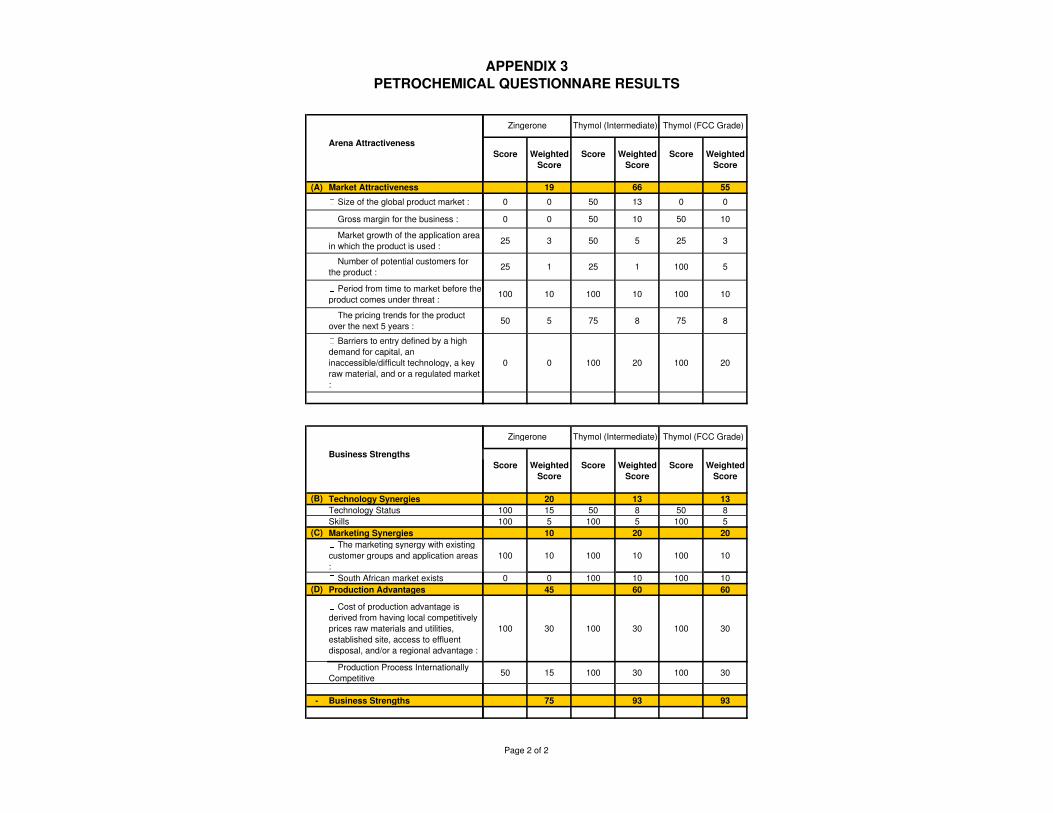
Appendix “3” Petrochemical Aroma Chemical Screening Results
Appendix “4” Petrochemical Aroma Chemical Screening Results Graph
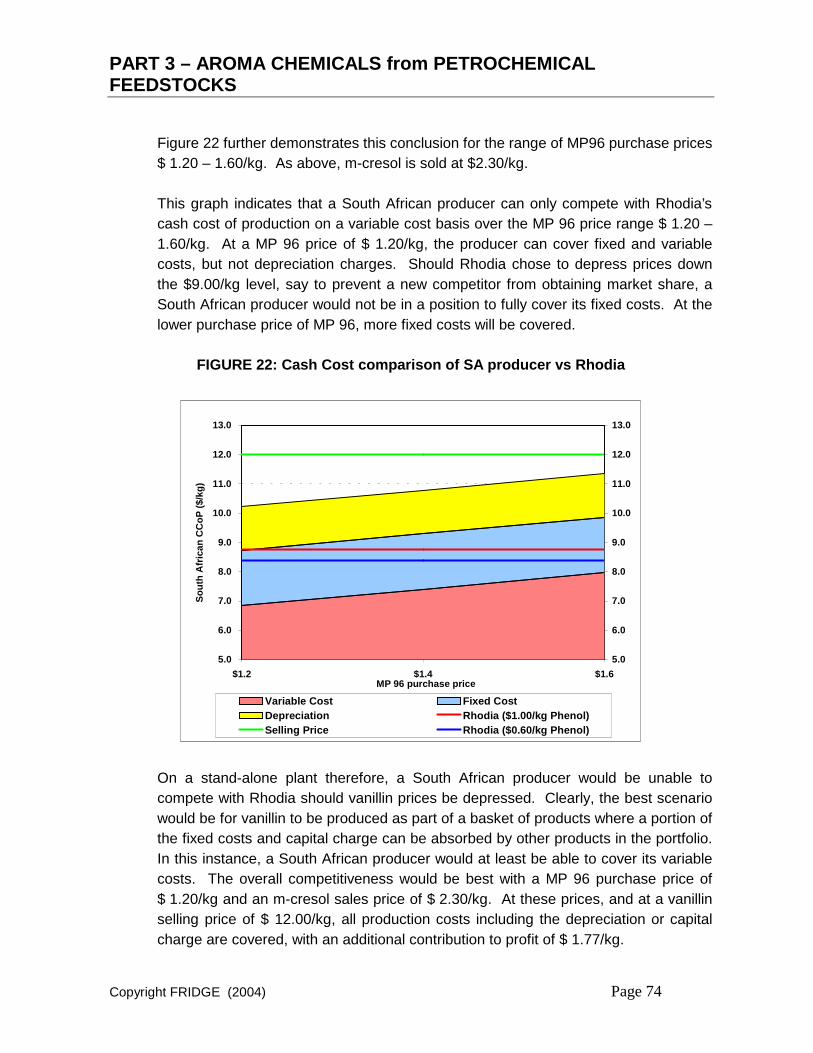
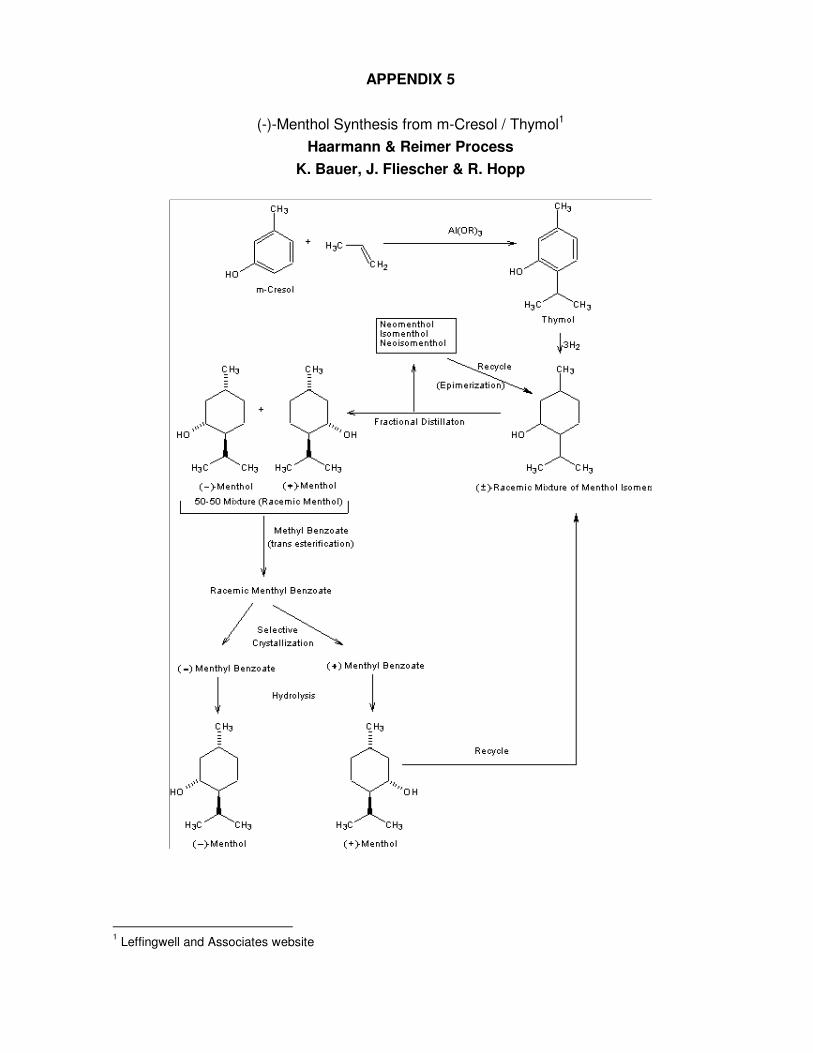
Appendix “5” Haarmann & Reimer (Symrise) Menthol Process
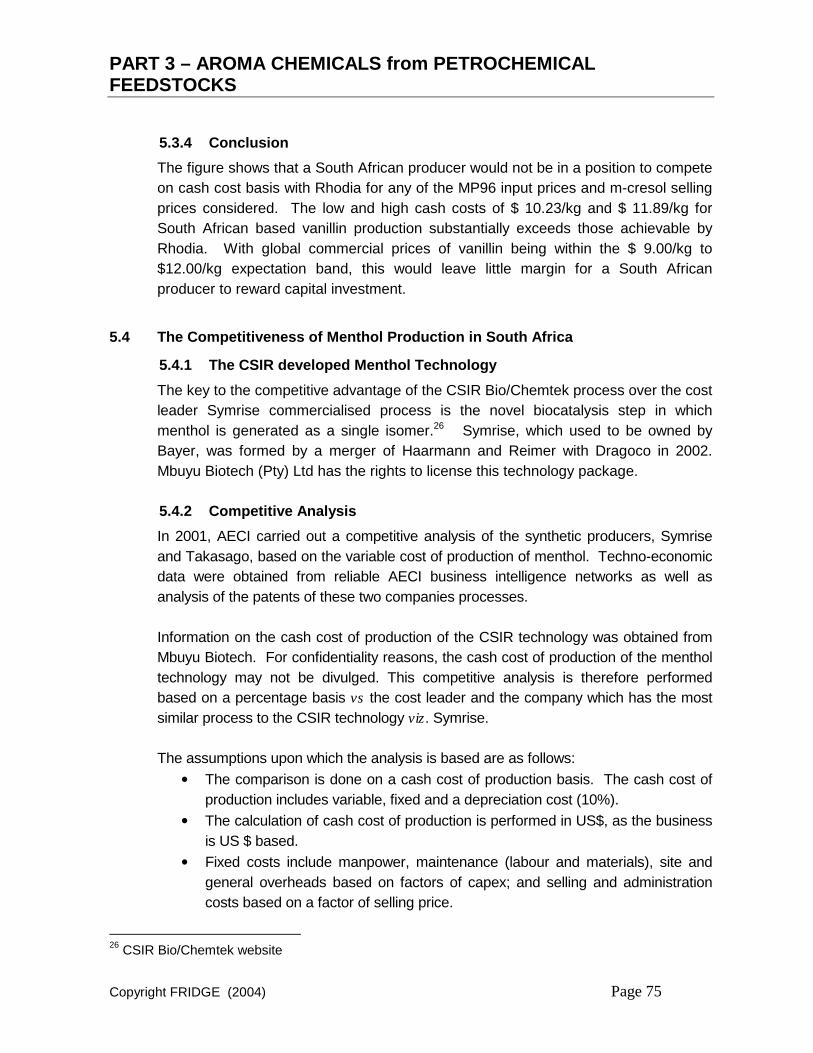
Appendix “6” Mbuyu Biotech (Pty) Ltd Menthol Process
Appendix “7” Techno-Economic Business Options
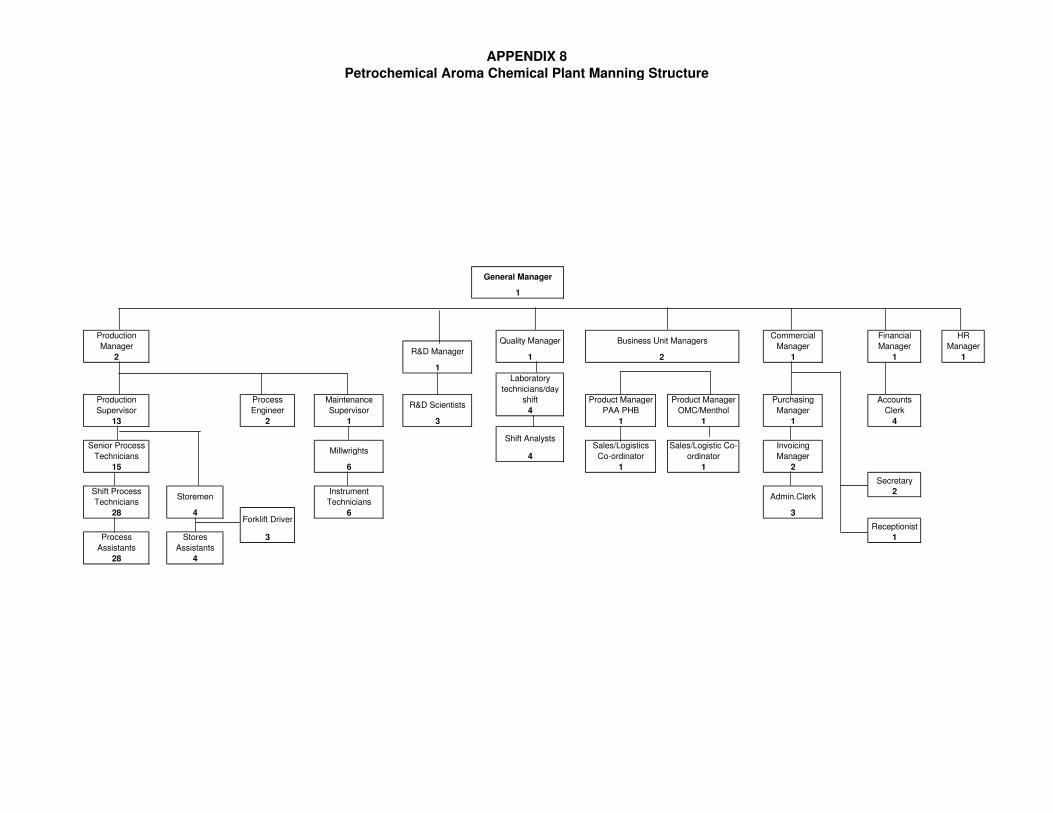
Appendix “8” Petrochemical Aroma Chemical Manning Structure
Appendix “9” World Bank Sectoral Labour/Output Coefficients (2000)
ANNEXURES:
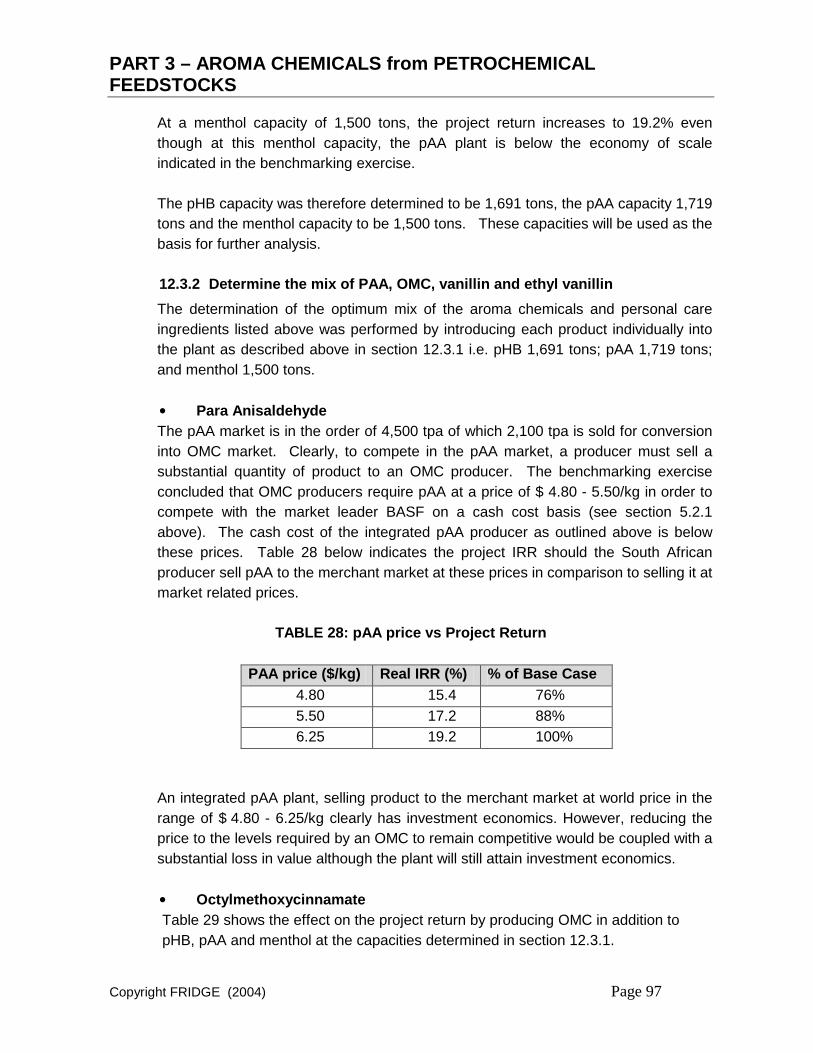
Terms of Reference
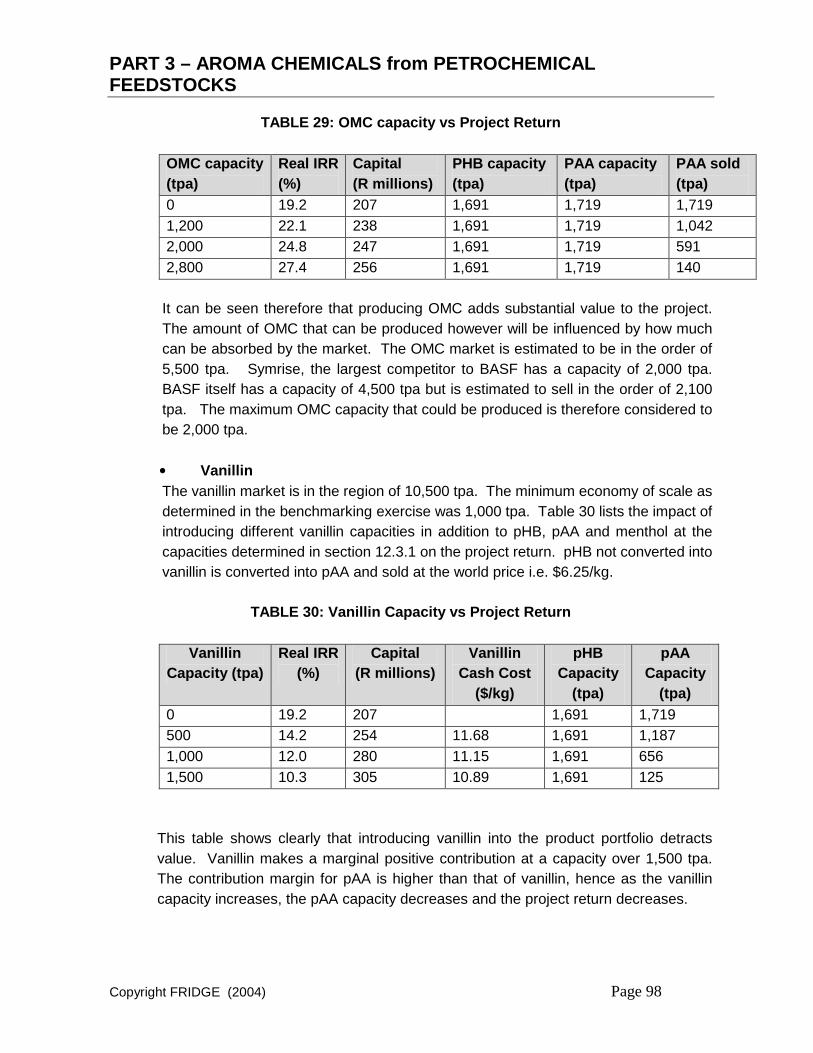
Milestone Decisions During the Study
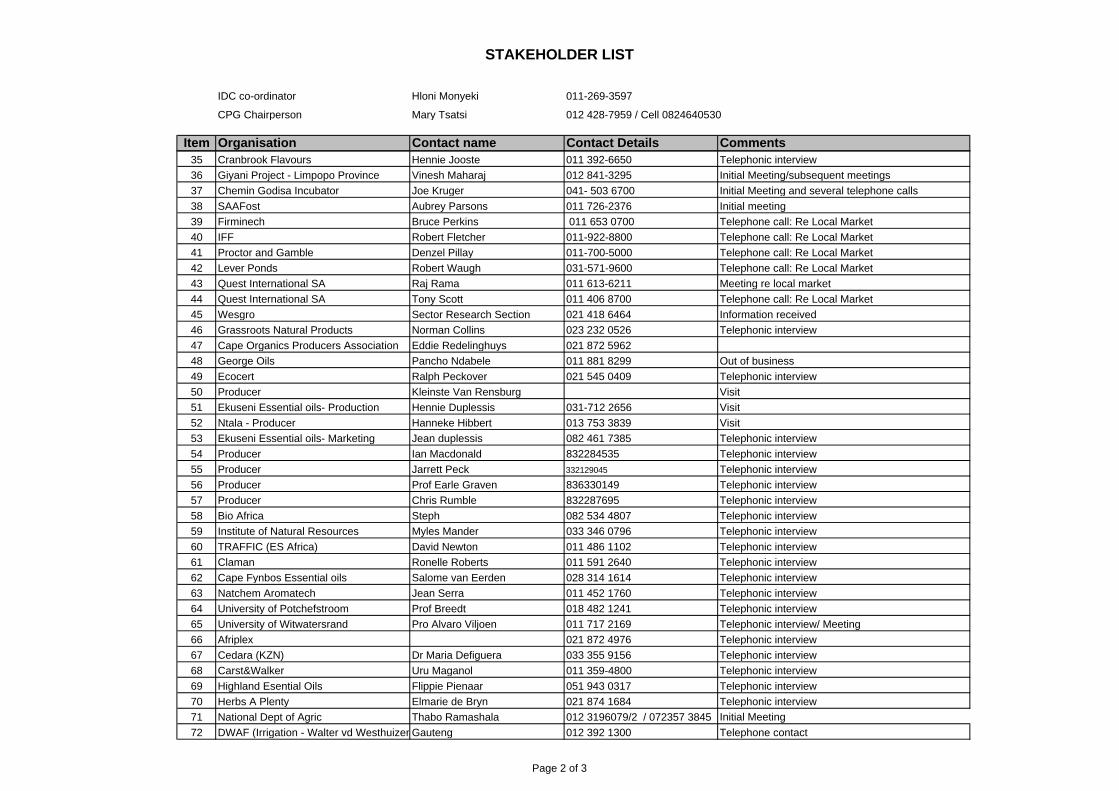
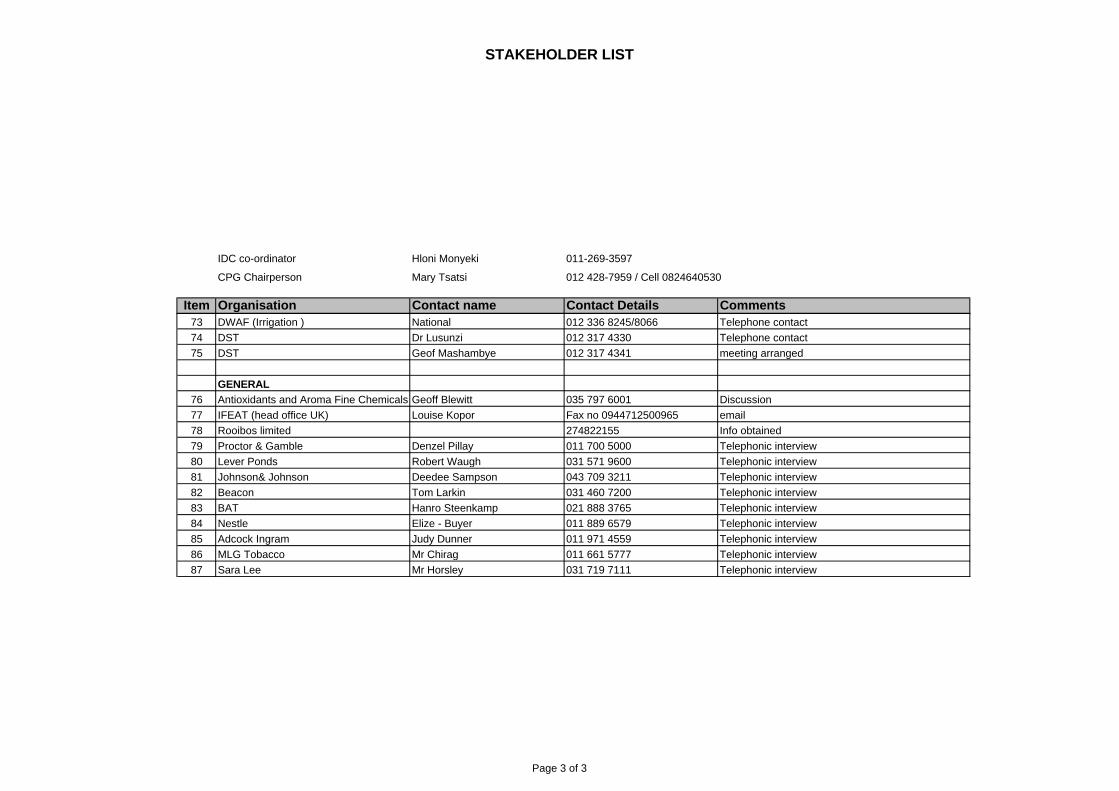
Schedule of Contacts
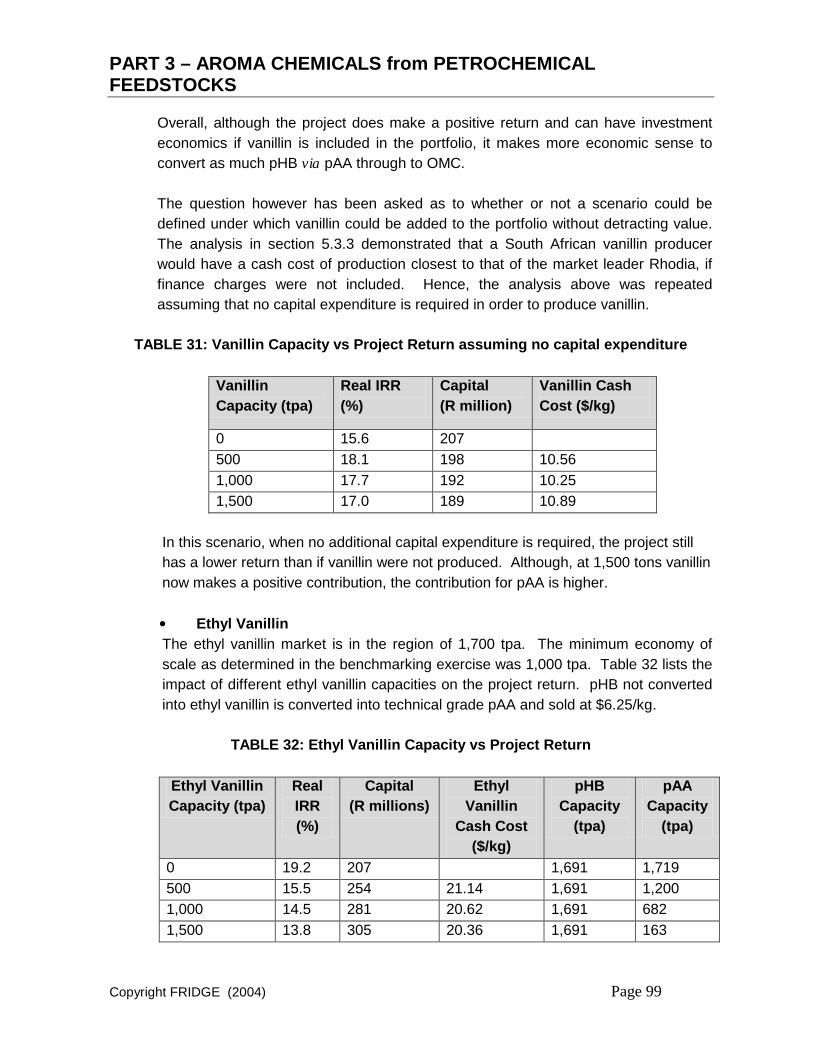
PART 3 – AROMA CHEMICALS from PETROCHEMICAL FEEDSTOCKS
Copyright FRIDGE (2004) Page 1
1 OVERVIEW of the AROMA CHEMICAL INDUSTRY
1.1 The South African Chemical Industry
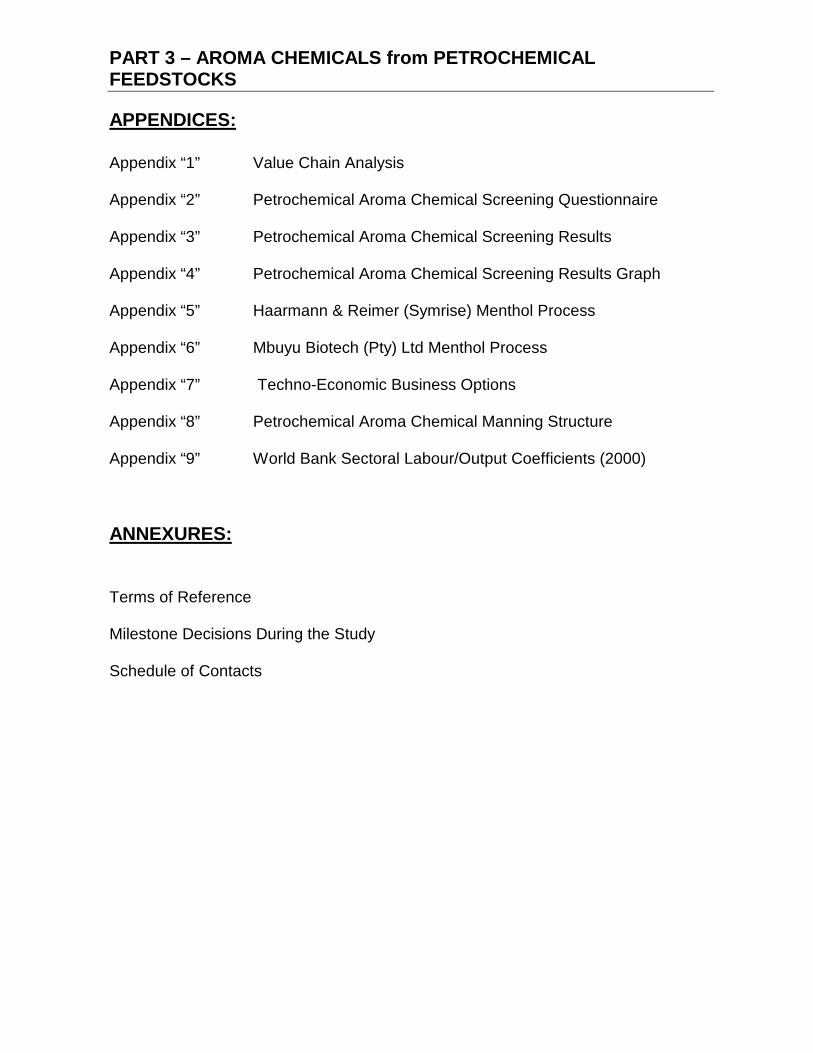
South Africa has the largest economy on the African continent, accounting for 25% of Africa’s GDP. The South African chemical industry is driven by the relatively large South African home market, accounting in many instances for the bulk of sub-Saharan African consumption. The South African chemical industry is of substantial economic significance to the country, contributing around 6% to GDP and approximately 25% of its manufacturing sales. It employs approximately 100,000 people. In 2001, the industry had an output of R 62 billion, exports accounting for R 29 billion, approximately 50% of domestic production.1, 2 The chemical and related industry is import-oriented, with export levels approximately half of import levels. In chemicals alone, 57% of the trade deficit pertained to downstream fine chemicals. The industry, the largest of its kind in Africa, is highly complex and widely diversified, ranging from high volume-low value commodity or bulk chemicals through to high value-low volume, complex and highly specialized products. However, whilst the upstream sector is concentrated and well developed, the downstream sector, although diverse, remains under-developed. Chemical operations in South Africa focus predominantly on basic upstream chemical manufacturing with major production of liquid fuels, olefins, organic solvents and industrial mineral derivatives and downstream formulation and polymer conversion. There are a few major, integrated companies (companies employing more than 150 people) involved mostly in primary and intermediate manufacturing, with small (companies employing less than 50 people) and medium-size (companies employing between 50 and 150 people) enterprises found mainly in downstream formulation and conversion processes. South Africa has historically had a bias towards upstream commodity chemicals production, as a result of its internal need to guarantee a supply of liquid fuels during period of economic sanctions. The industry focus was on the implementation of technology, rather than the development of technology. The commodity chemical sector is therefore well established, whilst the downstream industry remains comparatively underdeveloped, with relatively low levels of scientific and technological skills available. Figure 1 outlines the breakdown of the South African Chemical Industry according to the Department of Trade and Industry. The diagram shows that the Fine Chemicals, Speciality and Functional Chemicals currently only comprise 5% of the chemical sector.
1 Seminar at the Helsinki School of Economics April 10, 2002:The New South Africa: Opportunities for Trade, Investment and Partnership 2 South African Department of Trade and Industry Web-site: Overview of the South African Chemical Industry
PART 3 – AROMA CHEMICALS from PETROCHEMICAL FEEDSTOCKS
Copyright FRIDGE (2004) Page 2
FIGURE 1: The Structure of the South African Chemical Industry ��
The South African chemicals industry is in the midst of turmoil, and is undergoing a massive transformation process, these changes affecting mainly the downstream chemical sector. The restructuring process of large South African chemical companies due to global economic forces has resulted in a reduction in innovation from within the private sector. Research and development undertaken by large South African companies, with the exception of SASOL and some innovative small firms has shown a significant, measurable decline in the past four years. In many cases this results in many technologies being developed overseas. This trend is supported by the recent offshore listings of several large technology-intensive South African companies followed by the tendency for these companies to source research outside South Africa. This process is resulting in a serious depletion of strategic skills in South Africa. Research and Development expenditure has been declining in the last 5 years, with South Africa undertaking only approximately 0.5% of global research. The percentage of the South African gross national product spent on research and development has declined from 1,1% in 1990 to its current level of around 0,7%. This is compared to the average OECD country, where expenditure is 2,15% of GDP; with at least 30% of Research and Development 3 South African Department of Trade and Industry Web-site
PART 3 – AROMA CHEMICALS from PETROCHEMICAL FEEDSTOCKS
Copyright FRIDGE (2004) Page 3
spending in large integrated developed economies made by the government. Currently, there is less than one researcher for every thousand members of the workforce, as compared with five in Australia and ten in Japan.4 Globally, the sector is knowledge-intensive and technology-intensive. However, South Africa does not conform to these trends, as evidenced by the indicators for value added per employee and wages, being substantially below international best practice. South Africa is a net importer of technology, and is generally recognized as being successful as a technology adapter and extender. The implementation rather than the development of technology has been a focus of South African industries and economic growth based on local innovation is low. A key feature of the South African terrain is therefore that, whereas South Africa both exports and imports technology, it rarely takes its own technologies through the complete development cycle. There is evidence of good technologies that are lost or not commercialized due to a lack of innovation resources. This phenomenon has lead to the so-called “Innovation Chasm”. This is an innovation gap that exists between the knowledge generators and the market and has never been addressed strategically. This feature is depicted in a diagram below.5
FIGURE 2: South Africa – “The Innovation Chasm”
LocalResearch
Research Development Manufacturing
Local Industry &Industrial Products
OVERSEAS TECHNOLOGY SOURCESResearch Development Production
Technology
Transfer
$
Innovation “Chasm”LocalResearch
Research Development Manufacturing
Local Industry &Industrial Products
OVERSEAS TECHNOLOGY SOURCESResearch Development Production
Technology
Transfer
$
Innovation “Chasm”
4 UNDP Report: 2001 Technology and Development 5 A National Perspective: Contribution of Research and Innovation to the SA Economy. (Department of Science and Technology )
PART 3 – AROMA CHEMICALS from PETROCHEMICAL FEEDSTOCKS
Copyright FRIDGE (2004) Page 4
High population growth constantly exceeds the growth in employment demands. This is compounded by the consistent loss of jobs in the formal sector, as the country’s economy moves away from labour-intensive to capital-intensive operations. The labour market is characterized by an oversupply of unskilled workers and a shortage of skilled ones. Furthermore, in South Africa, the distortion of under development and/or disinvestment in the majority of South Africans has resulted in the skewed skills profiles from a racial perspective and in terms of the ‘soft’ and ‘hard’ qualifications. An overwhelmingly white, male and aging scientific population is not being replaced by younger groupings more representative of the country’s demographics. A study for the Chemical Industries Sector Education and Training Authority, Chieta, has found that while black people are predominantly located in the lower-skill occupational categories, 83% of African employees reported receiving no training relevant to work in the previous year, compared with 46% of white employees.6 A HSRC7 study for the Chieta on the skills needs in the chemical sector in South Africa has indicated that more than two thirds of all the workers in the Chemical Industries Sector are black, but that many top-level decision makers (financial, managing, and related senior management positions) and technically qualified posts (chemical, production, and process engineers etc.) are predominately filled by white males. The average age of workers at all occupational levels, except for that of operators, seems to be increasing, which makes the training of replacements an urgent matter. The fact that employers in the Chemical Industries Sector experience difficulty in recruiting new staff at the managerial, professional and technician level, especially affirmative action candidates, can be ascribed to the low output of graduates in the natural sciences. This is indicated by the fact that South Africa produces about 10 times fewer scientists and engineers compared to typical first-world countries. Figures from the Department of Science and Technology state that only 3.9% of approximately 490,000 learners who wrote Matric exams in 2000 passed mathematics on the higher grade, and 4.7% passed science on the higher grade. The continual plea for access to expatriate skills and capacity by the industry is backed up by statistics that show there are insufficient locally based professionals to meet the demands of the sector in the short term. South African ageing and shrinking human resources in science and technology are not being adequately developed and renewed and the number of A-rated scientists is declining annually. In 1998, 45% of all scientific publications were by authors over the age of 50. This
6 Chieta Report: “A Demographic Profile of the Workforce in the Chemical Industries Sector and Sub-sectors” May 2002 7 HSRC Chieta Report “Skills Needs by the Chemical Industries Sector in South Africa” December 2003
PART 3 – AROMA CHEMICALS from PETROCHEMICAL FEEDSTOCKS
Copyright FRIDGE (2004) Page 5
is further compounded by the emigration of senior and junior scientists to further their careers in countries with a more competitive research environment. Innovations, patents and technology transfer are not sufficiently rewarded as core tasks of academics and researchers at academic institutions.8 This focus is reflected in the relatively low number of patents per South African scientist. Start-ups are derived at a low level of 2 per 100 patents in South Africa, vs the international norm of 10 to 15 start-ups for every 100 patents.9 Over the last 5 years, the chemical sector has nevertheless increased employment by 2.1% per annum and achieved an annual average value-added growth rate of some 5.1%.10 South Africa’s performance in mathematics and science seems to be reaching a turning point and inequalities are gradually being eliminated. Although there has been some progress in developing black managers in the science and technology system there are still far too few black researchers. The percentage of university graduates (of all population groups) in the natural sciences has returned to the 1985 level. The future prospects of the chemical industry will depend on an appropriate skills development and retention strategy. The South African government has adopted a proactive approach to many of the fundamental issues affecting the country. One of these is the investment in, and management of, human capital development in order to strengthen the transformation of its science and technology capacity. The chemical sector can therefore be seen as a critical industry from which to advance South Africa’s social economic development objectives. Stimulating the growth of a globally competitive and sustainable aroma and fine chemicals value chain can be seen as a means of developing the Fine Chemical, Speciality and Functional Chemicals sub-sectors and addressing the strategic imperatives discussed above that confront the growth of chemical industry as a whole. The findings enumerated in this report would suggest that by South Africa supporting an investment in an Aroma and Fine Chemicals cluster based on the portfolio of products indicated, the downstream sector would benefit positively and would help to bridge the innovation gap identified in the national research and development strategy for South Africa.
8 Draft Emerging Biotechnology Roadmap: Department of Science and Technology: November 2003 9 National Biotechnology Audit: September 2003 10 Chemicals SA 2003: South Africa’s Petrochemical Industry – Globalisation, Restructuring, and Government Policies
PART 3 – AROMA CHEMICALS from PETROCHEMICAL FEEDSTOCKS
Copyright FRIDGE (2004) Page 6
1.2 Overview of the International Flavour and Fragrance Industry
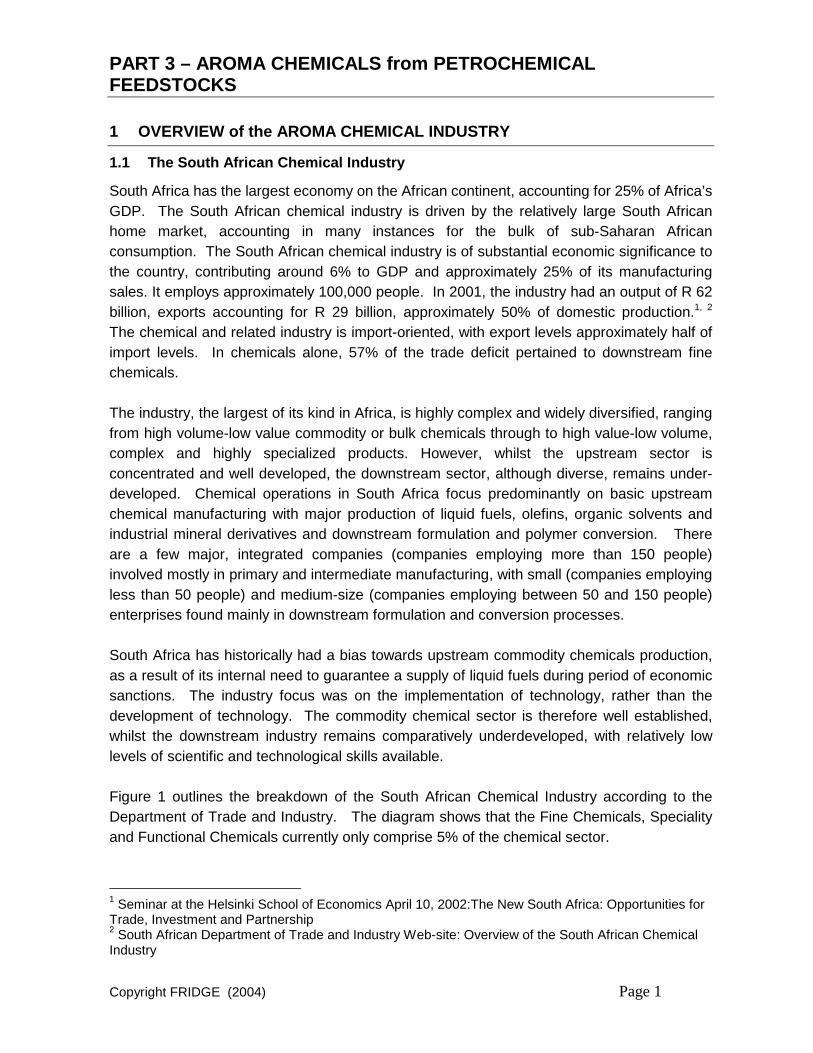
This section of the report provides an outline of the Flavour and Fragrance industry in a global context. It also serves to describe the position held by aroma chemicals and essential oils in this market. Flavour and fragrance formulations are widely used globally for enhancing, among others, foods, beverages, detergents and pharmaceutical products. Compounded flavour and fragrances are thus complex blends designed to impart either an attractive taste and aroma to processed foods and beverages, or a pleasing scent to consumer products such as perfumes, toiletries, household cleaners etc. The formulations may contain aroma chemicals as well as essential oils and natural extracts. The formulation will also contain solvents, diluents and carriers. Figures 3 and 4 outline the breakdown of the use of flavour and fragrance compositions in the end-markets. 11
FIGURE 3: Flavours End-Use Market
Beverages33%
Dairy products13%
Bakery products10%
Savory, convenience
foods10%
Confectionery9%
Meat8%
Others5%
Snacks5%
Oral hygiene /pharmaceutical
7%
Others: Animal feed, tobacco, etc.
It is interesting to note that the major use in the flavour market is in beverages. In the fragrance end-use market, over 50% is used in two applications i.e. soaps/detergents and cosmetics/toiletries. These end-use markets are characteristically first-world markets. This is supported by the global consumption usages for flavour and fragrances, which show that 11 Chemical and Engineering News: July 14, 2003
PART 3 – AROMA CHEMICALS from PETROCHEMICAL FEEDSTOCKS
Copyright FRIDGE (2004) Page 7
the USA accounts for 31% of the market, with Western Europe representing about 29% of the world market and Japan 12%.12 The rest of the market lies in developing countries with high growth rates and potential, as use of the consumer products in these particular major end-use markets increase. The South African market in 1999 was worth a total of $ 107.3 million. Flavours were the largest application of $ 56.7 million.13
FIGURE 4: Fragrances End-Use Market
Soaps and detergents
34%
Fine fragrances
21%
Household products
15%
Others 5%
Cosmetics and toiletries
25%Others: Candles, aromatherapy, pesticides etc.
In 2002, the worldwide flavour and fragrance business, including sales of compounded flavour and fragrance products, aroma chemicals as well as essential oils and natural extracts, was valued at an estimated $ 15.1 billion. 14 The industry is segmented broadly into three areas:
1. Isolation of synthetic and natural aroma chemicals or essential oils/natural products. (Aroma Chemicals are single, chemically defined substances which act on the senses of smell and taste; and essential oils are naturally occurring, volatile products obtained from various parts of plants.)
2. Compounding of these products into formulations tailored to meet specific customer requirements
3. The sale and use of these formulations in the production of personal care and pharmaceutical active ingredients, food and beverage markets etc.
12 Chemical and Engineering News: July 14, 2003 13 IAL Consultants: 2000 Data; C&EN July 2003; IAL Data 2001 14 Leffingwell and Associates
PART 3 – AROMA CHEMICALS from PETROCHEMICAL FEEDSTOCKS
Copyright FRIDGE (2004) Page 8
This flavour and fragrance value chain is represented in Figure 5. This report uses the term “Flavour and Fragrance industry” to encompass this full value chain.
FIGURE 5: Flavour and Fragrance Industry Value Chain
- Resinoids
- Oleoresins
- Essential oils
Source: Leffingwell and Associates
Synthesis
Natural Raw
Materials
Primary Processing
Manufacturing ProcessAroma and Fine Chemical Value Chain
- etc.
- Toiletries
- Foods
- Cosmetics
Further synthetic
modification
Secondary Beneficiation
Flavour and Fragrance Value Chain
Chemicals
Step 1 Step 2 Step 3
Compounding/ Blending
Sale into End-Use Markets
Flavour/ Perfume
Essences
Compounded Flavours
and Fragrances
Aroma Chemicals
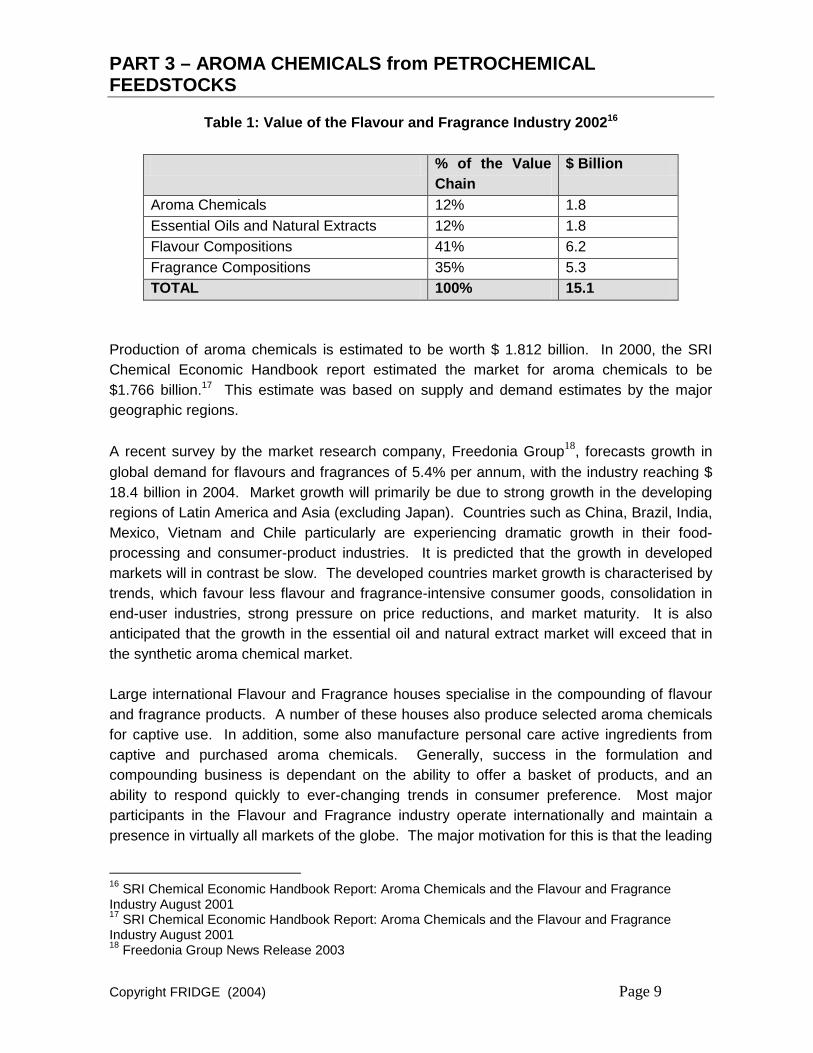
Table 1 illustrates the contribution of the various components of this value chain.15 It is worth noting that over 75 % of the industry’s value lies in the composition of the flavours and fragrances.
15 Chemical and Engineering News Estimates May 2002/Leffingwell and Associates
PART 3 – AROMA CHEMICALS from PETROCHEMICAL FEEDSTOCKS
Copyright FRIDGE (2004) Page 9
Table 1: Value of the Flavour and Fragrance Industry 200216
Production of aroma chemicals is estimated to be worth $ 1.812 billion. In 2000, the SRI Chemical Economic Handbook report estimated the market for aroma chemicals to be $1.766 billion.17 This estimate was based on supply and demand estimates by the major geographic regions. A recent survey by the market research company, Freedonia Group18, forecasts growth in global demand for flavours and fragrances of 5.4% per annum, with the industry reaching $ 18.4 billion in 2004. Market growth will primarily be due to strong growth in the developing regions of Latin America and Asia (excluding Japan). Countries such as China, Brazil, India, Mexico, Vietnam and Chile particularly are experiencing dramatic growth in their food-processing and consumer-product industries. It is predicted that the growth in developed markets will in contrast be slow. The developed countries market growth is characterised by trends, which favour less flavour and fragrance-intensive consumer goods, consolidation in end-user industries, strong pressure on price reductions, and market maturity. It is also anticipated that the growth in the essential oil and natural extract market will exceed that in the synthetic aroma chemical market. Large international Flavour and Fragrance houses specialise in the compounding of flavour and fragrance products. A number of these houses also produce selected aroma chemicals for captive use. In addition, some also manufacture personal care active ingredients from captive and purchased aroma chemicals. Generally, success in the formulation and compounding business is dependant on the ability to offer a basket of products, and an ability to respond quickly to ever-changing trends in consumer preference. Most major participants in the Flavour and Fragrance industry operate internationally and maintain a presence in virtually all markets of the globe. The major motivation for this is that the leading
16 SRI Chemical Economic Handbook Report: Aroma Chemicals and the Flavour and Fragrance Industry August 2001 17 SRI Chemical Economic Handbook Report: Aroma Chemicals and the Flavour and Fragrance Industry August 2001 18 Freedonia Group News Release 2003
PART 3 – AROMA CHEMICALS from PETROCHEMICAL FEEDSTOCKS
Copyright FRIDGE (2004) Page 10
Flavour and Fragrance houses are following key end users such as food processors and detergent producers to these regions. China, Brazil, and Mexico have as a result seen a strong growth in production. Over recent years there has been a large amount of rationalisation and consolidation within the industry and this process is likely to continue. It has been estimated that there are over 1,000 companies active in this industry worldwide, but 12 international flavour and fragrance companies hold over 65% market share. One major reason for this is that of the cost of owning an adequate infrastructure, which includes the cost of toxicological testing, research and development, quality control, and efficient manufacturing and marketing, is so high that only the largest of companies can afford it. The costs associated with these activities also explain the reason for the high value associated with this segment of the market. Table 2 outlines the top 12 companies in 2002. 19 It is noticeable that the top 6 participants have sales over $ 800 million. The next tier has sales in the region of $ 200 to 400 million. Below this level, the industry is highly fragmented with a host of much smaller players. A recent report from SRI International comments that there is a “virtual absence of medium-sized participants” with sales in the region of $ 75 to $ 100 million.
Table 2: Estimated Sales Volume Flavour and Fragrance Companies 2002
Company Country $ million Market Share Givaudan Switzerland 1,933 12.8% IFF USA 1,809 12.0% Firminech Switzerland 1,373 9.1% Symrise Germany 1,300 8.6% Quest International UK 1,153 7.6% Takasago Japan 850 5.6% Sensient Technologies USA 423 2.8% T.Hasagawa Japan 381 2.5% Mane SA France 270 1.8% Danisco Denmark 263 1.75 Degussa Flavours Germany 234 1.5% Robertet France 218 1.4% TOTAL TOP 12 COMPANIES 10,206 68% Others 4,894 32% TOTAL 15,100 100%
19 Leffingwell and Associates
PART 3 – AROMA CHEMICALS from PETROCHEMICAL FEEDSTOCKS
Copyright FRIDGE (2004) Page 11
There are a number of reasons for this consolidation. A major reason has been the pressure on prices. As outlined above, the major market is USA followed by Europe and Japan. In the USA the advent and power of the supermarket chains has placed pressure on consumer product manufacturers to drop costs in order to be given “shelf space”. This has lead to consolidation amongst consumer product manufacturers. These manufacturers in turn have pressurized the Flavour and Fragrance houses (which once commanded huge margins) to reduce prices. The Flavour and Fragrance industry is thus reacting to the concentration of its customer base. In addition, end-users have found it too costly to deal with too many Flavour and Fragrance houses, and accordingly only deal with the largest few. If the Flavour and Fragrance house is not strong in all markets it cannot keep the custom of a larger customer such as a Unilever or Proctor and Gamble. Thus growth in turnover by the Flavour and Fragrance houses has come primarily from acquisitions with the company profiting from economies of scale. A further reason for the consolidation has arisen from major chemical companies wanting to stick to core business of high volume manufacturing. As a result, many of them have sold their Flavour and Fragrance divisions to previous competitors. Recent examples are Bayer, which used to own Haarmann & Reimer, which was merged with Dragoco forming Symrise in 2002. In 2000, Roche spun off Givaudan. The only chemical company still with a Flavour and Fragrance house is ICI with Quest International. The smaller and medium sized companies active in the Flavour and Fragrance industry have survived by concentrating on their specialist knowledge within a niche market and offering services and products that the industry giants don’t offer. An example of this is Treatt plc, based in the United Kingdom. This company acts as a one-stop shop for the Flavour and Fragrance industry in Europe, but not in the US. Fine chemical companies are increasingly forging partnerships with Flavour and Fragrance customers through joint projects and special services, and are becoming indispensable partners of the Flavour and Fragrance industry. Rhodia is an example of this trend, producing natural vanillin under license from Givaudan who could not justify operating the process on its requirements alone. Fine chemical companies can develop new compounds at a smaller scale or offer process improvements to customers losing patent protection. The proposed portfolio of the petrochemical suite of products was designed to position AECI in this segment of the market.
1.2.1 Aroma Chemicals
Aroma Chemicals can be manufactured via a number of different routes:
1. True synthetic chemicals: This includes chemicals produced by synthesis from both natural aromatic compounds and from synthetic feedstocks e.g. petrochemicals.
PART 3 – AROMA CHEMICALS from PETROCHEMICAL FEEDSTOCKS
Copyright FRIDGE (2004) Page 12
2. True Isolates: Single aroma chemicals, which are extracted from natural
materials and subjected only to further processes of purification. These include the following: anethole, camphor, citral, eugenol, and menthol.
3. Chemically modified derivates: Made by converting isolated products into a
different chemical by subjecting them to various chemical processes. This includes the crude sulphonated turpentine derived aroma chemicals such as citral, geraniol and linalool. Crude sulphonated turpentine is a by-product of the Kraft paper pulping process. It also includes vanillin produced from lignin, also a by-product of the paper pulping process.
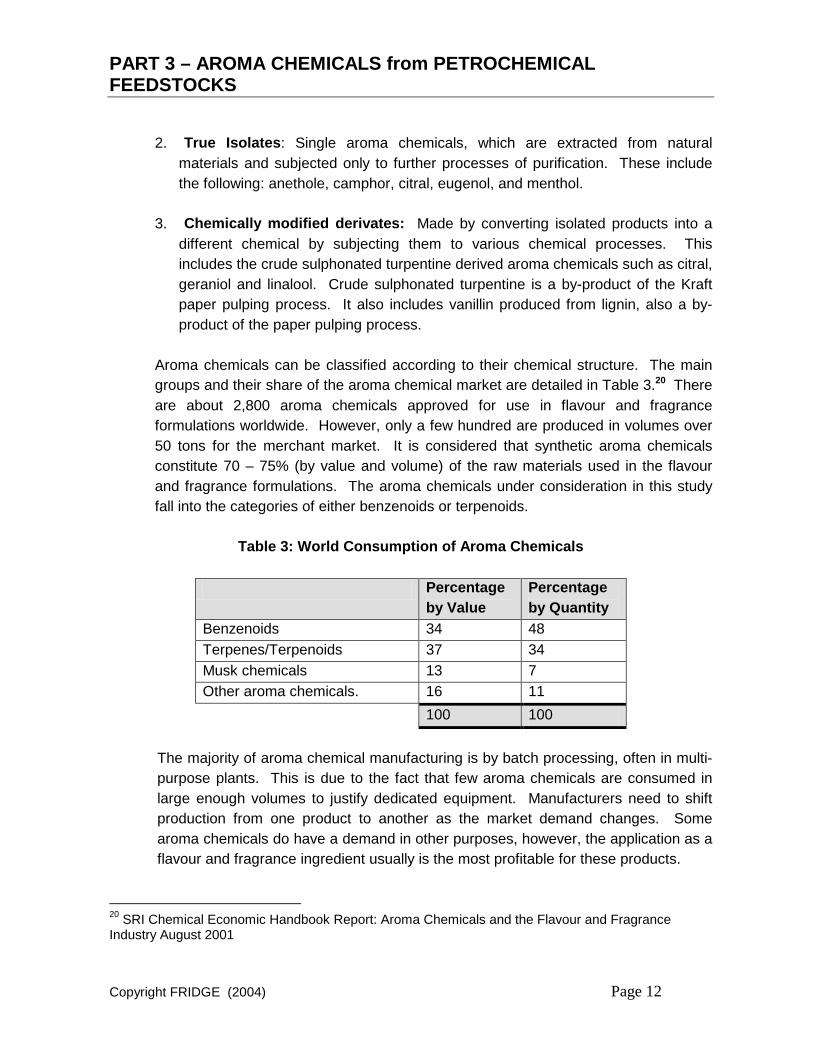
Aroma chemicals can be classified according to their chemical structure. The main groups and their share of the aroma chemical market are detailed in Table 3.20 There are about 2,800 aroma chemicals approved for use in flavour and fragrance formulations worldwide. However, only a few hundred are produced in volumes over 50 tons for the merchant market. It is considered that synthetic aroma chemicals constitute 70 – 75% (by value and volume) of the raw materials used in the flavour and fragrance formulations. The aroma chemicals under consideration in this study fall into the categories of either benzenoids or terpenoids.
The majority of aroma chemical manufacturing is by batch processing, often in multi-purpose plants. This is due to the fact that few aroma chemicals are consumed in large enough volumes to justify dedicated equipment. Manufacturers need to shift production from one product to another as the market demand changes. Some aroma chemicals do have a demand in other purposes, however, the application as a flavour and fragrance ingredient usually is the most profitable for these products.
20 SRI Chemical Economic Handbook Report: Aroma Chemicals and the Flavour and Fragrance Industry August 2001
PART 3 – AROMA CHEMICALS from PETROCHEMICAL FEEDSTOCKS
Copyright FRIDGE (2004) Page 13
Aroma chemicals are generally produced by three different types of companies:
• Flavour and Fragrance Houses: These companies produce the chemicals for their own use in compounds and blends and often also sell them on the merchant market.
• Large Diversified Chemical Companies: These companies manufacture aroma chemicals as a minor component of their overall chemical business by upgrading small amounts of their large-scale chemical production is to flavour and fragrance specifications. Product is sold to formulators or flavour and fragrance houses; the chemical companies do not themselves sell the products into the end consumer markets.
• Medium and small chemical producers: These are companies involved in the synthesis of aroma and other fine chemicals using specialised technical knowledge. (AECI as a producer of a portfolio of fine chemical aroma products would have belonged in this category)
The aroma chemical industry has consistently earned returns in excess of the chemical industry standard. As it is so closely tied to the health, personal care, and food and beverage markets, it is robust, insensitive to commodity cycles, and relatively recession resistant. Success in the production of aroma chemicals is generally characterised by:
• Consistent product quality • An approved organoleptic quality • Long-term customer relationships • Technology driven cost leadership • An ability to research, develop and commercialise aroma chemicals • A robust raw material/feedstock position
PART 3 – AROMA CHEMICALS from PETROCHEMICAL FEEDSTOCKS
Copyright FRIDGE (2004) Page 14
1.2.2 Essential Oils
Essential oils are naturally occurring volatile products obtained from various parts of plants. Essential oils are usually extracted from the plant material by steam distillation, expression, or solvent extraction. Essential oils are distinguished from the fatty vegetable oils, such as canola and sunflower by the fact that they evaporate or volatise in contact with the air and they usually possess a strong aroma (the name comes from "essence"). The amount of oil extractable ranges from an infinitesimal quantity to as much as 1-2% of the dry weight of the plant material distilled. The methods of extraction differ considerably. The sources may be fresh or dried fruit, leaf, bark, root or seed. A typical essential oil is a complex mixture of chemical compounds, each of which possesses its own, individual set of properties. The odour of the oil can be due mainly to one single chemical constituent, or to a mixture of several odoriferous chemical bodies. The chemical constitution of the bodies may not always be known. The major producers of essential oils are Brazil, China, U.S., Egypt, India, Mexico, Guatemala and Indonesia. All of them, with the exception of U.S., are developing countries with very low labour costs. The major consumers are the U.S. (40%), Western Europe (30%) and Japan (7%).
Although the essential oils industry is primarily an agricultural industry, the oils make up an important component of the flavour and fragrance supply chain, alongside synthetic aroma chemicals. Sales of essential oil and other natural extracts were equal in value to those of aroma chemicals in 2002 (estimated US$1.8 billion each). Essential oils are sold into several different markets (foods and beverages, aroma and fragrances in foods, nutraceutical applications, medicinal applications, cosmetics and personal hygiene products). Most naturally derived aroma chemicals have their synthetic counterpart; however there has always been a niche for the natural products. Furthermore, over the last 50 years, the demand for essential oil products from plants has gradually increased because of a number of factors. Demand for flavouring, perfumery, and aromatherapy materials has risen because of the steep rise in the world population and a desire for greater variety in their food by the people of the industrialized countries. The increased concern for the environment and for the safety of food and the general difficulty in manufacturing synthetic alternatives has also contributed to the continued growth in demand for plant based essential oil products. According to the United Nations Trade Statistics, trade in essential oils and related products are growing at roughly 10% per annum whereas the overall flavour and fragrance market is growing at between 4% and 5% per annum.
PART 3 – AROMA CHEMICALS from PETROCHEMICAL FEEDSTOCKS
Copyright FRIDGE (2004) Page 15
The world trade in essential oils may be divided into two components, often referred to as the major and minor oils. With regards to the major oils, these are those oils that are traded in large quantities (but often lower prices). There are approximately 160 essential oils traded globally. The top 10 oils make up some 80% of the world trade in essential oils. The remaining 150 minor essential oils are of higher value but are traded in quantities ranging from a few kilograms per annum to a few hundred tons per annum. Although it is possible to isolate aroma chemicals from essential oils this is only done in respect of the major oils, where the economies of scale allow for the natural isolate to compete with the synthetic counterpart. The competition in the major essential oils is stiff with the low cost producers of Asia and South America dominating (particularly Brazil and China). On the other hand, the minor essential oils are traded and used more or less “as is”. Their attraction is in their complex chemical structure and consequent organoleptic properties they possess. The minor oils are more difficult to produce as they are not produced in “plantations” and neither can they be highly mechanised.
South Africa has a long involvement in the essential oil industry with regards to the production of major essential oils like eucalyptus and citrus oils, supplying some 5% and 2% of the world market. These industries are under pressure form the low cost producers and the strengthening of the Rand. With regards to the higher value minor essential oils (e.g. geranium, chamomile and lavender), South Africa has a fledgling essential oils industry that was pioneered by the CSIR. It is this latter industry that holds potential for growth. Internationally, essential oils form a major component of the flavour and fragrance industry and therefore the development of this industry in South Africa would be complementary to South African Aroma Fine Chemical industry.
PART 3 – AROMA CHEMICALS from PETROCHEMICAL FEEDSTOCKS
Copyright FRIDGE (2004) Page 16
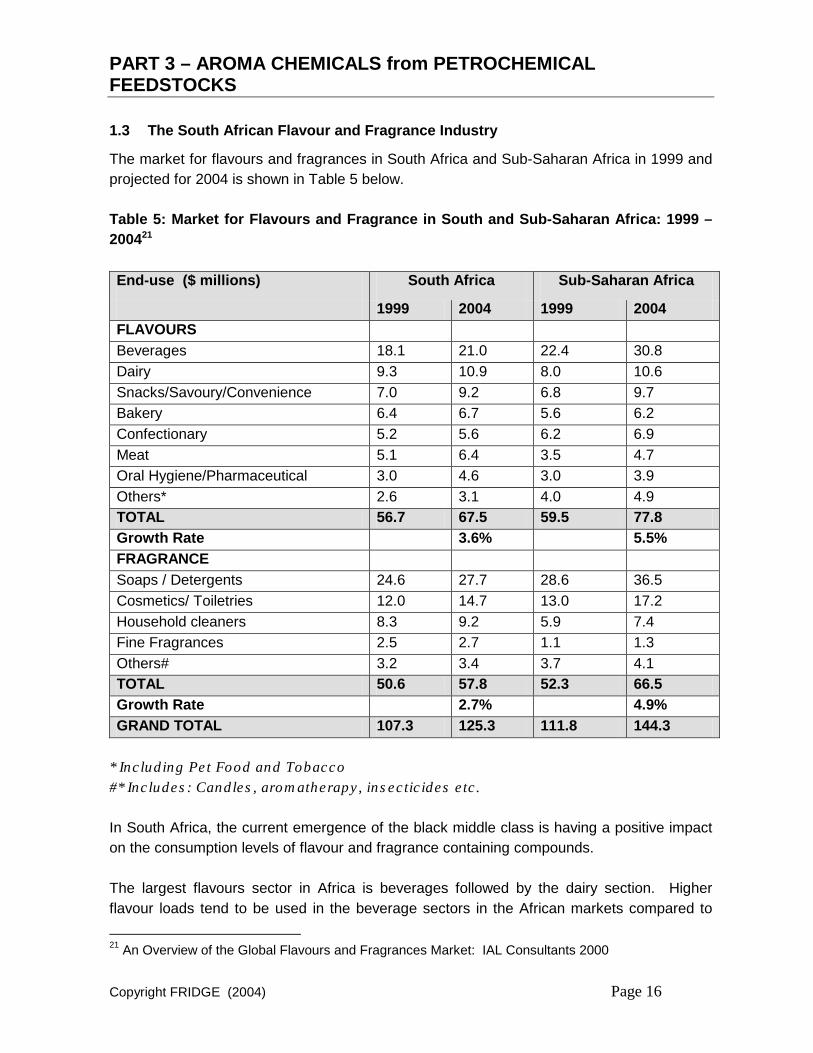
1.3 The South African Flavour and Fragrance Industry
The market for flavours and fragrances in South Africa and Sub-Saharan Africa in 1999 and projected for 2004 is shown in Table 5 below. Table 5: Market for Flavours and Fragrance in South and Sub-Saharan Africa: 1999 – 200421 End-use ($ millions) South Africa Sub-Saharan Africa
* Including Pet Food and Tobacco #* Includes: Candles, aromatherapy, insecticides etc. In South Africa, the current emergence of the black middle class is having a positive impact on the consumption levels of flavour and fragrance containing compounds. The largest flavours sector in Africa is beverages followed by the dairy section. Higher flavour loads tend to be used in the beverage sectors in the African markets compared to
21 An Overview of the Global Flavours and Fragrances Market: IAL Consultants 2000
PART 3 – AROMA CHEMICALS from PETROCHEMICAL FEEDSTOCKS
Copyright FRIDGE (2004) Page 17
more developed markets. For example, in Western Europe, fruit-flavoured soft drinks typically contain 12% fruit juice, reducing the need for added flavour. In the majority of countries in Africa, no fruit juice is used at all. Although South Africa in general has a food culture similar to the rest of Africa its food processing sector is however more sophisticated than in the rest of Sub-Saharan Africa. Within the fragrance sector, the largest use is in soaps and detergents. Within this sector, washing soap is predominant in the less affluent regions, where the use of washing machines is at nominal levels. Many cosmetics and toiletries multinationals have located production facilities in South Africa as a production base for the Sub-Saharan region. The South African total market in 2004 was therefore predicted to be $ 125.3 million. At an exchange rate of R 7/US$ this is equivalent to R 877 million. This figure for the value of the South African Flavour and Fragrance market in 2004 has been confirmed by industry sources. The regional South and Sub-Saharan African market in 2004 was expected to be in the order of $ 279 million or R1,887 million. Growth in the region is anticipated to continue to be strong, the flavours market growing at 4%. Any increase in aroma chemical and essential oil production in South Africa would increase the potential of participating more in the regional Flavour and Fragrance market.
PART 3 – AROMA CHEMICALS from PETROCHEMICAL FEEDSTOCKS
Copyright FRIDGE (2004) Page 18
2 PROJECT HISTORY
Prior to 2001, AECI had a stated strategy of becoming a manufacturer and supplier of niche, higher value-added fine chemicals. Its strategy included transforming and growing the existing fine chemicals companies manufacturing t-butyl hydroquinone and lysine and establishing a new company for the production of aroma chemicals. As part of this strategy certain aroma and flavour fine chemicals were identified to form the basis of a new fine chemicals business to be developed. The two existing businesses for food antioxidants and animal nutrition together with the aroma business would have formed a fine chemicals cluster of critical size. The strategy chosen was to select a basket of aroma chemicals for commercialisation on the following basis:
• Large volume aroma chemicals. • Serving actively growing end-use markets. • Having a low risk of substitution. • Not requiring lengthy and costly registration processes for product approval by
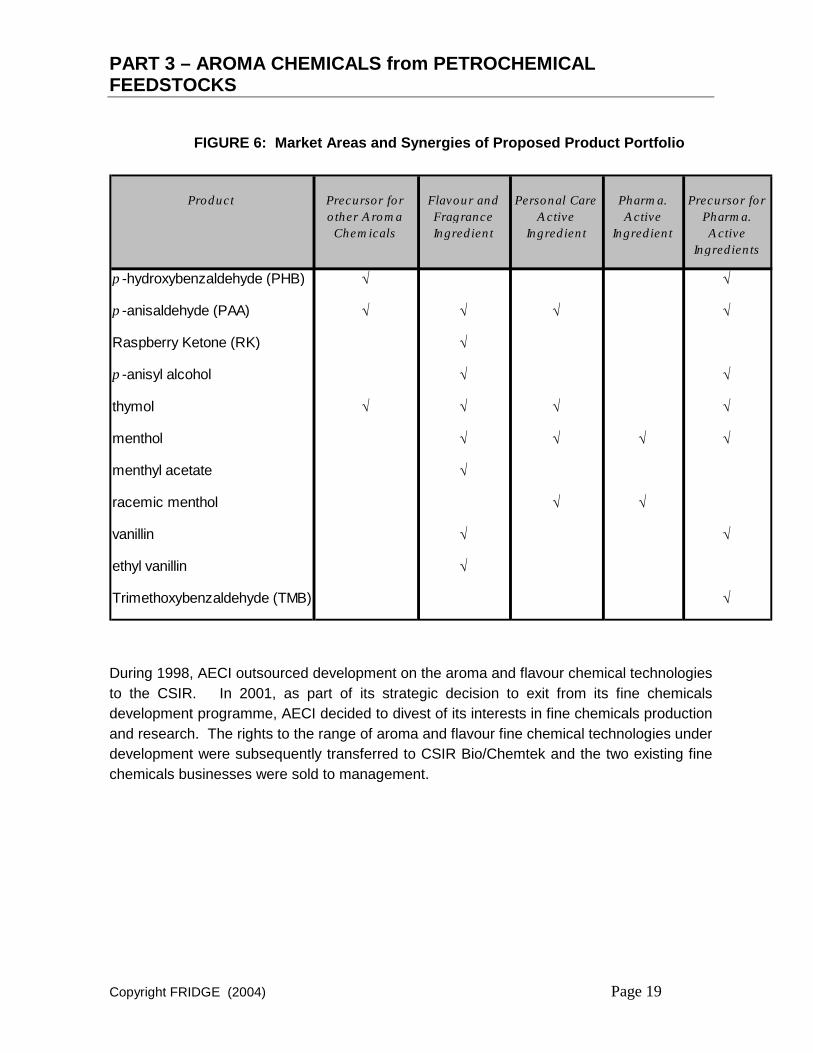
customers and government agencies. Product selection would furthermore be based on the competitive advantage that could be created through an innovative technology and/or an advantageous access to local raw materials. The suite of Aroma and Fine Chemical products chosen for commercialisation was therefore based on the development of a novel and potentially competitive process for the production of p-hydroxybenzaldehyde (pHB) and p-anisaldehyde (pAA). This technology, using a mixed cresol stream as the key feedstock selectively converts p-cresol to pHB, a precursor for a range of other aroma chemicals, in the presence of m-cresol. This feature of the technology gives it a unique business advantage, as a number of commercially available mixtures of p-cresol and m-cresol could be used as feedstock. The separation of p-cresol and m-cresol from these mixtures by traditional means is a costly and capital-intensive process and results in pure isomers that are significantly more expensive than the individual isomers in the mixtures. The products were all viewed as being strongly inter-related in terms of market areas and customers, thereby providing the opportunity to niche a basket of products to selected customers. Figure 6 depicts the products and their market synergies. This is a unique basket of products that would allow the start-up company to offer a number of strategic raw materials to the flavour and fragrance houses and other customers. It was anticipated that implementation of this Aroma Chemicals would provide the new fine chemical company with a competitive and sizeable business, with a turnover expected to grow to more than R500 million within a period of 5-10 years.
PART 3 – AROMA CHEMICALS from PETROCHEMICAL FEEDSTOCKS
Copyright FRIDGE (2004) Page 19
FIGURE 6: Market Areas and Synergies of Proposed Product Portfolio
m-Cresol
Product Precursor for other Aroma Chemicals
Flavour and Fragrance Ingredient
Personal Care Active
Ingredient
Pharma. Active
Ingredient
Precursor for Pharma. Active
Ingredients
p -hydroxybenzaldehyde (PHB) √ √
p -anisaldehyde (PAA) √ √ √ √
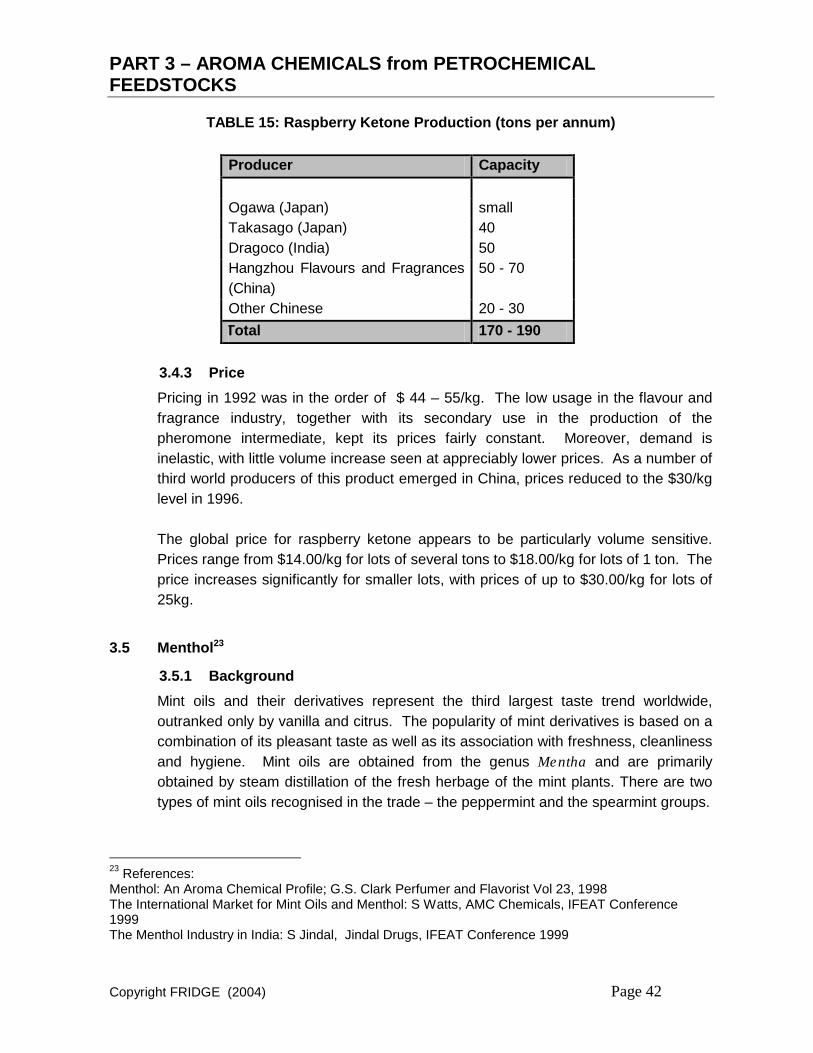
Raspberry Ketone (RK) √
p -anisyl alcohol √ √
thymol √ √ √ √
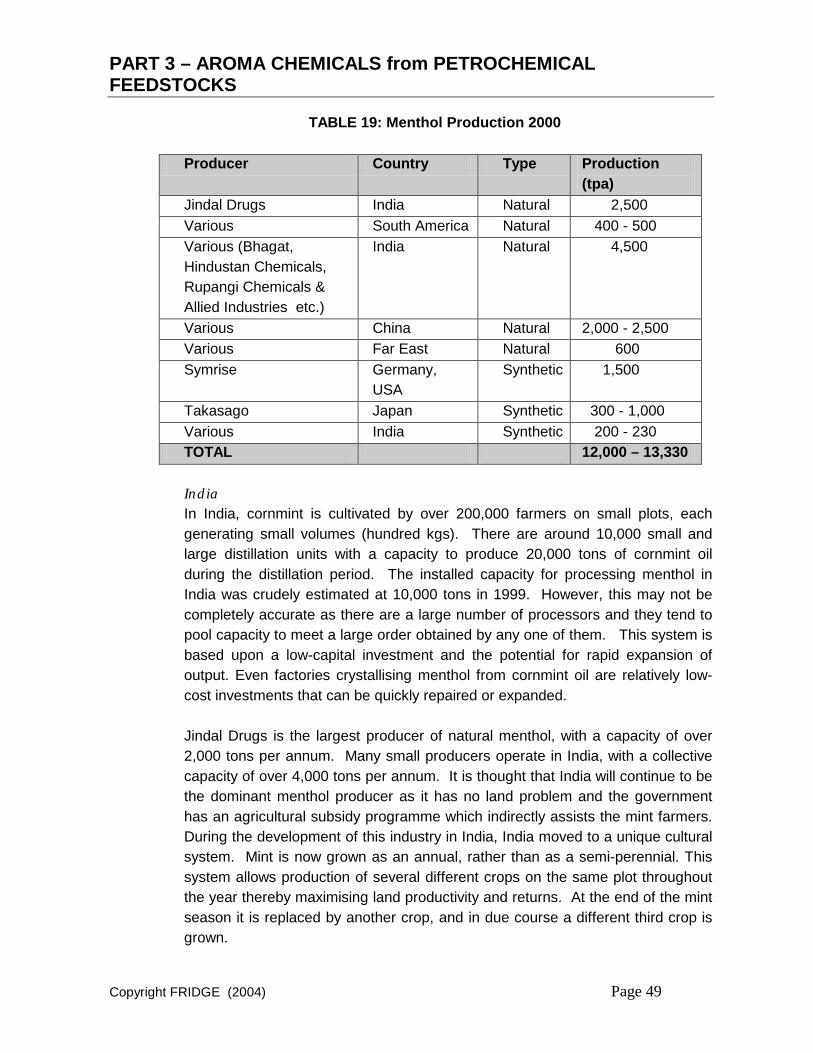
menthol √ √ √ √
menthyl acetate √
racemic menthol √ √
vanillin √ √
ethyl vanillin √
Trimethoxybenzaldehyde (TMB) √
During 1998, AECI outsourced development on the aroma and flavour chemical technologies to the CSIR. In 2001, as part of its strategic decision to exit from its fine chemicals development programme, AECI decided to divest of its interests in fine chemicals production and research. The rights to the range of aroma and flavour fine chemical technologies under development were subsequently transferred to CSIR Bio/Chemtek and the two existing fine chemicals businesses were sold to management.
PART 3 – AROMA CHEMICALS from PETROCHEMICAL FEEDSTOCKS
Copyright FRIDGE (2004) Page 20
3 INDUSTRY and MARKET ANALYSIS
3.1 Parahydroxybenzaldehyde
3.1.1 Historical background
Dow Chemical was the major producer of para-hydroxybenzaldehyde (pHB) for many years. pHB was produced as a by-product in its production of salicylaldehyde via the carbonylation of phenol with alkaline chloroform. The route was economic and Dow sold pHB at a by-product price, which in 1982 was in the order of $ 7.00 – 8.00/kg. In the early 1980’s, Dow ceased the manufacture of salicylaldehyde, and pHB was therefore no longer available. There were no other producers at the time and as a result, other producers began production of this intermediate via alternative routes. Prices rose to $22-25/kg by 1995.
Due to this dramatic price increase, many users of pHB found alternative manufacturing routes to their products relying on this intermediate. Alternative starting materials were found for fine chemical products such as para-hydroxyphenyl glycine (an intermediate for amoxycillin), bromoxynil (a herbicide), 3,4,5-trimethoxybenzaldehyde (an intermediate for trimethoprim) and para-hydroxy-phenylacetamide (an intermediate for atenolol) that were previously manufactured from pHB.
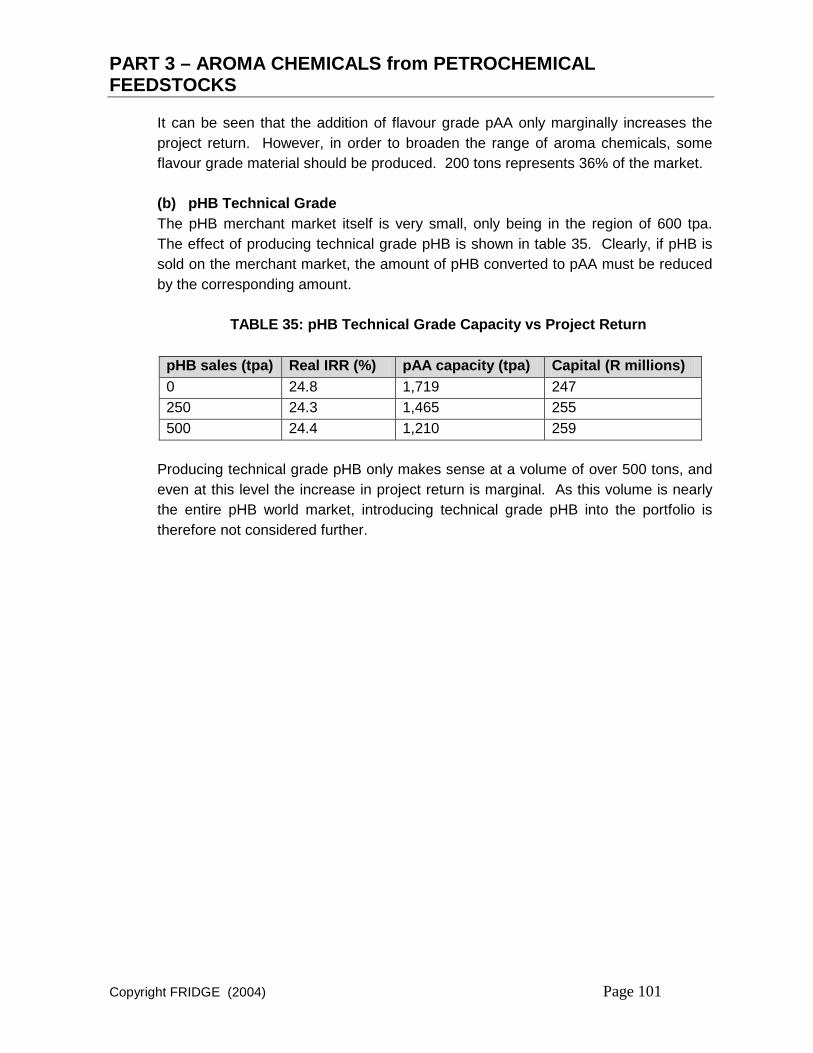
3.1.2 Market Demand
The pHB market in 1995 was more than 2,500 tpa. Since then, the market has shrunk to around 600 tpa. The major changes in this market occurred between 1995 and 1998 due to a number of factors:
• pHB was used in the manufacture of 3,4,5-trimethoxybenzaldehyde. The use of pHB in this market was around 1,000 tpa. The major reason for this was that producers of trimethoxybenzaldehyde switched to using p-cresol as the key raw material. The production of this key pharmaceutical intermediate also moved to India due to Atul’s increasing ability to produce large quantities of p-cresol.
• pHB was used in the manufacture of printed circuit boards for many years. pHB is however no longer used in this application.
• Until 1996, pHB was widely used in China to produce approximately 500 tpa of vanillin. This application no longer exists.
The remaining applications for the use of pHB are in the production of araldite resin, cyanofos and raspberry ketone. The araldite resin (Novartis) that includes pHB is a product in steady to slow decline. Other applications are small. The largest of these, Eli Lilly’s use in the production of Dobutamine, is less than 10 tpa.
PART 3 – AROMA CHEMICALS from PETROCHEMICAL FEEDSTOCKS
Copyright FRIDGE (2004) Page 21
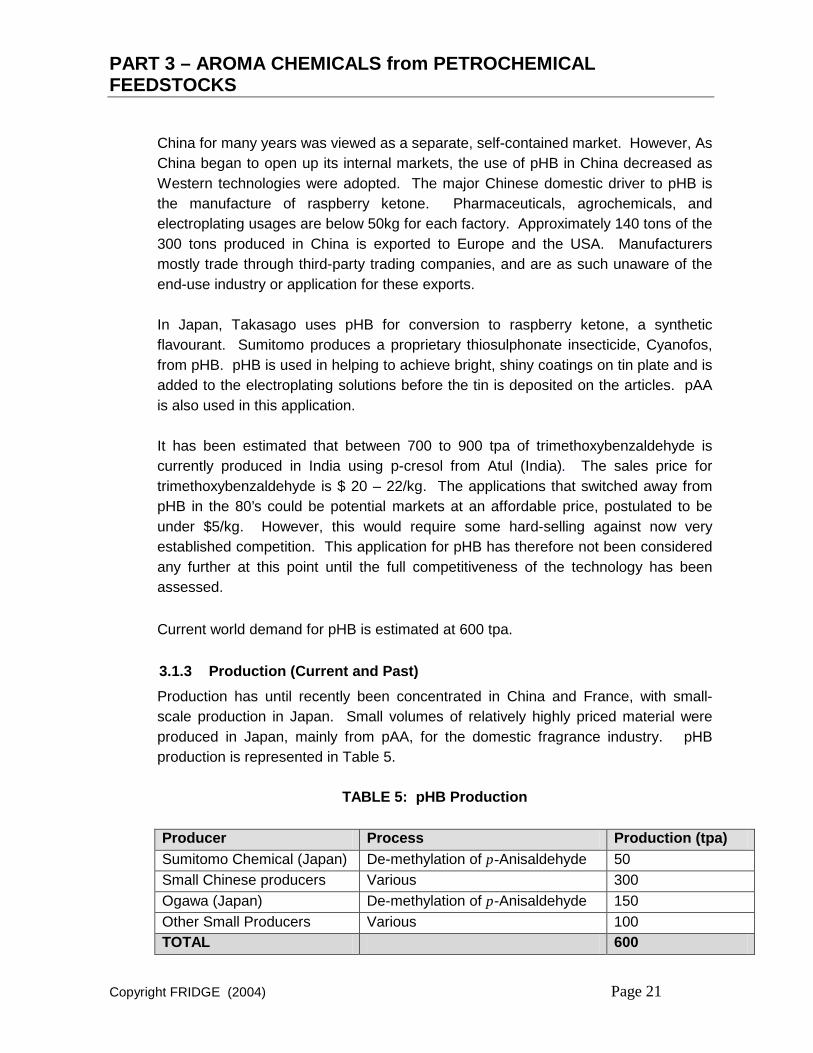
China for many years was viewed as a separate, self-contained market. However, As China began to open up its internal markets, the use of pHB in China decreased as Western technologies were adopted. The major Chinese domestic driver to pHB is the manufacture of raspberry ketone. Pharmaceuticals, agrochemicals, and electroplating usages are below 50kg for each factory. Approximately 140 tons of the 300 tons produced in China is exported to Europe and the USA. Manufacturers mostly trade through third-party trading companies, and are as such unaware of the end-use industry or application for these exports. In Japan, Takasago uses pHB for conversion to raspberry ketone, a synthetic flavourant. Sumitomo produces a proprietary thiosulphonate insecticide, Cyanofos, from pHB. pHB is used in helping to achieve bright, shiny coatings on tin plate and is added to the electroplating solutions before the tin is deposited on the articles. pAA is also used in this application. It has been estimated that between 700 to 900 tpa of trimethoxybenzaldehyde is currently produced in India using p-cresol from Atul (India). The sales price for trimethoxybenzaldehyde is $ 20 – 22/kg. The applications that switched away from pHB in the 80’s could be potential markets at an affordable price, postulated to be under $5/kg. However, this would require some hard-selling against now very established competition. This application for pHB has therefore not been considered any further at this point until the full competitiveness of the technology has been assessed. Current world demand for pHB is estimated at 600 tpa. 3.1.3 Production (Current and Past)
Production has until recently been concentrated in China and France, with small-scale production in Japan. Small volumes of relatively highly priced material were produced in Japan, mainly from pAA, for the domestic fragrance industry. pHB production is represented in Table 5.
TABLE 5: pHB Production
Producer Process Production (tpa) Sumitomo Chemical (Japan) De-methylation of p-Anisaldehyde 50 Small Chinese producers Various 300 Ogawa (Japan) De-methylation of p-Anisaldehyde 150 Other Small Producers Various 100 TOTAL 600
PART 3 – AROMA CHEMICALS from PETROCHEMICAL FEEDSTOCKS
Copyright FRIDGE (2004) Page 22
S.F Hoechst S.F Hoechst (France) used to produce 650 tpa of pHB in its plant in Northern France. After Dow’s exit, S.F Hoechst continued to supply those applications which could sustain the high-priced raw material ($20 – 30/kg), and until recently dominated the supply in the Western market. However in 1995, Novartis (ex Ciba Geigy), Hoechst’s major customer purchasing 450 tpa for production of an araldite resin, cancelled this contract and switched to sourcing from Jilin Pharmaceuticals at $ 7 – 8kg compared to $ 22/kg. Hoechst closed its plant in 1997. Jilin Pharmaceutical Factory Jilin Pharmaceuticals is one of the largest chemical companies in China and for many years the only significant Chinese producer of pHB. It had a 1,500 tpa capacity and produced between 1,200 to 1,400 tpa for many years. In 1995/6, the factory closed this plant due to the slump in the company’s sales to the trimethoprim market. For a while it sold stockpiled pHB to third parties. They no longer sell any material. pHB used to be produced as a by-product of Jilin’s salicylaldehyde process years using a technology similar to that used by Dow. pHB and salicylaldehyde are produced in the ratio of 1:7, implying that a significant volume of salicylaldehyde must be sold or converted to other derivatives for sale. Jilin could potentially re-enter the pHB market if domestic demand increased again to a high enough level, believed to be in the order of 300 tpa. Other producers There are several small Chinese producers and three small producers in Japan, Sumitomo and Nippon Kayaku. They all have capacities less than 150 tpa and use a variety of process routes. A number of very small laboratory scale units are believed to produce pHB for specialist applications.
3.1.4 Price
Dow Chemical was the major producer for many years. The pHB price was during this time the by-product price of the salicylaldehyde production, $ 7-8/kg. Following Dow’s exit from the market, the Western price rose substantially to that of S.F. Hoechst, $ 22.00 – 25.00/kg. Prices in China at this time were in the region of $ 5 – 7/kg. Following Jilin’s exit from the market, the pHB price in the west strengthened to $ 12.00 - $15.00/kg. The domestic price in China is in the region of $ 7.00 – 8.00/kg. Prices are now more in line with the Chinese price.
PART 3 – AROMA CHEMICALS from PETROCHEMICAL FEEDSTOCKS
Copyright FRIDGE (2004) Page 23
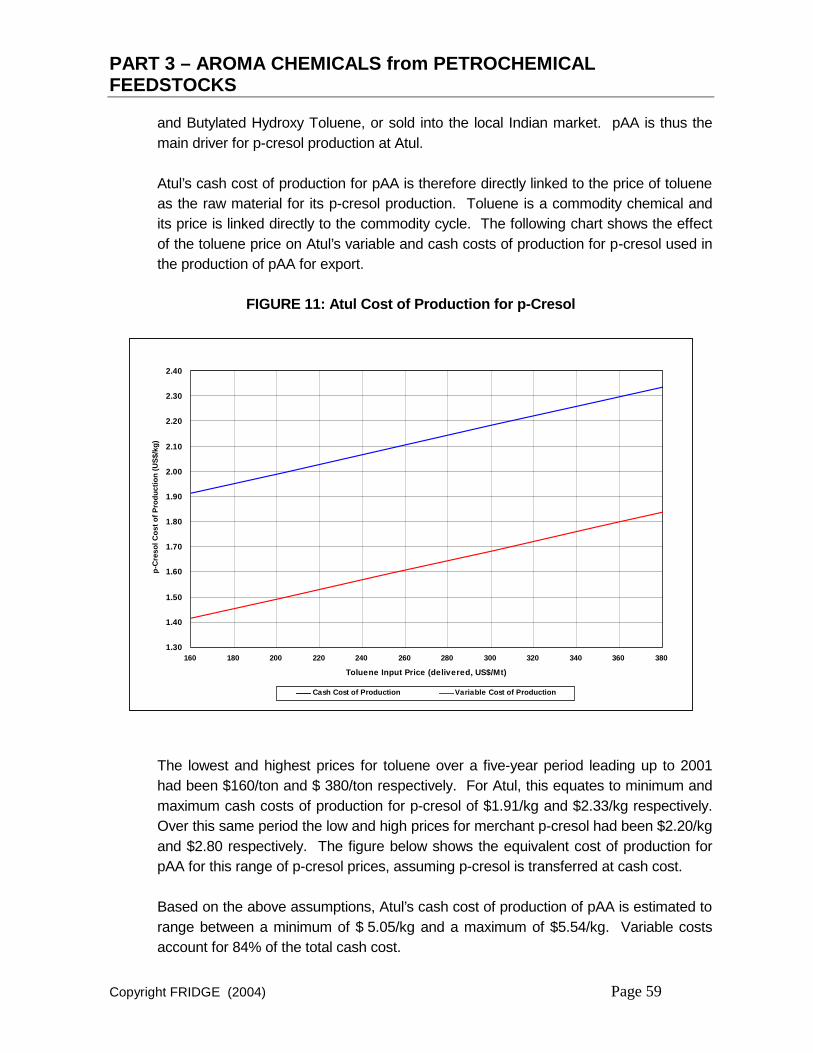
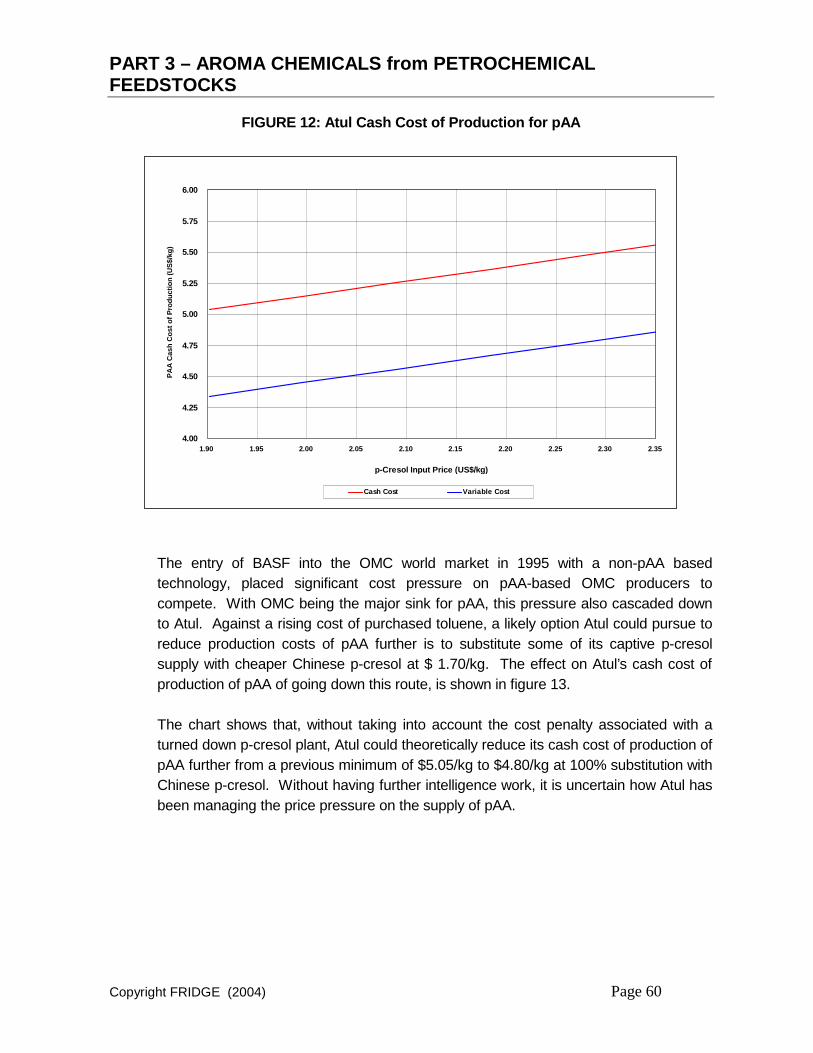
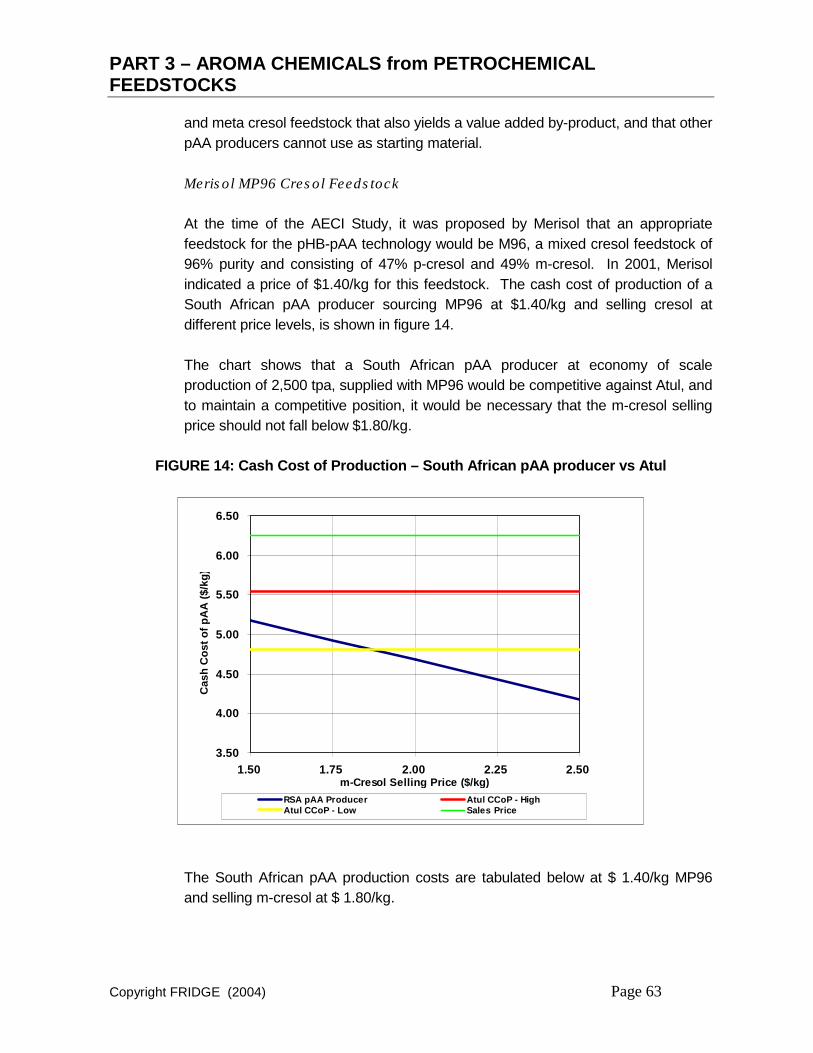
3.2 p-Anisaldehyde
p-Anisaldehyde (pAA) has been used for the preparation of perfume compounds for many years and the earliest synthesis was based on the degradation of naturally occurring products, especially anethole. Anethole may be extracted from aniseed oil and fennel oil. Anisaldehyde began to find uses as a chemical intermediate in substantial quantities, with the result that processes based on the use of petrochemical feedstocks were investigated. The majority of pAA is today made from p-cresyl methyl ether, with some producers using pHB as starting material. 3.2.1 Market Demand
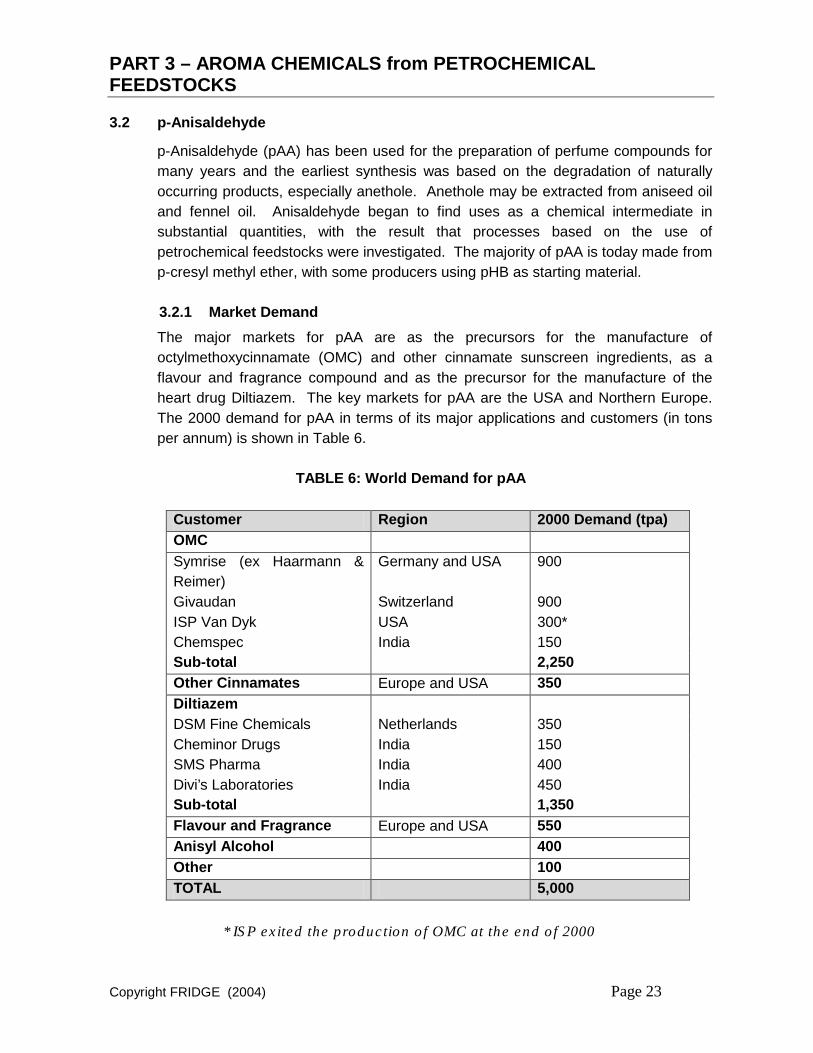
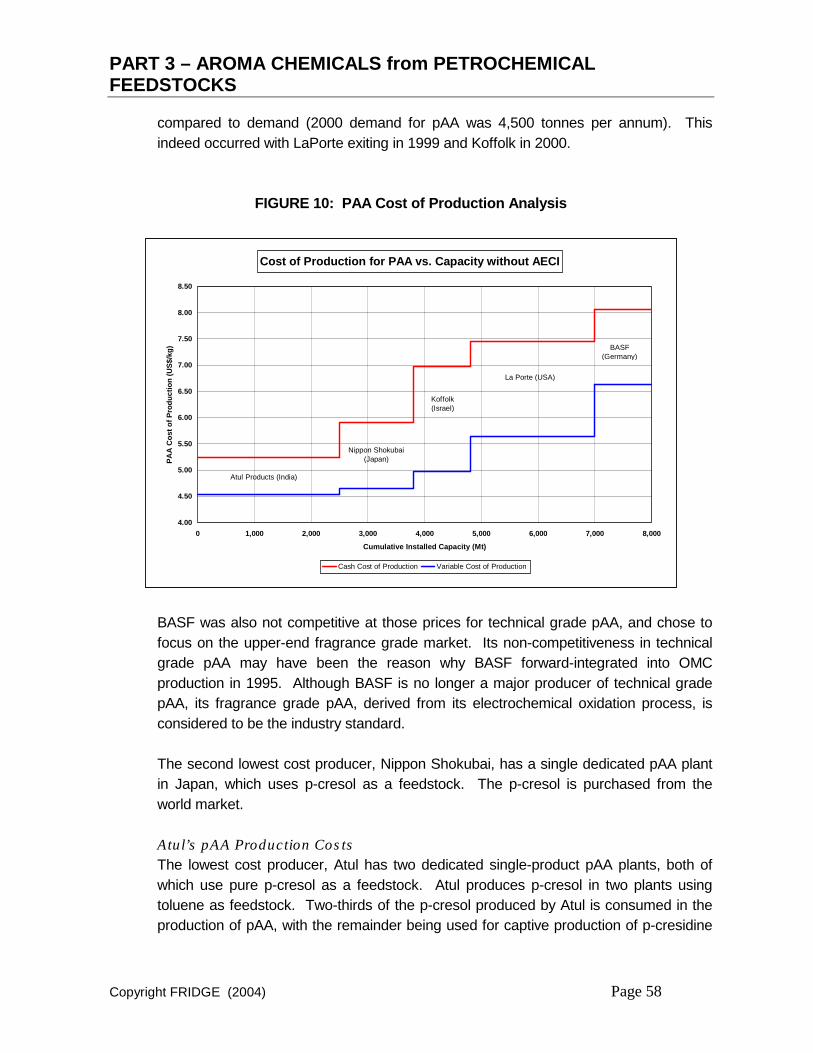
The major markets for pAA are as the precursors for the manufacture of octylmethoxycinnamate (OMC) and other cinnamate sunscreen ingredients, as a flavour and fragrance compound and as the precursor for the manufacture of the heart drug Diltiazem. The key markets for pAA are the USA and Northern Europe. The 2000 demand for pAA in terms of its major applications and customers (in tons per annum) is shown in Table 6.
TABLE 6: World Demand for pAA
* ISP exited the production of OMC at the end of 2000
Customer Region 2000 Demand (tpa) OMC Symrise (ex Haarmann & Reimer)
Germany and USA 900
Givaudan Switzerland 900 ISP Van Dyk USA 300* Chemspec India 150 Sub-total 2,250 Other Cinnamates Europe and USA 350 Diltiazem DSM Fine Chemicals Netherlands 350 Cheminor Drugs India 150 SMS Pharma India 400 Divi’s Laboratories India 450 Sub-total 1,350 Flavour and Fragrance Europe and USA 550 Anisyl Alcohol 400 Other 100 TOTAL 5,000
PART 3 – AROMA CHEMICALS from PETROCHEMICAL FEEDSTOCKS
Copyright FRIDGE (2004) Page 24
Sunscreen Market The end-use market for pAA in sunscreens has historically shown good growth at about 6% per annum. The ageing baby-boomer generation is offering new potential for the multi-billion dollar US personal care industry. Demand is increasing for products that address the effects of ageing, particularly in skincare and cosmetics, where there is an emphasis on ingredients that moisturise the skin and also offer sun protection. Consumers are more aware of damage caused to the skin by the sun, and manufacturers are now adding sunscreens to skincare, hair and cosmetic products. One class of sunscreens, the cinnamates, have been particularly favoured after the decline of the p-cresyl methyl ether esters, because of concerns about the photostability of p-aminobenzoic acid and its potential carcinogenicity. The growth of sunscreens was the major driver of the growth in the pAA market in the 1990’s. 2-Ethylhexyl p-methoxycinnamate, more commonly known as octylmethoxycinnamate (OMC), is the most popular cinnamate in the market. The major producers of OMC, their reported capacities and production volumes are shown in Table 7.
TABLE 7: OMC production capacity
Producer 1996
Volume (tpa)
2000 Volume (tpa)
2001 Estimated Volume (tpa)
Capacity (tpa)
BASF (Germany) 500 1,500 2,100 4,500 Symrise (Germany) 1,650 1,500 1,800 2,000 Givaudan (Switzerland) 1,250 1,500 1,250 1,750 ISP (USA) 750 500 0 1,000 Other (India and China) 50 250 350 ? TOTAL TOTAL (After exits)
4,200
5,250 5,500 9,250 8,250
With the exception of BASF, all of the world producers produce OMC by the Perkin condensation of pAA with acetone, followed by the base-catalysed ester exchange with 2-ethyl-hexanol. By 1996, world production of OMC was dominated by Givaudan and Symrise, both of which had plants in Europe and the USA. In the late 1990’s Givaudan closed its cinnamate plant in the USA, transferring all production to Europe. Although, this did not affect overall world-wide demand, it led to increased transport costs and duties for Degussa and Nippon Shokubai’s products, both of which were used in the USA plant. This
PART 3 – AROMA CHEMICALS from PETROCHEMICAL FEEDSTOCKS
Copyright FRIDGE (2004) Page 25
move by Givaudan may have been driven by BASF’s entry into the market in 1995 with a 2,000 tpa OMC plant. BASF’s production of OMC proceeds via its own proprietary process starting with its primary product from pAA production, the corresponding dimethyl acetal. This product is produced directly in the electrolytic oxidation process instead of pAA. The dimethyl acetal is then reacted with ketene, giving the methyl ester of p-methoxycinnamic acid, which is converted to OMC by esterification with 2-ethyl hexanol. BASF has since improved its technology and commissioned a new OMC plant with a capacity of 4,500 tpa at the end of 2000. BASF has taken substantial market share using this proprietary process, in what was previously its customers’ market due to the fact that it has the lowest-cost route for OMC production. This has resulted in the traditional OMC producers coming under pressure. In late 2000, ISP announced that it was exiting the production of OMC due to poor economics and would be sourcing it externally. Symrise is the only OMC producer with two plants. These plants are relatively old and use an optimised but outdated technology. The entry of BASF into the market has led to cost pressure on these plants. The OMC price has softened to US$ 13 – 18/kg, compared to $ 20 – 22/kg in 1996. On balance, the end use for pAA in the OMC market growth has declined to the region of 2 – 3% per annum, due to BASF’s consolidation of its OMC production using a non-PAA based technology. Pharmaceutical Intermediates The successful heart drug, Diltiazem, is the second largest application for pAA. Anisaldehyde is a small fragment of the Diltiazem molecule, but it is added in at the beginning of a 5-stage synthesis, in which 50% of the intermediate is lost in a chiral reduction step. Around 2.4 kg of pAA is used to produce 1 kg Diltiazem. Diltiazem was developed by Tanabe in Japan, and licensed to Synthelabo in Europe and Marion-Merrell-Dow in USA. The majority of pAA is in fact sold to the producer of the penultimate intermediate of the Diltiazem molecule, the “cis-lactam”. After Diltiazem went generic in 1998, its market grew at 8% per annum for a number of years. During this time, there was a significant shift in world production to India, and producers there now supply two-thirds of the world Diltiazem demand. The growth of Diltiazem has now reached a plateau, with total consumption in the region of 540 tpa.
PART 3 – AROMA CHEMICALS from PETROCHEMICAL FEEDSTOCKS
Copyright FRIDGE (2004) Page 26
Anisyl Alcohol Another use for pAA is as a starting material for the production of anisyl alcohol, which in turn is used for the production of a number of pharmaceutical intermediates. Anisyl alcohol is obtained via a catalytic reduction of anisaldehyde with a copper catalyst and most anisaldehyde producers have the capability to manufacture it. Koffolk used to have the largest share of this market. Atul has also entered the anisyl alcohol market, which is manufactured from their pAA in a tolling agreement with Standard Synthetics in India. The main application for anisyl alcohol is the production of pentazocine, a Sterling Drug analgesic that is made in the old Sterling Organics (now Nycomed) plant in the USA, and by Ranbaxy in India. Although the volume of final product is small, the route is long and some step yields are low. For this reason, the actual demand for anisyl alcohol is relatively high. About 120 tpa of anisyl alcohol is used for the production of dextromethorphane, an antitussive made by Roche. Anisyl alcohol sells for around US$11.00/kg. Flavour and Fragrance Applications The flavour and fragrance market for pAA has been growing at 4 – 6% per annum. pAA has good fixative properties, which confers a lingering, fruity fragrance to any end-product formulation. This application requires the highest grade pAA, which must meet organoleptic specification required by customers. pAA is widely used in creating perfume compounds and adds a floral note to fragrances. Concentrations in the final product depend on application, but typically 0.3% is used in soap and 0.4% in perfumes. Since Bayer exited the market, Nippon Shokubai and BASF are the main suppliers to this sector. Markets for the perfume application are fragmented and the customers are generally reluctant to change suppliers. pAA is used in flavour compositions (concentrates) for beverages, ice creams, sweets, baked goods and puddings, at concentrations typically between 6 and 8%. It has a burning, bitter taste, and its aroma blends well with many fruit and berry compositions, especially strawberry flavours. Other Applications Small quantities of pAA are also used in the electroplating industry where the metabisulphite adduct of the product is used as brightener in galvanic baths for zinc and cadmium plating. The concentration in the final plating solution is about 0.6% m/m. This application is believed to be in decline.
PART 3 – AROMA CHEMICALS from PETROCHEMICAL FEEDSTOCKS
Copyright FRIDGE (2004) Page 27
3.2.2 Customers
The end-use markets are therefore the major flavour and fragrance houses and manufacturers of pharmaceutical and personal care active ingredients. These are often the same companies (e.g. Symrise and Givaudan), and they in turn supply formulations and active ingredients to food and beverage producers, and compounders of end-use pharmaceutical and personal care products. 3.2.3 Production
Until the mid-1980’s production and consumption of pAA was quite balanced. The main producers were Bayer (Europe), BASF (Europe), Koch Chemical (USA), and Koffolk (Israel). Insignificant quantities were made in Japan. Reasonable quantities were made in China but the producers were not active in international markets. The major applications for pAA were for sunscreens (based on cinnamates), perfumery, pharmaceutical intermediates, and some other miscellaneous uses.
In the 1990’s the demand for pAA increased due to 2 factors:
• Increasing consumption as an intermediate in the production of Diltiazem, a major heart drug produced by Tanabe in Japan and Marion Merrell Dow in the USA.
• The gradual demise of the sunscreen agent, p-aminobenzoic acid due to its perceived carcinogenicity, with the resulting increase in demand for octylmethoxycinnamate.
Two new producers entered the market, Nippon Shokubai (Japan) and Atul (India). Total installed capacity is over 8,000 tons, with a worldwide demand of 4,500 tons. In 1997, Bayer exited the pAA market. Table 8 lists the producers and their production capacities and volumes over the period 1996 – 2000. Most commercial PAA production starts from p-cresol. Hence, a captive source of p-cresol provides a major competitive advantage. This benefit is enjoyed by Laporte and Atul. Koffolk, BASF and Nippon Shokubai buy p-cresol on the merchant market with the result that these companies are less competitive. In 1997, consumption of p-cresol for the production of PAA accounted for around 15 – 17% of the worldwide use of this commodity intermediate. The main applications for p-cresol are however for making antioxidants such as butylated hydroxy toluene. The price of p-cresol is therefore set by other markets.
PART 3 – AROMA CHEMICALS from PETROCHEMICAL FEEDSTOCKS
Copyright FRIDGE (2004) Page 28
TABLE 8: World producers of pAA (Volumes/Capacities in tons per annum)
* BASF is still able to produce pAA in its multi-purpose plant, but now converts most of its p-cresol feedstock to OMC using a route that proceeds via a different intermediate (not pAA). # Bayer exited pAA production in 1997. LaPorte exited pAA production at the end of 1999. Koffolk exited pAA production for external sales in mid-2000. @ Benzochem is a new opportunistic entrant into pAA, and is taking up the demand in India not currently met by Atul.
LaPorte Performance Chemicals Laporte was the only US based producer of pAA. It has changed hands a couple of times, first being known as Koch Chemicals, part of Koch Industries. It was sold to Allied Signal and renamed Allied Chemical (Allco) in 1992. In 1996 Allco was purchased by the UK based Inspec Group, and renamed Inspec USA. In September 1998 Inspec was purchased by LaPorte. Over the period 1992 to 1996, capacity was increased to 1,800 tpa, lessening US reliance on offshore supplies. Specific process bottlenecks were also eliminated leading to a nameplate capacity of 2,220 tpa. Laporte is backward integrated through Inspec UK (Shell Chemicals Plant), although this plant is on a different continent. The production process has a reasonably high yield. Laporte could not compete effectively in Europe due to additional transport costs incurred from its US plant. It was never able to achieve a high utilisation of this new capacity due to its high cost of production and only produced 500 tons of pAA in 2000. LaPorte exited the pAA business at the end of 1999.
PART 3 – AROMA CHEMICALS from PETROCHEMICAL FEEDSTOCKS
Copyright FRIDGE (2004) Page 29
Nippon Shokubai Nippon Shokubai’s nameplate capacity is 1,250 tpa. The process has the highest yield of any producer at > 85%. It was the lowest variable cost producer of pAA until Atul’s entry into the market. It does however suffer from high Japanese operating costs. Nippon Shokubai does not have a captive source of p-cresol, and must therefore purchase this key raw material on the merchant market. The company therefore suffers a disadvantage when compared to fully backward integrated companies. Nippon Shokubai cannot compete in Europe due to the additional burden of shipping costs incurred from its plant in Japan. BASF Since Bayer’s exit from the pAA market, BASF is the only remaining European producer of pAA. BASF has no captive source of p-cresol and must purchase this raw material on the merchant market. This is therefore a disadvantage in comparison to back-integrated companies. The yield from its process is low (< 50%) as it has a poor selectivity. Furthermore, the process suffers from high electrical power utilisation costs. BASF is therefore the highest variable cost producer and its electrolytic route is not competitive compared to other commercial technologies. In order to become more competitive, BASF forward integrated to OMC production, by producing the dimethyl acetal of pAA directly in its electrolytic oxidation process instead of pAA. This allows it to compete more effectively in OMC production than it can in pAA. BASF now only uses 350 tpa of its nameplate capacity of 800 tpa for pAA production. BASF’s p-cresol purchases, being indicative of its pAA and cinnamates production, increased from 1,000 tons in 1997 to 1,900 tons in 1999, of which 400 tons is used for pAA. 1,000 tons is used for OMC and 500 tons for other UV absorbers. Atul Atul became the latest producer of pAA in 1994. It has increased capacity to 2,500 tpa, and has announced intentions to increase production further to market mainly to the USA. Atul is fully integrated on its production site, with access to p-cresol. The yield from its process is relatively high at 80 – 85%. The manganese sulphate by-product formed (4-5 tons per ton pAA) is disposed of in a landfill, which is currently allowed in India. Should this legislation change, as was the case for Koffolk and LaPorte, this could become a competitive disadvantage. Atul’s capacity utilisation has increased as it has developed its market. It is therefore the most competitive producers of pAA.
PART 3 – AROMA CHEMICALS from PETROCHEMICAL FEEDSTOCKS
Copyright FRIDGE (2004) Page 30
Koffolk Koffolk is a subsidiary of Philips Brothers Chemicals, USA. It produces pAA in Israel with a nameplate capacity of 1,000 tpa. The yield from its process is 80 – 85%, but Koffolk must purchase p-cresol on the open market, leading to a significant cost disadvantage in this regard. The by-product manganese sulphate is purified and sold as an animal feed additive. pAA production was a large part of Koffolk’s business, carrying a significant portion of its overheads. Koffolk however ceased supply to the export market in 2000, however it still produces small quantities for captive conversion to p-anisyl alcohol. Bayer Bayer used to produce pAA from captively produced pHB exclusively for Symrise’s (ex Haarmann and Reimer) sunscreen additives and flavour and fragrance formulations. Bayer has a captive source of p-cresol, via the caustic fusion of p-chlorotoluene. Production ceased in 1998 as the process became increasingly uncompetitive. The result was that Symrise sources pAA on the open market.
3.2.4 Price
pAA prices are normally negotiated with customers and are fixed for medium term supply contracts. Unlike commodity chemicals, historical prices for pAA are not generally published. Prices were obtained via business intelligence networks during the AECI study. Historically there has been a two-tiered pricing structure for the products, with prices as follows:
Prior to 1995, the price for technical grade pAA was stable at $ 9.00 - $10.00/kg and the price differential between the two grades was 50%. The restructuring that took place in both the pAA and OMC markets from 1995 to 2000 caused a reduction in pAA prices to the levels mentioned above. Atul, as the lowest cost producer of pAA, was able to respond to market pressure, and managed to expand market share substantially during this period. The highest cost producers Bayer, Laporte and Koffolk exited the business. This effectively removed 45% of world capacity from the market, and the pAA capacity overhang that existed at the time. With no new entrant into the market, the supply and demand balance should remain stable.
PART 3 – AROMA CHEMICALS from PETROCHEMICAL FEEDSTOCKS
Copyright FRIDGE (2004) Page 31
3.3 Vanillin
3.3.1 Historical Background
Haarmann and Reimer first produced vanillin commercially in the late 1800’s, using guaiacol from phenol. This route was used commercially for more than 40 years. It was discovered that vanillin could be produced from lignin based by-products found in sulphite waste liquor from the paper and pulp industry, and the commercial production of vanillin from lignin began in 1937. This lignin based vanillin process became the dominant commercial process for many years, with the supply ratio 80% lignin to 20% guaiacol. One supplier, Rhodia, however continued to produce vanillin from guaiacol. In the 1980’s, changes in the paper and pulp industry led to a steady decrease in the supply of the raw material required by the vanillin plants. The traditional calcium sulphite pulping process produces huge volumes of lignosulphonate effluent, which must be disposed of it cannot be recycled back to the mill. The increasing costs of dealing with such waste products and the growing public awareness of environmental issues led to mounting pressure on the pulp mills. The calcium sulphite pulp mills were closed, or converted to new technology, generating magnesium or ammonium sulphite liquors, which are recycled for chemical recovery and thus not available for vanillin production. By 1993, only Borregaard remained as a lignin producer of vanillin. The synthesis of vanillin from guaiacol now accounts for 85% of the world’s supply, with production from lignin containing waste accounting for the remaining 15%. Borregaard in Norway remains the only major lignin vanillin producer. The biggest lignin vanillin manufacturers (all sulphite-based) that were in production in the 1980’s and their current status are listed below in table 9.
TABLE 9: Lignin producers of Vanillin
Producer Capacity (tpa) Comment Ontario Paper 3,000 Closed 1988 Monsanto 2,000 Closed 1991 ITT Rayonier 1,500 Closed 1993 Borregaard 1,500 Still in production
3.3.2 Market demand
Vanillin is a versatile, well-established aroma chemical used mostly as a flavour compound. The total world market is estimated at 10,500 tons per annum. The major applications are in the manufacture of chocolate and ice cream, with smaller quantities used in baked goods and confectionery. Vanillin can also be used as a
PART 3 – AROMA CHEMICALS from PETROCHEMICAL FEEDSTOCKS
Copyright FRIDGE (2004) Page 32
fragrance and fixative in perfumes, cosmetics and other fragrance mixtures. It is also used as a pharmaceutical intermediate. Commercial users can choose between natural vanilla (very expensive and used only in niche markets), nature-identical vanillin (guaiacol or lignin vanillin), and artificial vanilla flavour (ethyl vanillin). Natural vanilla flavouring, produced from the pod of the vanilla orchid by extraction of the aroma compounds with ethanol, constitutes less than 5% of the world market. Natural vanilla contains both vanillin and a range of other aroma chemicals, which in total are responsible for the full flavour of true vanilla. Natural vanilla is considerably more expensive than synthetic vanillin by a factor of 10. Synthetic vanillin is produced on a commercial scale using two distinct technologies. Vanillin produced by the different process routes has different flavour profiles. Consumer preference ultimately drives demand for the different vanillin products. In certain applications, particularly the perfume industry, European chocolate manufacturers, and the Japanese market, lignin vanillin is preferred over guaiacol vanillin. As is the case with most aroma chemicals used in the flavour industry, companies are reluctant to change from current suppliers as the organoleptic profile will also change. The world demand for vanillin in its major applications is as follows:
TOTAL 10,500 100% The breakdown of vanillin use as a flavour ingredient is depicted in Figure 7 below.
PART 3 – AROMA CHEMICALS from PETROCHEMICAL FEEDSTOCKS
Copyright FRIDGE (2004) Page 33
FIGURE 7: Vanillin use in the Flavour Market
Chocolate35%
Ice Cream40%
Baked Goods17%
confectionery8%
Vanillin is a mature market, and the market is growing steadily, anticipated to be 2 – 3% over the next few years. Flavour and fragrance applications continue to expand in line with demographics and increases with disposable income. As a result, the growth in consumption of vanillin in flavour and fragrance products is growing at 4% in developing nations, in comparison to 2% in developed regions. Vanillin for many years was used as an intermediate for 2,3,5- trimethoxybenzaldehyde, which itself is an intermediate for the drug trimethoprim. This product is now however manufactured almost exclusively in China using the cheaper gallic acid route. In the 1980’s the use of vanillin as a pharmaceutical intermediate in the production of drugs such as L-methyl dopa declined. It has now levelled to approximately 10% of total vanillin demand. In Europe, the use of vanillin as a pharmaceutical intermediate appears to be captive to Rhodia. The global demand for vanillin is estimated as follows:
TABLE 11: World demand for Vanillin
Region Total Demand (tpa)
% of World Market
North America 2,850 27% Western Europe 2,950 28% Eastern Europe 1,800 17% Asia 2,250 21% Other 650 6% TOTAL 10,500 100%
PART 3 – AROMA CHEMICALS from PETROCHEMICAL FEEDSTOCKS
Copyright FRIDGE (2004) Page 34
3.3.3 Ethyl Vanillin
Ethyl vanillin is a derivative of vanillin, and has an ethoxy group in the C3 position, rather than the methoxy group of vanillin. Unlike vanillin, ethyl vanillin is not a naturally occurring aroma chemical, and can only be produced synthetically. It is often used in conjunction with vanillin or as a substitute for vanillin. Ethyl vanillin is described as intensely vanilla-like, sweet and creamy. It is used more in fragrances than vanillin, because it has a more sweet, floral and deep creamy note. Its predominant use is however in flavours such as chocolate. In this application it is used in the same way as vanillin, but it has 2 – 4 times greater flavour. In some countries, legislation limits its use and in the European Union its use must be indicated by words such as “contains artificial colouring”. Usage is expected to decrease in this area as a result of negative customer perception. Ethyl vanillin has taken some market share from vanillin in recent years, but it is said to have limited application. The extent to which this is likely to become important depends ultimately on consumer preference. The product is therefore more widely used in countries that have no labelling regulations, and where costs are more important. Ethyl vanillin could thus become more important in developing countries where there is no existing highly developed taste preference. Ethyl vanillin was granted GRAS (generally recognised as safe) status in 1965 and is approved by the FDA for food use. The world market for ethyl vanillin is about 1,700 tpa, growing at about 4% per annum. It is used in the different applications as follows:
Ethyl vanillin is generally not a stand-alone product, but is mostly marketed and produced alongside vanillin. A project study of vanillin therefore cannot be divorced from ethyl vanillin. 3.3.4 Market Structure
The market for vanillin consists mainly of compounders, such as the major international flavour and fragrance houses (e.g. IFF, Givaudan, Quest, Danisco, Symrise) the bigger producers of ice cream (such as Unilever) and chocolate (Nestle,
PART 3 – AROMA CHEMICALS from PETROCHEMICAL FEEDSTOCKS
Copyright FRIDGE (2004) Page 35
Cadbury, Suchard), and producers of pharmaceutical active ingredients such as L-methyl dopa (Merck). Other users include hundreds of small and medium companies, and producers of baked goods and confectionary. Most of the biggest users of vanillin prefer to secure their supply via contracts. The larger end uses such as major European chocolate manufacturers tend to buy vanillin directly from the producers and prepare their own formulations. Customers for vanillin will therefore mainly be formulators such as Danisco and Quest, and the bigger ice cream and chocolate producers. Most vanillin is sold to end users as already-formulated products. Vanillin is however also sold in open trade and bought on a spot basis. This final end-use market for vanillin is very fragmented and consists of a large number of small users. Serving such a market therefore requires an extensive sales and marketing network. The many smaller users are hence best served by agents and distributors of vanillin products or by the flavour and fragrance houses, for compounded products. 3.3.5 Production
There are only a few significant manufacturers of vanillin in the world. The market is dominated by Rhodia using the catechol-guaiacol process. Borregaard (Norway), the second largest vanillin producer, is the only remaining significant producer of lignin vanillin remaining. In China, the guaiacol route is mainly used, with only a small amount of lignin vanillin being produced. The nitrobenzene route, which used to be widely used in China has been phased out. In the guaiacol-based vanillin route, vanillin and ethyl vanillin are prepared from a common intermediate by employing either a methylation or ethylation agent. Therefore, guaiacol vanillin producers generally also produce ethyl vanillin in campaign runs in their vanillin plants. For all practical purposes, there is thus a huge “over-capacity” of ethyl vanillin in the world. Nevertheless, it has not displaced vanillin to any great degree. Capacity figures for existing producers therefore refer to the combination of these two products, although vanillin production currently predominates by far. The current major world producers of vanillin and ethyl vanillin and their nameplate capacities are listed in Table 13. The table clearly shows that there is an excess of vanillin production capacity. This has resulted in an oversupply and a reduction in the market price over the last few years.
PART 3 – AROMA CHEMICALS from PETROCHEMICAL FEEDSTOCKS
Copyright FRIDGE (2004) Page 36
TABLE 13: Vanillin world producers
Company Country Route Capacity (tpa)
Vanillin
Capacity (tpa)
Ethyl Vanillin
Rhodia France Guaiacol 3,000 250
USA Guaiacol 5,000 500
Borregaard Italy/
Norway
Lignin
Guaiacol
2,800 200
Ube Industries Japan Guaiacol 1,000 500
Shanghai Zinhua Perfume Factory
China Guaiacol 1,200
Jiaxing Zhonghua Chemical Complex
China Guaiacol 1,000
Jiaxing Xuebao Fine Chemical Factory
China Guaiacol 1,000**
Tianjing no. 1 Perfume Factory
China Guaiacol 500
Others Various Lignin/
Guaiacol 800
250
TOTAL 16,300 1,700 * Rhodia purchased the Xuebao plant in 2000. This plant is now a Rhodia
subsidiary named Ruohai Fine Chemicals. The Jilin Factory which was a joint venture with Rhodia has been shut down.
Rhodia (Previously Rhone Poulenc) Rhodia, the world leader in vanillin production, was formed in January 1998 after Rhone Poulenc spun off its chemicals division. It has been operating as a fully independent speciality chemicals concern since then. Rhodia entered the USA vanillin market in 1986 with the purchase of the 2,000 ton Monsanto plant. This plant was subsequently closed down in 1991. In 1992, Rhodia forced ITT Rayonier, the last remaining lignin vanillin manufacturer out of the market by keeping US prices between $ 13.00 – 16.50/kg for Food Chemicals Codex grade material. In November 1993, Rhodia purchased the ITT Rayonier vanillin business for its customer base and immediately closed the plant. At the same time, Rhodia erected its large guaiacol vanillin facility in the USA.
PART 3 – AROMA CHEMICALS from PETROCHEMICAL FEEDSTOCKS
Copyright FRIDGE (2004) Page 37
For many years, Rhodia’s main target has been China. It gained control of the guaiacol market in China with the opening of the Jade Fine Chemical Company plant at Wuxi in 1999. This is a 60:40 joint venture between Rhodia and Ube with a 4,000 tpa guaiacol capacity. In 2000 Rhodia acquired the Xuebao vanillin plant, with a capacity of 1,000 tpa, in China. A new subsidiary called Ruohai Fine Chemicals Company was formed. The company produces 1,000 tpa high quality vanillin from guaiacol supplied by the Jade joint venture. This vanillin is marketed mostly in China and some Asian countries. Rhodia dominates the world vanillin market in Europe, USA, and China. It can therefore largely dictate the price as it commands the largest share of the market. Rhodia is fully backward integrated to the phenol feedstock, which is mostly captively used for the production of downstream products. It has an extensive global marketing network selling directly to the end-user. Rhodia hence controls the entire vanillin value chain from phenol to end-user within its own organisation. In addition to synthetic vanillin, Rhodia manufactures a bio-based vanillin product, Rhovanil Natural, with a fermentation process using ferulic acid from rice bran at its facility in France. The product, priced at about $700/kg, was launched in Europe in 2000 and is now being promoted globally. Rhovanil meets US and European conditions for natural status. Borregaard/Eurovanillin Borregaard is the only remaining producer of lignin vanillin. The company also has guaiacol vanillin and ethyl vanillin production capacity as it acquired Eurovanillin in 1995. Borregaard supplies mainly the European market and its lignin vanillin production is reserved almost exclusively for large customers under long-term contracts. It is the only major supplier with the full spectrum of vanillin products, namely lignin vanillin, guaiacol vanillin and ethyl vanillin. Borregaard utilises the sulphite liquors from its own pulping operation as the lignosulphonate feedstock for the vanillin process. The sodium lignite waste stream derived from this process is all used in Borregaard’s lignin derivatives business. Further expansion of Borregaard’s lignin vanillin capacity will be dependant on this sodium lignate by-products market.
In March 1999, Sappi Saaicor entered into a 50: 50 joint venture, LignoTech SA with Borregaard to produce lignin by-products in South Africa in response to Sappi’s environmental problems. Lignin based products are used as dispersing agents in concrete, textile dyes, pesticides, ceramics and as binding agents in briquetting, animal feed and dust suppression. LignoTech SA announced
PART 3 – AROMA CHEMICALS from PETROCHEMICAL FEEDSTOCKS
Copyright FRIDGE (2004) Page 38
recently that it plans to expand capacity through the introduction of a new production line. The increased capacity will partly compensate recently reduced global capacities at other lignosulphonate plants. Sappi Saaicor uses both the calcium and magnesium sulphite pulping process, and pulping is mostly based on hard woods, which give poor vanillin yields. It is therefore unlikely that a vanillin plant would be added to this joint venture as there will be tremendous pressure on Borregaard to dispose of the sodium lignate in some potentially more costly way e.g. discharged to the sea or dried to a lignin by-product. The lignin by-products market is however experiencing little growth. Ube Ube (Japan) used to dominate supply in the East, particularly in Japan. Ube’s prices are not competitive, being the highest of all the major suppliers of guaiacol vanillin, and as a result have never been very successful in competing in Europe. Ube regards fine chemicals as its core business, with the focus on pharmaceuticals and electronic chemicals. Vanillin is no longer a high value-added fine chemical and is a small part of Ube’s business, as well as a product in which it has not been particularly successful in recent years. However, demand for high-purity catechol, which is used in the manufacture of resist exfoliants used in the production of semiconductors, is expanding and Ube’s exports to the USA are growing. Ube’s objective is to focus on growth areas such as this, where it has a competitive edge. The Jade Fine Chemicals plant in China, in which Ube is in a joint venture with Rhodia, began production in 1999 with a capacity of 4,000 tpa guaiacol from catechol. Ube provided the plant process technology, guaranteeing a high-efficiency production with little environmental impact. The guaiacol is used in China to supply Rhodia’s Ruohai vanillin plant, with the rest also marketed locally, presumably also for vanillin production. Chinese Producers China used to have over 10 vanillin and ethyl vanillin producers with capacities of 150 - 2,000 tpa. Due to complex manufacturing processes and severe pollution problems, most have been shut down and only three or four producers are still operating. The Chinese have had some success in exporting vanillin to the USA with prices generally about 15% lower than normal market prices for large quantities and about 10% lower for quantities in the order of 1 - 8 tons. The Chinese producers are increasingly aware that they cannot compete on price alone and that there is a need for improving the quality of their products and service.
PART 3 – AROMA CHEMICALS from PETROCHEMICAL FEEDSTOCKS
Copyright FRIDGE (2004) Page 39
Chinese producers occasionally dump vanillin on the market at cut-rate prices, leading to a slump in the vanillin price. It is expected that local producer costs in China will increase as the Chinese economy expands and opens up, which should result in market-related pricing of their products. The local market has grown rapidly in recent years in line with the overall economic growth in China, leading to further increases in local demand for products such as vanillin, with less product being available for export. Rhodia used to have a joint venture with Jilin, the largest vanillin producer in China with a capacity of 2,000 tpa. Jilin was the third largest producer in the world. Jilin successfully reduced costs and improved product quality, but despite this, it was also recently shut down. In September 2000, Rhodia acquired the Xuebao Fine Chemicals plant, and increased capacity to 1,500 tpa. On this basis, Rhodia plans to increase the guaiacol capacity of Jade Fine Chemicals plant to 7,000 tpa.
3.3.6 Price
Market prices range from $ 9.00 – 11.00/kg. Vanillin is sold on the merchant market as a crystalline solid in two grades, technical and Food Chemicals Codex (FCC) grade. The technical grade generally sells for about $ 2.00/kg less than FCC grade. The quantity of material purchased is also important in determining the price, given that the product quality is acceptable. Large orders of food grade material are normally offered at discount prices Since the liberalisation of the Chinese economy, Chinese producers have exerted a strong downward pressure on the global vanillin price. China’s export policy appears to be governed by its need for hard currency, and aggressive pricing often has the result of depressing the world market price of the products it produces in volume, vanillin being one of these. In 1995 Rhodia’s vanillin price was $ 17.50/kg, decreasing to about $11.00/kg in 2001. With the opening of the Jade Fine Chemicals guaiacol factory and Rhodia’s acquisition of the Xuebao vanillin plant, Rhodia has gained almost complete control of the guaiacol market in China. It is highly likely that their stranglehold on this product will allow Rhodia to continue to dominate the world market and set price levels. This may lead to price increases for vanillin. It is however predicted that the base level price will end up at about $11.00/kg at source, i.e. at $12.00/kg, delivered duty paid.
PART 3 – AROMA CHEMICALS from PETROCHEMICAL FEEDSTOCKS
Copyright FRIDGE (2004) Page 40
Lignin based vanillin is in high demand in certain market sectors and as such, tends to command a price premium. The price of lignin vanillin is consistently maintained at about $1.00 to $2.00 per kg above that of guaiacol based vanillin. The ethyl vanillin price follows the same basic trend as the vanillin price. It is maintained at about twice that of vanillin, but as it has about three times the flavour intensity of vanillin there is a cost saving associated with substituting vanillin with ethyl vanillin. The reason for the pricing strategy is not clear, but it may be due to the fact that ethyl vanillin’s main use is as a substitute for vanillin and has limited applications, with only relatively small volumes used. 3.3.7 Registration and Regulatory Requirements
Vanillin and ethyl vanillin must conform to the FCC specification as laid down by the FDA in the United States (FCC IV/FDA). In addition to this, the products must also conform to the specifications as laid down by the various local regulatory bodies in other countries, including those of the British Pharmacopoeia (BP-93), the US Pharmacopoeia / National Formulary (USP-23/NF-18) and the Joint European Community on Food Additives (JECFA 1991). Vanillin and ethyl vanillin are classified as a synthetic GRAS chemical by the FDA in the United States. Vanillin obtained either from lignin or guaiacol is classified as “synthetic” in the USA and as “nature-identical” in the European Union. Due to the fact that vanillin is classified as GRAS, there are no special registration or regulatory requirements for p-cresol-derived vanillin, provided that the FCC specification is met and that current good manufacturing practice guidelines are followed.
3.4 Raspberry Ketone
3.4.1 Market Demand
Para-hydroxybutanone is commonly known as Raspberry Ketone. It is primarily used to impart a raspberry flavour or fragrance to various compounds. Up until the late 1960’s it was primarily produced via a natural extract from raspberry juice, however this was not commercially viable. After it was discovered that raspberry ketone serves as an intermediate for the production of p-acetoxyphenyl butanone, the active sex attractant of the Asian melon fly, research into its synthetic production began. The USA had a great interest in this pheromone, as the melon fly was a great threat to the commercial pineapple crops in Hawaii and Guam. The melon fly however never reached Guam and research efforts in the USA ceased.
PART 3 – AROMA CHEMICALS from PETROCHEMICAL FEEDSTOCKS
Copyright FRIDGE (2004) Page 41
In Asia, the melon fly continued to damage melons, pineapples and other fruits. The Japanese government therefore continued the research programme into the synthesis of raspberry ketone. Whereas Western producers (IFF, Firmenich, Givaudan etc.) were the major producers of raspberry ketone, the agricultural needs for the product in Asia shifted production to this area. Takasago, based in Japan, is now the major supplier of this critical, but low volume, aroma chemical. Few available sources give information on the raspberry ketone market, and most disagree on its size. In 1996, Chemical Marketing Reporter estimated the global market at 120 tons per annum. According to this source, most raspberry ketone is used to produce the pheromone ingredient, Cue-Lure and as the raspberry flavouring. A much smaller end-use is in fragrances. The split was estimated at 100 tons being used to produce Cue-Lure, with 18 tons in flavour applications and 2 tons for other flavour derivatives. A more recent market survey22 estimated the world consumption of synthetic raspberry ketone to be in the order of 200 tons per annum. The demand for application in flavour and fragrances is outlined in Table 14 below.
TABLE 14: Flavour and Fragrance purchasers of Raspberry Ketone
The low volume of consumption has resulted in suppliers disappearing whenever market conditions changed. In recent years, this aroma chemical has been produced by a number of Western producers including Givaudan, IFF, Dragoco (now Symrise) and others. No US producer remains. All commercially available raspberry ketone is manufactured in Asia, Takasago being the major supplier of this product. Other significant manufacturers are based in China and India. The major producers, their reported capacities are shown below.
22 Dr Rob Bryant: Brychem
PART 3 – AROMA CHEMICALS from PETROCHEMICAL FEEDSTOCKS
Copyright FRIDGE (2004) Page 42
TABLE 15: Raspberry Ketone Production (tons per annum)
Producer Capacity Ogawa (Japan) small Takasago (Japan) 40 Dragoco (India) 50 Hangzhou Flavours and Fragrances (China)
50 - 70
Other Chinese 20 - 30 Total 170 - 190
3.4.3 Price
Pricing in 1992 was in the order of $ 44 – 55/kg. The low usage in the flavour and fragrance industry, together with its secondary use in the production of the pheromone intermediate, kept its prices fairly constant. Moreover, demand is inelastic, with little volume increase seen at appreciably lower prices. As a number of third world producers of this product emerged in China, prices reduced to the $30/kg level in 1996. The global price for raspberry ketone appears to be particularly volume sensitive. Prices range from $14.00/kg for lots of several tons to $18.00/kg for lots of 1 ton. The price increases significantly for smaller lots, with prices of up to $30.00/kg for lots of 25kg.
3.5 Menthol23
3.5.1 Background
Mint oils and their derivatives represent the third largest taste trend worldwide, outranked only by vanilla and citrus. The popularity of mint derivatives is based on a combination of its pleasant taste as well as its association with freshness, cleanliness and hygiene. Mint oils are obtained from the genus Mentha and are primarily obtained by steam distillation of the fresh herbage of the mint plants. There are two types of mint oils recognised in the trade – the peppermint and the spearmint groups.
23 References: Menthol: An Aroma Chemical Profile; G.S. Clark Perfumer and Flavorist Vol 23, 1998 The International Market for Mint Oils and Menthol: S Watts, AMC Chemicals, IFEAT Conference 1999 The Menthol Industry in India: S Jindal, Jindal Drugs, IFEAT Conference 1999
PART 3 – AROMA CHEMICALS from PETROCHEMICAL FEEDSTOCKS
Copyright FRIDGE (2004) Page 43
The two commercial types of “peppermint oils” are derived from two distinct species: • Mentha arvensis (cornmint) containing 70 - 80% menthol. • Mentha piperita (peppermint) containing 40 – 43% menthol.
Peppermint is grown mostly in the USA as a temperate climate crop, mostly in the states of Oregon, Washington, and Idaho. It is grown by means of highly efficient, mechanised agricultural techniques on large commercial farms. Natural peppermint oil is derived from steam distillation of this plant using capital intensive and technologically sophisticated techniques. It is expensive and is therefore mostly used in this form as a natural peppermint flavour. Peppermint oil from the USA contains approximately 50% menthol and is not used for menthol production. Cornmint in contrast is grown mainly in India and China as a tropical or subtropical crop. It is a simple, labour-intensive process with 2 – 3 harvests each year. Crop procedures practiced in India are to inter-crop cornmint with other food crops thereby improving the yield. The crop is removed from the soil, and rotated in a three-crop per year system using cornmint, followed by potatoes and then by one of several other crops. The oil itself is rarely used as a natural peppermint flavour, instead being used as a source for naturally derived menthol. The product of primary distillation of the herbage of cornmint is subjected to the partial removal of menthol by crystallisation. The menthol thus derived is therefore essentially an agricultural crop subject to all the vagaries of such production. After processing the menthol, the residual cornmint oil known as dementholised cornmint oil, still containing around 40% menthol, is offered on the market for flavouring applications. Spearmint also plays a major role in the mint oil industry. Two commercial types are obtained by steam distillation of two distinct species: Mentha Spicata and Mentha cardiaca. The origin of both oils is the USA. The major component of spearmint oils is carvone. These oils are not discussed further. Due to the susceptibility of mint crops to weather conditions, the general variability of agricultural crops, wild price fluctuations associated with failed crops, and mint oil gluts after good harvests, the idea of developing a synthetic mint flavour became increasingly popular after 1925. A fully synthetic peppermint flavour can now be obtained by using synthetic menthol alone or in conjunction with some of the other major components found in peppermint oil. Synthetic producers have taken market share from natural menthol producers on the platform of long-term price, supply and product quality.
PART 3 – AROMA CHEMICALS from PETROCHEMICAL FEEDSTOCKS
Copyright FRIDGE (2004) Page 44
3.5.2 Market Demand
Menthol has the largest world demand amongst the mint products. The world market for menthol is met by both natural and synthetic material and total demand is in the order of 12,000 tons. Technically, natural menthol can be fully substituted by synthetic menthol. However, given a certainty of supply, most customers will prefer to use natural menthol although some customers prefer synthetic due to the lower commercial risks of supply with more stability of price and delivery. Menthol is a mature and well-established product but demand is strong and growing. The menthol market is growing at 4 – 5% and has considerable potential for expansion as consumer demand for peppermint flavoured products increases in developing nations. Growth is linked to the market for consumer products, in particular personal care products, which tend to show good growth with an improvement in the economic climate of developing countries. The highest growth rates are therefore found in Asia, particularly in India and China. The applications for menthol are dominated by its use in oral hygiene products and pharmaceuticals with secondary applications in menthol cigarettes, chewing gum and confectionery. In India, menthol is used in pan confectionary products, accounting for close to 50% of the total domestic market. Pan is consumed as a breath freshener. It is considered to be addictive, and in India fears are that it causes cancer of the mouth. There is therefore a possibility that the Indian government may ban its use. It this happens the menthol market will be negatively affected.
TABLE 16: Regional Demand for Menthol 1999/2000
Region Tons Growth
(%/ year ) USA and Canada 2,300 2 Europe 2,600 3 Japan 700 2 S.E. Asia, Australia and New Zealand 1,700 5 India 2,400 5 China 1,400 5 South America 700 4 Africa 200 4
TOTAL 12,000
PART 3 – AROMA CHEMICALS from PETROCHEMICAL FEEDSTOCKS
Copyright FRIDGE (2004) Page 45
The market demand for menthol in its major applications is as follows.
TOTAL 12,000 100 The major purchasers of menthol are the large toothpaste and mouthwash manufacturers as well as the flavour and fragrance houses. In general, the toothpaste manufacturers compound their own specific flavours, whereas the flavour and fragrance houses develop and compound flavours for the smaller dental care manufacturers, confectioners and pharmaceutical manufacturers. In the developed world, about 90% of menthol usage is consumed by 10 companies. In the developing world, the market is split between those large companies and many small ones. Some of the major customers of menthol worldwide therefore include Colgate Palmolive, Unilever, Proctor and Gamble, Phillip Morris, RJ Reynolds, GlaxoSmithKline, Quest International and IFF. Table 18 lists the annual usage in 2000 of some of the larger menthol users, together with their anticipated growth in demand for the next 5 – 10 years.
PART 3 – AROMA CHEMICALS from PETROCHEMICAL FEEDSTOCKS
Copyright FRIDGE (2004) Page 46
Table 18: Menthol usage by Customer24
Customer Tons Annual Growth
(%) Colgate Palmolive 800 4
Procter and Gamble 400 1
Unilever 600 4
Kao 500 4
Lion 500 5
Philip Morris 300 1
Brown & Williamson 200 0
R.J. Reynolds 200 0
Beecham 200 2
Warner Lambert 100 2
Lorrilaard 100 0
IFF 50 2
TOTAL 3,950
The dealer-broker system is very active in supplying the natural menthol market. This system has historically led to natural menthol being the victim of speculators and wheeler-dealer type resellers. The spot market, comprising 2 – 5% of sales in Europe and North America, is accomplished through these dealers and brokers. Sales in this market are in the order of 10 - 25 kg. Most spot market use is in Asia, where the users tend to be smaller companies. Larger Western users purchase on an annual supply contract. Covering further forward than this is generally perceived as being risky due to the volatility of the market as it is an agricultural crop. The dealer system has however in many instances in spite of contracts, been notoriously unreliable. This system has lead to many users holding up to 2 years stock to guard against market shortages and price volatility. Synthetic producers have elected to set up their own systems of supply by using their own subsidiaries in countries which have them, and use agents in those where they do not have representation.
24 Cameron & Stuart: Communication
PART 3 – AROMA CHEMICALS from PETROCHEMICAL FEEDSTOCKS
Copyright FRIDGE (2004) Page 47
3.5.3 Synthetic Menthol Applications
Consumer preference drives the demand for the various mint-flavoured products. In some applications, e.g. tobacco products, the importance of taste and consistency to the consumer causes many manufacturers to be reluctant to change their source of menthol. Synthetic menthol tends to find higher application in those products where taste is less important than the issue of cost. It is therefore used primarily in oral hygiene and shaving products. The use in these applications has at times been as high as 100% of formulas as manufacturers seek to stabilise the overall menthol cost by minimising the use of natural menthol. Tobacco products use a maximum level of 50% due to the impact synthetic menthol has on overall taste. For marketing purposes, major US tobacco companies prefer to use natural menthol exclusively. The trend in confectionaries and chewing gum is toward natural menthol. In pharmaceuticals, the use of synthetic vs natural depends on the individual company’s polices and the product itself. 3.5.4 Production
Prior to World War II, China and Japan were the only sources of natural menthol. Synthetic menthol was produced by European and Japanese flavour and fragrance houses usually from citronellal-based feedstocks. In 1941, the supply of natural menthol was disrupted, and this encouraged Brazilian entrepreneurs to begin planting Mentha arvensis mint and producing cornmint oil and menthol. Brazil rapidly replaced China and Japan in occidental markets, and in the 1960’s reached a production level of over 3,000 tons per annum of menthol. The market in the 1960’s saw great competition, with a corresponding price decrease and hence a drop in interest in planting cornmint in Brazil. This price depression eventually led to a menthol shortage in 1974, when prices increased dramatically. During the 1960’s, increasing consumption of menthol led various chemical companies to investigate the production of synthetic menthol. Menthol, after vanillin, has the highest volume of consumption. By 1974 SCM Glidco, Haarmann and Reimer and Takasago had entered the synthetic market. China expanded production of cornmint but Brazil’s plantings decreased due to unfavourable economics. In 1978, Haarmann and Reimer opened a 1,100 ton plant in the USA at the same time that China increased its plantings of cornmint. This over-supply led to depressed prices. In 1985, Takasago built a new synthetic menthol plant based on pinene as feedstock. This facility was more versatile than its previous facilities as it is capable of producing a number of chiral chemicals. Takasago is hence not be locked into a single-product system.
PART 3 – AROMA CHEMICALS from PETROCHEMICAL FEEDSTOCKS
Copyright FRIDGE (2004) Page 48
In the 1980’s, China began to have supply problems due to its socio-political restructuring. Internal consumer demand began to take precedence over export policies and Chinese raw materials began to display tightness in supply. Coupled with Brazil’s decrease in supply, prices again increased and another supply shortage was experienced. As China has begun the process of opening up its doors, the world’s major chewing gum, cigarette, flavour and fragrance, and toothpaste manufacturers have made investments in new production facilities in China with the aim of satiating this country’s growing internal consumer demand. This growing internal demand for aroma chemicals for both domestic consumption and export of finished products in China rose dramatically over the period 1985 – 1996. This added demand was given preference over the export of raw materials. In addition, the export of finished flavour and fragrances resulted in more favourable foreign currency earnings than the export of simple raw materials. The industrialisation of China has also lead to new factories being built on the limited farmland available in a country where only 15% of the land is arable. The combined result of all of these factors has been a decrease in supply of menthol from China to the outside world and an increase in prices over 1995 – 1997. The almost total withdrawal from China from the market in 1996 led to prices increasing dramatically. The gap in the market left by China has been taken up by India who continues to dominate the menthol market. In 1989, government policy in India favoured private development of a menthol industry with the result that India has now emerged as a significant source of natural menthol. As Indian producers began to enter the market with significant quantities, the price of menthol again sagged. Production of isolated natural menthol worldwide is currently estimated at around 9,000 – 10,600 tpa. This accounts for 80% of the world’s supply, the balance of the market is supplied by synthetic material. The world supply of menthol is always in a dynamic state due to its primary source being that of an agricultural crop. Matters are further complicated as the mint oil itself has a long shelf life and can be stored for up to five years. Large crop overhangs can therefore influence the price for many years. Production estimates for synthetic and natural menthol in 2000 are shown in the table below.
PART 3 – AROMA CHEMICALS from PETROCHEMICAL FEEDSTOCKS
Copyright FRIDGE (2004) Page 49
TABLE 19: Menthol Production 2000
Producer Country Type Production (tpa)
Jindal Drugs India Natural 2,500 Various South America Natural 400 - 500 Various (Bhagat, Hindustan Chemicals, Rupangi Chemicals & Allied Industries etc.)
India Natural 4,500
Various China Natural 2,000 - 2,500 Various Far East Natural 600 Symrise Germany,
USA Synthetic 1,500
Takasago Japan Synthetic 300 - 1,000 Various India Synthetic 200 - 230 TOTAL 12,000 – 13,330
India In India, cornmint is cultivated by over 200,000 farmers on small plots, each generating small volumes (hundred kgs). There are around 10,000 small and large distillation units with a capacity to produce 20,000 tons of cornmint oil during the distillation period. The installed capacity for processing menthol in India was crudely estimated at 10,000 tons in 1999. However, this may not be completely accurate as there are a large number of processors and they tend to pool capacity to meet a large order obtained by any one of them. This system is based upon a low-capital investment and the potential for rapid expansion of output. Even factories crystallising menthol from cornmint oil are relatively low-cost investments that can be quickly repaired or expanded. Jindal Drugs is the largest producer of natural menthol, with a capacity of over 2,000 tons per annum. Many small producers operate in India, with a collective capacity of over 4,000 tons per annum. It is thought that India will continue to be the dominant menthol producer as it has no land problem and the government has an agricultural subsidy programme which indirectly assists the mint farmers. During the development of this industry in India, India moved to a unique cultural system. Mint is now grown as an annual, rather than as a semi-perennial. This system allows production of several different crops on the same plot throughout the year thereby maximising land productivity and returns. At the end of the mint season it is replaced by another crop, and in due course a different third crop is grown.
PART 3 – AROMA CHEMICALS from PETROCHEMICAL FEEDSTOCKS
Copyright FRIDGE (2004) Page 50
The Indian cornmint crop is also high in menthone content, as much as 20%. As a result a number of synthetic plants have been built producing menthol via the reduction of menthone. In 2000, the potential existed for a further 4,000 tons of menthol via this route. India therefore plays an important role in setting the price of menthol and its derivatives on the world market. China China’s production system is different to India as it has larger fields. Production is nevertheless subject to the same agricultural problems of weather, crop failure and the need for crop rotation. The capacity of the each crystalliser is difficult to estimate, but China is thought in total to produce approximately 2 – 2,500 tpa menthol annually. Not all of this product may however be produced from locally grown cornmint, as China in addition purchases crude Indian cornmint oil, powdered and finished Indian crystalline menthol which it repurifies and sells on at a premium. In the long-term, China may not remain as a cornmint producer as it has limited arable land, but it will likely remain a major force in the downstream processing of menthol itself. Far East There are a number of producers in this region. Dayspring and Nagoaka produce from imported Indian cornmint oil. Small amounts of menthol are produced from cornmint oil grown in North Korea and Thailand. South America Brasway is the largest producer in Brazil, producing 200 – 300 tons menthol annually by recrystallising Chinese or Indian menthol. Yah Sheng Chong has an estimated production of 100 tons per annum, produced from either imported cornmint oil from China or recrystallised Indian menthol. The Paraguayan company produces menthol from locally grown cornmint at a production capacity estimated at around 100 tons per annum. Symrise (Ex Haarmann and Reimer) Symrise is a company formed from the merger of Haarmann and Reimer and Dragoco. Symrise has two synthetic menthol plants, one in the US with a capacity of 1,200 tons per annum and the other in Germany with a capacity of 300 tons per annum. The plant in the US also produces 200 tons of racemic menthol. Symrise, as Haarmann and Reimer, used to be owned by Bayer a chemical company in Germany producing m-cresol as a by-product. This cresol is alkylated to thymol, and then hydrogenated to a mixture of menthol isomers (hexahydrothymol). Racemic menthol is separated from this mixture by high-
PART 3 – AROMA CHEMICALS from PETROCHEMICAL FEEDSTOCKS
Copyright FRIDGE (2004) Page 51
platage distillation and the remaining isomers recycled. This racemic menthol was transferred to Symrise for resolution to menthol via transesterification with methyl benzoate to racemic menthyl benzoate. This racemate is then resolved into pure menthol by selective crystallisation using controlled seeding in specially designed equipment with precise temperature control. The isolated crystalline esters are converted back into the alcohols yielding pure menthol isomers. The l-menthol is further crystallised to remove impurities, and the d-menthol is recycled. As Symrise is no longer part of Bayer, they now purchase racemic menthol as a third-party. This has most likely increased its cost of production. Symrise is forward integrated into the synthetic peppermint oil flavour business, and have a peppermint oil capacity in the region of 1,000 tons. Takasago This company has produced menthol over the past 20 years using such feedstocks as thymol, limonene, isoprene, and citronellal. Their current process is based on beta-pinene which is converted to myrcene, and the further converted to d-citronellal and subsequently to menthol. As their feedstock is already optically active, there is no need to resolve a racemic mixture as is the case in the Symrise process. Menthol is produced on a multipurpose plant, giving the company some flexibility, but also potentially giving rise to some problems with contamination of the final product’s organoleptics. Displayed capacity has been reported to be as low as 300 tons, but could go as high as 1,000 tons if dedicated to menthol. Takasago would have to reduce sales of hyroxycitronellal to gain more menthol production. Other Synthetic Producers Keith Harris produces menthol from l-piperitone found in native Australian Eucalyptus Dives oil. Camphor and Allied produces menthol mostly for the local ����� ���� ����������������������! �"#��$�$&%�$���$ '
-carene, which is found in Indian turpentine oil, through a multi-step process.
3.5.5 Price
Mention has been made of the ups and downs of the menthol price. The price movements of menthol arise from its demand being inelastic. A shortage of as little as 100 tons can result in dramatic price increases of up to 200 – 300%, and even a slight oversupply can cause prices to fall by as much as 50%. The menthol market has typically experienced one of these pricing cycles every 8 – 10 years. The figure below illustrates very clearly the problem that cyclically appears when an agricultural commodity such as menthol suffers from under- or over-pricing over a number of
PART 3 – AROMA CHEMICALS from PETROCHEMICAL FEEDSTOCKS
Copyright FRIDGE (2004) Page 52
years. Any rise in price tends to raise farmer’s hopes, giving rise to overproduction followed by low prices. Farmers do not plant to meet market demand, but make their decisions based on the ruling prices of crude oils on the day and the price for alternative crops. This leaves the market vulnerable to large surpluses and shortfalls.
FIGURE 8: Natural Menthol Spot Prices
0
10
20
30
40
50
60
70
80
1960 1965 1970 1975 1980 1985 1990 1995 2000
$/kg
As a result of this price volatility, most large consumers purchase their requirements on forward contract. Most natural menthol is sold via a dealer network where the dealer insulates the consumer from this risk to a large extent. Synthetic product is sold direct to the customers. Natural contracts tend to be 6 – 12 months, and synthetic contracts up to 3 years. 3.5.6 Registration and Regulatory Requirements
The organoleptic property of menthol is extremely important. Approval processes can therefore be lengthy and complex. The quality of the menthol is the primary priority and all products must meet the stringent FCC specification for both physical and chemical properties. Synthetic menthol is classified as GRAS by the US FDA.
PART 3 – AROMA CHEMICALS from PETROCHEMICAL FEEDSTOCKS
Copyright FRIDGE (2004) Page 53
4 VALUE CHAIN ANALYSIS
The value chain for the portfolio of Aroma and Fine Chemicals is shown in Appendix 1. Analysis of this value chain identified a number of business drivers. Of the products within the proposed portfolio, the major markets are for menthol, vanillin, and pAA. The major use for pAA is in its use as an intermediate in the OMC market. The use of pHB in the production of other products such as raspberry ketone is small and there is no longer a market for the pHB in the manufacture of trimethoxybenzaldehyde. The key market for pHB is therefore its use for conversion through to pAA and vanillin as these are the only markets that can support a reasonably sized plant.
4.1 Menthol
Access to the menthol market is probably the major driver in this business as there are only a few established synthetic suppliers. The key issue is therefore that of cost competitiveness against existing synthetic producers. The CSIR technology allows the cost-effective enzymatic resolution of the required menthol isomer from the mixture of isomers in the hexahydrothymol mixture. Furthermore, further cost advantage is conferred by backward integration to m-cresol produced as a by-product of the novel CSIR oxidation of a mixed cresol feedstock. The technology package therefore has a competitive advantage in the full value chain. The technology for the production of menthol from the m-cresol natural arising of the pHB oxidation must therefore be cost-competitive against existing synthetic producers.
4.2 p-Anisaldehyde
The major competitor in the production of pAA is Atul in India. Atul has successfully become the market leader over the last few years, and driven a number of competitors out of the business. A clear business driver is therefore the position of cost leadership. Any new entrant into the business must have a significant cost advantage over Atul. It is critical that the technology demonstrate overall competitiveness in terms of its full integration through to the production of pAA from the mixed cresol feedstock.
The major end-use market for pAA is in its conversion to OMC. Access to this market is therefore another critical business driver. The cost leader and major competitor in the production of OMC is BASF via a non-pAA technology. Since the entry of BASF into the OMC market in 1995 with new non-pAA based technology, Symrise and other OMC producers using pAA have come under increasing cost pressure. BASF’s aggressive market entry strategy has caused the OMC price to decline from above $20.00/kg to $12.00 - 14.00/kg. Although pAA producers have been pressured to reduce prices, the pAA price has not decreased to the same extent over the same period. It is therefore considered important
PART 3 – AROMA CHEMICALS from PETROCHEMICAL FEEDSTOCKS
Copyright FRIDGE (2004) Page 54
that the economics of the production for OMC from pAA vs the cost leader BASF is understood.
4.3 Vanillin
The existing dominant producer, Rhodia is the only really significant competitor to be considered by a new entrant. The key business driver in the vanillin business is therefore to have a technology that can compete on a cost basis with Rhodia’s process. The technology must therefore demonstrate overall competitiveness in terms of its full integration through to the production of Vanillin.
PART 3 – AROMA CHEMICALS from PETROCHEMICAL FEEDSTOCKS
Copyright FRIDGE (2004) Page 55
5 BENCHMARKING ANALYSIS
5.1 The CSIR pHB-pAA Technology
During 2000 and 2002 AECI undertook a number of competitor analyses to benchmark the pHB-pAA technology developed against various producers of pAA and aroma chemicals. This was done within an Aroma and Fine Chemicals strategic framework where a basket of products derived from the intermediates, pHB, pAA and m-cresol, were targeted for commercialisation. The main conclusion reached from these studies was that AECI would be able to be world competitive in aroma chemicals, providing OMC and menthol were the main pull through products for the pAA and m-cresol intermediates, should the complex based on this new technology. A basket of smaller volume aroma products would benefit from the economy of scale of an integrated aroma chemicals complex. All commercial pAA technologies are based on a two-step process route involving oxidation and methylation of the starting raw material p-cresol. The routes differ in the sequence in which the oxidation or methylation step takes place, and the nature of the chemistry employed for each step. All commercial processes require a relatively pure source of p-cresol as raw material feedstock. The novelty of the CSIR developed technology resides in the selective oxidation of p-cresol to pHB from a feedstock consisting of mixture of p- and m- cresol. A pure stream of by-product m-cresol can be recovered for sale, or subsequent conversion to other useful aroma or fine chemicals. Historically mixed m-cresol, p-cresol (MP) feedstocks have been cheaper than p-cresol.
5.1.1 Methodology of Competitiveness Analysis
The general methodology adopted for carrying out the competitive analysis was to benchmark the cash cost of production of a producer using the technology concerned with that of the world cost leader of the specific product. For the purpose of the analysis, cash cost of production was defined as the sum of the variable and fixed costs, nett of any by-product credits. Where multiple sequential process plants were required to produce the product through a series of intermediate products, these intermediates were transferred at their respective cash cost of production. The processes were benchmarked on an international basis in US$.
Variable costs were determined from unit usages of all raw materials (including the intermediates), utilities and services that could be reasonably estimated for the process, and the corresponding transfer or commercial input prices. Because the Inside Battery Limits plant approach was adopted, all utilities and services were assumed to be purchased at battery limits. These input prices were based on that determined by AECI in 2001 for its Richards Bay site. The fixed costs included depreciation. The fixed costs elements were calculated as follows:
PART 3 – AROMA CHEMICALS from PETROCHEMICAL FEEDSTOCKS
Copyright FRIDGE (2004) Page 56
• Maintenance material (1): 2.0% of inner battery limit capital cost • Maintenance labour (2): 2.0% of inner battery limit capital cost • Manpower (3): 7.5% of inner battery limit capital cost • Site & General Overhead: 1.2% of inner battery limit capital cost
(= 10% of 1+2+3) • Depreciation: 10% of inner battery limit capital (straight line) • Selling & Admin Costs: 0.5% of sales
The inner battery limit capital costs of the different process plants had been determined by Ardeer Engineering (Pty) Ltd at various stages of their development either commissioned by AECI or the CSIR. Where detailed information of a competitor’s processes were not obtained through competitor intelligence networks that had been set up by AECI, techno-economic modelling of the process had been done based on open literature and patent information.
The objective of this benchmarking exercise is to assess the competitiveness of a producer investing in a plant in South Africa employing the pHB-pAA technology developed by the CSIR and supplying pAA and naturally arising m-cresol into the world markets for these products. Two issues with respect to the competitiveness of the technology have been assessed:
• The economy of scale of a plant based on the new pHB-pAA technology • The competitiveness of a South African based pAA producer opposite the
lead world pAA producer 5.1.2 The Economy of Scale of the pHB-pAA Technology
The economy of scale of a production plant indicates how the capital investment per unit of production relates to the plant capacity and shows at what capacity the effectiveness of capital invested would reach a minimum. This is important as it determines whether the technology, irrespective of its competitiveness, will result in an investment case at the plant capacity contemplated. This relationship for the pHB-pAA technology developed by the CSIR is shown in figure 9. The chart shows that the capital cost per unit capacity plateaus to around $5/kg pAA at about 2,500 tpa. No substantial further capital cost benefit will be derived for a plant exceeding this capacity. Conversely, any plant built that has a smaller capacity will not benefit from the economy of scale and might not yield investment economics.
PART 3 – AROMA CHEMICALS from PETROCHEMICAL FEEDSTOCKS
Copyright FRIDGE (2004) Page 57
FIGURE 9: Economy of Scale of CSIR pHB-pAA technology
1.00
3.00
5.00
7.00
9.00
11.00
13.00
15.00
0 500 1,000 1,500 2,000 2,500 3,000 3,500 4,000
Capacity (tpa)
Cap
ital I
nten
sity
(US
$ m
ill/k
t)
PHB Plant PHB/PAA
5.1.3 Competitive Analysis of pAA Producers
During the 1990’s the main producers of pAA were Atul, Nippon Shokubai, BASF, Laporte (Degussa) and Koffolk. All these producers use/d processes based on p-cresol, only Atul and LaPorte have a captive supply from dedicated plants converting toluene to p-cresol. Nippon Shokubai, BASF and Koffolk buy p-cresol on the merchant market. In 2002, AECI carried out a competitive analysis of these producers based on the cash cost of production of pAA (variable plus fixed costs). Techno-economic data were obtained from reliable AECI business intelligence networks. Long-term predicted average raw material prices formed the basis for the input costs for the analysis. With a p-cresol input price of US$ 2.40/kg assumed for all producers, the Cash Cost of Production for existing and dormant producers was determined, and is shown in figure 10, ranked from lowest to highest cost producer. The high-cost producers LaPorte and Koffolk, were not deemed to be competitive at the prevailing pAA prices levels of less than $6.50/kg, and the chart predicted that these producers would exit the pAA business, given the sizeable capacity overhang
PART 3 – AROMA CHEMICALS from PETROCHEMICAL FEEDSTOCKS
Copyright FRIDGE (2004) Page 58
compared to demand (2000 demand for pAA was 4,500 tonnes per annum). This indeed occurred with LaPorte exiting in 1999 and Koffolk in 2000.
FIGURE 10: PAA Cost of Production Analysis
Cost of Production for PAA vs. Capacity without AECI
4.00
4.50
5.00
5.50
6.00
6.50
7.00
7.50
8.00
8.50
0 1,000 2,000 3,000 4,000 5,000 6,000 7,000 8,000
Cumulative Installed Capacity (Mt)
PA
A C
ost o
f Pro
duct
ion
(US
$/kg
)
Cash Cost of Production Variable Cost of Production
Atul Products (India)
Nippon Shokubai(Japan)
Koffolk(Israel)
La Porte (USA)
BASF(Germany)
BASF was also not competitive at those prices for technical grade pAA, and chose to focus on the upper-end fragrance grade market. Its non-competitiveness in technical grade pAA may have been the reason why BASF forward-integrated into OMC production in 1995. Although BASF is no longer a major producer of technical grade pAA, its fragrance grade pAA, derived from its electrochemical oxidation process, is considered to be the industry standard. The second lowest cost producer, Nippon Shokubai, has a single dedicated pAA plant in Japan, which uses p-cresol as a feedstock. The p-cresol is purchased from the world market.
Atul’s pAA Production Costs The lowest cost producer, Atul has two dedicated single-product pAA plants, both of which use pure p-cresol as a feedstock. Atul produces p-cresol in two plants using toluene as feedstock. Two-thirds of the p-cresol produced by Atul is consumed in the production of pAA, with the remainder being used for captive production of p-cresidine
PART 3 – AROMA CHEMICALS from PETROCHEMICAL FEEDSTOCKS
Copyright FRIDGE (2004) Page 59
and Butylated Hydroxy Toluene, or sold into the local Indian market. pAA is thus the main driver for p-cresol production at Atul. Atul’s cash cost of production for pAA is therefore directly linked to the price of toluene as the raw material for its p-cresol production. Toluene is a commodity chemical and its price is linked directly to the commodity cycle. The following chart shows the effect of the toluene price on Atul’s variable and cash costs of production for p-cresol used in the production of pAA for export.
FIGURE 11: Atul Cost of Production for p-Cresol
1.30
1.40
1.50
1.60
1.70
1.80
1.90
2.00
2.10
2.20
2.30
2.40
160 180 200 220 240 260 280 300 320 340 360 380
Toluene Input Price (delivered, US$/Mt)
p-C
reso
l Cos
t of P
rodu
ctio
n (U
S$/
kg)
Cash Cost of Production Variable Cost of Production
The lowest and highest prices for toluene over a five-year period leading up to 2001 had been $160/ton and $ 380/ton respectively. For Atul, this equates to minimum and maximum cash costs of production for p-cresol of $1.91/kg and $2.33/kg respectively. Over this same period the low and high prices for merchant p-cresol had been $2.20/kg and $2.80 respectively. The figure below shows the equivalent cost of production for pAA for this range of p-cresol prices, assuming p-cresol is transferred at cash cost.
Based on the above assumptions, Atul’s cash cost of production of pAA is estimated to range between a minimum of $ 5.05/kg and a maximum of $5.54/kg. Variable costs account for 84% of the total cash cost.
PART 3 – AROMA CHEMICALS from PETROCHEMICAL FEEDSTOCKS
Copyright FRIDGE (2004) Page 60
FIGURE 12: Atul Cash Cost of Production for pAA
4.00
4.25
4.50
4.75
5.00
5.25
5.50
5.75
6.00
1.90 1.95 2.00 2.05 2.10 2.15 2.20 2.25 2.30 2.35
p-Cresol Input Price (US$/kg)
PA
A C
ash
Cos
t of P
rodu
ctio
n (U
S$/
kg)
Cash Cost Variable Cost
The entry of BASF into the OMC world market in 1995 with a non-pAA based technology, placed significant cost pressure on pAA-based OMC producers to compete. With OMC being the major sink for pAA, this pressure also cascaded down to Atul. Against a rising cost of purchased toluene, a likely option Atul could pursue to reduce production costs of pAA further is to substitute some of its captive p-cresol supply with cheaper Chinese p-cresol at $ 1.70/kg. The effect on Atul’s cash cost of production of pAA of going down this route, is shown in figure 13.
The chart shows that, without taking into account the cost penalty associated with a turned down p-cresol plant, Atul could theoretically reduce its cash cost of production of pAA further from a previous minimum of $5.05/kg to $4.80/kg at 100% substitution with Chinese p-cresol. Without having further intelligence work, it is uncertain how Atul has been managing the price pressure on the supply of pAA.
PART 3 – AROMA CHEMICALS from PETROCHEMICAL FEEDSTOCKS
Copyright FRIDGE (2004) Page 61
FIGURE 13: Atul Cost of Production for pAA - Effect of Using Chinese p-Cresol
4.10
4.30
4.50
4.70
4.90
5.10
5.30
5.50
5.70
0% 10% 20% 30% 40% 50% 60% 70% 80% 90% 100%
Chinese p-Cresol Used (% of Total)
PA
A C
ost o
f Pro
duct
ion
(US
$/kg
)
Cash Cost of Production Variable Cost of Production
5.1.4 The Competitiveness of pAA Production in South Africa
A South African pAA producer based on the CSIR developed pHB-pAA technology would have the flexibility of starting with a feedstock of varying compositions of p-cresol and m-cresol. This could range from pure p-cresol to a mixture consisting of 40% p-cresol and 60% m-cresol, such as the MP99 supplied by Mitsui or Sumika-Merichem. The South African producer’s production cost of pAA would therefore depend on the composition of the feedstock selected. Despite this raw material flexibility, from a reaction chemistry perspective, the ideal composition is a mixture consisting of 50% p-cresol and 50% m-cresol, as would be the case with Merisol’s MP99 and MP96 cresol products. The competitiveness of a potential South African based pAA producer was benchmarked against Atul based on two feedstock scenarios:
• Pure p-cresol • MP96, consisting of roughly 47% p-cresol and 49% m-cresol
PART 3 – AROMA CHEMICALS from PETROCHEMICAL FEEDSTOCKS
Copyright FRIDGE (2004) Page 62
Pure p-Cresol Feedstock Atul’s cash cost of production of pAA compared with that of a South African producer starting from merchant p-cresol, is shown in table 20. The input p-cresol price for the South African producer corresponds to the high and low prices of world merchant p-cresol of $2.80/kg and $2.20/kg respectively over the five-year period prior to 2001. Atul’s input p-cresol price was based on transferring p-cresol at its cash cost of production of p-cresol.
TABLE 20: Comparison of Atul and CSIR Cash Costs of Production
Comparing the cash costs of production of pAA for the two producers on the basis of the high and low input prices of feedstock these two producers would experience, the South African producer would not be competitive opposite Atul. Atul’s lower cash cost of production results from the lower price of p-cresol transferred at cash cost, compared with that of merchant p-cresol, of which the price is set by Butylated Hydroxy Toluene market dynamics, the main sink for p-cresol, and not by the toluene commodity feedstock price variation world p-cresol producers would have to contend with. Should the playing fields be level, in that both Atul and the SA producer purchased Chinese p-cresol, then the South Afircan pAA producer would still not be able to compete with Atul on a cash cost basis as shown in table 21.
TABLE 21: Comparison of Atul and CSIR Cash Cost of Production
Using Chinese p-Cresol Atul CSIR Technology Chinese p-Cresol
($/kg) Cash Cost of pAA ($/kg)
Cash Cost of pAA ($/kg)
High $1.90/kg $5.04/kg $ 5.21kg Low $1.70/kg $4.80kg $ 5.01/kg
This analysis indicates that the cost competitiveness of the CSIR developed pHB-pAA technology does not lie in its p-cresol conversion reaction chemistry (yields and reaction rates), but in its ability to selectively convert a cheaper mixed para
PART 3 – AROMA CHEMICALS from PETROCHEMICAL FEEDSTOCKS
Copyright FRIDGE (2004) Page 63
and meta cresol feedstock that also yields a value added by-product, and that other pAA producers cannot use as starting material.
Merisol MP96 Cresol Feedstock At the time of the AECI Study, it was proposed by Merisol that an appropriate feedstock for the pHB-pAA technology would be M96, a mixed cresol feedstock of 96% purity and consisting of 47% p-cresol and 49% m-cresol. In 2001, Merisol indicated a price of $1.40/kg for this feedstock. The cash cost of production of a South African pAA producer sourcing MP96 at $1.40/kg and selling cresol at different price levels, is shown in figure 14.
The chart shows that a South African pAA producer at economy of scale production of 2,500 tpa, supplied with MP96 would be competitive against Atul, and to maintain a competitive position, it would be necessary that the m-cresol selling price should not fall below $1.80/kg.
FIGURE 14: Cash Cost of Production – South African pAA producer vs Atul
The South African pAA production costs are tabulated below at $ 1.40/kg MP96 and selling m-cresol at $ 1.80/kg.
PART 3 – AROMA CHEMICALS from PETROCHEMICAL FEEDSTOCKS
Copyright FRIDGE (2004) Page 64
TABLE 22: South African pAA Cash Cost of Production
$/kg % Net Cresols 1.90 39 Caustic Flake 0.63 13 Methyl Chloride 0.35 7 Other Raw Material Costs 0.52 18
Total Raw Material Costs 3.39 70 Utility Costs 0.35 7 Fixed Costs 1.14 23 Total Cash Cost of Production 4.87 100
Figure 15 demonstrates the breakdown comparison of the South African producer’s costs vs Atul’s cost for their respective high and low cash cost of production.
FIGURE 15: Comparison of Atul and SA pAA Production Costs
-
1.0
2.0
3.0
4.0
5.0
6.0
SA Low (m-cresol $ 2.50/kg)
SA High (m-cresol
($1.50/kg)
Atul (low) Atul (High)
$/kg
Variable Costs Utilities Fixed Costs
This graph clearly demonstrates that the South African producer’s cost advantage is as a result of the technology using the mixed cresol and hence generating m-cresol as a natural arising, provided that this m-cresol can be sold at a price over $ 1.80/kg.
PART 3 – AROMA CHEMICALS from PETROCHEMICAL FEEDSTOCKS
Copyright FRIDGE (2004) Page 65
5.1.5 Key Issues and Conclusions
The competitiveness of a South African pAA producer employing the CSIR pHB-pAA technology has been benchmarked against Atul by analysing their respective cash costs of production (defined as the sum of the variable and fixed costs associated with producing pAA). Such a producer would not be competitive should it base its operation on pure p-cresol sourced on the world market. The producer would however, be able to compete and retain its competitive position should it source MP96 at the benchmark purchase price of $1.40/kg indicated in 2001, and sell the naturally arising by-product m-cresol at prices greater than $1.80/kg. The question as to whether the facility would have investment economics will be answered in the techno-economic study.
5.2 The Competitiveness of OMC Production in South Africa
The competitiveness of a South African based OMC producer supplied from a captive source of pAA from an integrated facility opposite the lead world OMC producer will be analysed. The non-pAA technology used by BASF to produce OMC also starts with p-cresol as raw material. BASF does not have a captive source of p-cresol, it therefore purchases its feedstock on the world merchant market. The cash cost of production of OMC at BASF hence varies with the movements in price of world merchant p-cresol. The cash cost of production for OMC at BASF as a function of its p-cresol input price is shown in figure 16 over the same range of highs and lows previously discussed. At the upper p-cresol price of $2.80/kg, BASF’s cash cost of production for OMC is $ 5.92/kg, and at the lower price of $ 2.20/kg, $ 5.52/kg.
PART 3 – AROMA CHEMICALS from PETROCHEMICAL FEEDSTOCKS
Copyright FRIDGE (2004) Page 66
For Symrise, the second lead producer of OMC, to compete with BASF at these cash costs of production for OMC, it would need to purchase pAA at input prices of $ 5.45/kg and $4.74/kg, corresponding to BASF’s high and low cash costs for OMC, as shown in figure 17 below.
FIGURE 17: Symrise Cash Cost of Production
4.00
4.50
5.00
5.50
6.00
6.50
7.00
4.00 4.50 5.00 5.50 6.00 6.50 7.00
pAA Input Price ($/kg)
Cas
h C
ost o
f OM
C ($
/kg)
Symrise OMC CCoP High - BASF CCoP Low - BASF
These are extremely low selling prices for pAA and it is doubtful whether there are any pAA producers that will be able to match these price demands. The competitiveness of producing OMC in South Africa from a facility with integrated pAA and OMC plants were benchmarked against BASF. In line with the assessment framework followed for pAA, the facility would produce only OMC and the naturally arising m-cresol by-product. Competitive enhancement through producing additional aroma or fine chemical intermediates has been ignored, but will be assessed through the techno-economic model evaluation later. The OMC cash cost for such a facility has been estimated and the results are shown in figure 18. The chart shows the cash cost for a South African producer at input prices for MP96 varying between $1,20/kg and $1.60/kg at two levels of m-cresol prices, $1.80/kg and $2.30/kg. Included in the chart are the high and low cash cost for OMC production at BASF. The outcome of this analysis is that a South African OMC producer with a captive source of pAA from a dedicated pAA plant will be able to compete on a cash cost basis with BASF over the MP96 price range $1.20 – 1.50/kg selling m-cresol at $ 1.80/kg. The question as to
PART 3 – AROMA CHEMICALS from PETROCHEMICAL FEEDSTOCKS
Copyright FRIDGE (2004) Page 67
whether the facility would have investment economics will be answered in the techno-economic study.
FIGURE 18: Cash Cost of Production of pAA-based OMC in South Africa
BASF’s cash cost of production at the two indicated p-cresol prices is outlined below.
TABLE 23: BASF OMC Cash Cost of Production
p-Cresol ($2/20/kg)
p-Cresol ($2.80/kg)
p-Cresol 1.46 1.86 Other raw materials 1.61 1.61 Utilities 1.13 1.13
Total Variable Cost 4.20 4.60 Fixed Costs 1.32 1.32 Total Cash Cost of Production
5.52 5.92
Fixed and utility costs therefore account for between 41 and 44% of the BASF cost of production. Hence, as was the case with the Rhodia European vanillin business, the
PART 3 – AROMA CHEMICALS from PETROCHEMICAL FEEDSTOCKS
Copyright FRIDGE (2004) Page 68
strengthening of the Euro will have had a major impact on the profitability of BASF’s business.
5.2.1 Key Issues and Conclusions
A far greater stumbling block than competitiveness of the technology against Atul, is the pAA prices now required by a pAA-based OMC producer to compete with BASF on a cash cost basis. These estimated prices are in the range of $4.80 - 5.50/kg, and are extremely low compared to market pAA prices of $6.00 - 6.50/kg prevailing during 2001. It is doubtful whether these pAA prices could be matched on a plant based on any of the current practiced or developed pAA technologies. A new supplier of pAA into the international market will have to supply the largest portion of its capacity into the OMC market sector. In order to persuade current purchasers of pAA to switch suppliers, it is highly likely that the supplier will have to reduce its pAA price into the range at which the OMC producer can compete against BASF on a cash cost basis. At these prices, the South African producer will have very little margin remaining to reward the capital investment. A South African producer of OMC back integrated to a pAA plant using the CSIR developed technology would however, be competitive against BASF on a cash cost basis, providing it can source a MP96 type feedstock at the purchase prices indicated by Merisol in 2001, and can obtain a m-cresol credit corresponding to prices exceeding $1.80/kg. The economy of scale analysis of the CSIR pHB-pAA technology would suggest that for the facility to be based on robust economics, the pAA plant would have to have a capacity exceeding around about 2000 tpa.
5.3 The Competitiveness of Vanillin Production in South Africa
The competitiveness of a producer investing in a plant in South Africa employing the pHB-vanillin technology developed by the CSIR and supplying naturally arising m-cresol into the world markets for this product has been assessed. Because the world market for ethyl vanillin is only 2,000 tpa compared to vanillin which is 10,500 tpa, ethyl vanillin is unlikely to be a major pull through product justifying the implementation of a large scale pHB plant. It has been shown above that a pHB front-end plant would have to have a capacity exceeding 1,500 tpa for the investment to benefit from economy of scale. Ethyl vanillin has therefore not been benchmarked. The following aspects of vanillin’s competitiveness have been assessed:
• The economy of scale of a plant based on the new pHB-vanillin and ethyl vanillin technology.
• The competitiveness of a South African based Vanillin producer opposite the lead world producer.
PART 3 – AROMA CHEMICALS from PETROCHEMICAL FEEDSTOCKS
Copyright FRIDGE (2004) Page 69
5.3.1 The CSIR developed Vanillin/Ethyl Vanillin Technology
The CSIR vanillin/ethyl vanillin technology has been modified from its original version since the CSIR took over the technology from AECI. The new process route is based on brominating pHB to bromo-pHB (the same for vanillin and ethyl vanillin), then converting the bromo-pHB to either the sodium salt of vanillin (via methoxylation) or the sodium salt of ethyl vanillin (via ethoxylation) via a displacement reaction. After the respective displacement reactions, which follow different process steps for the two products, pure crystalline products are obtained through the same subsequent process steps of acidification, distillation and crystallisation of vanillin/ethyl vanillin.
The economy of scale of either a vanillin or ethyl vanillin plant has been determined based on a capital cost estimate of a 500 tpa ethyl vanillin plant carried out for the CSIR by Ardeer Engineering (Pty) Ltd. For this analysis, the capital cost was amended to exclude utilities.
Because the physical plants for stand-alone production of vanillin or ethyl vanillin are almost identical (except for the displacement step), the capital costs for the two products have been assumed to be of the same order of magnitude.
Figure 19 shows the economy of scale in terms of the capital cost investment per unit plant capacity for a range of plant capacities. This figure indicates that for both vanillin or ethyl vanillin stand - alone plants, a capacity of less than 1,000 tpa would not be a cost effective investment. The western producers of vanillin, Rhodia and Borregaard, have plants of vanillin capacities exceeding 2,500 tpa. Three of the leading Chinese producers all have plants with capacities of at least 1,000 tpa.
FIGURE 19: Economy of Scale for a South African pHB-based Vanillin Producer
5.00
7.00
9.00
11.00
13.00
15.00
17.00
19.00
21.00
0 200 400 600 800 1000 1200 1400 1600 1800 2000
Plant Capacity (tpa)
Cap
ital C
ost p
er U
nit P
lant
Cap
acity
($'M
illio
n/t
vani
llin)
PART 3 – AROMA CHEMICALS from PETROCHEMICAL FEEDSTOCKS
Copyright FRIDGE (2004) Page 70
5.3.2 The Rhodia Vanillin Technology
Rhodia, the cost leader, produces vanillin based on a technology involving the catechol / guaiacol process route. This route to vanillin is complex, comprising four process steps, and involves a number of flammable, toxic and carcinogenic solvents. The AECI intelligence of the Rhodia production costs has not been as extensive as that gathered by AECI from its networks on pAA, OMC and menthol competitors. Most of the perspectives presented in this paper therefore were developed through techno-economic modelling of the process chemistry of the catechol / guaiacol route. Rhodia has a captive supply of the raw material, catechol. It arises as an intermediate on dedicated phenol hydroxylation plants in Rhodia’s plants in the USA and Europe, and is co-produced with hydroquinone in a fixed ratio of about 3t of catechol to 2t of hydroquinone. This ratio is constrained by the process chemistry. Rhodia’s cash cost of production of vanillin is thus primarily driven by the input price of phenol, which follows the global phenol commodity cycle. From a process chemistry model of the phenol hydroxylation process, Rhodia’s cash cost of production of catechol has been estimated to range between $ 2.73/kg and $ 3.11/kg for input prices of phenol ranging between $ 0.60/kg and $ 1.00/kg. Over this range of input catechol prices, the cash cost of production of vanillin was estimated, and the results are shown in figure 20. Credit for the by-product sodium sulphate has been excluded in the calculation so that a direct comparison can be made with the CSIR vanillin technology where it has also been ignored due to non-definition of a sodium sulphate recovery scheme.
FIGURE 20: Cash Cost of Production of Vanillin at Rhodia
7.00
7.50
8.00
8.50
9.00
9.50
10.00
2.50 2.70 2.90 3.10 3.30 3.50 3.70 3.90
Catechol input Price ($/kg)
Cas
h C
ost o
f Van
illin
($/k
g)
PART 3 – AROMA CHEMICALS from PETROCHEMICAL FEEDSTOCKS
Copyright FRIDGE (2004) Page 71
Figure 20 shows that at a maximum calculated input cash cost price for catechol of $3.11/kg, Rhodia would have a cash cost of production for vanillin below $ 9.00/kg.
The exercise was performed in US$ as the Vanillin business is conducted in this currency. In addition, the larger of the two Rhodia plants is in the USA. 38 – 40% of the Rhodia US$-based cash cost of production are fixed and utilities costs, the other input costs being raw materials which are priced in US$. The US cash cost of production was calculated to be in the range of $ 8.39 – 8.75/kg. The rhodia cash cost of production is outlined in more detail below.
TABLE 24: Rhodia US based Cash Cost of Production for Vanillin (Phenol US$ 0.60/kg)
$/kg % of Cash Cost of Production
Phenol 0.54 6.5 Dimethyl Sulphate 1.17 14 Glyoxylic Acid 1.43 17 Other Raw Materials 1.91 23 Utilities 1.04 12 Total Variable Costs 6.09 72.5 Total Fixed costs 2.30 27.5 TOTAL CASH COST of PRODUCTION 8.39 100
The fixed cost of production includes an amortisation and financial charge. This cost would relate to the age of the plant and equipment, although Rhodia’s plants are most likely to be fully depreciated. The Euro has strengthened by 42% between 2001 and 2004. The US$/Euro exchange rate will therefore have an effect on the cash cost of production of the European Rhodia plant. In Europe, at current exchange rates and taking into account the contribution of fixed and utility costs, the European cash cost of production is more likely to be in the region of $ 9.28 – 9.64/kg, translating into an 11% increase over the US cash cost of production. The strengthening of the Euro will have therefore had a major impact on the profitability of the Rhodia European vanillin business. At a selling price of US $ 12.00/kg, the European Rhodia gross margin will have decreased from an average of 29% to 21% during this period.
PART 3 – AROMA CHEMICALS from PETROCHEMICAL FEEDSTOCKS
Copyright FRIDGE (2004) Page 72
5.3.3 Competitive Analysis
The competitive analysis is based on the latest CSIR vanillin technology which has been benchmarked only against the cost leader, Rhodia. A number of assumptions have been made:
• The vanillin plant is back integrated to a dedicated pHB plant based on the novel CSIR selective p-cresol oxidation process.
• The pHB front-end plant is supplied with an MP96 type feedstock of which the m-cresol to p-cresol ratio is substantially 1 to 1.
• The pHB is transferred to the vanillin plant at cash cost. • The naturally arising m-cresol can be sold at market prices ranging between
$ 1.80/kg and $ 2.30/kg. The cash cost of production competitiveness of a South African pHB-based vanillin facility compared with that of Rhodia is shown in figure 21. The figure shows that a South African producer would not be able to compete on cash cost basis with Rhodia for any of the MP96 input prices and m-cresol selling prices considered. The low and high cash costs of $ 10.23/kg and $ 11.89/kg for South African based vanillin production substantially exceeds those achievable by Rhodia. With global commercial prices of vanillin being within the $ 9.00 - $ 12.00/kg expectation band, this would leave little margin for a South African producer to reward capital investment.
FIGURE 21: Cash Cost of Production of pHB-based Vanillin in South Africa
PART 3 – AROMA CHEMICALS from PETROCHEMICAL FEEDSTOCKS
Copyright FRIDGE (2004) Page 73
Clearly, selling m-cresol at $ 2.30/kg gives the best South Africa cash cost of production. Table 25 below outlines the full cost of production for vanillin using purchased MP 96 at $1.20/kg and selling m-cresol at $ 2.30/kg. Further analysis of the South African cash cost of production determines that fixed costs constitute 33 % of this cost, the fixed cost including a capital charge.25 From this table it can be seen that on a pure variable cost basis, the CSIR process is 12.5% more expensive than the Rhodia cash cost of production outlined above.
TABLE 25: South African Vanillin Cash Cost of Production
$/kg % of Cash Cost
of Production Selling Price 12.00
Net Cresols 0.92 9 Caustic Flake 0.67 6.5 Ethyl Acetate 1.02 10 Sodium 1.73 17 Bromine 0.87 8.5 Other Raw Materials 0.98 9.5 Utilities 0.66 6.5 TOTAL VARIABLE COSTS 6.85 67 Labour 1.12 11 Other Fixed Costs 0.78 7.5 TOTAL FIXED COSTS 1.89 18.5 TOTAL COST OF PRODUCTION 8.74 85.5 Capital Charge 1.49 14.5 TOTAL CASH COST of PRODUCTION 10.23 100 Contribution to Profit 1.77
Hence, the integrated pHB process, using a mixed cresol feedstock, which allows the sale of m-cresol, does not impart any competitive advantage in the production of vanillin when compared to the Rhodia process. The South African cost of production, if the amortisation or finance charge is excluded, is however only 4% more expensive than the US Rhodia cash cost of production. The Rhodia fixed cost including depreciation is $2.30/kg vs the SA $3.39/kg, due to the fact that the Rhodia plants are likely to be fully depreciated. A South African producer is therefore closest to the Rhodia’s cash cost of production if finance charges are not accounted for.
25 Based on a depreciation cost of 10% over 10 years. The useful life of the plant is however expected to be at least 15 years.
PART 3 – AROMA CHEMICALS from PETROCHEMICAL FEEDSTOCKS
Copyright FRIDGE (2004) Page 74
Figure 22 further demonstrates this conclusion for the range of MP96 purchase prices $ 1.20 – 1.60/kg. As above, m-cresol is sold at $2.30/kg. This graph indicates that a South African producer can only compete with Rhodia’s cash cost of production on a variable cost basis over the MP 96 price range $ 1.20 – 1.60/kg. At a MP 96 price of $ 1.20/kg, the producer can cover fixed and variable costs, but not depreciation charges. Should Rhodia chose to depress prices down the $9.00/kg level, say to prevent a new competitor from obtaining market share, a South African producer would not be in a position to fully cover its fixed costs. At the lower purchase price of MP 96, more fixed costs will be covered.
FIGURE 22: Cash Cost comparison of SA producer vs Rhodia
On a stand-alone plant therefore, a South African producer would be unable to compete with Rhodia should vanillin prices be depressed. Clearly, the best scenario would be for vanillin to be produced as part of a basket of products where a portion of the fixed costs and capital charge can be absorbed by other products in the portfolio. In this instance, a South African producer would at least be able to cover its variable costs. The overall competitiveness would be best with a MP 96 purchase price of $ 1.20/kg and an m-cresol sales price of $ 2.30/kg. At these prices, and at a vanillin selling price of $ 12.00/kg, all production costs including the depreciation or capital charge are covered, with an additional contribution to profit of $ 1.77/kg.
PART 3 – AROMA CHEMICALS from PETROCHEMICAL FEEDSTOCKS
Copyright FRIDGE (2004) Page 75
5.3.4 Conclusion
The figure shows that a South African producer would not be in a position to compete on cash cost basis with Rhodia for any of the MP96 input prices and m-cresol selling prices considered. The low and high cash costs of $ 10.23/kg and $ 11.89/kg for South African based vanillin production substantially exceeds those achievable by Rhodia. With global commercial prices of vanillin being within the $ 9.00/kg to $12.00/kg expectation band, this would leave little margin for a South African producer to reward capital investment.
5.4 The Competitiveness of Menthol Production in South Africa
5.4.1 The CSIR developed Menthol Technology
The key to the competitive advantage of the CSIR Bio/Chemtek process over the cost leader Symrise commercialised process is the novel biocatalysis step in which menthol is generated as a single isomer.26 Symrise, which used to be owned by Bayer, was formed by a merger of Haarmann and Reimer with Dragoco in 2002. Mbuyu Biotech (Pty) Ltd has the rights to license this technology package.
5.4.2 Competitive Analysis
In 2001, AECI carried out a competitive analysis of the synthetic producers, Symrise and Takasago, based on the variable cost of production of menthol. Techno-economic data were obtained from reliable AECI business intelligence networks as well as analysis of the patents of these two companies processes.
Information on the cash cost of production of the CSIR technology was obtained from Mbuyu Biotech. For confidentiality reasons, the cash cost of production of the menthol technology may not be divulged. This competitive analysis is therefore performed based on a percentage basis vs the cost leader and the company which has the most similar process to the CSIR technology viz. Symrise.
The assumptions upon which the analysis is based are as follows:
• The comparison is done on a cash cost of production basis. The cash cost of production includes variable, fixed and a depreciation cost (10%).
• The calculation of cash cost of production is performed in US$, as the business is US $ based.
• Fixed costs include manpower, maintenance (labour and materials), site and general overheads based on factors of capex; and selling and administration costs based on a factor of selling price.
26 CSIR Bio/Chemtek website
PART 3 – AROMA CHEMICALS from PETROCHEMICAL FEEDSTOCKS
Copyright FRIDGE (2004) Page 76
• Capital costs do not include utilities and infrastructure. • The capital is for a stand-alone plant where utilities are bought in “over-the
fence” at AECI prices. • The variable cost of production competitive analysis of Symrise and Takasago’s
technologies have not been validated. Consultant information has been used to analyse the cash cost of production.
• The menthol mass balance and capital cost estimates have not been validated. • The thymol mass balance and capital cost estimates have not been validated.
Information has therefore been used as received. • Analysis of the menthol technology on the basis of it being a ring-fenced facility. The result of the analysis is shown in the figure below.
FIGURE 23: Comparison of the CSIR vs Symrise Cash Cost of Production
45%
47%
49%
51%
53%
55%
1,400 1,600 1,800 2,000 2,200 2,400 2,600
m-Cresol Price ($/ton)
Per
cent
age
of H
&R
cos
t
Minimum Sales Price required by pAA plant
The benchmarking analysis of the pHB-pAA-OMC process to be world competitive indicated that a minimum sales price for m-cresol of at least $ 1,800/ton must be obtained. At this price, the CSIR technology has a cash cost of production of 50% of the Symrise technology. At a sales price of $ 2,300/ton, the CSIR technology still has a substantial cost advantage of 55%. This cost advantage is conferred by the novel bioresolution step, which is more efficient and less capital intensive than the Symrise process, resulting in a decrease in both variable and fixed costs.
PART 3 – AROMA CHEMICALS from PETROCHEMICAL FEEDSTOCKS
Copyright FRIDGE (2004) Page 77
5.4.3 Conclusion
At the prices required in order for the pHB-pAA-OMC process to be competitive, the menthol technology process has a substantial advantage over the Symrise process. The use of the naturally arising m-cresol from the pHB-pAA-OMC process therefore could be used to produce menthol in an optimised facility for the production of these products without rendering either of the two processes uncompetitive.
PART 3 – AROMA CHEMICALS from PETROCHEMICAL FEEDSTOCKS
Copyright FRIDGE (2004) Page 78
6 FEEDSTOCK ANALYSIS
There are only two commercial types of mixed m/p-cresol feedstocks available. These are MP 90% purity and MP 99% purity. Merisol ceased manufacture of MP96 about three years ago, and would only consider producing this product on a campaign basis. There are no other commercial sources of MP96.
6.1 MP 90% purity
The purity ranges between 85 – 90 % depending on the supplier. The impurity is xylenols, these products are therefore often referred to as MPX, mixed cresol and xylenol mixtures. As this product is a naturally derived mixed cresol, there are only two producers of this product internationally, Merisol and Bayer in Germany. The long-term price has been indicated to be in the order of $ 1,400/ton. Merisol’s product is called MP45 and is a unique product falling into this category. The use of MPX has a minimal affect on the economics. Although it is a cheaper feedstock than either MP96 or MP99, the effective price of the pure mixed cresols is slightly higher. At the indicative long-term price for MP90% purity of $ 1,400/t, the effective cost of the pure cresols lies between $ 1,560 - 1,650/t. This is in the range at which the benchmark analysis has been done in the previous milestone reports. Although MPX has been evaluated on a pilot scale, sufficient work has not been carried out to demonstrate fully the process impact of the xylenols. The initial results have indicated lower yields of pHB compared to the use of MP99.
6.2 MP 99% purity
There are 3 major producers of this product worldwide, including Merisol. The long-term price is approximately $ 2,000/ton. The percentage of m- and p- cresol in the mixed stream are however different for each product. The producers of MP99 are Merisol (50% m-cresol: 50% p-cresol content), Bayer (70%: 30%), Mitsui (60%: 40%), and the Merisol (50%)/Sumitomo (50%) joint venture Sumika-Merichem (60%: 40%). Merisol and Sumitomo market the Sumika-Merichem product independently. Merisol therefore has two sources of MP99. It produces MP 99 (50% m-cresol: 50% p-cresol) at a facility in the USA using natural feedstocks from Sasol in South Africa, and also obtains product from the Sumika-Merichem joint venture (60%: 40%). Bayer is not a merchant supplier of MP99. It is believed that its cash cost of production for MP 99 is too high to allow it to compete.
The price of MP99 is determined by the market for wire enamel solvents in the Far East and by the market for flame-retardants in the USA. In contrast, the price of p-cresol is
PART 3 – AROMA CHEMICALS from PETROCHEMICAL FEEDSTOCKS
Copyright FRIDGE (2004) Page 79
determined by the market for Butylated Hydroxy Toluene. Since all of these markets are completely unrelated, the price of p-cresol is determined independently from that of MP99. Since 85% of world p-cresol production is derived synthetically from toluene and Merisol produces only 15% from the separation of naturally derived mixed cresols, Merisol is the price follower and not the price setter for p-cresol. However, due to its very large market share in mixed cresols and MP 99, Merisol is the price setter for both MPX and MP99.
6.3 Feedstock Options
From a technology perspective the ideal feedstock would be a MP99 feedstock with a cresol composition of 50% m-cresol and 50% p-cresol. The only producer that can directly supply this composition would be Merisol from the feedstock arising from Sasol. Because of the delicate balance between MP99, MP90, MPX, m-cresol and p-cresol globally, Merisol ensures that this balance is carefully managed through optimum utilisation of their combined multiple capacity worldwide. Merisol uses linear programming to determine logistics, timing and storage to determine the cost and revenue impact of different placement of these products. Thus, although in principal there should be no problem to obtain a supply of this preferred feedstock, in reality what will be made available would depend on what is perceived to be in their best to maintain product balances and plant loadings.
Owing to the robustness of the pHB selective oxidation technology, lower quality feedstocks such as the MPX’s can be used. An advantage of having a feedstock supplied by Merisol ex Sasol would be that this would link the upstream commodity industry with downstream fine chemical industry in South Africa. The MP90 (an MPX) produced by Bayer is not traded as a commercial product. All of the MP90 is consumed internally.
The use of a MP 99 feedstock with a higher m- to p- cresol ratio that could be supplied by any of the other three producers, Mitsui, Sumitomo or Sumika-Merichem, would have an impact on the techno-economics of the project in one of two ways:
• The high m:p ratio of 60:40 affects either the yield of m-cresol i.e. lower, if a 100% conversion of p-cresol to pHB has to be achieved (m-cresol degradation due to more severe oxidation conditions required), or the purity of m-cresol, if lower than 100% conversion of p-cresol to pHB is accepted (unreacted p-cresol contaminates the m-cresol by-product because of the difficulty associated with physical separation of the two molecular forms of cresol ).
• If the m:p ratio is brought back to 50:50, by topping up with either
commercially more expensive (Western/Japanese suppliers) or cheaper
PART 3 – AROMA CHEMICALS from PETROCHEMICAL FEEDSTOCKS
Copyright FRIDGE (2004) Page 80
(Chinese suppliers) p-cresol, the overall feedstock becomes either more expensive or less expensive as the case may be.
As most of the Far Eastern produced MP99 are primarily sold into the wire enamel solvent markets, this product should be available at wire enamel solvent prices of between $1,150 – 1,300/ton.
6.4 Conclusion
There is therefore only a small pool of mixed cresol suppliers internationally, from which a suitable feedstock for the petrochemical aroma value chain can be sourced. The CSIR pHB-pAA technology has been demonstrated using the more expensive feedstock, MP99 in a 50:50 ratio, and has been positively evaluated on MP96. The benchmarking exercise, although performed on MP 96 as feedstock, is independent of the feedstock as the analysis determines the effective cost of the pure cresols (50:50) at which the technology is competitive.
PART 3 – AROMA CHEMICALS from PETROCHEMICAL FEEDSTOCKS
Copyright FRIDGE (2004) Page 81
7 ATTRACTIVE OPTIONS
The products in the Petrochemical Aroma and Fine Chemical portfolio were subjected to a screening process designed to identify the most attractive products in the portfolio (Appendices 2 and 3). The products were categorised accordingly into “Bets” categories - Good, Conservative, High Risk and No Bets. The results are displayed as Appendix 4. pAA and thymol were evaluated as in terms of their use as flavour and fragrance aroma chemicals as well as intermediates in the manufacture of other products in the portfolio e.g. OMC and menthol. The products menthol, ethyl vanillin, OMC, pAA (intermediate) and thymol (intermediate and food grade) all fall in the category of Good Bets. Vanillin, pHB, raspberry ketone and zingerone are all conservative bets. Menthol is clearly the most attractive product in the portfolio. The results of this analysis confirm menthol, OMC and vanillin/ethyl vanillin as key business drivers in terms of their market size. Vanillin however is subject to more market threats than ethyl vanillin. Its price is under more pressure due to the influence of Chinese producers in the market and its margins being squeezed. Ethyl vanillin is therefore the preferred vanillin product. OMC as a product does not have as many internal South African strengths at this point as a technology is not yet available. Raspberry ketone and zingerone are extremely small products in comparison to the other flavour and fragrance Aroma Chemicals, and therefore do not have much influence in the overall portfolio.
The results of this analysis have been taken into account in the construction of the overall optimal product portfolio during the techno-economic evaluation of the basket of products.
PART 3 – AROMA CHEMICALS from PETROCHEMICAL FEEDSTOCKS
Copyright FRIDGE (2004) Page 82
8 INTELLECTUAL PROPERTY ISSUES
8.1 Para Hydroxy Benzaldehyde
In 1998 AECI identified the general status of the cresol oxidation process in terms of existing patented processes as an area that needed further clarification. This was approached from two angles:
♦ Whether the process infringed upon other processes, and ♦ Whether the AECI process could be patented
A literature search was undertaken. This resulted in four patents which described processes or steps bearing a resemblance to aspects of the oxidation step of the AECI route, and which could therefore be considered a potential threat. The four patents were: European patents EP 012939 and EP 725052 and Japanese patents JP 6124535 and JP 63301843. These four patents are discussed below.
EP 012939 This patent is by Sumitomo and expired in Europe in 1999 and the US equivalent (US 4,429,163) in 2001. The patent described an oxidation process marginally different to the AECI process. The invention was described as a “process for the production of 4-hydroxybenzaldehyde derivatives by oxidising a p-cresol derivative with oxygen or a free oxygen-containing gas, in the presence of a base and a cobalt compound or metallic cobalt. The patent also makes specific reference to the possibility of selectively oxidising p-cresol in the presence of m-cresol and gives an experimental example of this. The most significant difference between the Sumitomo patent and the AECI process is that the patent does not mention the use of a mixed oxidation catalyst. Conversions and selectivities to pHB seem to be lower than that was achieved by the AECI process. It was therefore concluded by AECI that although the Sumitomo patent describes a process very similar to the AECI process, the latter’s use of a mixed or possibly specifically designed co-precipitated catalyst system, and the better use of selectivities and yields that were obtained by the process, can possibly be seen as process improvements which will allow for the circumvention of patent EP012939. EP 725052 The patent, which was believed to still be under examination in 1998, was filed by Bayer. The patent was primarily concerned with the downstream processing of the post-oxidation reaction, but does include some reference to an oxidation process similar to the AECI process. There is however no mention of oxidations of mixed cresol streams. The downstream processing procedure described involves adjustment of the post-oxidation mixture to pH 11 using sulphuric acid, followed by filtration of the
PART 3 – AROMA CHEMICALS from PETROCHEMICAL FEEDSTOCKS
Copyright FRIDGE (2004) Page 83
resulting insoluble salt. The AECI downstream process does not involve removal of an insoluble salt in this fashion. It was therefore concluded that patent EP 725052 is not a threat. JP 6124535 This patent was only granted in Japan, apparently as JP 9314696 to Kansai Co., and describes an oxidation reaction, which is very similar to the AECI process, including the use of a mixed catalyst system. The ratio of catalysts recommended varies between 0.2:1 and 4:1 on an atomic basis. The conclusion reached by AECI was that the AECI process must be developed to use a higher ratio in order to circumvent the patent. In addition, the patent does not seem to include any reference to the oxidation of a mixed m/p-cresol feed stream similar to that proposed in the AECI process. JP 63301843 This patent was granted to Sumitomo as JP95064777, and describes a p-cresol oxidation methodology similar to the AECI process, including oxidation of a mixed m/p-cresol stream, but using only cobalt containing catalysts. The main purpose of the patent relates to the downstream processing procedure involved. The sequence is very similar to the AECI downstream processing route. It appeared however that this patent was only granted in Japan.
Advice was obtained by AECI with a patent lawyer from its Patents and Trade Marks Group to review the current patent situation regarding the m/p-cresol oxidation step of the pHB process, especially in terms of potential infringements of the process on other patents. The following is a summary of the comments, conclusions and recommendations made.
Possible patent infringements:
• Patents JP 6124535 and JP 63301843 were only granted in Japan. As this was not seen as a target market for the products, these patents would not affect it. The former patent could be circumvented by a higher ratio use of the mixed catalysts.
• Patent EP 012939 expired in 1999 in Europe and the US equivalent in 2001. This patent is therefore not a threat.
• Patent EP 725052 is sufficiently different to the AECI process to not pose a threat.
Advice on the potential patentability of the AECI process was also given. The factors which may enable the process to be patented are the fact that the process at the time was based on a 50:50 m/p-cresol feed stream, that it uses a mixed catalyst27 and that the selectivity and conversions are higher than those described in the other patents (i.e. process improvements).
27 The identity of the components of the catalyst stream cannot be divulged due to reasons of protecting the process’s competitive advantage.
PART 3 – AROMA CHEMICALS from PETROCHEMICAL FEEDSTOCKS
Copyright FRIDGE (2004) Page 84
The CSIR has chosen not to patent the process, choosing instead to trademark the two unique reaction vessels used in the process. These reaction vessels are the oxidation reactor, SAFOX TM, and the vessel that extracts the m-cresol from the reaction, VIPEX TM.
8.2 p-Anisaldehyde
The methylation of pHB using methyl chloride or dimethyl sulphate has been operated by a number of companies, most importantly Bayer and the majority of the Chinese producers. Koffolk also used to manufacture pAA from pHB using dimethyl sulphate and caustic soda but changed processes in the early 1980’s when Dow ceased producing pHB by the Reimer-Tiemann process, leading to a 2 – 3 fold increase in the price of pHB.
The CSIR technology is a step-change improvement on a similar technology used by Bayer in its pAA production plant until 1997. The Bayer process consisted of the oxidation of pure p-cresol to pHB using a proprietary catalyst, followed by the methylation of pHB to pAA using methyl chloride. The CSIR process is differentiated in that mixed cresols can be used as the feedstock in the oxidation step, as well as pure p-cresol. The technology is based on the selective oxidation of p-cresol in a p- and m-cresol mixture (called MP99) to form pHB, leaving the m-cresol unreacted. The CSIR performed a patent search for the production of pAA from pHB in May 2004.28 This search indicates that the patents are older than 1978/1981 and have therefore expired.
The route to pAA from pHB by methylation with dimethyl sulphate or iodomethane in an alkaline environment is published in a paper:
• Ploadus N.N, Translated by Liu Shuwen.; Perfumery Chemistry. Beijing, Qinggongy Chubanshe, 1984, 224.
8.3 Vanillin/Ethyl Vanillin
The CSIR performed a patent search in May 2004.29 Most patents for the production of vanillin and ethyl vanillin are in China only, and do not describe the CSIR process exactly. The solvents used are different e.g. dimethyl formamide and not as environmentally friendly as the CSIR process solvent. There does not appear to be any patent cover in South Africa.
8.4 Octylmethoxycinnamate
Most of the routes to OMC involve the synthesis of p-methoxycinnamic acid followed by esterification. The methods, which have been reported in open literature to synthesise 28 Documents: F. Marais CSIR Bio/Chemtek 29 Documents: F. Marais CSIR Bio/Chemtek
PART 3 – AROMA CHEMICALS from PETROCHEMICAL FEEDSTOCKS
Copyright FRIDGE (2004) Page 85
derivatives of cinnamic acid, are discussed in a literature review conducted by AECI in 1998.30
Patent protection exists for a number of processes:
• US 4609756, 1985, Bayer, Process for the Preparation of Optionally Substituted Cinnamic Acid in the Presence of a Catalyst, and
• US 5527974, 1996, ISP Van Dyke, Process for Preparation of Cinnamate Sunscreen Agents.
• US 5334750, 1993, Bayer, Process for the preparation of cinnamic acid derivatives
In 1998, in the early stages of the technology development for pHB and pAA, it was felt that a conflict would exist if both pAA and OMC were produced, as AECI would be in direct competition with its customers. It was subsequently decided that AECI would enter into the pAA market; OMC technology development was therefore suspended. The CSIR has investigated a number of different synthetic routes to the manufacture of OMC, including non-pAA based technologies, however, the CSIR does not have any OMC technology. The commercial routes to the production of OMC therefore appear still to be covered by patent.
8.5 Menthol
Thymol serves as the starting material for the production of menthol via m-cresol. Thymol is manufactured by isopropylating m-cresol with propylene or another isopropylating agent.31 Hydrogenation of thymol produces a mixture of menthol stereoisomers directly. The menthol isomers are equilibrated to increase the (±) menthol content.32, 33, 34 The equilibrium mixture obtained contains approximately 62 wt % (±) menthol, 23 % wt neomenthol, 12 wt % (±) isomenthol and 3 wt % (±) neoisomenthol. The (±) menthol isomers can be separated by high efficiency distillation and the remaining isomers recycled to equilibration. The required (-) menthol can be produced by resolution of the (±) menthol isomers. Symrise (ex Haarmann and Reimer) patented a process whereby a supersaturated solution of a benzoic derivative of (±) menthol is seeded with the (-) form of the derivative to induce selective crystallisation.35 See Appendix 5 for the Flowsheet.
30 A literature review on the synthesis of cinnamic acid and derivatives: SJ Heggie, 1998 31 Bull. Chem. Soc., Jpn. 47,2360 (1974) 32 Chem. Ind. (London), 236 (1964) 33 Agric. Biol. Chem. 29 (9), 824 (1965) 34 US Patent 2,827,499 (Mar 19 1958) to the Glidden Corporation 35 US Patent 3,943,181 (Mar 9 1976) to Haarmann and Reimer
PART 3 – AROMA CHEMICALS from PETROCHEMICAL FEEDSTOCKS
Copyright FRIDGE (2004) Page 86
The competitive advantage of the CSIR process over the Symrise commercialised process is the novel biocatalysis step in which menthol is generated as a single isomer.36 The menthol mixture resulting from the hydrogenation of thymol is submitted to enzymatic acylation, whereby the desired acylated menthol is generated with an excess greater than 95%. Acylation of the other isomers is insignificant. The process is completed by separating (+)-menthyl acetate from the 7 other menthol isomers through distillation. This distillation is significantly less demanding than the distillation separating (±)-menthol from the other diastereomers in the Symrise process. Hydrolysis generates (+)-menthol and finally, crystallisation provides (+)-menthol of the required purity. The seven non-commercially attractive isomers are submitted to an isomerisation/racemisation, regenerating the original mixture of isomers containing 56% (±)-menthol, which can be re-introduced to the resolution reaction with the overall result (over multiple cycles) being substantially full conversion of thymol to (+)-menthol
The CSIR has patented its menthol process in two patents WO 02/04384 A2 (January 2002) and WO 02/36795 (May 2002). Furthermore, concept patents have been applied for in the following countries: Australia, Brazil, China, Czechoslovakia, Europe, Indonesia, India, Japan Mexico, Russian Federation, Singapore, Slovakia, South African and the United States. Process patents have been applied for in China, Germany, India, Japan, South Africa and the United States. For a description of the CSIR process technology for menthol see Appendix 6. The other company producing synthetic menthol, Takasago, uses a completely different process based on beta-pinene, which is converted to myrcene, and then further converted to d-citronellal and subsequently to menthol. As their feedstock is already optically active, there is no need to resolve a racemic mixture, as is the case in the Symrise process.
8.6 Raspberry Ketone
A comprehensive literature and patent search was conducted by AECI in 1998.37 It was concluded that the AECI route is distinguishable in part from commercial routes in literature through the isolation of the intermediate in sodium salt form, followed by hydrogenation of this sodium salt in water, as distinct from hydrogenation of the phenolic form of the compound.
36 CSIR Bio/Chemtek website 37 “Synthesis of Raspberry Ketone”: M Portwig, CJ Parkinson, September 1998
PART 3 – AROMA CHEMICALS from PETROCHEMICAL FEEDSTOCKS
Copyright FRIDGE (2004) Page 87
9 ENVIRONMENTAL ISSUES
9.1 Parahydroxybenzaldehyde/p-Anisaldehyde
A research Safety, Health and Environment Impact Assessment Study was carried out in May 1999.38 The study was an assessment of the Safety, Health and Environment hazards and impact of the proposed manufacturing process, specifically related to chemical hazards, disposal of wastes, site and community considerations, which may arise from the manufacture or use or final disposal of the product. The report was conducted with the AECI Richard’s Bay site identified for commercialisation of the process.
The process gives rise to a number of solid, liquid and gaseous waste arisings. The problem areas would be:
• Solvent recovery – the solution would be to recover as much solvent a economically possible.
• The Chemical Oxygen Demand/Saline aqueous effluent must be treated to meet the requirements of the municipality for marine disposal (if the plant is located at the coast). The treatment of this effluent would obviously have to be considered if an inland site is chosen.
• The distillation residues, in the form of tars, are suitable to feed to an incinerator. The capital should therefore take this into account. The possibility of disposing to a fuel oil recycler or burning in an existing local fired heater also exists.
The oxidation reaction is carried out in a loop reactor, where the vapour phase does not form a continuous phase, and the oxygen concentration is kept outside of the explosive region by adding nitrogen if necessary. The chemical oxidation reactivity hazard in the process has therefore been removed.
The process has an environmental load factor of 4 (including m-cresol and excluding water), which is reasonable compared with other chemical processes. This number is a measure of how “wasteful” the process is and measures mass of material in/mass of material out. The project is not a large user of water and energy. The spent catalysts will be returned to the supplier. No objectionable odours were identified which would give rise to neighbourhood complaints. The methylation of pHB can use either dimethyl sulphate or methyl chloride. The choice as to which methylation agent to use will depend on whether the plant is located at the coast or inland. In South Africa, dimethyl sulphate is preferred for inland locations, as the by-product, is sodium sulphate. Methyl chloride would be preferred at coastal regions as the by-product, sodium chloride, can be disposed of to sea.
38 ISHECON Report: May 1999
PART 3 – AROMA CHEMICALS from PETROCHEMICAL FEEDSTOCKS
Copyright FRIDGE (2004) Page 88
No potential Safety, Health and Environment show-stoppers” were identified. There were not considered to be any obvious environmental and socio-economic impacts.
9.2 Menthol
A research Safety, Health and Environment Impact Assessment Study was carried out in 2000.39 The study was an assessment of the Safety, Health and Environment hazards and impact of the proposed manufacturing process, specifically related to chemical hazards, disposal of wastes, site and community considerations, which may arise from the manufacture or use or final disposal of the product. The report was conducted with the AECI Richard’s Bay site identified for commercialisation of the process.
The report stated that the process is inherently clean and uses few resources. There is no large water requirement and there is a relatively small amount of waste, which can easily be disposed of. The process gives rise to two effluent streams.
• Tars from the thymol distillation bottoms, which can be disposed of by
companies that recycle similar wastes into fuel oil blends. • Sodium acetate is a 50% aqueous stream, which should be amenable to
marine disposal if the plant is situated at the coast. The Richard’s Bay Borough has two pipelines with a capacity of 200,00 m3/day. The main limitation would be any toxic effect on marine life, and CSIR Environmentek have a test (the sea-urchin sperm test) to determine the safe dilution factor required.
The process had an environmental load factor of 3.2, considered reasonable compared with other chemical processes. The odour from the plant was not believed to give rise to any neighbourhood complaints, although cresols do have a strong odour. Disposal of spent catalysts was not viewed to be a major problem as the amount generated is extremely small and the catalysts have a long lifetime.
The report concluded that there did not appear to be any Safety, Health and Environment issues that could be viewed as potential “show-stoppers”. There were not considered to be any obvious environmental and socio-economic impacts.
9.3 Vanillin/Ethyl Vanillin
A full Safety Health and Environment impact assessment was not carried out by the CSIR as this technology package was completed after AECI’s exit from its Aroma chemical business and its technologies transferred to the CSIR. The Safety, Health and Environment
39 ISHECON Report: February 2000
PART 3 – AROMA CHEMICALS from PETROCHEMICAL FEEDSTOCKS
Copyright FRIDGE (2004) Page 89
assessments performed are generally site specific, and as the CSIR does not develop technology with any particular site identified, the assessment could not be performed.
Study of the process chemistry by the Consultant for the production of vanillin and ethyl vanillin identified one potential area of concern. The process for production of both vanillin and ethyl vanillin involves a bromination step, using bromine as a reagent. Hydrogen bromide is produced and is vented from the reactor. The hydrogen bromide is scrubbed with caustic and bromine is regenerated for recycle using chlorine gas. The bromine regeneration step produces a sodium chloride effluent. The bromine associated with bromo-pHB is displaced later in the process, generating sodium bromide as a by-product in a methanol solvent.
In the new vanillin/ethyl vanillin process proposed by the CSIR, water is injected after the displacement reaction and the methanol solvent recovered. The aqueous stream consisting of sodium vanillin and sodium bromide is acidified with dilute sulphuric acid and vanillin separates out as an organic phase. The sodium bromide together with the sodium sulphate resulting from the displacement reaction remains in the aqueous phase. The CSIR has not declared how this sodium sulphate /sodium bromide aqueous stream is to be handled. In the absence of a proposed recovery scheme for the salts, the aqueous stream will have to be regarded as an effluent stream.
PART 3 – AROMA CHEMICALS from PETROCHEMICAL FEEDSTOCKS
Copyright FRIDGE (2004) Page 90
10 SITE ISSUES
No specific site issues have been identified other than the selection of whether the business will be coastal or inland. This choice will have an impact on the selection of the methylating agent for the production of pAA from pHB. In South Africa, dimethyl sulphate is preferred for inland locations, as the by-product, is sodium sulphate. Methyl chloride would be preferred at coastal regions as the by-product, sodium chloride, can be disposed of to sea.
PART 3 – AROMA CHEMICALS from PETROCHEMICAL FEEDSTOCKS
Copyright FRIDGE (2004) Page 91
11 TECHNICAL OPTIONS
11.1 Parahydroxybenzaldehyde
The overall pHB process has been demonstrated at pilot scale on a Merisol type MP99 feedstock. Both MP96 and MPX feedstocks have been evaluated, but this has been done on a much more limited experimental scale. The pHB process flowsheet incorporates two novel process units – an oxidation reaction and the solvent extraction recovery of m-cresol. Both of these units have been developed up to pilot scale. A 750 litre oxidation reactor has been trialled and the reactor configuration has been trademarked as the SAFOXTM reactor. A disc column solvent extraction unit has also been developed and tested at the pilot scale. This unit has been trademarked as VIPEXTM. The rest of the flowsheet involves the use of fairly standard process equipment. One of the process risks is associated with the flowsheet is the recycle of organic solvent streams. One of these is the methanol recycle system (methanol is the solvent used in the oxidation reactor) and the other is the toluene recycle system (toluene is used in the solvent extraction recovery of the m-cresol). Owing to pilot plant limitations, both recycle systems have been assessed on a limited number of recycle cycles. Sufficient development work has been done to complete a full design specification of a pHB plant to be supplied with a MP99 type feedstock, which has an m:p ratio of 50:50. Some further directed test work would need to be carried out to fully specify a plant based on either MP96 or MP99 with a 60:40 m:p ratio. Although MPX has been evaluated on a pilot scale, sufficient work has not been carried out to demonstrate fully the process impact of the xylenols. The initial results have indicated lower yields of pHB compared to the use of MP99.
11.2 p-Anisaldehyde
The pAA process starting with pHB to produce crude pAA is a conventional flowsheet with standard process equipment, and does not pose any major process risks. The process has been fully developed at pilot scale. The only process issue is the choice of methylating agent which would affect the flowsheet configuration. The production of flavour grade pAA, however, incorporates a novel distillation unit. This unit has been trialled at the bench scale level from a supplier of proprietary equipment. Further work might have to be undertaken to finalise the design of the distillation unit.
11.3 Octylmethoxycinnamate
The CSIR has not developed any OMC technology. This technology would have to be licensed or developed depending on the time scale for implementation.
PART 3 – AROMA CHEMICALS from PETROCHEMICAL FEEDSTOCKS
Copyright FRIDGE (2004) Page 92
11.4 Menthol
The process for the conversion of thymol to menthol has been developed to the level of early stage pilot scale development. Further pilot plant development work will be necessary before a commercial scale plant can be designed and fully specified. The CSIR has produced 0.5 tons of menthol for product evaluation. The thymol front-end technology has been developed at bench scale level. Some preliminary pilot work has been undertaken, but considerable pilot work is still required.
PART 3 – AROMA CHEMICALS from PETROCHEMICAL FEEDSTOCKS
Copyright FRIDGE (2004) Page 93
12 TECHNO-ECONOMIC ANALYSIS
A techno-economic model to evaluate the basket of aroma chemicals has been developed. The objective of this model was to determine the optimum configuration of products based on the following considerations:
• The most attractive products as identified above. • The key drivers as identified above. • Specific pricing issues, e.g. for MP96 and m-cresol as raised during the
benchmarking exercises. • The economies of scale information for the pHB, pAA and vanillin plants derived by
the benchmarking analysis. • The relative competitiveness of the different processes vs the market leaders.
12.1 Techno-Economic Model Assumptions
The economic models were based on a number of assumptions. These are listed as follows: 1. The project has a lifespan of 15 years. 2. The production plant is non-site specific. 3. R/$ exchange rate is calculated on the differential between the consumer
price index in the USA and the core consumer price index in South Africa i.e. purchasing power parity is assumed.
- The 2004 SAR/ US $ exchange rate was assumed to be 7.00. - The SA and US inflation rates were assumed to be 6% and
1.5% respectively. These rates stay constant for the life of the project.
4. The fixed capital investments required for the project were based on the CSIR capital estimates.
- Capital estimates were performed at different times. They were therefore adjusted accordingly.
- Capital estimates exclude Outer Battery Limit services, utilities and infrastructure. The capital estimates were based on the cost of the individual main plant items, to which an installation factor was applied in order to arrive at a total installed cost. The factored estimate has an accuracy of ±30%. A process development allowance factor was determined and applied to the fixed capital investment. The process development allowance is a process contingency, and is dependant on the status of the development of the technology.
5. The tax allowance on the fixed capital investment has been assumed to be at a fixed rate of 10% per annum (straight line) for 10 years,
PART 3 – AROMA CHEMICALS from PETROCHEMICAL FEEDSTOCKS
Copyright FRIDGE (2004) Page 94
commencing in the first year of production, and remains constant in nominal South African Rand terms for the lifetime of the project.
6. The current tax rate of 30% is used. 7. The project’s terminal value is equal to the value of the residual working
capital in year 15. The commercial plant has no (scrap) value at the end of its lifetime.
8. No technology license fee or royalty payment is included. 9. Selling prices remain constant in nominal US$ terms.
10. The raw material and utility requirements for the project were based on technical information received from the CSIR and Mbuyu Biotech for menthol.
11. Long-term average prices for raw materials and products have been assumed. The cresol feedstock was assumed to be MP96, a non-commercially available mixed p- cresol and m-cresol stream. The feedstock has a typical p-cresol: m-cresol ratio of 47%:49% and a total purity of 96%.
12. Variable costs remain constant in nominal US $ terms. (a) MP 96 $ 1.40/kg (b) m-Cresol $1.80/kg
13. Locally determined prices such as utilities and fixed costs remain constant in real terms over the life of the project.
14. Utility prices are assumed to be AECI delivered in Richard’s Bay prices.40 15. Fixed costs have been determined using factor estimates based on those
used in the fine chemical industry. Maintenance materials and labour are each assumed to be 2.0% of fixed capital. Site and general overheads are 1.2% of fixed capital, and selling and general overheads are 0.5% of turnover. These costs remain constant in real South African Rand terms for the lifetime of the project.
16. An annual plant efficiency improvement was assumed in order to maintain constant operating margins.
40 The AECI study was performed on the basis of the plant being located at the AECI Alton Site Richard’s Bay.
PART 3 – AROMA CHEMICALS from PETROCHEMICAL FEEDSTOCKS
Copyright FRIDGE (2004) Page 95
12.2 Methodology
Two different business models were analysed. The motivation for this approach is that it is possible that there may be a necessity to involve more than one player in the establishment of the value chain. This may come about as different investment partners, strategic partners, or marketing alliances are selected in order to add value at the different stages in the business. For example, a commodity type chemical company may have a stronger role to play in the upstream part of the value chain, whereas an association with a flavour and fragrance house may be the strategy chosen in the downstream businesses. The consultant has therefore attempted to determine the set of conditions under which a number of business options can be made viable. The business options analysed are depicted graphically in Appendix 7.
OPTION 1: Fully integrated from the production of the Bulk Intermediates through to the manufacture of the final Aroma and Fine Chemicals. This analysis also determined the optimum product portfolio. (Company A)
OPTION 2: Using the optimised product portfolio as the basis for further analysis,
the business was then divided into a Bulk Intermediate business (Company B) and an Aroma Chemical business (Company C).
12.3 Option 1: A Fully Integrated Aroma Chemical Plant
The sales of all products to the merchant market from the integrated Aroma Chemical plant are at the world prices as described in section 12.1 (point 9) above unless specified otherwise.
12.3.1 Determination of the pHB plant capacity
In constructing the optimal product portfolio, it must therefore first be recognised that the size of the pHB plant will be determined by the size of the menthol plant. The key raw material for menthol is m-cresol, the natural arising from the oxidation of MP96 to pHB. Hence, the first step is to decide on the capacity of the menthol plant. The size of the menthol facility was elected to be 1,500 tons per annum as this was the capacity at which the Mbuyu Biotech assessment had been performed, and at which the information had been made available. This capacity was deemed reasonable through study of the menthol market. Total menthol production i.e. natural and synthetic is in the order of 12,730 – 13,320 tpa. Of this capacity, synthetic menthol accounts for 2,700 tpa. Hence the proposed 1,500 tpa plant represents approximately 50% of existing synthetic capacity and 12% of the total capacity. In addition, it must be recognised, that synthetic menthol only finds
PART 3 – AROMA CHEMICALS from PETROCHEMICAL FEEDSTOCKS
Copyright FRIDGE (2004) Page 96
application in certain market segments of the total menthol market i.e. the oral hygiene and cigarette sectors. These sectors represent a potential synthetic market of 4,600 tons (38% of the market). Table 26 outlines the project return without any production of menthol assuming the pHB and pAA plants are at the minimum economy of scale i.e. 2,000 tpa. The assumption in this analysis was that all pHB produced was fully converted to technical grade pAA and that it is sold into the merchant market at the world price of $ 6.25/kg. m-Cresol must then be sold into the merchant market.
If the plant does not produce any menthol, at a pAA capacity of over 2,000 tons per annum, the project has a real IRR of 0.9% selling m-cresol into the world market at $ 1.80/kg. Selling m-cresol at $ 2.30/kg will increase the real IRR to 5.9%. Over 2,000 tons of m-cresol will however have to be sold into the world market. The plant will therefore be competing with its feedstock supplier.
Table 27 outlines the project return (real IRR) of various menthol capacities, vs pHB and pAA capacities. This analysis was performed in order to determine whether at the chosen menthol capacity, the pHB and pAA plants would meet the economy of scale requirements, and whether the plant would have investment economics.
TABLE 27: Menthol capacity vs pHB, pAA capacities and Project Return
PART 3 – AROMA CHEMICALS from PETROCHEMICAL FEEDSTOCKS
Copyright FRIDGE (2004) Page 97
At a menthol capacity of 1,500 tons, the project return increases to 19.2% even though at this menthol capacity, the pAA plant is below the economy of scale indicated in the benchmarking exercise.
The pHB capacity was therefore determined to be 1,691 tons, the pAA capacity 1,719 tons and the menthol capacity to be 1,500 tons. These capacities will be used as the basis for further analysis.
12.3.2 Determine the mix of PAA, OMC, vanillin and ethyl vanillin
The determination of the optimum mix of the aroma chemicals and personal care ingredients listed above was performed by introducing each product individually into the plant as described above in section 12.3.1 i.e. pHB 1,691 tons; pAA 1,719 tons; and menthol 1,500 tons. • Para Anisaldehyde The pAA market is in the order of 4,500 tpa of which 2,100 tpa is sold for conversion into OMC market. Clearly, to compete in the pAA market, a producer must sell a substantial quantity of product to an OMC producer. The benchmarking exercise concluded that OMC producers require pAA at a price of $ 4.80 - 5.50/kg in order to compete with the market leader BASF on a cash cost basis (see section 5.2.1 above). The cash cost of the integrated pAA producer as outlined above is below these prices. Table 28 below indicates the project IRR should the South African producer sell pAA to the merchant market at these prices in comparison to selling it at market related prices.
TABLE 28: pAA price vs Project Return
PAA price ($/kg) Real IRR (%) % of Base Case
4.80 15.4 76% 5.50 17.2 88% 6.25 19.2 100%
An integrated pAA plant, selling product to the merchant market at world price in the range of $ 4.80 - 6.25/kg clearly has investment economics. However, reducing the price to the levels required by an OMC to remain competitive would be coupled with a substantial loss in value although the plant will still attain investment economics. • Octylmethoxycinnamate Table 29 shows the effect on the project return by producing OMC in addition to pHB, pAA and menthol at the capacities determined in section 12.3.1.
PART 3 – AROMA CHEMICALS from PETROCHEMICAL FEEDSTOCKS
It can be seen therefore that producing OMC adds substantial value to the project. The amount of OMC that can be produced however will be influenced by how much can be absorbed by the market. The OMC market is estimated to be in the order of 5,500 tpa. Symrise, the largest competitor to BASF has a capacity of 2,000 tpa. BASF itself has a capacity of 4,500 tpa but is estimated to sell in the order of 2,100 tpa. The maximum OMC capacity that could be produced is therefore considered to be 2,000 tpa.
• Vanillin The vanillin market is in the region of 10,500 tpa. The minimum economy of scale as determined in the benchmarking exercise was 1,000 tpa. Table 30 lists the impact of introducing different vanillin capacities in addition to pHB, pAA and menthol at the capacities determined in section 12.3.1 on the project return. pHB not converted into vanillin is converted into pAA and sold at the world price i.e. $6.25/kg.
This table shows clearly that introducing vanillin into the product portfolio detracts value. Vanillin makes a marginal positive contribution at a capacity over 1,500 tpa. The contribution margin for pAA is higher than that of vanillin, hence as the vanillin capacity increases, the pAA capacity decreases and the project return decreases.
PART 3 – AROMA CHEMICALS from PETROCHEMICAL FEEDSTOCKS
Copyright FRIDGE (2004) Page 99
Overall, although the project does make a positive return and can have investment economics if vanillin is included in the portfolio, it makes more economic sense to convert as much pHB via pAA through to OMC.
The question however has been asked as to whether or not a scenario could be defined under which vanillin could be added to the portfolio without detracting value. The analysis in section 5.3.3 demonstrated that a South African vanillin producer would have a cash cost of production closest to that of the market leader Rhodia, if finance charges were not included. Hence, the analysis above was repeated assuming that no capital expenditure is required in order to produce vanillin.
TABLE 31: Vanillin Capacity vs Project Return assuming no capital expenditure
In this scenario, when no additional capital expenditure is required, the project still has a lower return than if vanillin were not produced. Although, at 1,500 tons vanillin now makes a positive contribution, the contribution for pAA is higher.
• Ethyl Vanillin The ethyl vanillin market is in the region of 1,700 tpa. The minimum economy of scale as determined in the benchmarking exercise was 1,000 tpa. Table 32 lists the impact of different ethyl vanillin capacities on the project return. pHB not converted into ethyl vanillin is converted into technical grade pAA and sold at $6.25/kg.
TABLE 32: Ethyl Vanillin Capacity vs Project Return
PART 3 – AROMA CHEMICALS from PETROCHEMICAL FEEDSTOCKS
Copyright FRIDGE (2004) Page 100
Ethyl vanillin clearly also detracts value from the project. Hence, as in the case of vanillin, it was determined to what extent ethyl vanillin could add value to the portfolio if no new capital was required.
TABLE 33: Ethyl Vanillin Capacity vs Project Return assuming no capital expenditure
When no additional capital expenditure is required, producing ethyl vanillin can add value to the portfolio even at a level of 500 tons per annum, provided that the fixed cost/kg remains the same. Ethyl vanillin would therefore be the preferred vanillin product as it adds more value than the equivalent amount of vanillin. However, in comparison to including OMC in the suite of products produced, ethyl vanillin still adds substantially less value. 12.3.3 Optimise Portfolio with Flavour Grade PAA and Technical Grade pHB
In considering the above analysis, the optimal portfolio of the large-scale chemicals is hence to produce 1,691 tons pHB; 1,719 tons pAA; 1,500 tons menthol and 2,000 tons OMC. The project return under this set of conditions is 24.8%. These capacities will be used as the basis for further analysis. Adding capacity of the higher value forms of the pAA and PHB to the portfolio as defined can now further optimise the portfolio of products. (a) pAA Flavour Grade Table 34 depicts the impact on the portfolio of producing flavour grade pAA. The pAA flavour grade market is 550 tons per annum.
TABLE 34: pAA Flavour Grade Capacity vs Project Return
PAA capacity (tpa) Real IRR (%) Capital (R millions) 0 24.8 247 200* 24.8 249 400 24.9 251
* Selected as Base Case
PART 3 – AROMA CHEMICALS from PETROCHEMICAL FEEDSTOCKS
Copyright FRIDGE (2004) Page 101
It can be seen that the addition of flavour grade pAA only marginally increases the project return. However, in order to broaden the range of aroma chemicals, some flavour grade material should be produced. 200 tons represents 36% of the market.
(b) pHB Technical Grade The pHB merchant market itself is very small, only being in the region of 600 tpa. The effect of producing technical grade pHB is shown in table 35. Clearly, if pHB is sold on the merchant market, the amount of pHB converted to pAA must be reduced by the corresponding amount.
TABLE 35: pHB Technical Grade Capacity vs Project Return
Producing technical grade pHB only makes sense at a volume of over 500 tons, and even at this level the increase in project return is marginal. As this volume is nearly the entire pHB world market, introducing technical grade pHB into the portfolio is therefore not considered further.
PART 3 – AROMA CHEMICALS from PETROCHEMICAL FEEDSTOCKS
Copyright FRIDGE (2004) Page 102
12.3.4 Conclusion
Two optimal portfolios can therefore be defined, depending on whether new capital is required for the production of ethyl vanillin or not. These portfolios are shown in the table below. TABLE 36: Optimal Aroma Chemical and Personal Care Intermediate Portfolio
* Alternative scenario only if no new capital is required for ethyl vanillin
12.3.5 Sensitivity Analysis
A sensitivity analysis on the key project variables was performed. The results are shown as a “Tornado Risk Diagram” in Figure 24. The tornado diagram depicts the extremes of the project IRR around the base case value, with the variables ranked according to their impact on the project IRR. The upper and lower limits depict the ranges over which the particular variable could reasonably change.
PART 3 – AROMA CHEMICALS from PETROCHEMICAL FEEDSTOCKS
Copyright FRIDGE (2004) Page 103
The results show that the business is most sensitive to the menthol and OMC prices. This is not surprising, as these are the key drivers of the project. The menthol market is particularly volatile, with prices reaching as low as $ 8.00/kg. The synthetic menthol market prices are not generally quite as volatile as the natural prices, synthetic material offering purchases some protection against this market volatility. The OMC market price is fairly stable, although prices recently have decreased due to the emergence of BASF as the market leader with a substantial production cost advantage over its competitors. The project is also very sensitive to exchange rate. Again, this is to be expected as both selling prices and key raw materials prices such as MP96 are set in US$. Fixed costs make up a small component of the overall cost of production. The production of thymol and pHB are the most capital-intensive processes. This is also not surprising, as these products are more bulk commodity intermediates than fine or aroma chemicals.
PART 3 – AROMA CHEMICALS from PETROCHEMICAL FEEDSTOCKS
Copyright FRIDGE (2004) Page 104
12.4 Option 2: A Bulk Intermediate Plant and an Aroma Chemical Plant
In this option, it is proposed that the Bulk Intermediate business sell products on a committed contractual basis to the Aroma Chemical business for further conversion into the final aroma or personal care chemicals. Bulk intermediates include thymol and technical grade pAA. Technical grade pAA not sold to the Aroma Chemical plant for conversion into OMC or flavour grade pAA is sold into the merchant market at the world prices as described in section 12.1 (point 9). All products sold by the Aroma Chemical plant are at the indicated world prices. The determination in this analysis is based on the optimal product portfolio as outlined in Table 36 above.
12.4.1 Determination of Sales Prices of Bulk Intermediates to Aroma Chemical Plant
The first step is to determine the prices, defined as the fully absorbed cost prices at which the Bulk Intermediate plant would have to sell the intermediates to a separate Aroma Chemical plant in order to obtain investment economics. The benchmarking exercises were based on the determination of the cash cost of production, defined as: cash cost of production = variable cost + fixed cost + capital charge (10% of capital investment) In the determination of the fully absorbed cost, a capital charge of 25% was applied. The fully absorbed cost is therefore defined as: fully absorbed cost = variable cost + fixed cost + capital charge (10 - 25% of capital investment) Product sold on the merchant market was at world prices as prices outlined in 12.1 (point 9) above. The project’s real IRR and fully absorbed cost for the bulk intermediates were determined at a capital charge of 25% across the same range of MP96 purchase prices, $ 1.20 – 1.40/kg.
PART 3 – AROMA CHEMICALS from PETROCHEMICAL FEEDSTOCKS
Copyright FRIDGE (2004) Page 105
TABLE 37: Fully Absorbed Cost of Production for Bulk Intermediates
MP 96 price ($/kg)
Capital Charge
Fully Absorbed Cost pHB ($/kg)
Fully Absorbed Cost pAA ($/kg)
Fully Absorbed Cost Thymol ($/kg)
Real IRR (%)
1.20 25% 4.45 5.43 2.91 -2.9 1.40 25% 4.99 5.96 2.91 -3.8 1.60 25% 5.53 6.49 2.91 -4.6 It can therefore be seen that the project will not meet an investment hurdle rate higher than 10%41 even at a capital charge of 25% and low feedstock price for MP96 of $ 1.20/kg. The thymol price is independent of the MP96 price, being only dependant on the m-cresol purchase price, which in this exercise has been assumed to be $ 1.80/kg. The thymol technology used in the assessment of this project is the CSIR thymol technology (at pilot level) based on standard technology. The proprietary aspect of the Mbuyu biotech technology lies in the bioresolution step in the menthol process. At a MP96 purchase price greater than $1.40/kg, the pAA fully absorbed cost is greater than the world price. The OMC benchmarking exercise determined that a world OMC producer needs to purchase pAA at a price of $ 4.80 – 5.50/kg to be in a position to produce OMC competitively against BASF on a cash cost basis. It is only at a MP96 price of $ 1.20/kg that the fully absorbed cost is within this range.
It was then determined whether by increasing the thymol sales price, the project could obtain investment economics. Flavour and Fragrance Grade thymol sells at $ 8.00 – 10.00/kg. A price range of $ 6.00/kg was therefore chosen. All other intermediates were sold to the Aroma Chemical plant at a fully absorbed cost price calculated as above using capital charges in the range 10 - 25%. The results of this analysis are shown in Table 38. The return on Aroma Chemical plant is also indicated.
41 Assuming a real IRR of 10% is the absolute minimum return to obtain investment economics.
PART 3 – AROMA CHEMICALS from PETROCHEMICAL FEEDSTOCKS
Copyright FRIDGE (2004) Page 106
TABLE 38: Determination of Project Return at Increased Thymol Price ($6.00/kg)
* Assumed as Base Case Clearly, selling thymol to the Aroma Chemical Plant at $ 6.00/kg has the ability to increase the project’s return. At a MP96 purchase price of $ 1.60/kg, the bulk intermediate plant cannot sell pAA to the OMC plant in the range $ 4.80 – 5.50/kg even at a capital charge of 10%. The Bulk Intermediate plant can however purchase MP 96 at $ 1.40/kg and sell pAA to the Aroma Chemical plant at a price within the required range, provided that a capital charge of no more than 10% is charged. At a MP96 price of $ 1.20/kg, the capital charge can be increased up to 25% without compromising the sales price of pAA to the aroma chemical plant. 12.4.2 Conclusion
Selling bulk intermediates to the Aroma Chemical Plant at a calculated fully absorbed cost, including capital charges in the range of 10 – 25%, does not give project investment economics. However, increasing the thymol sales price to $ 6.00/kg, allows the project to achieve returns in the range 9.7 – 12.6% at MP 96 purchase prices of $ 1.20 – 1.40/kg and selling pAA at prices between $ 4.64 – 5.43/kg. At these prices, the Aroma Chemical plant will purchase pAA in the price range required to allow it to compete on a cash cost basis with BASF.
12.4.3 Sensitivity Analysis
A sensitivity analysis on the key project variables was performed. The results are shown as a “Tornado Risk Diagram” in Figure 25. The tornado diagram depicts the extremes of the project IRR around the base case value, with the variables ranked according to their impact on the project IRR. The upper and lower limits depict the ranges over which the particular variable could reasonably be expected to change.
PART 3 – AROMA CHEMICALS from PETROCHEMICAL FEEDSTOCKS
Copyright FRIDGE (2004) Page 107
The base case scenario was assumed to be:
1. MP 96 $ 1.40/kg 2. Capital Charge 10% 3. Thymol sales price $ 6.00/kg 4. Real IRR 9.7%
As expected the Bulk Intermediate plant is very sensitive to the thymol price and the exchange rate. This is as a result of pHB and pAA having substantially lower contribution margins than thymol. As is the case with the Fully Integrated facility where menthol and OMC are the higher value-adding products, thymol is the highest value product on the Bulk Intermediate plant.
PART 3 – AROMA CHEMICALS from PETROCHEMICAL FEEDSTOCKS
Copyright FRIDGE (2004) Page 108
12.5 Conclusion
The optimal portfolio for a fully integrated aroma chemical plant has been defined. The product portfolio includes menthol and OMC but excluded vanillin. A product portfolio excluding both menthol and OMC does not meet investment hurdles. Including menthol in the portfolio increases the project’s return dramatically to 19.2% at capacity of 1,500 tpa. This capacity is deemed reasonable after study of the menthol market. Including OMC to this product portfolio at a capacity of 2,000 tons increases the project’s profitability even further, to a real IRR of 24.8%. The inclusion of either vanillin or ethyl vanillin detracts value from the project, and could only be considered if no new capital was required. In this instance, ethyl vanillin would be the product of choice. The full capital investment is anticipated to be in the order of R 230 million. The CSIR obtained an estimate of the fixed capital investment required for the project was determined based on an inner battery limit for each plant. (Outer battery limit services, utilities and infrastructure would be required in addition to this investment.) The estimate is based on the cost of individual main plant equipment items, to which an installation factor has been applied in order to arrive at a total installed cost. The factored estimate of fixed capital investment has an accuracy of ± 30%. The capital for technical grade pHB, technical grade pAA, fragrance grade pAA and OMC was determined in 2001 at an exchange rate of 6.25. The thymol estimate was performed in 2001 in US$ and the menthol estimate in 2003. For the individual inner battery limit plant areas, a process development allowance factor has been determined and applied to the fixed capital investment for each. The process development allowance is a process contingency and is dependent on the status of the development of the technology. The estimates have been corrected for inflation and are listed in the table below in January 2004 money. 42
The business is most sensitive to the prices for the two key products, namely menthol and OMC. The impact of increasing the world capacity by the tonnages outlined in this report on the world prices should be considered. An entry strategy whereby the proposed capacity is installed as replacement rather than additional capacity would be favoured. A scenario whereby a Bulk Intermediate plant supplying product to a separate Aroma Chemical plant has also been outlined. Selling the bulk intermediates to the Aroma Chemical Plant at a calculated fully absorbed cost, with capital charges in the range of 10 – 25%, does not give project investment economics. The scenario under which a Bulk Intermediate plant would be economically viable is if it sells thymol at higher than fully absorbed cost, considered in this report to be $ 6.50/kg. MP96 purchase prices must be in the range of $ 1.20 – 1.40/kg for the project to achieve returns in the range 10.3 – 12.6%. At these prices, the Aroma Chemical plant will also have investment economics, but more importantly the Aroma Chemical plant will be in a position to purchase pAA in the price range required to allow it to competitively produce OMC and compete on a cash cost basis with BASF.
43 The capital investments are based on the CSIR estimates performed, escalated into 2004 money. The menthol capital estimate was performed on a 1,500 tpa plant.
PART 3 – AROMA CHEMICALS from PETROCHEMICAL FEEDSTOCKS
Copyright FRIDGE (2004) Page 110
13 SOCIO-ECONOMIC IMPACT ASSESSMENT
13.1 Potential Direct Jobs Created
The output of the optimised Aroma and Fine Chemical portfolio as defined above is in the region of R 325 million.44 Based on this product portfolio, a manning structure has been developed using a similar manning philosophy by an existing fine chemicals production facility in South Africa. This manning structure is attached as Appendix 8. A site providing the service, effluent and utility services would be required, however as the site is currently undefined, the nature of the utility and service provider is unclear and therefore the manning associated with such an entity has not been included in the direct job creation count. On this basis, it has been estimated that the number of jobs that will be created by expanding output through implementing a Petrochemical Aroma and Fine Chemicals project will be in the region of 140 to 150. In terms of the jobs created, employees will range from highly qualified managers, engineers, scientists, technologists, and technicians, intermediary-level administrative and sales workers to less qualified process operators and general workers. The estimated number and occupational distribution of jobs expected to be created, is shown in the table below. In the table, the occupational categories is the same as that presented in the HSRC report on “Skills Needs in the Chemical Industries Sector in South Africa”
TABLE 40: Occupational Distribution and Potential Jobs Created – Petrochemical Aroma Chemical Plant
PART 3 – AROMA CHEMICALS from PETROCHEMICAL FEEDSTOCKS
Copyright FRIDGE (2004) Page 111
The occupational distribution of the workers required for the envisaged plants closely mirrors the average distribution of the overall chemical industry. The absence of jobs in the elementary sector is as a result of the cluster concept which states that the services associated with jobs such as security, cleaners and other manual labourers will be out sourced to the utility and services provider. These jobs, as well as the other occupation categories listed, although not included in the table will nevertheless be created by the manning requirements of the utility and service provider.
The skill set requirements identified for the successful manning and operation of the aroma and fine chemicals facility is shown in the table below.
TABLE 41: Type of Skills Needed for the Petrochemical Aroma Chemical Plant
Skills Needs
Managers Specialised Aroma & Fine Chemicals business knowledge Functional specialisation International Marketing Strong soft skills
PART 3 – AROMA CHEMICALS from PETROCHEMICAL FEEDSTOCKS
Copyright FRIDGE (2004) Page 112
The creation of these jobs must be viewed in the context of the customised sectoral skills needs research undertaken by the HSRC on behalf of the Department of Trade and Industry. This report has concluded that it is mainly at the managerial, professional and technician occupational levels that difficulties in recruiting new staff are experienced where vacancies exist. However, employment equity candidates with experience in the chemicals field are hard to find in all occupational levels, with the exception of elementary workers. In the Commodity Organic sub-sector specifically, a lack of skills has been identified in areas such as artisans e.g. instrument technicians, as well as for more specialised processes. The lower level skills such as operators are mainly supplied by means of continuous in-house training. Workers in this sector are generally less skilled than elsewhere. Innovative skills and operational excellence, which it is felt would give local producers a competitive edge, are not readily available. Although workers are generally less skilled than elsewhere, they are coping well. It has been recognised that higher skills levels would help in areas such as problem solving and taking of responsibility. In the fine chemical sector, the Department of Trade and Industry has identified skills gaps mainly related to process operators, formulation technicians, plant superintendents, warehousing and distribution, engineering and maintenance, administration and general management. There is a general shortage of research and development technicians in the sub-sector. The results of the Department of Trade and Industry study are therefore directly relevant to the manning of this new value chain. In addition, it has been reported that there are gaps in the higher skills categories (MSc and PhD). This is in line with the general low number of PhD per capita in South Africa which is 10% of that in Australia and 16% of that of Korea.45
13.2 Potential Indirect Job Creation
Focusing on the direct labour for the Petrochemical Aroma and Fine Chemicals facility therefore does not give a complete indication of the potential job creation as it ignores the fact that additional jobs will also be created in the production of the various inputs for the chemical plant such as the supply of raw materials, energy, cleaning and security services, catering etc. The creation of additional output therefore has a “knock-on” effect, as other sectors of the economy must also expand output in order to supply the new business.
The South African Computable General Equilibrium model has data on the different labour intensities for various sectors of the South African economy.46, 47 The model takes into
45 NACI/DACST publication: South African Science and Technology, Key Facts and Figures. 2002
PART 3 – AROMA CHEMICALS from PETROCHEMICAL FEEDSTOCKS
Copyright FRIDGE (2004) Page 113
account the fact that additional production in one sector requires resources in other sectors and has quantified the magnitude of these “indirect” effects. The Computable General Equilibrium table for the different sectors of the South African economy is attached as Appendix 9. The employment multiplier for the chemical sector is 3.62.
Hence, based on the number of direct jobs created by the Petrochemical Aroma and Fine Chemicals facility, the potential number of indirect jobs in other sectors of the economy expected to be created is 500 - 550.
46 Policies to create Growth and Employment in South Africa: Jeffrey D Lewis, The World Bank Southern African Department, July 2001 47 South African CGE Model
PART 3 – AROMA CHEMICALS from PETROCHEMICAL FEEDSTOCKS
Copyright FRIDGE (2004) Page 114
14 KEY SUCCESS FACTORS
The characteristics, dynamics and key success factors for the different sectors of the chemical industry namely commodity, fine and specialty chemicals differ widely. This is demonstrated below in Table 42. Speciality and Fine chemicals are defined as follows: • Fine Chemicals are pure, single substances sold on the basis of their chemical identity to
an agreed chemical specification. They are differentiated from commodity chemicals by price, and generally sell for $5/kg or higher.
• Speciality Chemicals are sold to performance specifications for what they do i.e. they are bought and sold for their effect. They are rarely identified by chemical composition. They could be single compounds or mixtures of substances formulated with carriers or solvents. They almost always require formulating know-how, even when the products sold are complex synthesised molecules. Very often, the exact chemical compositions are trade secrets, and there can be many possible formulations for the same purpose. They are sometimes therefore referred to as “effect” or “functional” chemicals.
Table 42: Organic Chemical Industry Characteristics48
Commodity
Chemicals Fine Chemicals Speciality
Chemicals Industry Characteristics
Product Differentiation None Low High Product Prices < $ 5/kg >$5/kg >$10/kg Value Added Low High High R&D Focus Process
Improvement Process Development
Application/ Product
Capital intensity High Moderate Moderate/Low Key Industry Success Factors
Petrochemicals Aroma and Fine Chemical Value Chain
Bulk Intermediates pHB, pAA, tech. grade thymol
Aroma Chemicals OMC, Menthol, flavour grade pAA
48 The Fine Chemicals Industry – the exodus outside the Triad? E Polastro, J Nylstrom (A.D. Little)
PART 3 – AROMA CHEMICALS from PETROCHEMICAL FEEDSTOCKS
Copyright FRIDGE (2004) Page 115
As one moves up the value chain therefore, the main key success factors for fine and speciality chemicals are more related to know-how, the provision of technical services and close customer relationships rather than just low delivered prices. Reliable, consistent product quality and the ability to meet an approved organoleptic profile in the case of aroma chemicals become of paramount importance. The portfolio of petrochemical aroma chemicals, menthol, OMC, ethyl vanillin and vanillin have the characteristics of fine chemicals, whereas technical grade pHB, technical grade pAA and thymol, the bulk intermediate inputs, resemble bulk commodity chemicals in nature. Due to the concentration in the fine chemicals industry which started a few years ago, current new regulatory and competitive elements have introduced a new element, the need and scope for economies of scale and overall efficiencies. These new key success factors are associated with the:
• More stringent environmental and operating requirements requiring a sizeable investment in non-directly productive assets e.g. quality control and environmental compliance. This imposes a minimal critical mass to spread the fixed costs associated with these.
• Generally more competitive and volatile market environments. Companies therefore need to rely on a broader portfolio of products in order to avoid an excessive dependence on a single product and/or customer group.
• Changing customer requirements. Customers now tend to look for suppliers that can provide complete service capabilities.
• Emergence of new competitors particularly outside of the traditional fine chemicals countries such as Europe and the USA. These competitors often have substantial cost advantages. The emergence of these players has resulted in overcapacity in many markets, resulting in collapsing prices and the exit of marginal players.
Clusters of companies with broad technology and product portfolios have emerged. This is a significant change compared to the past where companies in the industry tended to compete mainly in selected niches and with limited sales. Critical mass is generally estimated to be in the region of $ 50 million.49
It is within this general context that this study has identified a number of specific key success factors relevant to a potential new entrant/investor in the proposed Petrochemical Aroma and Fine Chemical business.
49 Towards High Performance in the Fine Chemicals Industry: E Polastro
PART 3 – AROMA CHEMICALS from PETROCHEMICAL FEEDSTOCKS
Copyright FRIDGE (2004) Page 116
14.1 World-Scale Businesses
The minimum economic size for stand-alone plants have been determined, and for the pHB and pAA plants this was considered to be 2,000 tons. However, as the production of neither of these intermediates is proposed as pure stand-alone businesses marketing the intermediates internationally, their inclusion into a portfolio of aroma chemicals allows some flexibility with respect to capacity. Capacities for pHB and pAA of 1 690 tpa and 1 720 tpa respectively have been determined through a techno-economic analysis of the optimised basket of products. These capacities are within the range of the economy of scale. The optimised product portfolio as defined above is $ 40 million. This business is large enough to offer a viable product and technology portfolio and to present a credible partner to end user industries. The competitive advantage presented by the CSIR technology will offer a unique technological capability, allowing the combination of a number of aroma chemicals to be produced, thereby giving a business of critical mass.
14.2 Implementing leading edge technology
Within the context of the petrochemical portfolio of aroma chemicals, although menthol, OMC, ethyl vanillin and vanillin have the characteristic of fine chemicals, these specific products are mature products in the late stage of their product life cycles. These products therefore compete mainly on price. Reliable, consistent product quality is assumed as a given by the market. Verification of this however forms part of the extensive product qualification process. Thus, a critical success factor for sustainability and competitiveness of the value chain is that the producer of the aroma chemicals part of the chain has a cost position comparable with the lowest cost producer of these specific products. The pHB/pAA and Mbuyu Menthol technologies per se are mobile, and there is nothing inherent in the processes making them distinctively South African. The technologies could in fact be implemented anywhere in the world using any of the commercially available mixed cresol products. The evaluation of the technology packages (both benchmarking and investment analyses) were performed on the basis of using any commercial mixed cresol feedstock provided it meets the technology requirements. The evaluation of the technologies however has been done within the framework of the value chain proposed in this study on the naturally arising m-cresol.
In the case of this value chain and product portfolio, the technology-driven competitiveness of the CSIR technologies for pHB and pAA production has been demonstrated by benchmarking exercises against the international market leaders. The methodology used was to benchmark the processes on an international basis (in US $) in order to determine the technologies inherent competitiveness. This approach was adopted particularly to ensure
PART 3 – AROMA CHEMICALS from PETROCHEMICAL FEEDSTOCKS
Copyright FRIDGE (2004) Page 117
that the processes would not be dependant on any exchange rate advantages, which may or may not be sustainable. The competitiveness of a South African pAA producer employing the pHB-pAA technology developed by the CSIR was benchmarked against the world’s leading producer, Atul. The analysis demonstrated that the producer would be able to compete and retain its competitive position should it source MP96 at a purchase price of $ 1.40/kg and sell the naturally arising by-product m-cresol at prices greater than $1.80/kg.
It has been discussed earlier that in order to compete in the pAA merchant market, a producer must sell a substantial quantity of product to an OMC producer. The benchmarking analysis determined that a South African OMC producer with a captive source of pAA from a dedicated pAA plant will be able to compete on a cash cost basis with the market leader, BASF, provided that it can purchase the mixed cresol at a price of $1,250–1,560/ton (100% cresol) and that it can sell m-cresol at prices greater than $ 1,800/ton. The OMC competitiveness can be achieved with existing commercial OMC technology. South Africa does not as yet have access to an internationally competitive OMC technology, the technology would have to be licensed internationally to kick start the production of aroma chemicals in this value chain.
The novel menthol technology developed by the CSIR is inherently a competitive process compared to existing commercial process routes. This is related to the key biotransformation step of the menthol isomers. At the m-cresol sales prices required in order for the pHB-pAA-OMC process to be competitive, the menthol technology process has a substantial advantage over the current synthetic cost leader, Symrise. The use of the naturally arising m-cresol from the pHB-pAA-OMC process therefore could be used to produce menthol in an optimised facility for the production of these products without rendering either of the processes uncompetitive.
Investment economics for these products would be achieved under the scenario outlined in the techno-economic evaluation.
14.3 Implementing Leading Edge Operations
14.3.1 Location: World-class services and infrastructure
The assessment of the technology packages was performed on the basis of an Inside Battery Limit capital estimate, and the provision of utilities and services being supplied over the “fence”. The prices for the utilities at which the producer would be competitive have been defined and the major utility requirements for the complex envisaged quantified for the purposes of a techno-economic evaluation. The
PART 3 – AROMA CHEMICALS from PETROCHEMICAL FEEDSTOCKS
Copyright FRIDGE (2004) Page 118
requirements were significant, and could potentially justify a stand-alone utility facility although there is insufficient process detail to fully specify the utilities facility.
1. The facility is a relatively high specific steam consumer (~140 000 tpa). Each
of the individual plants raising or purchasing (depending on different site locations in South Africa) its own steam would detract from the beneficial economy of scale.
2. Refrigeration capacity, potable water supply, air supply, and cooling water supply for the plants purchasing large quantities of power from an electricity supplier (15,5 MWh) would benefit from scale of operation.
3. Various liquid and solid effluents requiring process treatment prior to disposal could be centralised.
4. By centralising utilities and services, the manning structures could be simplified thus reducing the manning cost.
Combining utilities and services into a separate entity could allow such an entity to benefit from economy of scale and allow it to be recognised as a much lower risk business that could apply lower investment hurdle rates to its operation. Such a site would therefore, through the utilities and services business entity, provide the service, effluent and utility cost synergies. The project as proposed would provide the basis upon which this can be realized. This site should also have the potential for expansion. The site must in addition maintain the highest environmental and safety standards. This will give South Africa an advantage over many countries where the adherence to safety and environmental regulations is often sub-standard. Customers routinely inspect the facilities of potential suppliers to assess not only their adherence to good manufacturing procedures and quality-control practices, but also their environmental and safety practices and standards. South Africa subscribes to the major international environmental conventions, including the Basel Convention on the Trans-boundary Movement of Hazardous Wastes. Recently the government has introduced regulations aimed at promoting cooperative environmental management and providing guidelines for the disposal of hazardous waste. The chemical sector in South Africa subscribes to good environmental, health and safety practices. Safety standards are rigorously enforced, and most producers are participants in the Chemical and Allied Industry Association’s Responsible Care Programme. It is considered that South Africa’s position with respect to Environmental Compliance internationally will not be a critical constraint in the establishment of this value chain.
PART 3 – AROMA CHEMICALS from PETROCHEMICAL FEEDSTOCKS
Copyright FRIDGE (2004) Page 119
There could be a number of such potential sites within South Africa, which could provide the basis for this world-class utilities and services entity. 14.3.2 Labour and Staffing
The ability of a country to supply properly trained staff is critical to the success with which the plants will operate. Most plants in the USA and Western Europe are efficiently designed, built, operated and maintained and therefore operate at optimum efficiency. The supply of skilled scientists and engineers at all levels is therefore a critical success factor. For both Bulk Intermediates and the Aroma and Fine Chemicals, in order to stay competitive into the future, it is essential that the producer maintain its cost leadership position. The producer should therefore have an ability to implement continuous improvement manufacturing processes as well as to develop and apply process enhancements. This study has determined that the occupational distribution and skills requirements of the Petrochemical Aroma and Fine Chemical value chain mirrors those of the overall chemical industry sector. Typical skills required include: batch processing, small plant operation, product formulation, industrial chemical synthesis etc. It has however been stated in section 1.1 that the South African fine chemical industry and the downstream chemical processing industry is relatively underdeveloped. South Africa has a shortage of suitably trained personnel capable of developing and implementing competitive fine chemical technologies and operating fine chemicals batch process plants.
14.4 Accessing Secure and Competitively Priced Raw Materials
A South African pAA producer using the CSIR developed technology would have the flexibility of starting with a feedstock of varying compositions of p-cresol and m-cresol, ranging from pure p-cresol to a mixture consisting of 40% p-cresol and 60% m-cresol, such as MP99 supplied by Mitsui or Sumika-Merichem. Despite this raw material flexibility, from a reaction chemistry perspective, the ideal composition is a mixture consisting of 50% p-cresol and 50% m-cresol, as would be the case with Merisol’s MP99 and MP96 cresol products.
The benchmarking and techno-economic evaluation exercises have indicated the purchase price for MP96 at which the project will have investment economics and at which the producer can supply the products at internationally competitive prices. A mixed cresol feedstock price, equivalent to a pure (100%) cresol price of no more than $ 1,250 – 1,458/ton, is required for the project to be potentially viable.
PART 3 – AROMA CHEMICALS from PETROCHEMICAL FEEDSTOCKS
Copyright FRIDGE (2004) Page 120
14.5 Producing product of consistent quality and quantity
The market is characterised by the fact that flavours and fragrance formulations depend on consistency of supply, both as to quantity and quality. Most end users have a precisely defined specification for their ingredients and it is not unusual for a formulation for a product to have been developed around a particular specification or organoleptic quality acquired from a certain source of the ingredients. High product quality and reliability of supply would depend on reliable processes and equipment and the application of high manufacturing standards. This again emphasizes the need for adequately trained staff. The ability to meet the organoleptic requirements of the customer depends on the skills of a “flavour” chemist or olfactory expert. The job requires very specialised technical knowledge. A Chieta Report50 reports that it is practically impossible to recruit flavourists in South Africa. People with this specialisation gain their skills over many years, very often overseas. South African based multinational Flavour and Fragrance houses often recruit these skills from their overseas counterparts on contract. The critical shortage of skills in this particular area is primarily related to the stage of development of the industry.
It has been reported by the Chieta Skills Needs study that there is an inadequate focus by academic institutions on speciality, functional and bulk formulated manufacturing. Research education in the areas of application-based and formulation-based chemistry is almost non-existent. The academic institutions tend to focus more on technical and theoretical concerns, while commercial issues, especially those related to the identification of commercial process opportunities, are neglected. This presents another critical gap in South Africa’s capability of meeting this industry requirement.
14.6 Securing Market Access
The aroma chemical and essential oils industries are characterised by the difficulty of penetrating the international market. Once a product is formulated around a particular supply of aroma chemical, it is very difficult if not impossible for the end-user to change its source of supply. Most aroma chemical purchasers will not change to a new source of supply for a temporary price advantage.
In order to secure reliable markets, there is a long process of “courtship” that must be engaged in. This involves the presentation of samples, the making of adjustments to product or organoleptic quality and the giving of assurances of stable supply. The approval process
50 Skills Needs In The Chemical Industries Sector In South Africa Research conducted for the Chemical Industries Sector Education and Training Authority and the Department of Trade and Industry.
PART 3 – AROMA CHEMICALS from PETROCHEMICAL FEEDSTOCKS
Copyright FRIDGE (2004) Page 121
involves the supply of pilot plant produced samples first for the initial approval, and then actual samples of production lots for final approval. Whilst this barrier to entry is high, once relationships have been developed with international purchasers, stability of off-take is assured, provided that the specifications continue to be met. As the size of the regional market for all of the products considered is negligible, the majority of the plant’s capacity must be exported in order to achieve maximum plant loading. An international marketing position is therefore essential.
The two major drivers in the proposed product portfolio are menthol and pAA. The major market for pAA is OMC, and it has therefore been proposed that the forward integration of the production of OMC from pAA is considered. Hence, a strategy of obtaining market access and securing these long-term relationships for both menthol and OMC must be formulated.
Menthol A new synthetic producer should not repeat Haarmann and Reimer’s51 mistake in entering the market without committed supply contracts. In 1978 when Haarmann and Reimer opened its second synthetic menthol plant, a 1,100 ton plant in the USA, international plantings of Mentha Arvensis, the source of natural menthol, also increased simultaneously. This over-supply lead to depressed prices from 1980 – 1984 and Haarmann and Reimer filed an anti-dumping action against Japan and China. Although the US International Trade Commission ruled that the Chinese had dumped menthol into the US market by selling at less than production costs, Haarmann and Reimer, which was a subsidiary of Bayer AG in Germany at the time, had not suffered a significant financial loss.52 Hence the major buyers could be sought out, and long-term supply contracts entered into initially before any funds are committed to a new facility. The best strategy would be to seek an existing synthetic producer in an attempt to persuade them to co-invest in a new plant in South Africa using the Mbuyu Biotech technology. Octylmethoxycinnamate The competitive analysis of world pAA/OMC production carried out has shown that no current pAA-based OMC producer can compete with BASF. The analysis furthermore also shows that pAA prices would have to be reduced to below the cash cost of production of Atul in India, the lowest-cost producer, for the OMC producers to have a cash cost lower than that of BASF. This analysis can therefore
51 Now Symrise 52 G Clark: Perfumer and Flavourist: Vol 23. Sept/Oct 1998
PART 3 – AROMA CHEMICALS from PETROCHEMICAL FEEDSTOCKS
Copyright FRIDGE (2004) Page 122
also conclude that the only way existing OMC producers are going to effectively compete with BASF is:
• For the OMC producer to own the whole value chain from p-cresol through to OMC via PAA, or to be intimately involved in it, or
• For the OMC producer to locate its production facility in a country with a competitive cost base, since the cost base of 1st world countries preclude acceptable economics from being achieved.
For these reasons, existing OMC producers could consider producing OMC in China or together with Atul in India. However, these countries very often are viewed as having 3rd world production capability. South Africa, though, represents a significant opportunity. In particular, it has been demonstrated that use of a competitive OMC technology, coupled with the CSIR pHB/PAA technology will have definite advantages for existing producers in terms of its cost of production and its competitive position opposite BASF. By transferring production to South Africa, the pAA-based OMC producer would become competitive with BASF, but would also give it a lower cash cost of production, ensuring a long-term survival in the OMC market.
It is therefore proposed, that an alliance or strategic partnership with an existing pAA based OMC producer be explored. This partnership would secure market access for the South African pAA producer and in addition, an alliance would serve to bring technology for the production of OMC to South Africa.
A strategy of entering into long-term strategic partnerships or alliances with existing menthol and OMC producers would secure off-take from the proposed business.
14.7 Ability to research, develop and commercialise new Aroma and Fine Chemicals
It is a necessity for a new producer to have access to a capability of researching, developing and commercialising new aroma chemicals in order to own a balanced technology portfolio and for growing the future business. The ability to rapidly respond to changing customer requirements or to fill an identified gap in the market requires a high level of innovation. For those companies with limited resources developing and commercialising new products will be a problem.
Given the fact that South Africa’s system of innovation currently represents less than 1% of global innovation activity, there will most likely always be a source of new technologies that should be accessible for adaptation or improvement within the South African environment. In addition, a number of small volume high-value aroma chemicals which have the potential to add to the portfolio outlined in this study have been identified. Examples include the menthol
PART 3 – AROMA CHEMICALS from PETROCHEMICAL FEEDSTOCKS
Copyright FRIDGE (2004) Page 123
derivatives such as menthyl isovalerate and menthyl acetate, zingerone, heliotropin, p-anisyl alcohol and musk ambrette to name a few. These products would add to the product portfolio and potentially establish a platform for future innovation of novel aroma chemicals. Little work has been done internationally on developing any analogues of menthol. The industry would like to see the effect of modifying the basic structure of the menthol molecule and how these modifications could affect both odour and the cooling effect.53 Development of these products into commercializable technologies will require funding. The later stages of innovation (scale-up, product introduction, process engineering, and new plant trials) are expensive and remain technologically risky.
Recent research has shown that the commercialization of new chemical processes in South Africa is not efficient. Innovations, patents and technology transfer are not sufficiently rewarded as core tasks of academics and researchers at academic institutions.54 This focus is reflected in the relatively low number of patents per South African scientist. Start-ups are derived at a low level of 2 per 100 patents in South Africa, vs the international norm of 10 to 15 start-ups for every 100 patents.55 The latest customized sectoral research undertaken by the Department of Trade and Industry identified a lack of skills in the chemical sector, amongst these in the field of research and development technicians.
In addition, the recent Emerging Biotechnology Roadmap found that a substantial financial gap to bridge the chasm between innovation and commercialization remains. Funds are too limited and the time frame for funding is often too short. 56 The same can be said for downstream chemical industry. Whilst there are a number of existing financing instruments in South Africa criteria applied limits funding sources available for research and innovation for new start-up companies, or companies without substantial existing international exposure. Typically, the criteria requires the project to demonstrate a large degree of radical innovation, whilst at the same time insisting that applicants provide take-off agreements from potential customers. In the aroma, flavour and fragrance industry, it is unlikely that any commercial partner would commit to purchasing product before being supplied with material obtained from pilot plant trials, and substantial guarantees that commercial production would commence within a reasonable timeframe. In addition, current sources of research funding often do not consider process innovation to produce known or existing products, sufficient to provide a competitive advantage, often insisting on new innovative end-products. Yet in direct contrast, there is a prerequisite that the commercial partner should have demonstrated substantial experience in manufacturing
53 G.S. Clark: Perfumer and Flavourist; Vo. 23, 1998 54 Draft Emerging Biotechnology Roadmap: Department of Science and Technology: November 2003 55 National Biotechnology Audit: September 2003 56 Draft Emerging Biotechnology Roadmap: Department of Science and Technology: November 2003
PART 3 – AROMA CHEMICALS from PETROCHEMICAL FEEDSTOCKS
Copyright FRIDGE (2004) Page 124
or marketing the product or similar product. The general risk averseness on the part of financiers and the lack of appropriate Venture Capital funders therefore severely hampers the creation of new value chains or new enterprises based on utilizing current sources of research or indeed even the creation of new value chains based on innovative technologies.
It is widely accepted that 9 in 10 SMEs in South Africa fail within the first two years of operation.57 Research conducted by the European Union, concluded that business incubation is one of the leading strategies to enhance the overall survival rates of SMEs. In developing countries, incubation survival rates tend to rank above 85% in countries with strong support from the Government and tight links with the University/Tertiary system. The relatively low cost per job compared with other public means and programmes and other quantifiable benefits demonstrated by business incubators covered by research suggest that they are very effective methods of promoting knowledge intensive, new technology-based activities. There is therefore strong evidence to suggest that incubator initiatives can contribute to the building of an Aroma and Fine chemical value chain by increasing the success rate of start-up companies.
57 Godisa News: February 2002: Business Incubation “ the ultimate way to increase the survival of SMEs”
PART 3 – AROMA CHEMICALS from PETROCHEMICAL FEEDSTOCKS
Copyright FRIDGE (2004) Page 125
15 CONCLUSIONS
The growth of a globally competitive and sustainable aroma and fine chemicals industry in South Africa, given the state, history and legacies of the South African chemical industry, is a challenging target. Achieving this will require the rapid implementation of a number of the initiatives already identified by the Department of Trade and Industry to stimulate and grow the chemical industry sector. The Department of Trade and Industry’s Integrated Manufacturing Strategy has recognized that the previous strategic options that focused on the dependence on local raw materials, cheap labour, proprietary production technology and privileged access to markets are no longer sustainable. Increasingly, highly trained human resources, continuous improvement, technological innovation and smart acquisition of know-how will become the major differentiators for growth and sustainability of the chemical sector in South Africa. A producer of the proposed portfolio of products will have to compete with well-established major players in these markets. To become globally competitive, it will have to generate a significant and sustainable competitive position to succeed. Based on the AECI/CSIR technologies, the techno-economic analysis for an optimized Aroma and Fine Chemicals portfolio, produced from a mixture of a petrochemical based, meta- and para-cresols feedstock, within the context of the South African fiscal and economic environment, identified two potential economically viable business cases for establishing a local Aroma and Fine Chemicals value chain:
1. A Fully Integrated business producing 1,500 tpa menthol, 2,000 tpa OMC
2. An upstream Bulk Intermediates business displaying commodity type characteristics producing 1,720 tpa pAA and 2,000 tpa m-cresol, coupled with a dedicated downstream Aroma and Fine chemicals business consuming the pAA and m-cresol to produce 1,500 tpa menthol and 2,000 tpa OMC.
The Study concluded that the technologies for pHB, pAA and menthol are internationally competitive against the world leaders provided that a mixed cresol feedstock price, equivalent to a pure cresol price of $ 1,250 – 1,458/ton is obtained and the m-cresol price credit exceeds $ 1,800/ton. The technologies for vanillin and ethyl vanillin are however not competitive against the major world producers.
The Study furthermore indicated that a far greater stumbling block than competitiveness against the pAA market leader is the pAA prices required by the end-user OMC producers to compete with the cost leader in this market. The OMC market leader uses a different and more competitive process. These pAA prices are extremely low compared to market prices
PART 3 – AROMA CHEMICALS from PETROCHEMICAL FEEDSTOCKS
Copyright FRIDGE (2004) Page 126
and it is doubtful that these prices could be matched on a plant based on any current or developed pAA technologies. A South African fully integrated OMC producer using internationally competitive technology could however be competitive against the world leader at the indicated mixed cresol and m-cresol prices. This Study therefore concluded that a South African pAA producer should be fully integrated through to the production of OMC in order to compete. Technology for the production of OMC from pAA has not been developed in South Africa. Furthermore, it is still covered by patent protection.
The aroma chemical industry is characterised by the difficulty of penetrating the international market. Aroma chemical formulations are developed around a particular specification or organoleptic quality acquired from a certain source of the ingredient. It is therefore very difficult for the end-user to change its source of supply once a product is formulated. Securing market access and establishing long-term customer relationships is critical to success in this value chain. This is particularly valid for menthol and OMC, the key drivers within the proposed suite of products. A number of small-volume high-value Aroma Chemicals, which could be added to the portfolio of products in this value chain, have been identified. These include zingerone, heliotropin, p-anisyl alcohol, musk ambrette and menthol derivatives such as menthyl isovalerate and menthyl acetate. These products may be more suited to production by SME type businesses. This study therefore has concluded that the goal of establishing a globally competitive and sustainable Aroma and Fine Chemical value chain can be achieved through an investment in the optimized portfolio of products by:
( Erecting world-scale plants as business clusters for selected products, rather than a
few disparate small operations; ) Implementing leading edge technologies and operations; ) Accessing secure and competitively-priced raw materials; ) Securing market access; and ) Constantly innovating and introducing new products into the portfolio.
Although this FRIDGE study clearly demonstrated that South Africa has access to an internationally competitive suite of enabling technologies relevant to the production of a portfolio of Aroma and Fine Chemicals, it also highlighted the fact that South Africa lacks a number of critical factors required in order to implement this new value chain.
) South Africa has a shortage of suitably trained personnel capable of developing and
implementing competitive fine chemical technologies.
PART 3 – AROMA CHEMICALS from PETROCHEMICAL FEEDSTOCKS
Copyright FRIDGE (2004) Page 127
* The ability to meet the organoleptic requirements of the customer depends on the skills of a “flavour” chemist or olfactory expert. These skills are however practically impossible to recruit in South Africa.
* A substantial financial gap to bridge the chasm between innovation and commercialization remains. Funds are limited and the expected time frames for return on investment are generally too short.
Based on the project techno-economics of the optimized product portfolio and the demonstration of a suite of competitive technologies, commercialization of this value chain could therefore represent an attractive opportunity for South Africa as a platform for the launch of an Aroma and Fine Chemicals value chain in South Africa. However before this can be achieved, the constraints impeding the creation of this value chain must be removed in order to prevent the technologies moving offshore to countries where these limitations do not exist and so potentially denying South Africa from benefiting from the opportunity to locally commercialize in-house developed novel technologies.
PART 3 – AROMA CHEMICALS from PETROCHEMICAL FEEDSTOCKS
Copyright FRIDGE (2004) Page 128
16 RECOMMENDATIONS
16.1 Value Stream Recommendation
Strategic Intervention: To motivate the establishment of an Aroma and Fine Chemicals platform based on a mixed cresols feedstock, deploying the CSIR and Mbuyu Biotech suite of technologies to produce the portfolio of products identified in this FRIDGE study, comprising the pHB-intermediate, technical and flavour grade pAA, menthol and OMC as the first phase.
Specific strategic recommendations
1. Develop a strategy to elicit interest from prospective investment parties that have the capacity of completing a detailed business feasibility study into launching the Aroma and Fine Chemical platform and developing a detailed implementation strategy. The investment partner must therefore have the capacity of ensuring that the following are achieved:
- Identify and secure a source of mixed cresol feedstock at a price equivalent to a pure cresol price of no more than $ 1,250 – 1,458/ton.
- Secure the key enabling technologies for the portfolio of products and
ensure that all process development is completed and ready for implementation.
- Secure an internationally competitive technology in respect of OMC. - Define the detailed utility and service requirements for the envisaged
complex. - Identify and select a potential site capable of providing the utility and
services requirements at competitive input costs. The site should have the potential for expansion.
- Develop a strategic plan to attract international strategic alliance partners
for menthol and OMC by leveraging the fact that the global competitiveness of the technologies and the potential business can be demonstrated.
2. Facilitate the provision of a world-class site; a secure competitive feedstock; well-
trained professional staff, thereby increasing the prospect that an international strategic alliance partner/s can be secured by the prospective investment partner.
PART 3 – AROMA CHEMICALS from PETROCHEMICAL FEEDSTOCKS
Copyright FRIDGE (2004) Page 129
Strategic Intervention: To motivate the incubation of the smaller volume aroma chemicals as a second phase investment by SMEs by South African downstream processing incubators.
Specific strategic recommendations
1. Develop a strategy for the smaller volume high value aroma chemicals not included in the Aroma and Fine Chemicals platform project as the second phase of investment in expanding the value chain. Use could be made of the relevant sectoral incubators.
16.2 Cross-cutting Recommendations
16.2.1 Skills Development
The limited availability of skills has been cited as a constraint to growth in the chemical industry. Strategic Intervention: To target training interventions by assessing the skills development requirements of existing Aroma Chemical, Essential Oil and Plant Extracts, and Flavour and Fragrance industries. Specific strategic recommendations
1. Develop learnership programmes with the qualification of specific skills in technical formulation and olfactory related subjects. Olfactory related subjects should also be taught by the higher education institutions at post-graduate level.
2. Encourage learnerships within a ‘new’ qualification of technical sales, in support
of the fine and speciality chemicals sub-sector. 3. Develop a strategic plan whereby existing research organisations and fine
chemicals companies could play a pivotal role in the training of technical skills. Technologist exchange programs with the new aroma and fine chemical business could be implemented to train and hone operational skills (by the trainee working on pilot or existing manufacturing plants) and scientific skills (through supplementing technical resource requirements on development projects).
4. Develop training programmes at higher education institutions aimed at furnishing
post-graduates with skills targeted at the downstream chemical manufacturing industry. Courses should include aspects of fundamental chemical training, such as industrial chemical synthesis, batch processing, small plant operation, and
PART 3 – AROMA CHEMICALS from PETROCHEMICAL FEEDSTOCKS
Copyright FRIDGE (2004) Page 130
product formulation. Post-graduate skills with respect to the successful transfer of laboratory procedures into commercially viable production processes should also be taught. These programmes should furthermore include a strong entrepreneurial and business development component, including modules in accounting, business economics, marketing, strategy, management of operations, quality and project management. This will promote the training of numerate graduates with the unique combination of technical as well as management skills.
5. Promote industry-led programmes and networks leading to collaborative efforts
between academia and industry. An example is the United Kingdom’s BRITESTTM programme. This programme’s specific objective is for private companies to participate and provide leadership for projects designed to enhance the industrial relevance of university research and make it more broadly available to industry. The programme focuses on early stages of chemical processes where chemists’ ideas are converted into process applications at industrial scale. The outcome of the programme is the innovative development of better approaches for scaling up from test-tube to production plant in the downstream manufacturing industries, thereby improving economic competitiveness. The programme promotes access to creative development in science, engineering and technology, as well has ensuring a continued supply of well-trained scientists and engineers. This interaction will furthermore serve to increase awareness about the skills required and used in the chemical industry.
16.2.2 Development of a Pipeline of Aroma and Fine Chemicals
Aroma and fine chemicals companies are dependant on their ability to create innovative products in order to grow sales, create markets and add value to existing products.
Strategic Intervention: To develop a balanced portfolio of a future pipeline of products.
Specific strategic recommendations
1. Hold discussions with South African Flavour and Fragrance houses (both local and international) to explore the potential for integration of the nascent aroma and fine chemical industry into their activities. These discussions should identify further opportunities for the manufacture of a pipeline of Aroma Chemicals specifically selected as being relevant for the regional market.
2. Identify technology partner/s for the research and development of a future pipeline
of Aroma and Fine Chemicals to this value chain. The partner/s should be
PART 3 – AROMA CHEMICALS from PETROCHEMICAL FEEDSTOCKS
Copyright FRIDGE (2004) Page 131
research organizations/institutions with specific experience in the field of Aroma and Fine Chemical research and innovation.
3. Consider the use of existing pilot plant and small-scale toll manufacture
infrastructure to reduce the risk of full-scale dedicated investments by allowing technology testing, scale-up and early market penetration for the Aroma and Fine Chemical business. Such infrastructure will have to comply with current Good Manufacturing Practice. The manufacture of small pilot scale quantities would allow early assessment of the product’s ability to meet market needs, and will promote direct customer interaction at an early stage. Furthermore, new products or changes to existing product specifications could rapidly be implemented and tested within the customer’s flavour and fragrance formulation or product. The Aroma and Fine Chemical business can therefore meet the requirement of customer responsiveness before a full-scale investment in new capacity is required.
4. Develop a strategic plan to incubate the smaller volume aroma chemicals
identified and proposed as a second phase investment by the South African Downstream Processing incubators. This process will increase the success rate of the start-up companies and provide some of the skills needs, both business and technical, identified as being critically required by the South African chemical industry.
16.2.3 Support of the innovation cycle
An innovation chasm in the phase between research and development and the commercialisation of viable products has been identified. Overcoming these constraints is critical to ensuring the longer-term sustainability of this industry. Strategic Intervention: To bridge the innovation chasm between research and development and the commercialisation of viable products. Specific strategic recommendations
1 Review the funding process for the latter phase of technology innovation i.e. scale-up, product introduction, process engineering, and new plant trials, before projects meet the criteria for private sector investment. This could have a direct impact on stimulating industry demand for research.
2 Involve potential funding sources in the formulation of policy and strategy for the
development of the industry. These agencies need to be informed of the
PART 3 – AROMA CHEMICALS from PETROCHEMICAL FEEDSTOCKS
Copyright FRIDGE (2004) Page 132
dynamics of the industry so that they can properly develop funding packages to meet the needs of the industry. Furthermore, the industry needs to determine what factors need to be in place in order to make the industry more attractive to these institutions.
16.2.4 Integration into the downstream Flavour and Fragrance Industry
Consideration should be given to the development of complementary value chains in the fields of flavour and fragrance formulation, cosmetics and nutraceuticals. These draw heavily on the same skills and experience base. Strategic Intervention: To begin the process of integrating the Aroma and Fine Chemical value chain into the next stage of the Flavour and Fragrance Industry (i.e. Step 2). Specific strategic recommendations
1 Promote education and skills development in the downstream flavour and fragrance industry and the complementary industries of cosmetics and nutraceuticals. South African tertiary institutions should therefore provide courses in cosmetics and flavour and fragrance formulation.
2 Develop at least one regional centre of excellence in each of the areas of flavour
and fragrances, cosmetics and nutraceuticals. These should take advantage of the synergies afforded by the presence of tertiary institutions (producing graduates in agriculture, botany, chemistry, pharmacology and having laboratory facilities etc.)
PART 3 – AROMA CHEMICALS from PETROCHEMICAL FEEDSTOCKS
Copyright FRIDGE (2004) Page 133
REFERENCES and BIBLIOGRAPHY
AECI Report: A literature review on the synthesis of cinnamic acid and derivatives: SJ Heggie, 1998
AECI Report: “Synthesis of Raspberry Ketone”: M Portwig, CJ Parkinson, September 1998
Agric. Biol. Chem. 29 (9), 824 (1965)
Bull. Chem. Soc., Jpn. 47,2360 (1974)
Brychem 1998: Dr Rob Bryant
Cameron & Stuart: Communication
Chem. Ind. (London), 236 (1964)
Chemicals SA 2003: South Africa’s Petrochemical Industry – Globalisation, Restructuring, and Government Policies
Chemical & Engineering News: July 14, 2003
Chemical & Engineering News: Estimates May 2002
Chemicals SA 2003: South Africa’s Petrochemical Industry – Globalisation, Restructuring, and Government Policies
Chieta Report: “A Demographic Profile of the Workforce in the Chemical Industries Sector and Sub-sectors” May 2002
HSRC Chieta Report “Skills Needs by the Chemical Industries Sector in South Africa” December 2003
SRI Chemical Economic Handbook Report: Aroma Chemicals and the Flavour and Fragrance Industry August 2001
Chemical Marketing Reporter: November 27, 2000
Chemical Marketing Reporter: Vol. 249, Issue 17, 1996
CSIR Bio/Chemtek website
CSIR Bio/Chemtek Documentation
Department of Science and Technology: A National Perspective: Contribution of Research and Innovation to the SA Economy.
Department of Trade and Industry Web-site: Overview of the South African Chemical Industry
Draft Emerging Biotechnology Roadmap: Department of Science and Technology: November 2003
Freedonia Group News Release 2003
PART 3 – AROMA CHEMICALS from PETROCHEMICAL FEEDSTOCKS
Copyright FRIDGE (2004) Page 134
IAL Consultants 2000: An Overview of the Global Flavours and Fragrances Market
ISHECON Report: May 1999
ISHECON Report: February 2000
S Jindal, Jindal Drugs: The Menthol Industry in India, IFEAT Conference 1999
Leffingwell and Associates
NACI/DACST publication: South African Science and Technology, Key Facts and Figures. 2002
National Biotechnology Audit: September 2003
Perfumer and Flavorist Vol 23, 1998: Menthol - An Aroma Chemical Profile; G.S. Clark
Perfumer and Flavourist: Vol 23. Sept/0ct 1998 G.S. Clark
Perfumer and Flavourist; Vol. 23, 1998 G.S. Clark
Seminar at the Helsinki School of Economics (April 10, 2002): The New South Africa - Opportunities for Trade, Investment and Partnership
South African Commutable General Equilibrium Model
E Polastro, J Nylstrom (A.D. Little): “The Fine Chemicals Industry – the exodus outside the Triad?”
US Patent 2,827,499 (Mar 19 1958) to the Glidden Corporation
US Patent 3,943,181 (Mar 9 1976) to Haarmann and Reimer
National Biotechnnology Audit: September 2003
A National Perspective: Contribution of Research and Innovation to the SA Economy. Department of Science and Technology
UNDP Report: 2001 Technology and Development
S Watts, AMC Chemicals: IFEAT Conference 1999: The International Market for Mint Oils and Menthol
APPENDIX 1
Value Chain Analysis
0
350
pAA equivalent (tons) 190
World Market (tons)
10,500 2,250
5,500
1,350
1,700 540
550
600 5,000
400
100
120 12,000
Anisyl Alcohol
Mixed Cresol
FeedstockOther
m-Cresol Thymol l-Menthol
p-Hydroxy
benzaldehyde (pHB)
p-Anisaldehyde
(pAA)
Flavour and
Fragrances
Ethyl Vanillin
Octyl Methoxy
Cinnamate
(OMC)
Trimethoxy
Benzaldehyde
Vanillin
Diltiazem
Trimethoprim
Raspberry
Ketone
Other
cinnamates
APPENDIX 2
AROMA CHEMICAL SCREENING QUESTIONNARE
Market Arena Attractiveness
(A) Market Attractiveness
+Size of the global product market :
Petrochemical100 Market is > $ 150 million75 Market is in the range $ 100 - 150 million50 Market is in the range $ 50 - 100 million25 Market is in the range $ 10 - 50 million0 Market is < $ 10 million
,Gross margin for the business (GM = Sales-VC-FC) :
100 Gross margin is > 40%. (high)50 Gross margin is in the range 20 – 40%. (medium)0 Gross margin is < 20%. (low)
-Market growth of the product :
100 Growth is High50 Growth is in the range Medium0 Growth is Low
.Number of potential customers for the product :
100 Number of customers is > 8.50 Number of customers is in the range 4 – 8.0 Number of customers is in the range 1 – 4.
/
100 No threat to product75 Product only under threat in the long term > 10 years50 Product under threat in the medium term 5 - 10 years25 Product under threat in the short-term (0 - 5 years)0 Product already under threat
0The pricing trends for the product over the next 5 years :
100 The price is staying constant in real terms.50 The price is declining in real terms by 0 - 2% p.a.0 The price is declining in real terms by > 2% p.a.
The questionnaire is designed to assess two aspects, viz. Market Arena Attractiveness and South Africa’s Internal Business Strengths. The Arena Attractiveness is a global issue and Business Strengths are specific and internal to the South African situation. Assess each product at the point at which South Africa would anticipate entering the market.
Product Screening Questionnaire
For Evaluation of Single Products or Product Clusters as required.
Period from time to market before the product comes under threat (either product
lifecycle or major competitor e.g. Chinese):
Page 1 of 2
APPENDIX 2
AROMA CHEMICAL SCREENING QUESTIONNARE
1
100 3 or more of the above barriers to entry.75 2 of the above barriers to entry.50 1 barrier from the list above.0 None of the above barriers exist.
SA's Internal Strengths
(B) Technological Synergy
2Technology Status:
100 Technology Fully Developed 50 Technology Partially Completed0 No technology developed as yet
3Integration Benefit
100 Benefit from integration into Aromas Cluster0 No benefit from integration
4SA Skills readily available :
100
50 Skills exist, but will need substantial upgrading.0 Personnel and resources expertise is not available.
(C) Marketing Synergies
5
100 Overlapping customer group and existing application area.0 No overlapping customer group
6South African market
100 South africa market exists0 No South African market
(D) Production Advantages
7
100 2 or more of the above sustainable competitive advantages.50 1 of the above sustainable competitive advantages.0 None of the above advantages.
8Production processes :
100 Process better than International Benchmark50 Process equal to International Benchmark0 No competitive advantage or advantage not quantified
The marketing synergy with other customer groups and application areas :
Are there any barriers to entry e.g. high demand for capital, an inaccessible/difficult
technology, a key raw material, and or a regulated market, potential for further
differentiation of product.
Sustainable and specific SA cost of production advantage: e.g. local raw materials
and utilities, an established or potential site, a regional advantage and/or access to
globally competitive technology :
Personnel/resources experience base is common and readily available.
Feedstock Bulk Intermediates Flavour and Fragrance Aroma Chemicals
Personal Care Fine Chemicals
APPENDIX 8
Petrochemical Aroma Chemical Plant Manning Structure
2 1 2 1 1 1
1
4
13 2 1 3 1 1 1 4
4
15 6 1 1 2
Secretary
2
28 4 6 3
Receptionist
3 1
28 4
Forklift Driver
Process
Assistants
Stores
Assistants
Sales/Logistic Co-
ordinator
Invoicing
Manager
Shift Process
TechniciansStoremen
Instrument
TechniciansAdmin.Clerk
Shift AnalystsSenior Process
TechniciansMillwrights
Sales/Logistics
Co-ordinator
Product Manager
PAA PHB
Product Manager
OMC/Menthol
Purchasing
Manager
Accounts
Clerk
Laboratory
technicians/day
shiftProduction
Supervisor
Process
Engineer
Maintenance
SupervisorR&D Scientists
Business Unit ManagersCommercial
Manager
Financial
Manager
HR
Manager
General Manager
1
Production
ManagerQuality Manager
R&D Manager
APPENDIX 9
Direct and Indirect Labour Coefficients (Workers per R million output) 2000
Sector Direct
Coefficient
Total
Coefficient
Multiplier
(Total/Direct)
Agriculture, forestry, and fishing 18.42 23.63 1.28
Mining and Quarrying 7.71 12.26 1.59
Food Processing 2.00 14.22 7.13
Textiles and apparel 12.07 22.26 7.84
Leather Goods and Footwear 7.79 15.58 2.00
Wood and Furniture 8.52 17.11 2.01
Paper and Printing 3.30 10.22 3.10
Petroleum products 0.72 10.40 14.39
Chemicals 1.99 7.20 3.62
Rubber, Glass, plastic 2.49 9.29 3.73
Basic Metals 2.14 7.18 3.36
Electricity and, gas and water 2.87 11.56 2.49
Construction 8.84 6.48 2.26
Machinery and Equipment 4.64 17.40 1.97
Trade 6.85 10.97 1.60
Tourism 12.66 20.03 1.58
Transport and Storage 4.57 9.02 1.97
Financial & business service 4.28 7.71 1.80
Medical and health service 2.71 7.74 2.86
Social and personal services 47.55 51.46 1.08
General gov. and
Other products
17.50 17.67 1.01
Total 7.42
ANNEXURES
i
TERMS OF REFERENCE Aroma Fragrance Fine Chemicals formulations are used globally for imparting attractive taste and aroma to processed foods and beverages and adding pleasing scents to perfumes, toiletries and detergents. The worldwide industry generally earns returns in excess of the chemical industry average. The industry’s close association with the health, personal care and food and beverage markets, means that its revenues are relatively stable, largely insensitive to commodity cycles and relatively recession-resistant.
The industry can be segmented, broadly, into three areas, namely: (i) natural and synthetic aroma and flavour fine chemicals production, (ii) compounding of these chemicals into formulations tailored to meet specific customer requirements, and (iii) use of the formulations in the production of personal care and pharmaceutical active ingredients. Certain large international flavour and fragrance houses exist, which specialize in compounding flavour and fragrance chemicals, and which, for historical and strategic reasons, also produce selected aroma and flavour chemicals for captive use. In addition, some also manufacture personal care active ingredients from captive and purchased aroma chemicals. Success in the formulation and compounding business is dependent on an ability to offer a basket of products, the creativity of flavourists and perfumers, branding and marketing skills, and an ability to respond quickly to ever-changing trends in consumer preference. Commencing in the late 1980’s, AECI Limited had identified certain aroma and flavour fine chemicals, which it believed could form part of a new fine chemicals business that the company wanted to develop. AECI carried out an intensive research and development programme, over a period of more than ten years, aimed a developing competitive manufacturing technologies for selected aroma and flavour fine chemicals. During 1998, AECI decided to scale down its wide-ranging in-house research and development programme, and outsourced further work on aroma and flavour fine chemical technology development to the CSIR. Together with the CSIR, AECI developed an AFFC portfolio with the original intention of becoming a leading global producer of selected products, supplying a basket of strategic aroma chemicals to specific flavour and fragrance houses for formulation and compounding. The AECI portfolio was constructed around the synthesis of petrochemical feedstocks. During 2001, in line with a wide-ranging business transformation process, AECI took a strategic decision to exit from its fine chemicals development programme, and to offer the know-how and technology, which had been developed, to interested parties. AECI reached agreement with the CSIR during 2003, that AECI would transfer the rights to the
ANNEXURES
ii
range of aroma and flavour fine chemical technologies to the CSIR, in exchange for sharing of the benefits which may arise from licensing or sale of any of the technologies. The CSIR now owns the technologies in respect of the proposed portfolio of AFFC and the Fund for Research into Industrial Development, Growth and Equity (FRIDGE) proposed a study with the following broad objectives:
• To review the AECI proposed Aroma Fragrance Fine Chemicals portfolio for
potential commercial development; • To include a study on the potential use of effluent from the paper and pulp
industry as a raw material for Aroma Fragrance Fine Chemicals products;
• To include a study on the potential synergy between developing synthetic Aroma Fragrance Fine Chemicals production facilities and developing South African natural sources of Aroma Fragrance Fine Chemicals.
The products proposed for commercialization by AECI were selected on the basis that they were large volume aroma and flavour chemicals, serve actively growing end-use markets, had low risk of substitution, and did not require lengthy and costly registration processes for product approval.
The technology developed by AECI, and now owned by CSIR, was aimed at producing the following portfolio:
p-Hydroxybenzaldehyde (pHB) precursor for PAA, RK, vanillin, ethyl vanillin and 3,4,5-TMB. precursor for pharmaceutical active ingredients
p-Anisaldehyde (pAA) flavour and fragrance ingredient precursor for p-anisyl alcohol. precursor for sunscreen active ingredients precursor for pharmaceutical active ingredients
Raspberry ketone flavour and fragrance ingredient p-Anisyl alcohol flavour and fragrance ingredient.
precursor for pharmaceutical active ingredients l-Menthyl acetate flavour and fragrance ingredient Vanillin flavour and fragrance ingredient.
precursor for pharmaceutical active ingredients Ethyl vanillin flavour and fragrance ingredient 3,4,5-Trimethoxybenzaldehyde precursor for pharmaceutical active ingredients m-Cresol feedstock for l-menthol, produced as a co-
product of PHB production Zingerone flavour and fragrance ingredient
ANNEXURES
iii
The above listed products are strongly inter-related in terms of market areas and customers. This synergy offers an investor the opportunity to access markets and customers, which may find a basket of related products from one supplier attractive.
The stated objectives of the study are:
• The study should clearly indicate the following:
- Labour requirements and number of jobs expected to be created - The attractiveness of local manufacture of synthetic aroma, fragrance and
flavour chemicals with specific emphasis on the products already identified. - The potential and attractiveness of producing specific aroma, fragrance and
flavour compounds from indigenous plant material.
• The study should also explore the potential to use effluent from the paper and pulp industry as a raw material for this product stream. In this regard the logistical and location considerations of a manufacturing facility, or facilities, need to be addressed.
• The study should investigate the following aspects of the project:
- The feasibility of the manufacturing potential products from indigenous
plant material and potential markets. - The feasibility of supplying potential regional and international markets with
synthetic aroma, fragrance and flavour chemicals.
- Identify potential technology constraints and costs, and research needs and costs.
- Recommend government interventions that may be required to ensure
success of investment projects.
• The study should also analysis present and future economic developments and their implications on the viability of the commercialization of these technologies in an internationally competitive manner. This will include reviewing the capacity, preferred location of a potential business, or businesses, as well as the relevant value chains, and the investment implications of such economic developments to local or international investors.
• The study should recommend the design of an appropriate suite of investment
incentives, within the context of the incentives offered by the Government, to improve the attractiveness of an investment in the proposed product portfolio.
ANNEXURES
iv
MILESTONE DECISIONS DURING THE STUDY As the project progressed the following issues arose that required direction to be given by the Study’s Counterpart Group: • The original scope of the Study (per the Request for Tenders) did not include the
study of the potential of the menthol technology package. Presumably this was because AECI had already disposed of the technology prior to referring these matters to FRIDGE. The technology currently resides with Mbuyu Biotech, a joint venture involving CSIR. There is a strong relationship between the product and technologies referenced for the Study and the menthol technology package. It was proposed that the Consultant take the menthol potential into account. This was agreed. (Milestone One)
• The original scope of the Study (per the Request for Tenders) as it related to Aroma
Chemicals from the by-products of the paper and pulp industry, appeared to have been confined to the production of the chemicals listed (i.e. vanillin and perhaps ethyl-vanillin). This would be produced from Kraft Black Liquor (KBL). The Consultant proposed that Crude Sulphonate Turpentine (CST) derived from the paper and pulp industry should also be considered as a source for the production of Aroma Chemicals. This was agreed. (Milestone One)
• The original scope of the Study (per the Request for Tenders) did not include the
study of the essential oils industry per se (except perhaps in so far as it related to indigenous flora). However, it was identified that essential oils would be the most likely route for the commercial exploitation of indigenous flora and accordingly the Consultant proposed that this important sector be the focus of the investigation into the potential of natural sources of Aroma Chemicals. This approach was agreed. (Milestone One)
• With regards to the Aroma Chemicals derived from petrochemical feed stocks, the
Consultant was requested not to focus on specific sources of meta-para-cresol, neither to focus on specific industry partners (investors) but to keep the analysis generic. (Milestone Two).
• With regards to essential oils the Consultant was instructed not to focus too much
attention on the agricultural issues surrounding essential oil production. This would be the focus of another study. The Consultant noted that it would not be practical to perform an economic feasibility on a particular essential oil or basket of essential oils as a large component of the feasibility would require consideration of the agricultural costs of production. It was agreed that the Consultant should focus on the broader strategic issues surrounding the development of the essential oils industry and its potential impact on an Aroma Chemicals value chain. (Milestone Three)
ANNEXURES
v
• With regards to Aroma Chemicals derived from the paper and pulp industry, the Consultant identified that the tapping of pine forest for gum turpentine could also be a source of material for the production of turpentine derived Aroma Chemicals. It was agreed that this was outside the scope of the current project, but that the Consultant should provide whatever information was readily available to it. (Milestone Four).
STAKEHOLDER LIST
IDC co-ordinator Hloni Monyeki 011-269-3597
CPG Chairperson Mary Tsatsi 012 428-7959 / Cell 0824640530
Item Organisation Contact name Contact Details CommentsPetrochemical
1 CSIR: Biochemtek Fanie Marais 0116052310 Several meetings2 Consultant Aubrey Parsons 011 726-2376 Cell 083 300 4318Initial meeting3 AECI Andre Engelbrecht 011 806 88854 Merisol Joe Makhoere/Ahmed Karachi 016 960 3733 Initial meeting6 Chemin Incubator Joe Kruger 041- 503 6700 Initial meeting7 SASOL Herman Berry
OP QR ST T UV V SW SX
Initial Meeting and research assistance8 Mbuyu Biotech Paul Abrahams 011 605 2943 Held meeting to discuss menthol project
Paper and Pulp9 CSIR: Biochemtek Fanie Marais 0116052310 Meetings: documentation and project discussions
10 CSIR: Biochemtek Michael Barkhysen 0116052310 Initial meeting: vanillin11 CSIR: Biochemtek Shavindra Sukdeo 011 605 2174 Initial meeting: vanillin12 Clive Teubes Clive Teubes 011 792-4451 Initial meeting; emails13 Mondi Ciska Terblanche 035 902 2111 Contact made 14 Mondi Tony Scheckle 031 304 7837 Meeting held15 Sappi Lignotech Craig Hogan ex AECI Project 039 9736 008 Contact made16 Paul Statham Ex AECI Vanillin Project 011 709 8985 Contact made17 Sappi Kobus Geldehuys 013 734 611 Contact made, amount of CST from Ngodwana18 Sappi Chris Davies 011 360 0271 Contact made, Technology Director Sappi19 Associated Motor Carriers Mike Hunter: Forest Operations 035 580 7950/082 657 5558 Telephonic discussions20 Associated Motor Carriers Arlenee 035 787 7017 Telephonic discussions21 Industrial Oleochemical Products Gillian Lee 031 461 3740 Telephonic discussions
Indigenous Flora and Essential Oils22 CSIR: Biochemtek Fanie Marais 0116052310 Several meetings23 CSIR: Biochemtek Marthinus Horak 0128413295 Currently off ill (Met with Vinesh Maharaj)24 CSIR: Biochemtek Shavindra Sukdeo 011 605 2174 Initial meeting25 SAEOPA Karen Swanepoel 0827858700 Tel 013 753 3064 Several telephone discussions and meeting in April26 SAEOPA Willie Alberts 829636142 Meeting in April27 Biosys Robin Learmonth 012 841-4025 Several meetings28 ARC Kobus Coetsee 021 8085430 Telephone interview (Now Ex-ARC)29 Flavourcraft Ryan Ponquett 031 719 0618 30 Symrise Johan Esterhuizen (Sales)/ Rudi Maclean (MD)011 921 5911 Telephone : Re Local Market31 Sharon Bolel Sharon Bolel 011 487 1661 Telephone interview32 SAAFFI Michael Gristwood Tel/Fax: +27 11 447 2757 Initial meeting33 DEAT Outside of scope34 Teubes (Pty) Ltd Clive Teubes 011 792-4451 Several discussions
Page 1 of 3
STAKEHOLDER LIST
IDC co-ordinator Hloni Monyeki 011-269-3597
CPG Chairperson Mary Tsatsi 012 428-7959 / Cell 0824640530
Item Organisation Contact name Contact Details Comments35 Cranbrook Flavours Hennie Jooste 011 392-6650 Telephonic interview36 Giyani Project - Limpopo Province Vinesh Maharaj 012 841-3295 Initial Meeting/subsequent meetings37 Chemin Godisa Incubator Joe Kruger 041- 503 6700 Initial Meeting and several telephone calls38 SAAFost Aubrey Parsons 011 726-2376 Initial meeting39 Firminech Bruce Perkins 011 653 0700 Telephone call: Re Local Market40 IFF Robert Fletcher 011-922-8800 Telephone call: Re Local Market41 Proctor and Gamble Denzel Pillay 011-700-5000 Telephone call: Re Local Market42 Lever Ponds Robert Waugh 031-571-9600 Telephone call: Re Local Market43 Quest International SA Raj Rama 011 613-6211 Meeting re local market44 Quest International SA Tony Scott 011 406 8700 Telephone call: Re Local Market45 Wesgro Sector Research Section 021 418 6464 Information received46 Grassroots Natural Products Norman Collins 023 232 0526 Telephonic interview47 Cape Organics Producers Association Eddie Redelinghuys 021 872 596248 George Oils Pancho Ndabele 011 881 8299 Out of business49 Ecocert Ralph Peckover 021 545 0409 Telephonic interview50 Producer Kleinste Van Rensburg Visit51 Ekuseni Essential oils- Production Hennie Duplessis 031-712 2656 Visit52 Ntala - Producer Hanneke Hibbert 013 753 3839 Visit53 Ekuseni Essential oils- Marketing Jean duplessis 082 461 7385 Telephonic interview54 Producer Ian Macdonald 832284535 Telephonic interview55 Producer Jarrett Peck 332129045 Telephonic interview56 Producer Prof Earle Graven 836330149 Telephonic interview57 Producer Chris Rumble 832287695 Telephonic interview58 Bio Africa Steph 082 534 4807 Telephonic interview59 Institute of Natural Resources Myles Mander 033 346 0796 Telephonic interview60 TRAFFIC (ES Africa) David Newton 011 486 1102 Telephonic interview61 Claman Ronelle Roberts 011 591 2640 Telephonic interview62 Cape Fynbos Essential oils Salome van Eerden 028 314 1614 Telephonic interview63 Natchem Aromatech Jean Serra 011 452 1760 Telephonic interview64 University of Potchefstroom Prof Breedt 018 482 1241 Telephonic interview65 University of Witwatersrand Pro Alvaro Viljoen 011 717 2169 Telephonic interview/ Meeting66 Afriplex 021 872 4976 Telephonic interview67 Cedara (KZN) Dr Maria Defiguera 033 355 9156 Telephonic interview68 Carst&Walker Uru Maganol 011 359-4800 Telephonic interview69 Highland Esential Oils Flippie Pienaar 051 943 0317 Telephonic interview70 Herbs A Plenty Elmarie de Bryn 021 874 1684 Telephonic interview71 National Dept of Agric Thabo Ramashala 012 3196079/2 / 072357 3845 Initial Meeting72 DWAF (Irrigation - Walter vd Westhuizen)Gauteng 012 392 1300 Telephone contact
Page 2 of 3
STAKEHOLDER LIST
IDC co-ordinator Hloni Monyeki 011-269-3597
CPG Chairperson Mary Tsatsi 012 428-7959 / Cell 0824640530