18
ARRA Big City Network November 2011 GATB Survey Summary of Findings 1
ARRA Big City Network
November 2011
GATB Survey Summary of Findings
1

ARRA Big City Network
2

GATB Survey
73 Respondents
140 Prime Awards = $1.5 Billion
79 Subrecipient Awards = $5.5 Billion
3

Reporting Experience
4
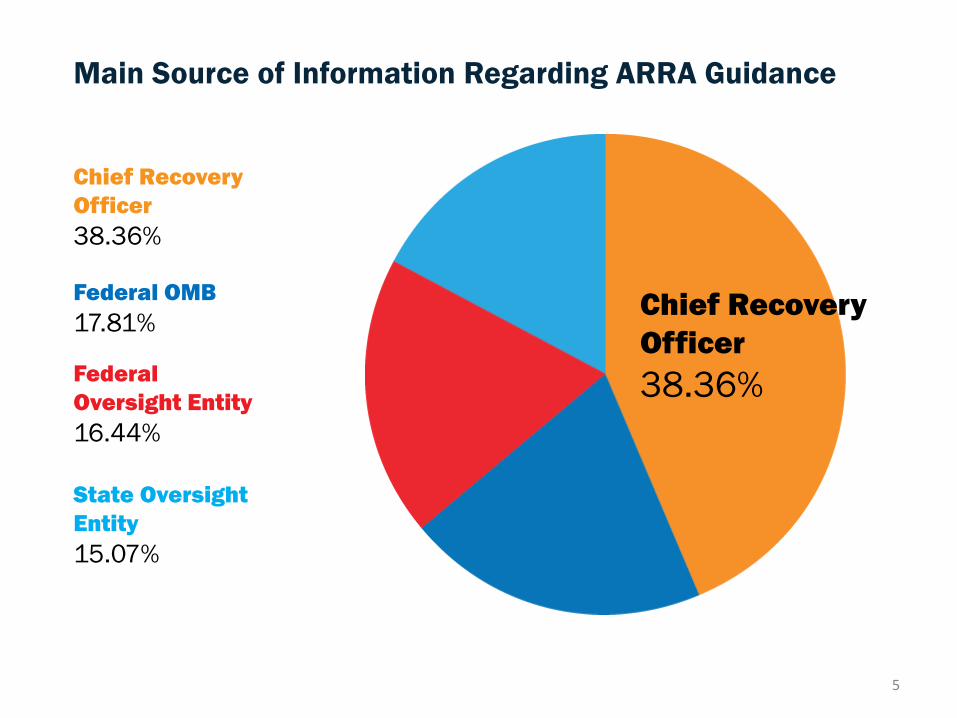
Main Source of Information Regarding ARRA Guidance
Chief Recovery
Officer
38.36%
Federal OMB
17.81%
Federal
Oversight Entity
16.44%
State Oversight
Entity
15.07%
Chief Recovery
Officer
38.36%
5
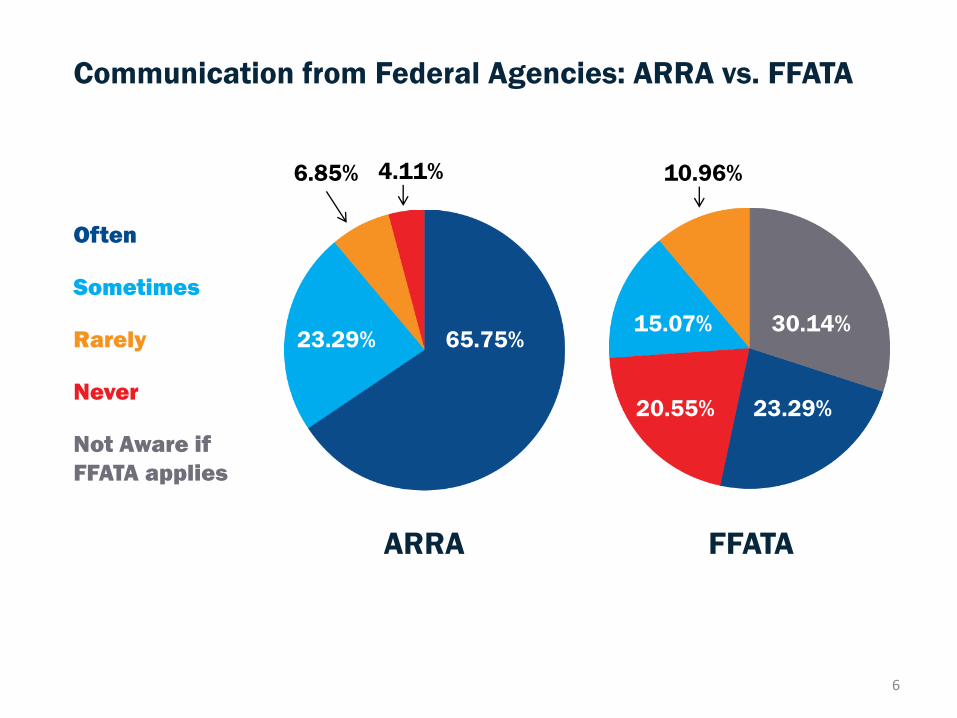
Communication from Federal Agencies: ARRA vs. FFATA
ARRA FFATA
65.75%
Not Aware if
FFATA applies
Often
Never
Sometimes
Rarely
23.29%
6
23.29%
20.55%
30.14% 15.07%
6.85% 4.11% 10.96%

How Often Agencies Must Submit Reports: ARRA vs. FFATA
Never
24.66%
Monthly
20.55% Quarterly
No Requirement
Monthly
Bi-Weekly
More than
Bi-Weekly
Less than
Quarterly
Never
68.49% 42.47%
7
ARRA FFATA
20.55%
24.66%
13.70%
4.11%
10.96%
1.37% 2.74%

How Effective and Efficient is FederalReporting.gov
More Effective
35.62%
My City is Only a
Sub-recipient
29.17%
About the Same
23.29%
I Do Not Use Other
Reporting Portals
9.59%
Less Efficient and
Effective
2.74%
8
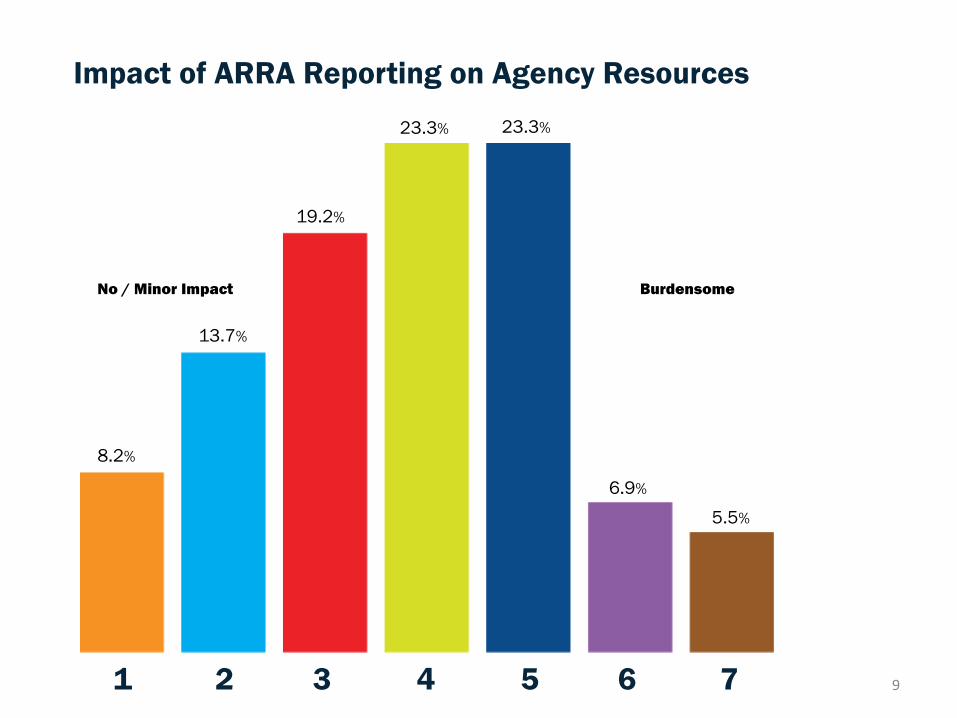
Impact of ARRA Reporting on Agency Resources
1 2 3 4 5 6 7
8.2%
13.7%
19.2%
23.3% 23.3%
6.9%
5.5%
No / Minor Impact Burdensome
9
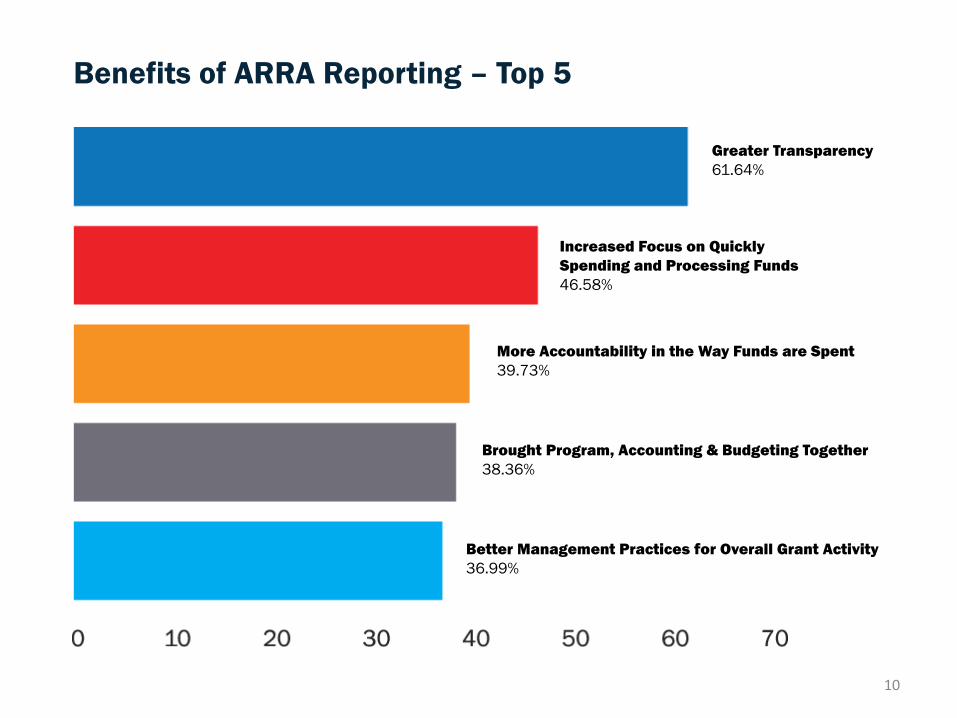
Benefits of ARRA Reporting – Top 5
Greater Transparency
61.64%
Increased Focus on Quickly
Spending and Processing Funds
46.58%
More Accountability in the Way Funds are Spent
39.73%
Brought Program, Accounting & Budgeting Together
38.36%
Better Management Practices for Overall Grant Activity
36.99%
10

Challenges of ARRA Reporting – Top 5
Timelines to
Gather Data
63.01%
Vague or Conflicting Guidance
50.68%
Duplicative Paperwork Required
49.32%
Getting Authoritative Clarification in Writing
35.62%
Insufficient Staff or Resources to Manage Reporting
30.14%
11

Looking to The Future
12

How Often Should Federal Reporting Occur
Quarterly Yearly Daily Monthly
75.34%
17.81%
4.11% 2.74%
55 out of 73 responders
indicated that federal
reporting should occur
Quarterly
13
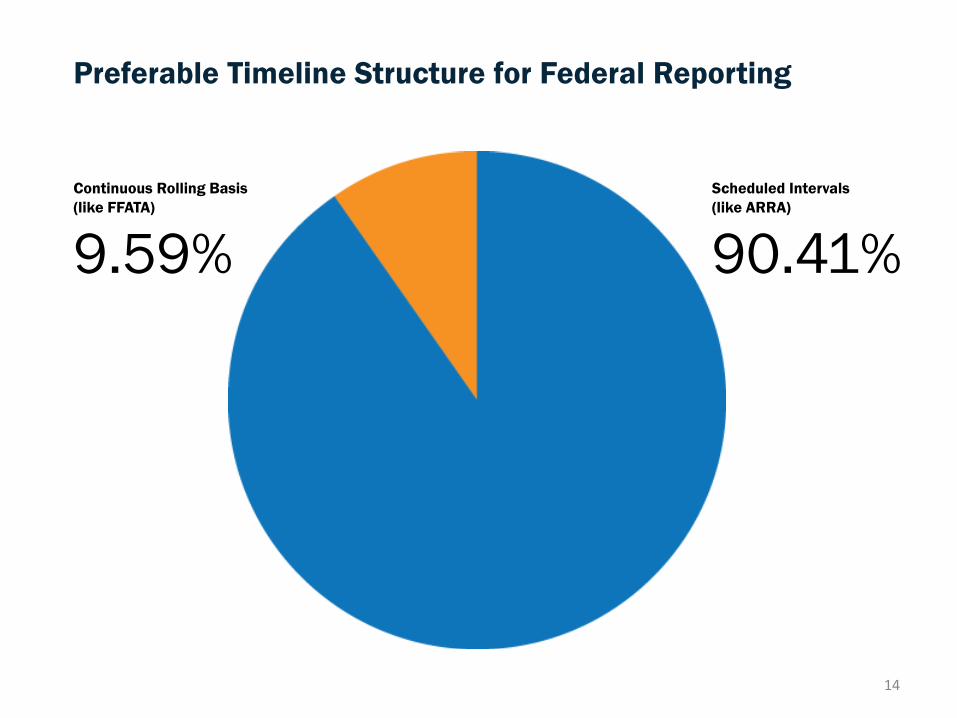
Preferable Timeline Structure for Federal Reporting
14
Scheduled Intervals
(like ARRA)
90.41%
Continuous Rolling Basis
(like FFATA)
9.59%
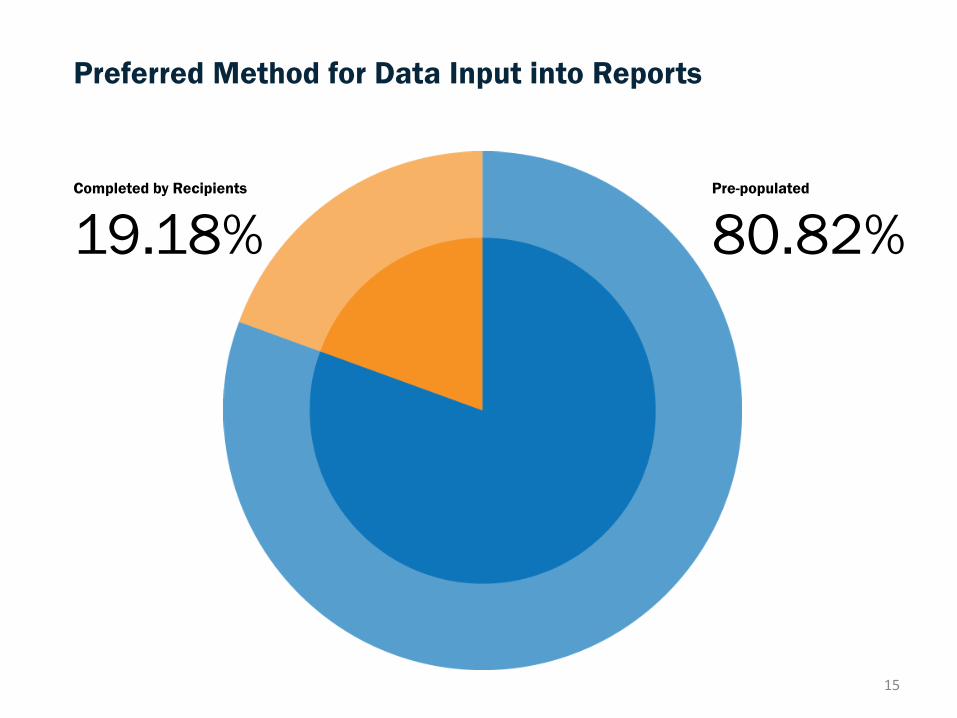
Preferred Method for Data Input into Reports
Pre-populated
80.82% Completed by Recipients
19.18%
15

Key Data Elements to Include in Federal Reporting
Basic Identifying
Information
93.14%
Award Amounts
89.04%
Expenditures
79.45%
Prime Recipient Information
76.71%
Programmatic Descriptions
63.01%
Progress Updates / Narratives
54.79%
Sub Recipient Information
53.42%
16

How to Improve Federal Reporting - Communication
Reliable Help Desk
60.27%
Routine Communication
56.16%
Require Written Clarification on Guidance
45.21%
Local Representation on Federal Oversight Boards
34.25%
Reduce Unnecessary Reminders that Cause Alarm
31.51%
Identify Federal POCs
21.92%
17
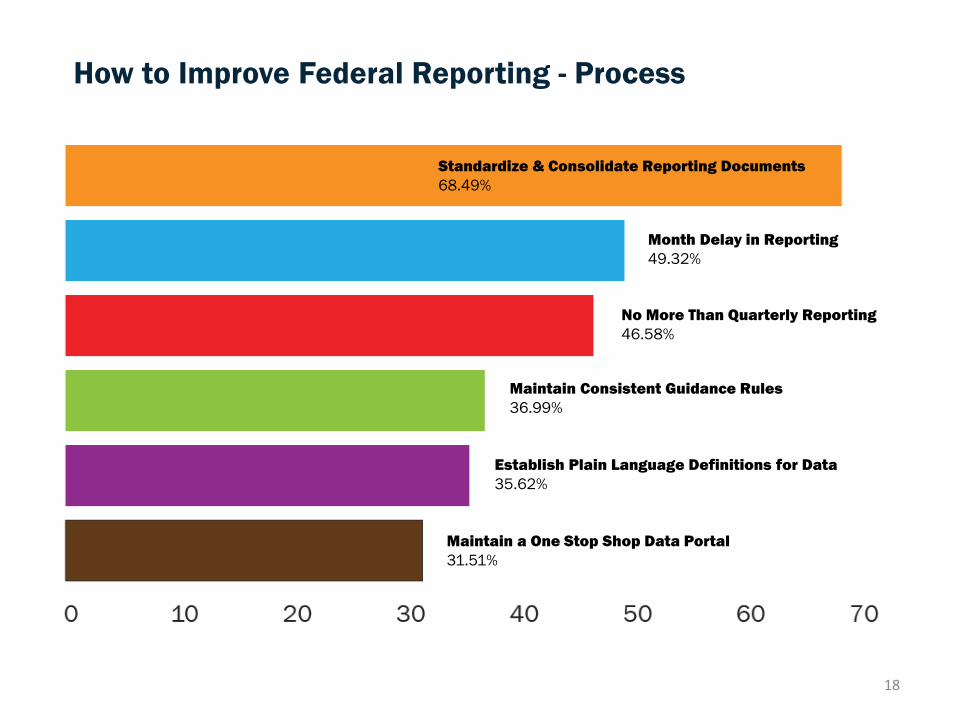
How to Improve Federal Reporting - Process
Standardize & Consolidate Reporting Documents
68.49%
Month Delay in Reporting
49.32%
No More Than Quarterly Reporting
46.58%
Maintain Consistent Guidance Rules
36.99%
Establish Plain Language Definitions for Data
35.62%
Maintain a One Stop Shop Data Portal
31.51%
18


