35
Array Signal Processing Trends in Treaty Verification Seismology D. B. Harris LLNL-PRES-637040

Array Signal Processing Trends in Treaty Verification Seismology
D. B. Harris
LLNL-PRES-637040
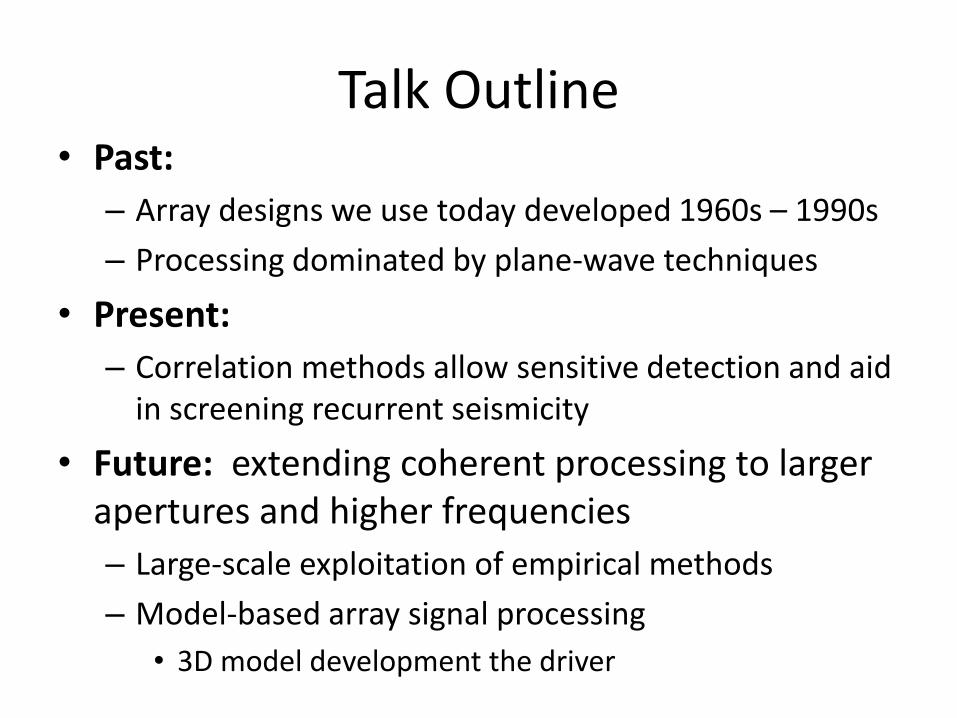
Talk Outline • Past:
– Array designs we use today developed 1960s – 1990s
– Processing dominated by plane-wave techniques
• Present:
– Correlation methods allow sensitive detection and aid in screening recurrent seismicity
• Future: extending coherent processing to larger apertures and higher frequencies
– Large-scale exploitation of empirical methods
– Model-based array signal processing
• 3D model development the driver

“The defining characteristic of signal processing in seismic verification is the lack of an accurate model for predicting observables.”
JRC
JRC detail
NVAR
Time (seconds)
Time (seconds)
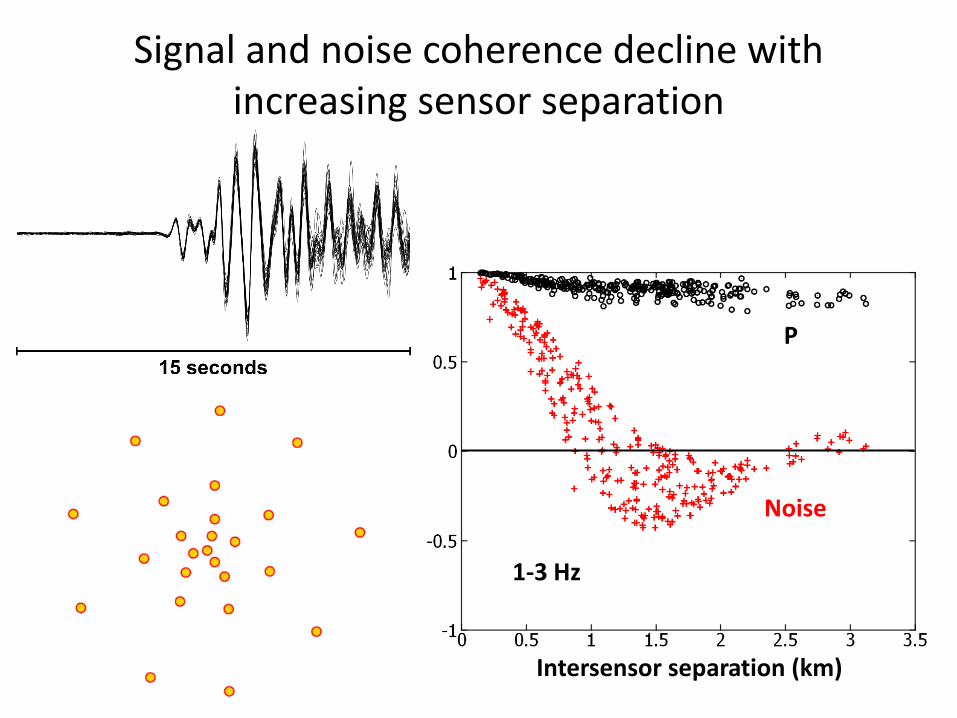
Signal and noise coherence decline with increasing sensor separation
Intersensor separation (km)
P
Noise
1-3 Hz

Past
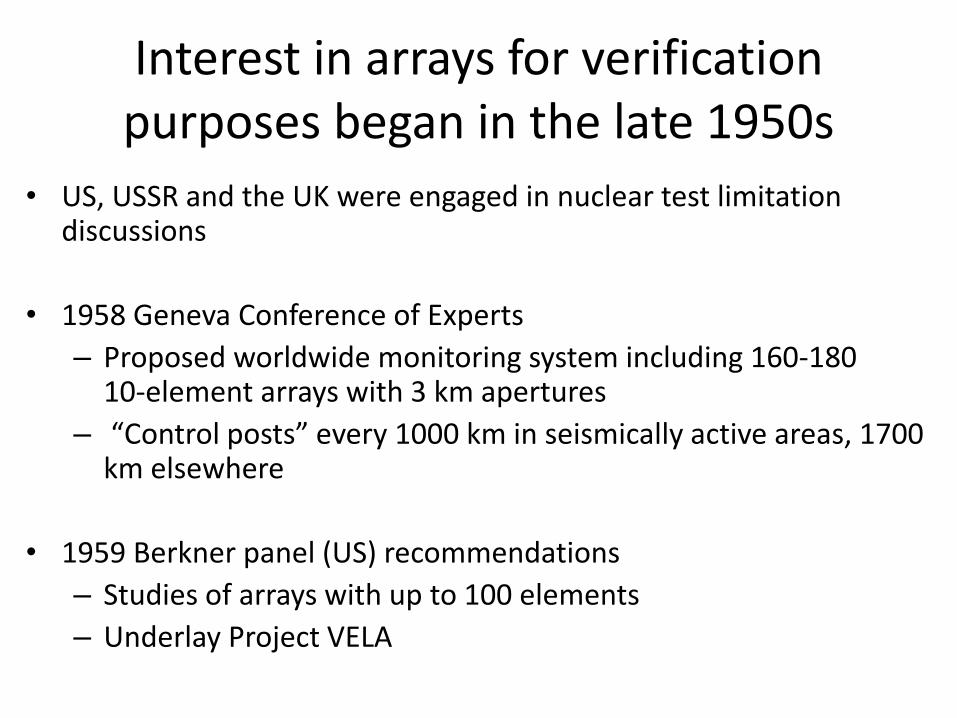
Interest in arrays for verification purposes began in the late 1950s
• US, USSR and the UK were engaged in nuclear test limitation discussions
• 1958 Geneva Conference of Experts
– Proposed worldwide monitoring system including 160-180 10-element arrays with 3 km apertures
– “Control posts” every 1000 km in seismically active areas, 1700 km elsewhere
• 1959 Berkner panel (US) recommendations
– Studies of arrays with up to 100 elements
– Underlay Project VELA
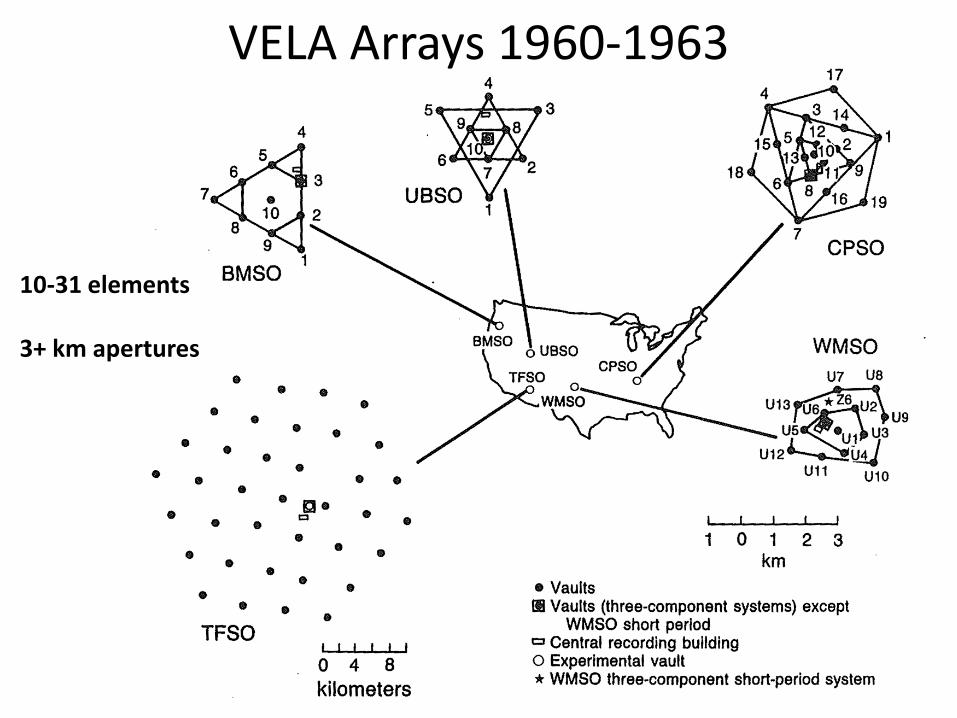
VELA Arrays 1960-1963
10-31 elements 3+ km apertures
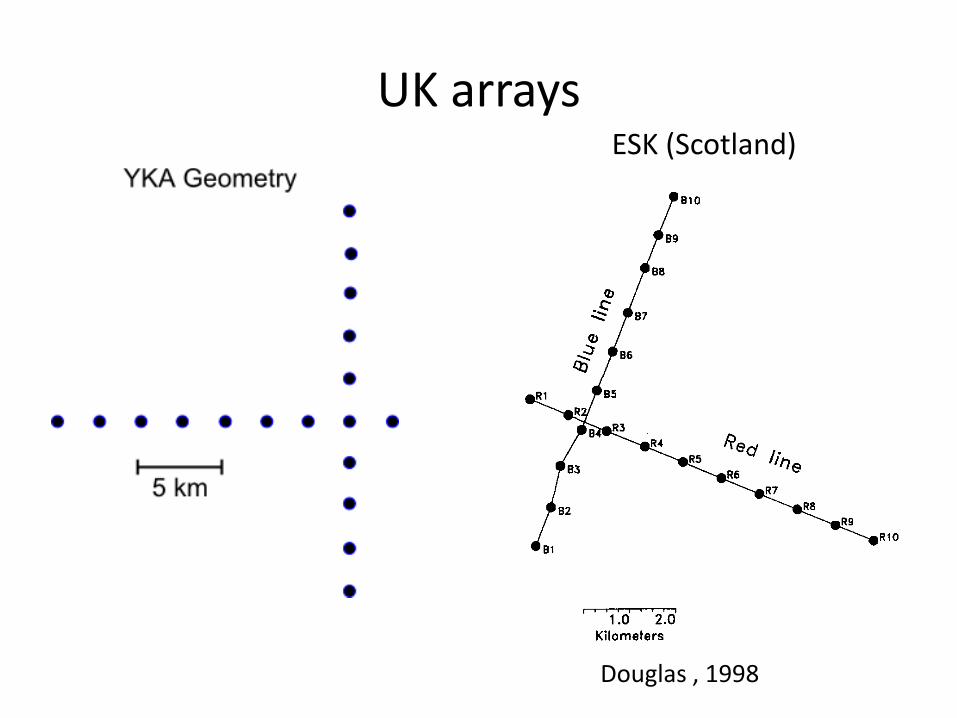
UK arrays ESK (Scotland)
Douglas , 1998
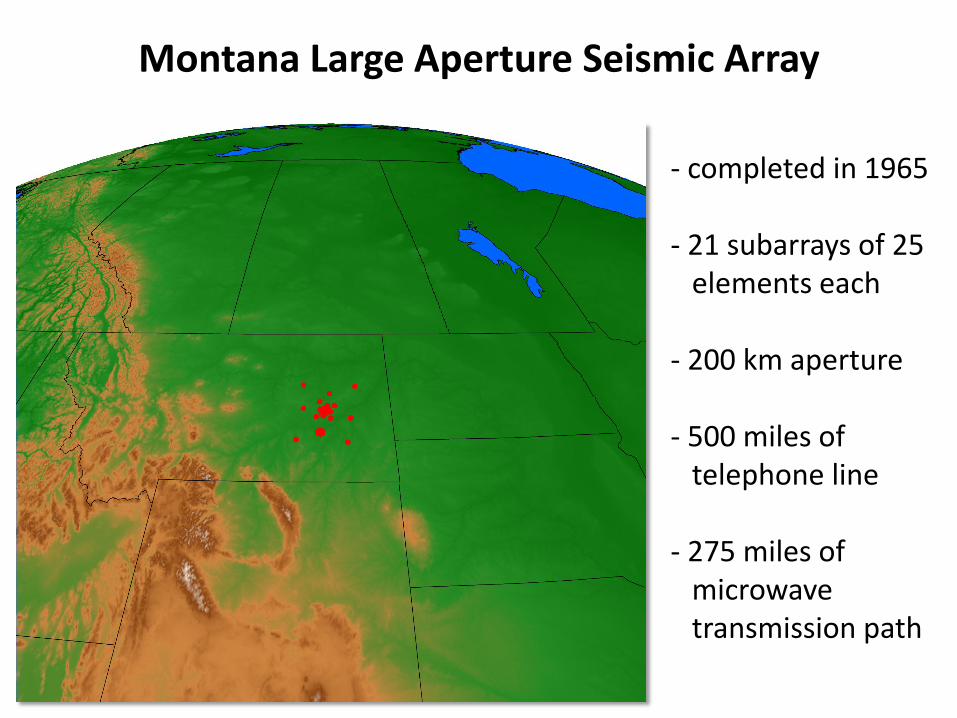
Montana Large Aperture Seismic Array
- completed in 1965 - 21 subarrays of 25 elements each - 200 km aperture - 500 miles of telephone line - 275 miles of microwave transmission path
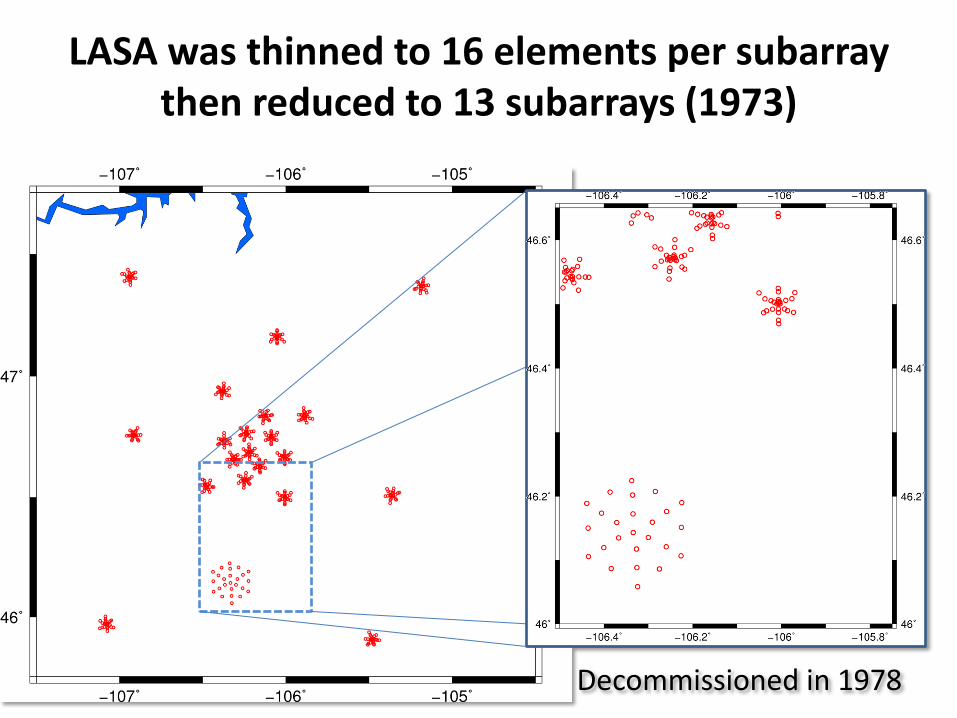
LASA was thinned to 16 elements per subarray then reduced to 13 subarrays (1973)
Decommissioned in 1978
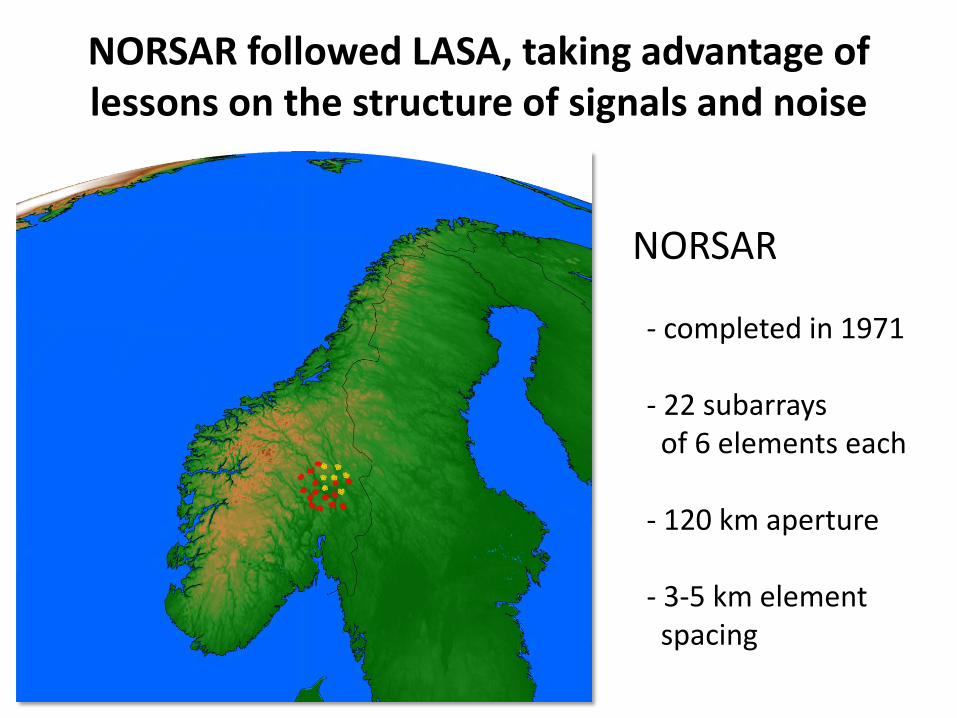
NORSAR followed LASA, taking advantage of lessons on the structure of signals and noise
NORSAR - completed in 1971 - 22 subarrays of 6 elements each - 120 km aperture - 3-5 km element spacing
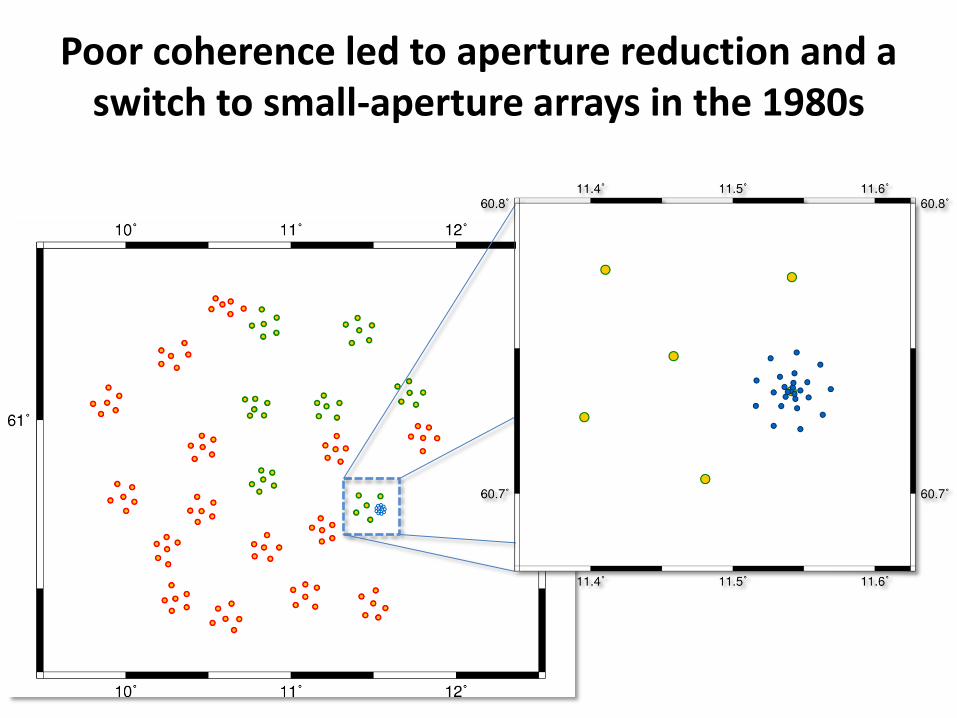
Poor coherence led to aperture reduction and a switch to small-aperture arrays in the 1980s

Present:
“Stamp Collecting” - Bill Ellsworth

The current processing paradigm interprets events from streams of waveform measurements
Future enhancements

Empirical array correlators allow sensitive detection of repeating sources without an explicit propagation model
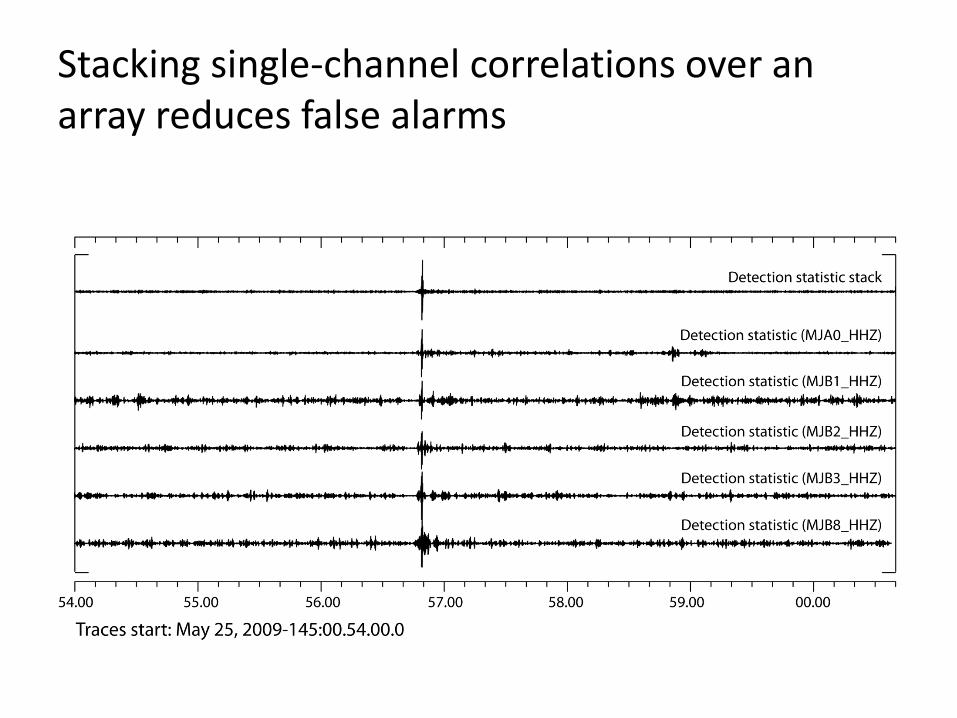
Stacking single-channel correlations over an array reduces false alarms

A large fraction of seismicity is recurrent and can be detected and screened efficiently with correlators

Correlated events may be screened efficiently in groups
There may be many groups in an aftershock sequence associated with a great earthquake
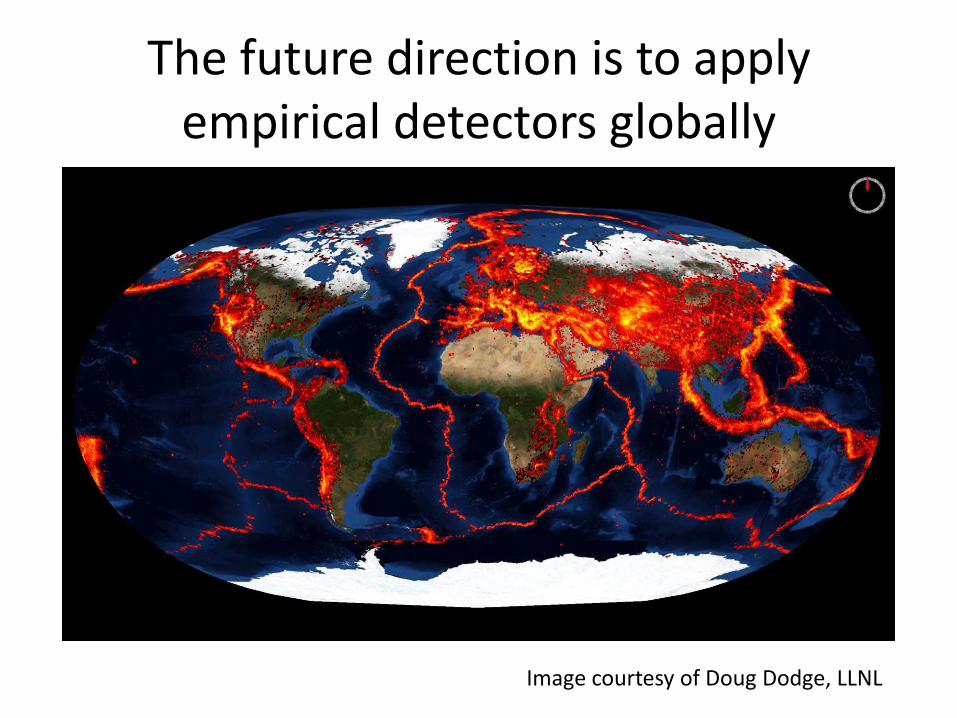
The future direction is to apply empirical detectors globally
Image courtesy of Doug Dodge, LLNL

Future: Prospects for Model-Based Signal Processing
• Large-scale deployments and data archival • Large-scale computing • Sophisticated earth modeling methods

Big Data
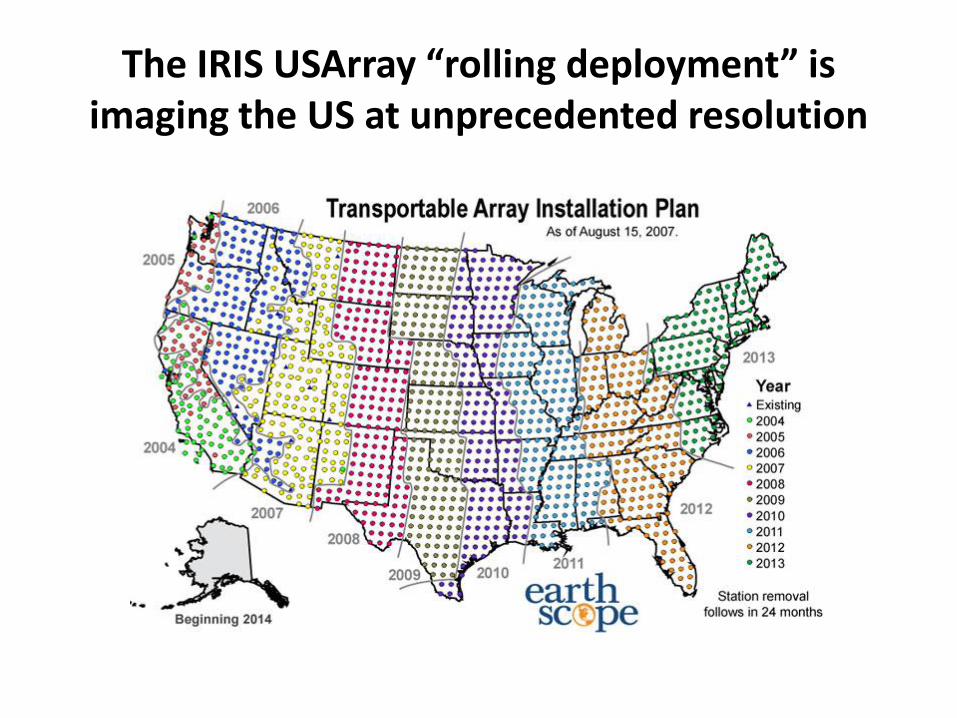
The IRIS USArray “rolling deployment” is imaging the US at unprecedented resolution
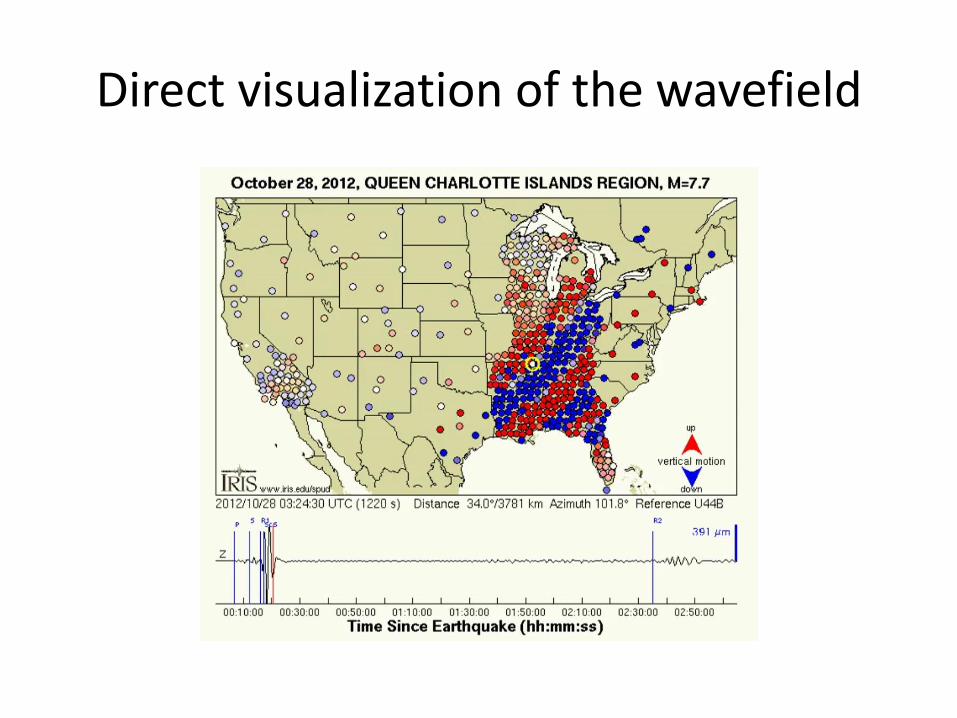
Direct visualization of the wavefield

Large Scale Computing
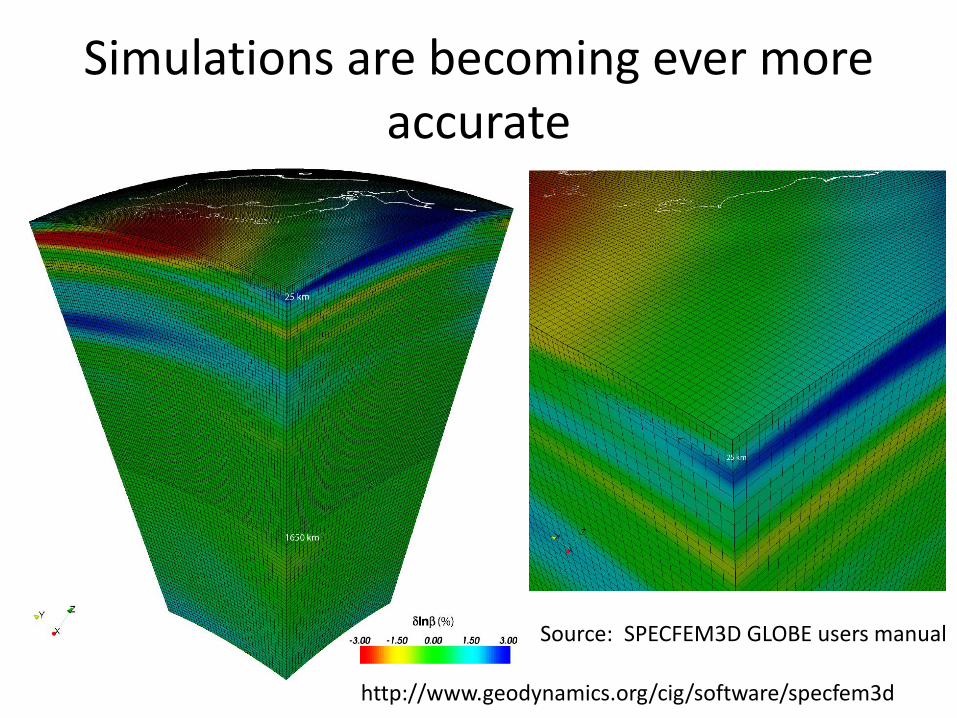
Simulations are becoming ever more accurate
Source: SPECFEM3D GLOBE users manual
http://www.geodynamics.org/cig/software/specfem3d
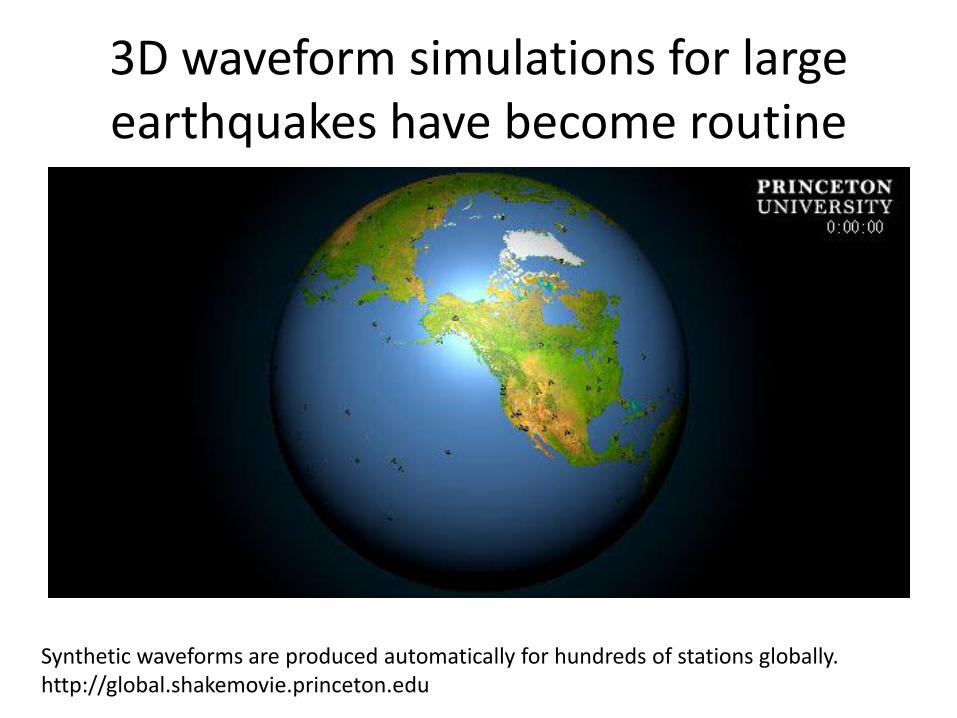
3D waveform simulations for large earthquakes have become routine
Synthetic waveforms are produced automatically for hundreds of stations globally. http://global.shakemovie.princeton.edu

Sophisticated Tomographic Techniques
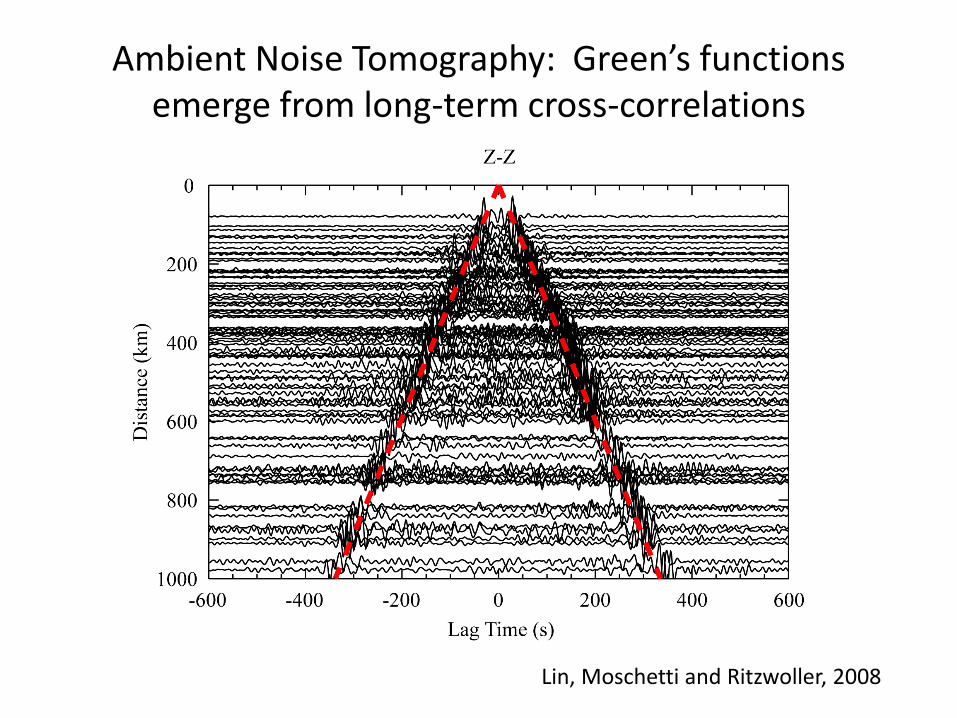
Ambient Noise Tomography: Green’s functions emerge from long-term cross-correlations
Lin, Moschetti and Ritzwoller, 2008
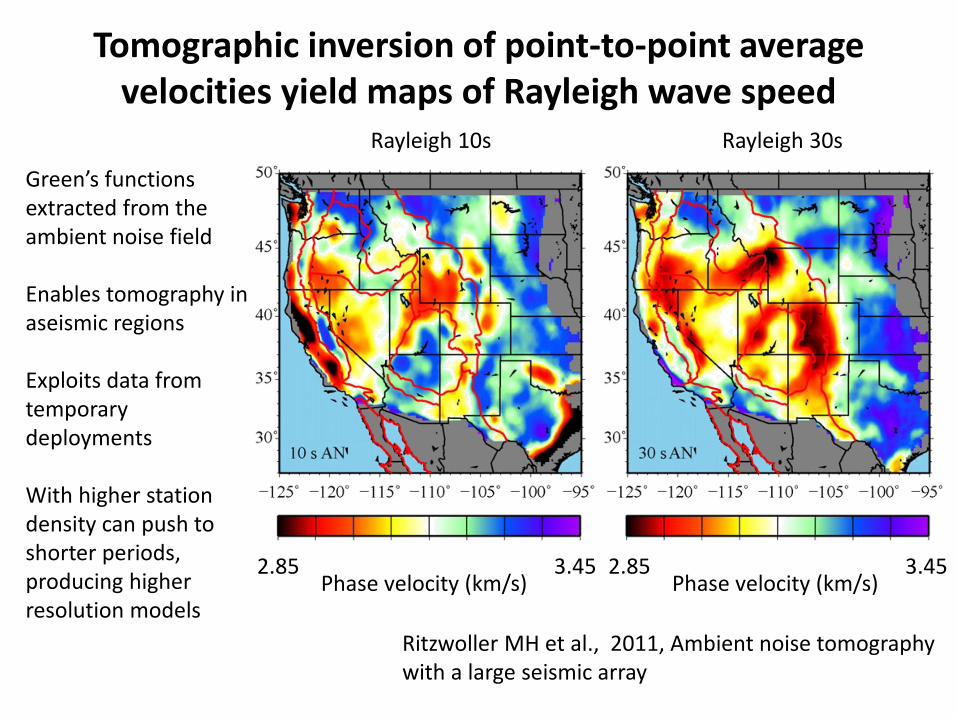
Green’s functions extracted from the ambient noise field Enables tomography in aseismic regions Exploits data from temporary deployments With higher station density can push to shorter periods, producing higher resolution models
2.85 3.45 Phase velocity (km/s)
Rayleigh 10s Rayleigh 30s
2.85 3.45 Phase velocity (km/s)
Ritzwoller MH et al., 2011, Ambient noise tomography with a large seismic array
Tomographic inversion of point-to-point average velocities yield maps of Rayleigh wave speed
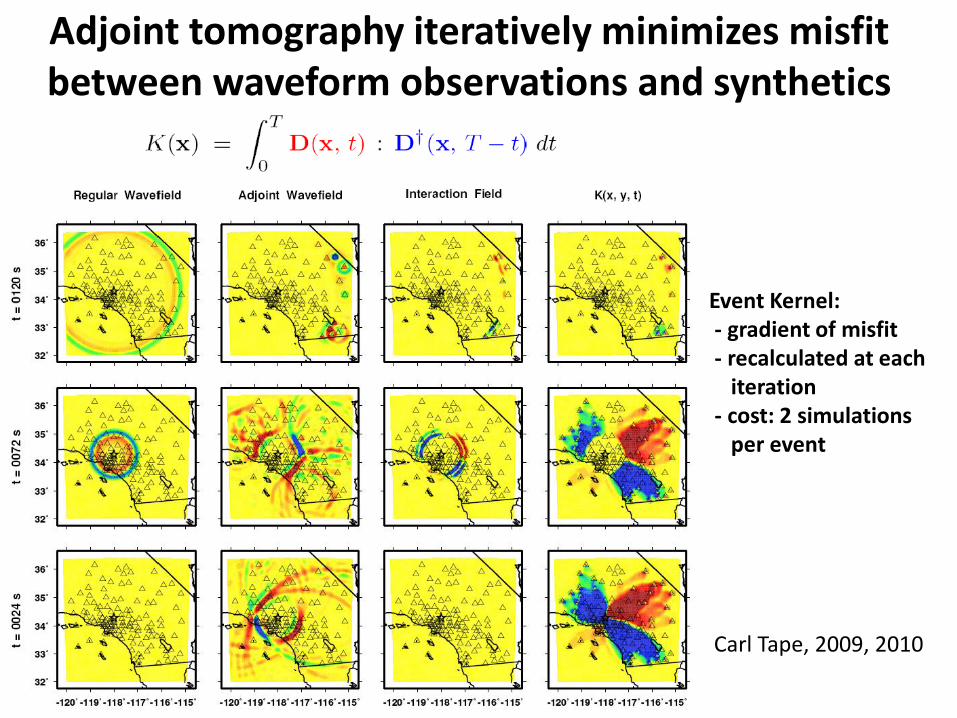
Event Kernel: - gradient of misfit - recalculated at each iteration - cost: 2 simulations per event
Carl Tape, 2009, 2010
Adjoint tomography iteratively minimizes misfit between waveform observations and synthetics
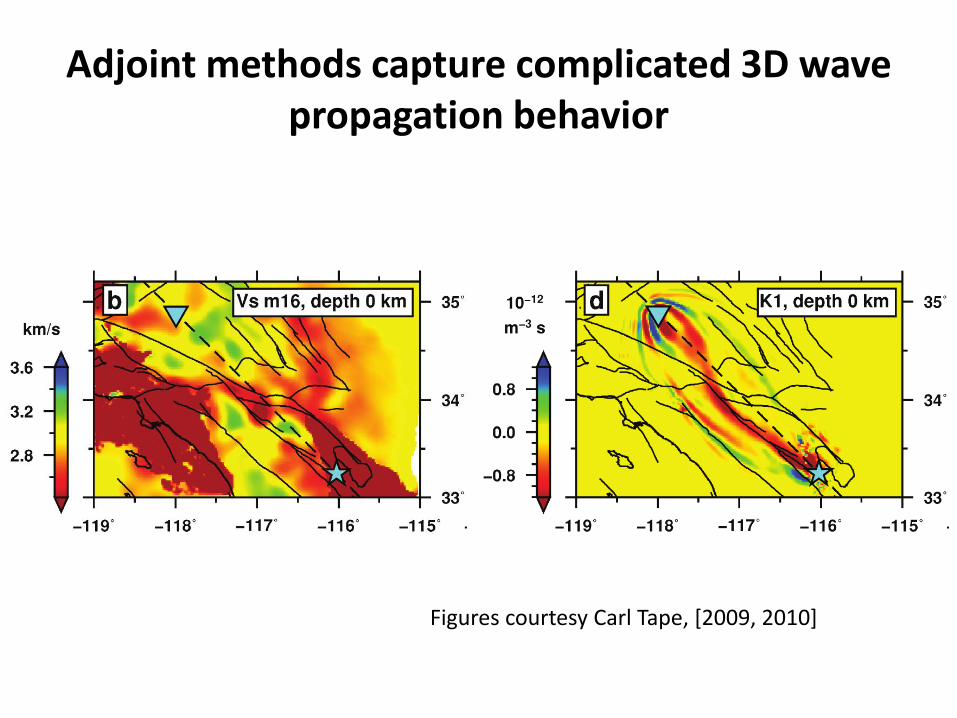
Adjoint methods capture complicated 3D wave propagation behavior
Figures courtesy Carl Tape, [2009, 2010]
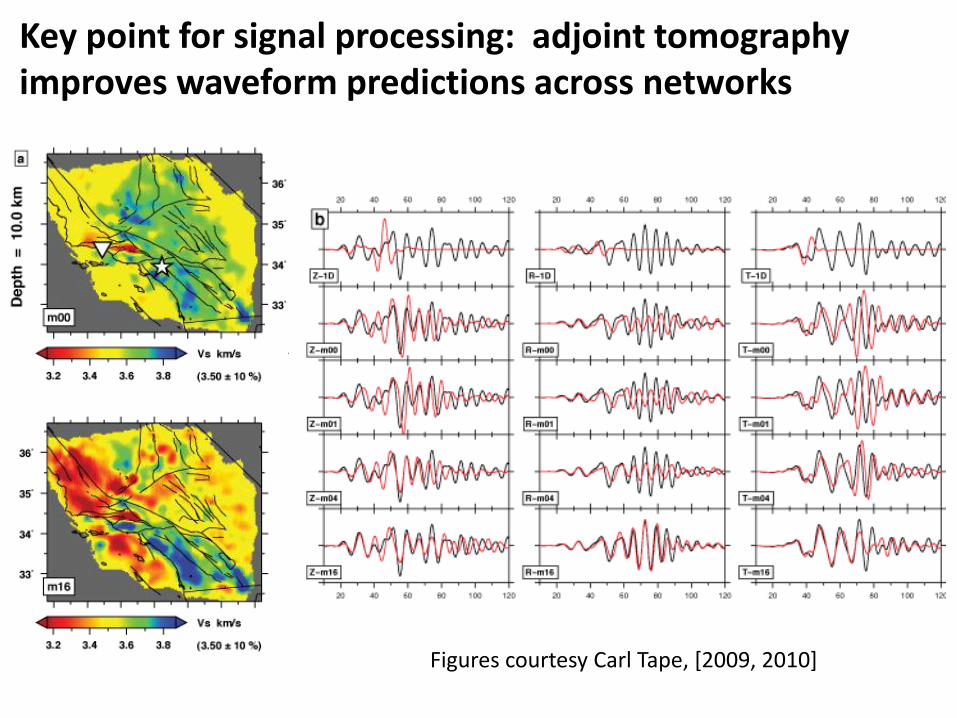
Key point for signal processing: adjoint tomography improves waveform predictions across networks
Figures courtesy Carl Tape, [2009, 2010]

Depth 75 km
Images courtesy Jeroen Tromp
Princeton University EU18 model of Europe (Zhu, Bozdag, Peter, Tromp)

200802201827A
M00 M18
Improvement in waveform prediction (Zhu, Bozdag, Peter, Tromp)
Images courtesy Jeroen Tromp
Conclusion
• Coherent array signal processing has been hampered by the absence of good waveform (and earth) models
• Empirical correlation approaches obviate this problem where prior observations exist
• Modern trends in data collection, computing and sophisticated tomography may lead to coherent processing over networks


