ABSTRACTCardiac arrhythmia is the cause of death a significant number ofdeaths. As such, automatic arrhythmia detection from an electro-cardiogram (ECG) is an important research topic. There are threedifficulties in detecting arrhythmia ECG signals: (1) ECG waveformdifferences between patients, (2) ECG waveform changes caused byheart rate variability, and (3) observation noise. To address theseproblems, in several studies, the use of a convolutional neural net-work (CNN) has been proposed for extracting abstract featuresfrom ECG signals. This paper presents a method to classify ECGfor arrhythmia detection using a Convolutional Denoising Autoen-coder (CDAE). By combining a CNN with a denoising autoencoder(DAE), we expect that more robust features can be extracted. OurECG classifier is built by combining the encoder part of the CDAEwith a fully connected layer. The evaluation results show that theproposed method outperforms the existing works with respect tospecific type of arrhythmia (i.e. ventricular ectopic beat, VEB) by1.3% for sensitivity.
CCS CONCEPTS• Applied computing → Health care information systems; •Information systems→ Data mining;
1 INTRODUCTIONSeven million people from all over the world die annually fromcardiac arrhythmia [11, 23], Detecting arrhythmia from electro-cardiogram (ECG) readings is clearly an important research topic.There has been substantial research on automatic arrhythmia clas-sification using wavelets [25], filter banks [1], support vector ma-chines [20] and more. Automatic arrhythmia classification fromECG signals can be divided into four steps [14] as follows: (1) ECGsignal preprocessing, (2) heartbeat segmentation, (3) feature ex-traction and (4) learning/classification. In the preprocessing step,noise reduction is applied to ECG signals. Noise reduction methods∗This work was done while Shu Takahashi was at NTT DOCOMO, INC.
originated with signal processing techniques, such as the finiteimpulse response filter[19] and the Kalman filter [18]. The R peak isdetected in the segmentation step. Next, features for classificationare extracted from the ECG signals in the RR interval (RRI). Finally,arrhythmia classification is performed on the features extracted inprevious step. Due to the fact that heartbeat segmentation methodshave been well studied and have achieved high levels of accuracy(> 99%), the key steps for improving the classification performanceare improved noise reduction and feature extraction [14, 29]. Inprevious studies, feature extraction was performed by computinghandcrafted features, such as signal processing-based frequencycharacteristics (e.g. wavelet transform [25] or filter bank [1]) andhigher order statistics [20]. Recently, techniques for feature extrac-tion from ECG signals using a convolutional neural network (CNN)were proposed and achieved a high performance for arrhythmiadetection compared to previous studies [10, 11, 21, 22, 29].
Existing studies can be divided into two categories: the patient-specific approach and the non-patient-specific approach. In thepatient-specific approach, there is a patient overlap between train-ing and test (prediction target) data. On the other hand, there is nopatient overlap between training and test data in the non-patient-specific approach. Real-world setting applications of the patient-specific approach are very limited because it is difficult to obtainmanually annotated ECG data for any specific patient. Thus, non-patient-specific arrhythmia classification is important for a widevariety of applications, and hence it is a challenging problem forthe three reasons described below [29].
(1) ECGWaveform Difference between PatientsDue to the fact that ECG waveforms may vary betweenpatients, it is difficult to robustly detect arrhythmia for allpatients.
(2) ECGWaveform Changes Caused by Heart Rate VariabilityECG waveforms can change depending on the physiolog-ical and mental status of the patient and, thus, are influ-enced by, for example, stress state, excitement, and exercise.Therefore, it is hard to robustly detect arrhythmia for vari-ous patient’s statuses.
(3) Observation NoiseECG signals contain noise caused by the features of theenvironment, such as electrical noise and the patientsâĂŹphysical movements during ECG measurements. Thus, forappropriate classification, noise reduction is needed.
In several studies, non-patient-specific arrhythmia detection hasbeen examined using a CNN. For example, Rajpurkar et al. [22]built a large-scale dataset of 30,000 unique patients, for arrhythmiadetection. Their database had more than 500 times as many entriesas the MIT-BIH Arrhythmia Database which is the most widelyused, publicly available dataset for performance evaluation of ECG
KDD’18 Deep Learning Day, August 2018, London, UK Keiichi Ochiai, Shu Takahashi, and Yusuke Fukazawa
classification [22]. Rajpurkar et al. collected single-lead ECG datafrom a pool of nearly 30,000 patients who used the Zio Patch mon-itor provided by iRhythm Technologies1. In addition to buildingthis large-scale dataset, they proposed a 34-layer CNN model toclassify 13 classes of arrhythmia. Their large-scale dataset and deeparchitecture helped extract high-level (abstract) features, whichare important for high-accuracy classification from ECG signals.However, it is very expensive to collect annotated data on such alarge scale.
An autoencoder (AE) [8] is used to extract high-level representa-tion of data in the field of image recognition. A Denoising Autoen-coder (DAE), which can extract more robust features compared toAE by adding noise to the input data, has been proposed by Vincentet al. [26]. We leveraged the characteristics of both of these AEneural networks for feature extraction from ECG signals.
In this paper, we present a method for non-patient-specific ar-rhythmia detection that uses a convolutional denoising autoencoder(CDAE). Due to the fact that ECG waveform differences betweenpatients and observation noise complicate the arrhythmia classifi-cation from ECG signals, we combine a CNN with a DAE to extractrobust features from ECG signals. By adding a fully connected layerto the encoder part of the pretrained CDAE model, we can fine-tune classification model that is highly accurate for new patients.In addition, in the hopes of improving the accuracy of arrhythmiaclassification by considering the interinfluence characteristics ofmultichannel ECG, we evaluate 1D and 2D CNN filters for arrhyth-mia classification.
Our contributions are as follows:• We present a novel approach for feature extraction and
noise reduction for ECG classification using CDAE.• We evaluate the effectiveness of a DAE for ECG classifica-
tion using a publicly available ECG dataset.• With our CDAE model, we achieved the highest sensitivity
and specificity of detection for a specific type of arrhythmia(ventricular ectopic beat, VEB) in the MIT-BIH ArrhythmiaDatabase.
The rest of this paper is organized as follows. In Section 2, wereview the previous work. Section 3 describes the proposed method.In Section 4, we conduct an experiment on a public dataset andcompare the proposed method with existing works. Finally, weconclude the paper and discuss future work in Section 5.
2 RELATEDWORKOver at least the past decade, researchers have developed severaltechniques to detect arrhythmia from ECG signals. We will firstintroduce the general framework for arrhythmia detection fromECG signals. Next, we will review previous work on automaticarrhythmia detection.
2.1 Arrhythmia Detection from ECGECG signals represent the cardiac electrical activity. For the diag-nosis of arrhythmia and other forms of heart diseases, the heartrate, rhythm, and change in each waveform pattern of an ECG areobserved. Figure 1 shows an example of a 2-lead ECG from the
1http://irhythmtech.com/
MIT-BIH Arrhythmia Database [17] The peak of an ECG waveformis called an R-peak, and the interval between two R-peaks is calledthe RR interval (RRI) as illustrated in Figure 1. An ECG signal isdivided into windows, each of which includes signals on both theright and the left sides of the R-peak. Then, for each window, it isdecided whether it is arrhythmia or not based on features extractedfrom each window. Therefore, it is necessary for ECG classificationto extract effective features from each window.
2.2 Related Work for Arrhythmia Detectionfrom ECG
As mentioned in Section 1, the state of the art in arrhythmia detec-tion comes from a deep-learning-based approach (e.g., the use ofCNNs), which outperforms the handcrafted feature-based approach.Therefore, in this subsection, we review studies that employ deeplearning in addition to Rajpurkar et al. [22] described in Section1. Kiranyaz et al. [10] proposed a method for patient-specific ECGclassification using 1D CNN. The model was evaluated on the MIT-BIH Arrhythmia Database and focused primarily on two specifictypes of arrhythmia: VEB and supraventricular ectopic beat (SVEB).Kiranyaz et al. [11] also proposed a personalized monitoring system.In [11], the classificationmodel was trained by real normal beats andsynthesized abnormal beats for binary (i.e. normal class/abnormalclass) classification. Since the target of their system was healthysubjects, no real abnormal beats were used in the training datasets.Zubair et al. [29] proposed a method for non-patient-specific ECGclassification using 1D CNN. The model that they proposed wascomprised of three convolutional layers, three pooling layers andone fully connected layer with Softmax. The performance of themodel was evaluated on the MIT-BIH Arrhythmia Database, andits overall accuracy is 92.7%. However, this evaluation is not strictlynon-patient-specific because there is a patient overlap betweentraining and test data in this evaluation. In addition, while they
RRI
window
R wave (R peak)
Figure 1: Example of ECG
Arrhythmia Detection from 2-lead ECG using Convolutional DenoisingAutoencoders KDD’18 Deep Learning Day, August 2018, London, UK
evaluated the overall accuracy, the classification performance forspecific types of arrhythmia was not evaluated. Pourbabaee et al.[21] proposed a five-layer CNN for specific arrhythmia detection(Paroxysmal Atrial Fibrillation, PAF). This method classifies subjectsas “health” or “has PAF.” They evaluated their method on the PAFprediction challenge dataset[16]. Rahhal et al. [2] proposed to usea stacked denoising autoencoder (SDAE) for active-learning-basedclassification.
To the best of our knowledge, our work differs from the previ-ously proposed methods in following aspects:
• Although deep CNN and SDAE have been used in existingwork, our research is the first to incorporate DAE into theCNN model for ECG classification.
• No existing work evaluated the effect of CNN and DAE fora specific type of arrhythmia in the non-patient-specificapproach.
3 THE PROPOSED METHODWe propose a method for feature extraction from ECG data usingCDAEs and arrhythmia classification. The proposed method isdivided into two steps as follows: In this paper, we refer to thepatient that is not contained in the training data. as the “unseenpatient.”
i) Feature Extraction using CDAE (Pretraining)DAEs are considered effective for high-level feature repre-sentation because ECG signals exhibit a variation that isdependent on the individual patient and observation noise.In addition, since ECG signals are a form of time-seriesdata and it is useful to exploit the data around (both beforeand after) the classification target, we use a CNN model toextract features from around the classification target [28].Therefore, we propose to use CDAE, which combines aDAE with a CNN for feature extraction. Similar to a DAE,a CDAE is an unsupervised deep neural network trainedso as to reconstruct input data that has been corrupted byadding noise.
ii) Training Classifier (Fine-Tuning)To build our classifier, the encoder part of the CDAE is com-binedwith the fully connected layer for classification. Then,the weights can be fine-tuned using back-propagation. Theway of training the weight is similar for the DAE.
In the rest of this section, we will describe the details of eachstep.
3.1 Feature extraction using CDAE(pre-training)
AEs are a dimensionality reduction algorithm that was proposedby Hinton et al. [8]. The weight of the AE is trained through amultilayer neural network with a small central layer used to re-construct the input data, which is of high dimensionality. As aresult of the training, we can obtain a higher-level representationof the input data. An AE takes an input x ∈ Rd and maps it tothe hidden representation y ∈ Rd
′
using a deterministic mappingfunction, called the encoder, y = fθ (x ) = σ (Wx + b) with pa-rameterized by θ = {W ,b}. Here,W is d × d ′ weight matrix, b is
bias vector and σ (·) is an activation function. Let z ∈ Rd be recon-structed vector. Then, reverse mapping function, called the decoder,is z = дθ ′ (y) = σ (W ′y + b ′) with parameterized by θ ′ = {W ′,b ′}.The weight parameter is usually constrained byW ′ =WT . Eachtraining datum xi is then mapped to the corresponding yi and itsreconstruction zi . The parameters of the AE can be obtained byminimizing the following objective function.
θ ,θ ′ = argminθ,θ ′
1n
n∑i=1
L(xi ,zi )
= argminθ,θ ′
1n
n∑i=1
L(xi ,дθ ′ ( fθ (xi ))) (1)
where L is a cost function„ for which we will use the mean squarederror (MSE): L(xi ,zi ) = ∥xi − zi ∥2.
The DAE proposed by Vincent et al. [26] can extract more robustfeatures compared to the AE algorithm by adding noise to the inputdata. Figure 2 shows an example of a DAE. In the DAE, the initialinput x is corrupted to x̃ by a stochastic mapping x̃ ∼ C (x̃ |x ),which partially destroys the input data. The algorithm uses thecorrupted x̃ as input data and then maps it to the corresponding yiand ultimately to its reconstruction zi . The parameters of DAE canbe trained by minimizing the following objective function.
θ ,θ ′ = argminθ,θ ′
1n
n∑i=1
L(xi ,zi )
= argminθ,θ ′
1n
n∑i=1
L(xi ,дθ ′ ( fθ (x̃i ))) (2)
Recently, owing to their high performance, CNNs have receivedconsiderable attention in the field of image recognition [12] andnatural language processing [9, 27] etc. CNNs consist of three basiclayers: a convolutional layer, a pooling layer and a classificationlayer [13]. Features whose patterns appear in the input data areextracted using the convolutional layer, and the pooling layer offersa model that is robust to the location of the patterns appearing inthe input data [24]. Only the convolutional layer and the poolinglayer are used in the pretraining phase.
Figure 2: Example of denoising autoencoder
KDD’18 Deep Learning Day, August 2018, London, UK Keiichi Ochiai, Shu Takahashi, and Yusuke Fukazawa
Masci et al. [15] proposed a a convolutional autoencoder (CAE)that uses CNNs in the encoder layer and in the hidden layer of theAE. The difference between the CAE and the AE is weight sharing.The CAE has fewer parameters than the AE. The experimentalresults showed that the CAE outperforms CNN in several imageclassification tasks. Du et al. [5] presented stacked convolutional de-noising autoencoders (SCDAEs), which are constructed by stackingDAEs whose weights are trained in a convolutional way. Evaluationon large-scale image datasets showed that SCDAE is superior interms of learning robustness and abstract features.
In this research, we propose to use CDAE which has a convo-lutional layer and a pooling layer in the encoder and decoder ofthe DAE for feature extraction. As mentioned in Section 1, thereare three problems in arrhythmia detection from ECG signals: ECGwaveform change due to patients and heart rate variability, and ob-servation noise. By exploiting the nature of high-level (abstract) fea-tures extracted by the convolutional layer and translation-invariantfeatures extraction by the pooling layer, it is possible to extractrobust features against patient and heart rate variability. In addi-tion, feature extraction that is robust to observation noise can beperformed by adding noise to input data.
For each ECG channel input x , the hidden representation y ofthe kth feature map is represented by
yk = σ (W k ∗ x + bk ) (3)
where ∗ denotes the convolutional operation [15]. If the input datais 2-lead (channel) ECG signal, the 2D filter is applied in the convo-lutional operation. The decoder is denoted by
z = σ (∑k ∈H
W ′k ∗yk + b ′k ) (4)
where H indicates the group of latent feature maps. We use theMaxPooling as the pooling layer in the encoder, and we use Up-sampling in the decoder. MaxPooling outputs the maximum valuewithin the region covered by the filter. Upsampling repeats (copies)the input value up to the filter size. Let x̃i and zi be the corruptedinput data and the output data, respectively. Then, the loss func-tion is represented as in Eq. (2). Equation (2) is optimized using aback-propagation algorithm.
3.2 Building Classifier (Fine-Tuning)CDAEs have no classification function. To build an arrhythmiaclassifier, a fully connected layer (classification layer) is added ontop of the encoder part of the CDAE described in Section 3.1. Figure3 presents a conceptual depiction of building the classifier froma pretrained CDAE model. The weights and the neural networkarchitecture are extracted from the pretrained CDAE model, andthe fully connected layer is added as an output layer. The numberof units of the output layer is the number of classes into whichwe would like to classify arrhythmia. The classifier is trained bysupervised learning using input data x and an annotated label asan output.
The Softmax function is used as an activation function for theoutput layer of the classifier. By using the Softmax function, theoutput of each unit can be treated as the probability of each label.Here, let N be the number of units of the output layer, let x be theinput, and let xi be the output of unit i . Then, the output p (i ) of
unit i is defined by the following equation.
p (i ) =exi∑Nj=1 e
x j(5)
Cross-entropy is used as the loss function of classifier LCLF asfollows.
LCLF (θ ) = −1n
n∑i=1
m∑j=1
yi j loд(pi j ) (6)
where n is the sample size,m is the number of classes, pi j is theoutput of the classifier of class j of the ith sample and yi j is theannotated label of class j of the ith sample.
4 EXPERIMENTS4.1 Experimental SettingWe used the MIT-BIH Arrhythmia Database2 which is the mostwidely used database in existing ECG classification [14] for perfor-mance evaluation. This database contains 48 records, each contain-ing 2-lead ECG signals for a 30 min segment from a 24 h recording.Each ECG signal is bandpass-filtered at 0.1 - 100 Hz and the sam-pling frequency is 360Hz. The 44 records except for 102, 104, 107,217 from MIT-BIH Arrhythmia Database are selected for the exper-iment because these excluded records do not have sufficient signalquality based on Association for the Advancement of Medical In-strumentation (AAMI)3 recommendation [6]. This same criterion isused in existing work such as [10, 29]. Each record has RRI and an-notated labels provided by PhysioNet. The AAMI recommends thateach ECG beat be classified into the following five heartbeat types:N (normal beats), S (supraventricular ectopic beats, SVEB), V (ven-tricular ectopic beats, VEB), F (fusion beat), and Q (unclassifiablebeats).
Arrhythmia Detection from 2-lead ECG using Convolutional DenoisingAutoencoders KDD’18 Deep Learning Day, August 2018, London, UK
Each window of an ECG waveform has a different size becausethe RRI is not constant. In addition, the ECG of each patient hasa different amplitude. Therefore, we normalized ECG signals. Tostandardize the length of the RRI of each window, the data is resam-pled at a fixed rate using a Fourier transform. Next, the amplitudeof each window is normalized from 0 to 1. In our setting, the nor-malization is applied after resampling at a fixed rate of 160 samplesfrom each window.
To evaluate the performance of the classification of unseen pa-tients, we conducted a 5-fold cross-validation. Specifically, we di-vided the 44 users into five groups. The model was trained by thedata of four groups, and a test was conducted on the remaininggroup. We repeatedly changed the group used for testing five times,in conducting 5-fold Leave-One-Group-Out Cross-Validation. 5,000beats were randomly sampled from the training data as validationdata. These validation data were then removed from the trainingdata. Table 1 shows an example of AAMI recommended classes ofarrhythmia and the number of samples in training and test set fromone-fold.
Classification performance is measured by using the followingfour metrics in the literature [10]. Classification Accuracy (Acc),Sensitivity (Sen), Specificity (Spe), and Positive Predictive Value(Ppv). While accuracy can be used for evaluating the overall perfor-mance, the other metrics can measure the performance of specificclass. These four metrics are defined by following numbers: truepositive (TP), true negative (TN), false positive (FP) and false nega-tive (FN). Accuracy is the ratio of the number of correctly classifiedsamples to the total number of samples. Acc = (TP + TN)/(TP + TN+ FP + FN). Sensitivity is the ratio of positives that are correctlyclassified to actually positive samples. Sen = TP/(TP + FN). Speci-ficity is the ratio of negatives that are correctly classified to actuallynegative samples. Spe = TN/(TN + FP). Positive Predictive Value isthe ratio of the number of correctly classified positive samples tothe number of the samples which is predicted as positive. Ppv =TP/(TP + FP).
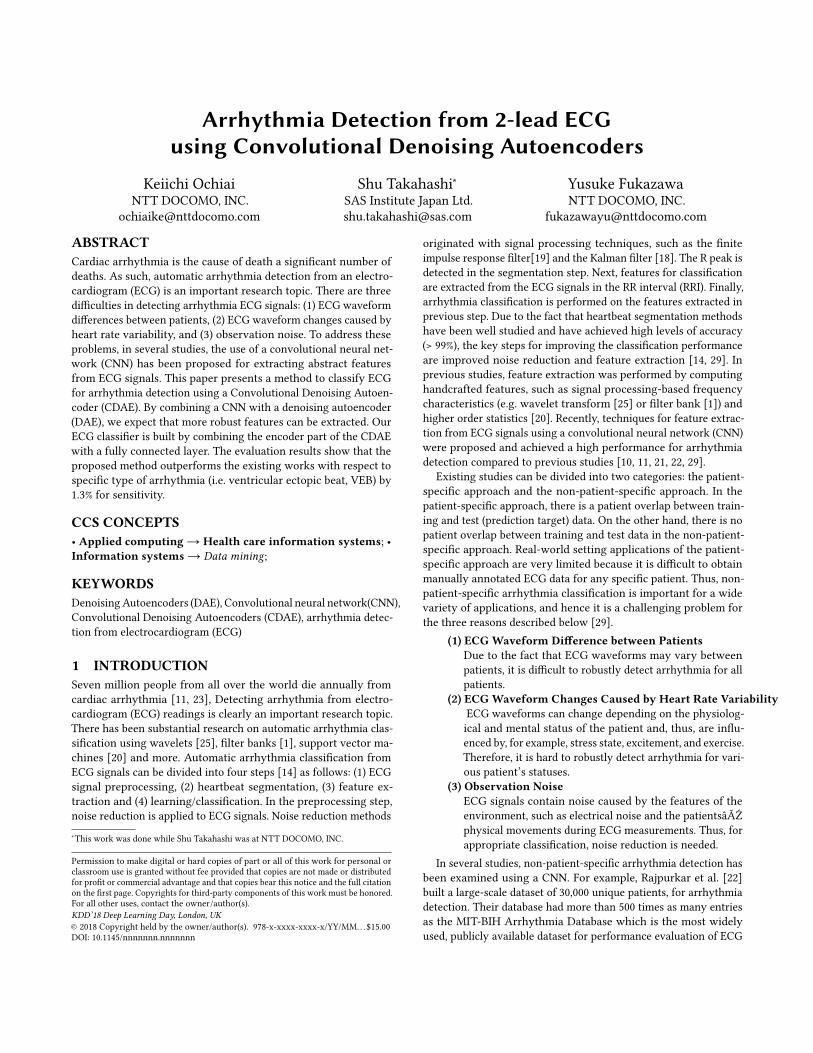
Table 2 shows the architecture of the CDAE used in our evalua-tion. We used three convolution layers and three pooling layers inCDAE. ReLU [7] is used as the activation function and Nadam [4]is used as the optimization method. The initial learning rate is setto 0.002 and gradually decreased. The input data is corrupted byGaussian distribution (mean=0, std=0.001).
The classifier is constructed by combining the pretrained en-coder part of the CDAE with the fully connected layer. We added32-dimensional and 5-dimensional full connected layers. Figure 4
Table 1: AAMI recommended classes of arrhythmia andnumber of samples
shows the details of the architecture of the classifier. Cross-entropywas used as the loss function and Stochastic Gradient Descent [3]was used as the optimization method. The initial learning rate wasset to 0.01 and gradually decreased.
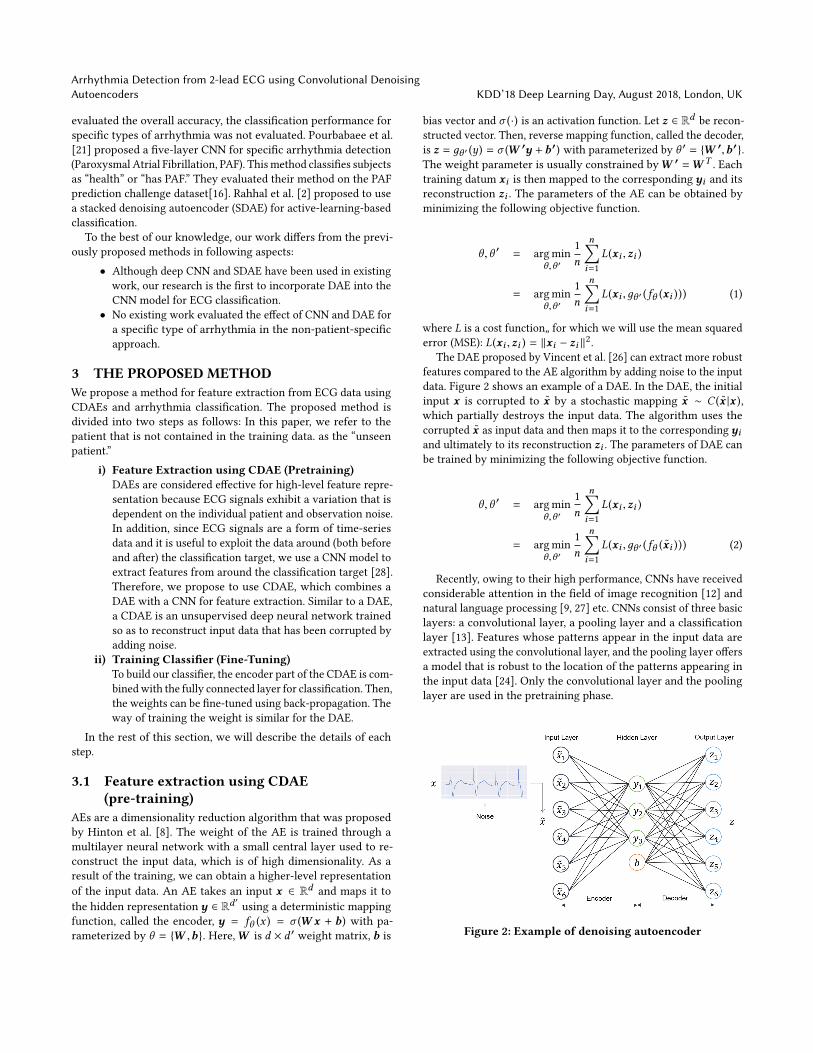
4.2 ResultsFigure 5 shows the training curve of the CDAE. This figure indicatesthat the errors of the test data (loss) and validation data (val-loss)decrease by increasing the epoch. The result shows that CDAEs canextract high-level features not only from the training data but alsofrom unseen data. Figure 6 shows two examples (blue and greenlines) of ECG signals reconstructed ECG signals from the test datausing the CDAE. The reconstructed waveform shows the effect ofdenoising while maintaining its overall shape.
Figure 7 shows the learning curve of the classifier, and Figure 8shows the accuracy of each epoch. The errors of the test data (loss)and the validation data (val-loss) decrease by increasing epochs,similar to pretraining. The accuracy increases with the epoch.
The evaluation results are shown in Table 3 for Type V (VEB) andin Table 4 for Type S (SVEB). Since the overall accuracy is dominatedby normal beats, we evaluated a specific type of arrhythmia. Table5 shows the confusion matrix of the proposed method. Due to thefact that there is no existing work using the MIT-BIH ArrhythmiaDatabase for specific types of arrhythmia with the non-patient-specific approach, we compared the proposed method with a similarCNN model proposed in the work of Zubair et al. [29] as a baselinemethod. The difference between their CNNmodel and the proposedmodel is the incorporation of a DAE. In addition, we evaluated theeffect of 1D and 2D CNN filters on arrhythmia classification.
From Table 3, we can see that the proposed method with the2D convolution filter is the model with best performance. Whilethe performance of the 2D convolution filter is higher than thatof the 1D filter for all metrics in the proposed method, the trendin the baseline method (Zubair et al. [29]) that we used for ourcomparison is different. Regarding sensitivity, which is the mostimportant metric for arrhythmia detection, the proposed methodwith the 2D filter outperforms the baseline method with the 1Dfilter by 1.3%. From Table 4, the proposed method with the 2D filter
KDD’18 Deep Learning Day, August 2018, London, UK Keiichi Ochiai, Shu Takahashi, and Yusuke Fukazawa
conv 2x15 32 feature maps maxpool1x2
conv1x5 16 feature maps
maxpool1x2
conv1x5 4 feature maps
maxpool1x2
flatten full connect
160x2 160x32 80x32 80x16 40x16 40x4 20x4 80 32 5
…
…
full connect
softmax
Encoder part of CDAE
Figure 4: Architecture of the classifier
has the highest accuracy and specificity, whereas the proposedmethod with the 1D filter has the highest sensitivity and positivepredictive value for SVEB. However, the sensitivity and positivepredictive value for SVEB are quite low, which is a limitation ofthe proposed method. The reason might be that the set of trainingsamples of Type S was small. We would like to clarify the effect ofsample size on the classification accuracy in the future work.
Epochs
MS
E
Figure 5: Learning Curve of CDAE
Sca
led
Am
plitu
de
Sample
Input data x
Reconstructed data z
Figure 6: Example of the reconstructed data using CDAE
Epochs
Cro
ss E
ntro
py
Figure 7: Learning curve of classifier
Epochs
Acc
urac
y
Figure 8: Accuracy of classifier
5 CONCLUSIONIn this paper, we proposed a method for arrhythmia detection fromECG signals using a Convolutional Denoising Autoencoder. Whilethe CNN-based approach has been already proposed, this research isthe first to incorporate a DAE with a CNN for arrhythmia detection.The weight of the neural network is trained by the CDAE, andthe classifier is built by combining the encoder part of the CDAEwith a fully connected layer. The evaluation results show that theCDAE is effective for VEB in the non-patient-specific approach forarrhythmia diagnosis.
In the future work, we would like to investigate the effect ofthe size of the training data on the classification performance to
Arrhythmia Detection from 2-lead ECG using Convolutional DenoisingAutoencoders KDD’18 Deep Learning Day, August 2018, London, UK
improve the classification accuracy of SVEB. In addition, we wouldlike to apply the proposed method to not only 2-lead ECGs but also12-lead ECGs which are widely used in the clinical field. While the12-lead ECG has a vast amount of information and spatially helpfuldata compared to 2-lead ECG, there is a limit in visual examinationby cardiologists because there is so much information. Therefore,we expect automatic arrhythmia detection to be an efficient meansof diagnosis in this case, as well.
REFERENCES[1] Valtino X Afonso, Willis J Tompkins, Truong Q Nguyen, and Shen Luo. 1999.
ECG beat detection using filter banks. IEEE transactions on biomedical engineering46, 2 (1999), 192–202.
[2] MMAl Rahhal, Yakoub Bazi, Haikel AlHichri, Naif Alajlan, Farid Melgani, and RRYager. 2016. Deep learning approach for active classification of electrocardiogramsignals. Information Sciences 345 (2016), 340–354.
[4] Timothy Dozat. 2015. Incorporating Nesterov momentum into Adam. TechnicalReport. Stanford University, Tech. Rep., 2015.[Online]. Available: http://cs229.stanford. edu/proj2015/054 report. pdf.
[5] B. Du, W. Xiong, J. Wu, L. Zhang, L. Zhang, and D. Tao. 2017. Stacked Convolu-tional Denoising Auto-Encoders for Feature Representation. IEEE Transactionson Cybernetics 47, 4 (April 2017), 1017–1027.
[6] Association for the Advancement of Medical Instrumentation. Arrhythmia Mon-itoring Subcommittee. 1986. Recommended Practice for Testing and ReportingPerformance Results of Ventricular Arrhythmia Detection Algorithms (proposed).Association for the Advancement of Medical Instrumentation.
[7] Xavier Glorot, Antoine Bordes, and Yoshua Bengio. 2011. Deep Sparse RectifierNeural Networks.. In Aistats, Vol. 15. 275.
[8] Geoffrey E Hinton and Ruslan R Salakhutdinov. 2006. Reducing the dimension-ality of data with neural networks. science 313, 5786 (2006), 504–507.
[10] Serkan Kiranyaz, Turker Ince, and Moncef Gabbouj. 2016. Real-time patient-specific ECG classification by 1-D convolutional neural networks. IEEE Transac-tions on Biomedical Engineering 63, 3 (2016), 664–675.
[11] Serkan Kiranyaz, Turker Ince, and Moncef Gabbouj. 2017. Personalized Monitor-ing and Advance Warning System for Cardiac Arrhythmias. Scientific Reports 7,1 (2017), 9270.
[12] Alex Krizhevsky, Ilya Sutskever, and Geoffrey E Hinton. 2012. Imagenet classifica-tion with deep convolutional neural networks. In Advances in neural informationprocessing systems. 1097–1105.
[13] Yann LeCun, Léon Bottou, Yoshua Bengio, and Patrick Haffner. 1998. Gradient-based learning applied to document recognition. Proc. IEEE 86, 11 (1998), 2278–2324.
[14] Eduardo José da S Luz, William Robson Schwartz, Guillermo Cámara-Chávez,and David Menotti. 2016. ECG-based heartbeat classification for arrhythmiadetection: A survey. Computer methods and programs in biomedicine 127 (2016),144–164.
[15] Jonathan Masci, Ueli Meier, Dan Cireşan, and Jürgen Schmidhuber. 2011. Stackedconvolutional auto-encoders for hierarchical feature extraction. Artificial NeuralNetworks and Machine Learning–ICANN 2011 (2011), 52–59.
[16] George Moody, A Goldberger, S McClennen, and S Swiryn. 2001. Predicting theonset of paroxysmal atrial fibrillation: The Computers in Cardiology Challenge2001. In Computers in Cardiology 2001. IEEE, 113–116.
[17] George BMoody and Roger GMark. 2001. The impact of theMIT-BIH arrhythmiadatabase. IEEE Engineering in Medicine and Biology Magazine 20, 3 (2001), 45–50.
[18] S.J. Orfanidis. 1988. Optimum signal processing: an introduction. Macmillan.[19] Sophocles J. Orfanidis. 1995. Introduction to Signal Processing. Prentice-Hall, Inc.,
Upper Saddle River, NJ, USA.[20] Stanislaw Osowski, Linh Tran Hoai, and Tomasz Markiewicz. 2004. Support
vector machine-based expert system for reliable heartbeat recognition. IEEEtransactions on biomedical engineering 51, 4 (2004), 582–589.
[21] Bahareh Pourbabaee, Mehrsan Javan Roshtkhari, and Khashayar Khorasani. 2017.Deep Convolutional Neural Networks and Learning ECG Features for ScreeningParoxysmal Atrial Fibrillation Patients. IEEE Transactions on Systems, Man, andCybernetics: Systems (2017).
[22] Pranav Rajpurkar, Awni Y Hannun, Masoumeh Haghpanahi, Codie Bourn, andAndrew Y Ng. 2017. Cardiologist-level arrhythmia detection with convolutionalneural networks. arXiv preprint arXiv:1707.01836 (2017).
[23] Yoram Rudy. 2010. Noninvasive imaging of cardiac electrophysiology and ar-rhythmia. Annals of the New York Academy of Sciences 1188, 1 (2010), 214–221.
[24] Dominik Scherer, Andreas Müller, and Sven Behnke. 2010. Evaluation of poolingoperations in convolutional architectures for object recognition. Artificial NeuralNetworks–ICANN 2010 (2010), 92–101.
[25] VK Srivastava and Devendra Prasad. 2013. DWT-Based Feature Extraction fromecg Signal. American J. of Eng. Research (AJER) 2, 3 (2013), 44–50.
[26] Pascal Vincent, Hugo Larochelle, Yoshua Bengio, and Pierre-Antoine Manzagol.2008. Extracting and composing robust features with denoising autoencoders.In Proceedings of the 25th international conference on Machine learning. ACM,1096–1103.
[27] Xiang Zhang, Junbo Zhao, and Yann LeCun. 2015. Character-level convolutionalnetworks for text classification. In Advances in neural information processingsystems. 649–657.
[28] Yi Zheng, Qi Liu, Enhong Chen, Yong Ge, and J Leon Zhao. 2014. Time seriesclassification using multi-channels deep convolutional neural networks. In Inter-national Conference on Web-Age Information Management. Springer, 298–310.
[29] Muhammad Zubair, Jinsul Kim, and Changwoo Yoon. 2016. An AutomatedECG Beat Classification System Using Convolutional Neural Networks. In 6thInternational Conference on IT Convergence and Security (ICITCS). IEEE, 1–5.


![Automatic Detection of Cardiac Arrhythmia through ECG ...€¦ · Cardiac Arrhythmia [3], also known as irregular heartbeat, is a group of conditions in which the heartbeat is irregular,](https://static.documents.pub/doc/80x56/607210056cc22557db7f5efb/automatic-detection-of-cardiac-arrhythmia-through-ecg-cardiac-arrhythmia-3.jpg)


