Page 1
Supporting Information
Engineered architecture of nitrogenous graphene encapsulating porous carbon
with nano-channel reactors enhancing the PEM fuel cell performance
Xiaogang Fu,a† Fathy M. Hassan,a† Pouyan Zamani,a Gaopeng Jiang,a Drew C.
Higgins,a,b Ja-Yeon Choi,a Xiaolei Wang,a Pan Xu,a Yanru Liua and Zhongwei Chena*
[†] The authors contributed equally to this work
a. Department of Chemical Engineering, University of Waterloo, 200 University Ave.
W, Waterloo, Ontario N2L 3G1, Canada
b. Department of Chemical Engineering, Stanford University, Shriram Center, 443
Via Ortega, Stanford, CA 94305, USA
*Corresponding author.
E-mail: [email protected]
1
Page 3
Graphitic meso-porouscarbon sphere (MCS)Aerosol assisted spray drying technique
Fig. S1. An aerosol-assisted process used to synthesize meso-porous graphitized
carbon spheres. [1, 2]
3
Page 4
-0.4 -0.3 -0.2 -0.1 0.0
-0.6
-0.4
-0.2
0.0
0.2
0.4
0.6C
urre
nt (m
A)
Potential (V vs. Ag/Agcl)
0.5 M H2SO4 Hydrogen oxidation
Hydrogen evolution
-0.216
Fig. S2. The calibration of Ag/AgCl (filled with 3M KCl) and the conversion
to RHE in hydrogen-saturated 0.5 M sulfuric acid electrolyte.
The conversion from Ag/AgCl to RHE scale was done in a typical three-electrode
system with polished platinum wires as the counter and working electrodes, and the
Ag/AgCl as the reference. The electrolyte (0.5 M H2SO4) was filled with pure
hydrogen. Linear scanning voltammetry was afterward performed at a scan rate of 0.1
mV s-1, and the potential at which the current is zero (-0.216 V vs. Ag/AgCl) was
considered to be the thermodynamic potential. Therefore:
ERHE=EAg /AgCl+0.216V
4
Page 5
(a) (b)
Fig. S3. HR-TEM images of as-synthesized partially graphitized MCS. The graphitic
carbon exists not only on the surface of the carbon spheres, but also within the whole
spheres as the pore walls.
5
Page 6
Fig. S4. TEM images of PANI-Fe-MCS. The green arrows designate the layered
graphene-like sheets, the yellow arrows designate the meso-porous carbon spheres.
6
Page 7
Fig. S5. TEM images of PANI-Fe.
7
Page 8
Fig. S6. TEM image of PANI-Fe-NCS. The green arrow designates the layered
graphene-like sheets, the yellow arrow designates the NCS.
8
Page 9
(a) (b)
(c)
0.0 0.2 0.4 0.6 0.8 1.00
1000
2000
3000
Volim
e (S
TP) (
cm3 g
1)
P / Po
MCS0
50
100
150
NCS
1 10 100
NCS
dV/ d
log
(D) (
cm3 g
1 n
m1)
Pore size (nm)
MCS
0
500
1000
1500
11891240
51230
surfa
ce a
rea
(m2 g
1)
BET surface area Microporous surface area External surface area
NCS MCS
14189
Fig. S7. a) Nitrogen adsorption–desorption isotherms, b) the corresponding BJH
model pore size distribution, c) surface areas of NCS and MCS.
9
Page 10
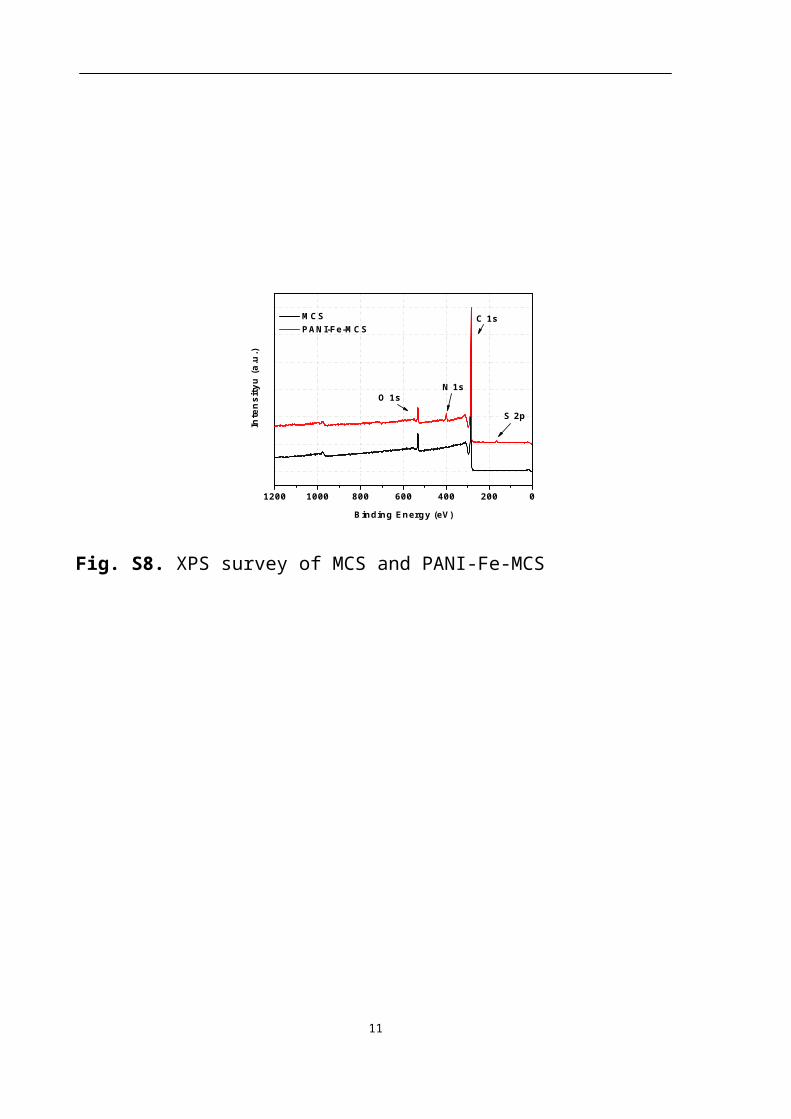
1200 1000 800 600 400 200 0
Inte
nsity
u (a
.u.)
Binding Energy (eV)
MCS PANI-Fe-MCS
S 2p
C 1s
N 1sO 1s
Fig. S8. XPS survey of MCS and PANI-Fe-MCS
10
Page 11
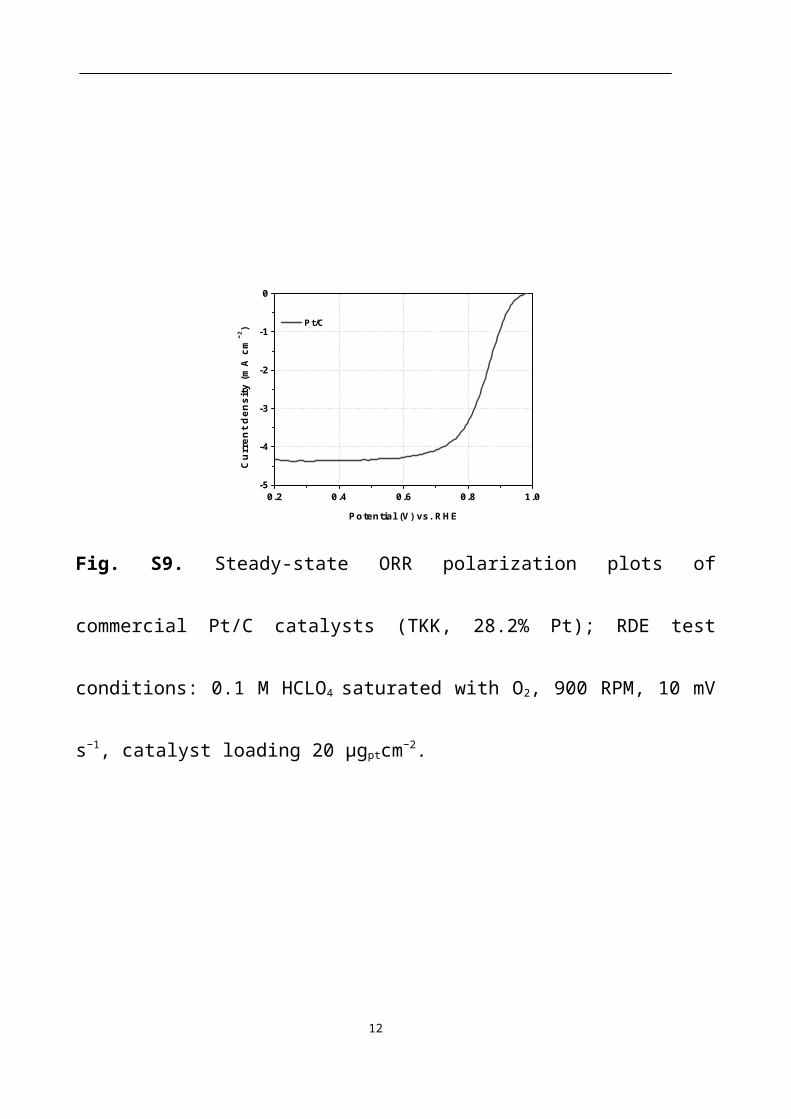
0.2 0.4 0.6 0.8 1.0-5
-4
-3
-2
-1
0
Curre
nt d
ensi
ty (m
A cm
2)
Potential (V) vs. RHE
Pt/C
Fig. S9. Steady-state ORR polarization plots of commercial Pt/C catalysts (TKK,
28.2% Pt); RDE test conditions: 0.1 M HCLO4 saturated with O2, 900 RPM, 10 mV
s−1, catalyst loading 20 μgptcm−2.
11
Page 12
0.97 0.98 0.99 1.00 1.01 1.02 1.03-0.4
-0.2
0.0
0.2
0.4
Curr
ent d
endi
ty (m
A cm
2)
Potential (V) vs. RHE
1 mV s1
5 mV s1
PANI-Fe-MCS
0.97 0.98 0.99 1.00 1.01 1.02 1.03
-0.3
-0.2
-0.1
0.0
0.1
0.2
0.3 PANI-Fe-NCS
Curr
ent d
endi
ty (m
A cm
2)
Potential (V) vs. RHE
1 mV s1
5 mV s1
0.97 0.98 0.99 1.00 1.01 1.02 1.03
-0.2
-0.1
0.0
0.1
0.2
Curre
nt d
endi
ty (m
A cm
2)
Potential (V) vs. RHE
1 mV s1
5 mV s1
PANI-Fe
1 2 3 4 5
0.1
0.2
0.3
Cdl = 69.14 mF cm2
R2 = 0.999
Cdl = 33.14 mF cm2
R2 = 0.999Curre
nt d
ensi
ty m
A cm
2
Scan rate mV s2
PANI-Fe PANI-Fe-NCS PANI-Fe-MCS
Cdl = 49.12 mF cm2
R2 = 0.999
(a) (b)
(c) (d)
Figure S10. The electrochemical double layer capacitance (Cdl) estimation. Cyclic
voltammetry (CV) data of (a) PANI-Fe, (b) PANI-Fe-NCS, and (c) PANI-Fe-MCS at
various scan rates (1 – 5 mV s-1). (d) Plots of current densities (taken at 1.00 V vs.
RHE) as a function of scan rates. All the CV curves were obtained in nitrogen-
saturated 0.5 M H2SO4.
12
Page 13
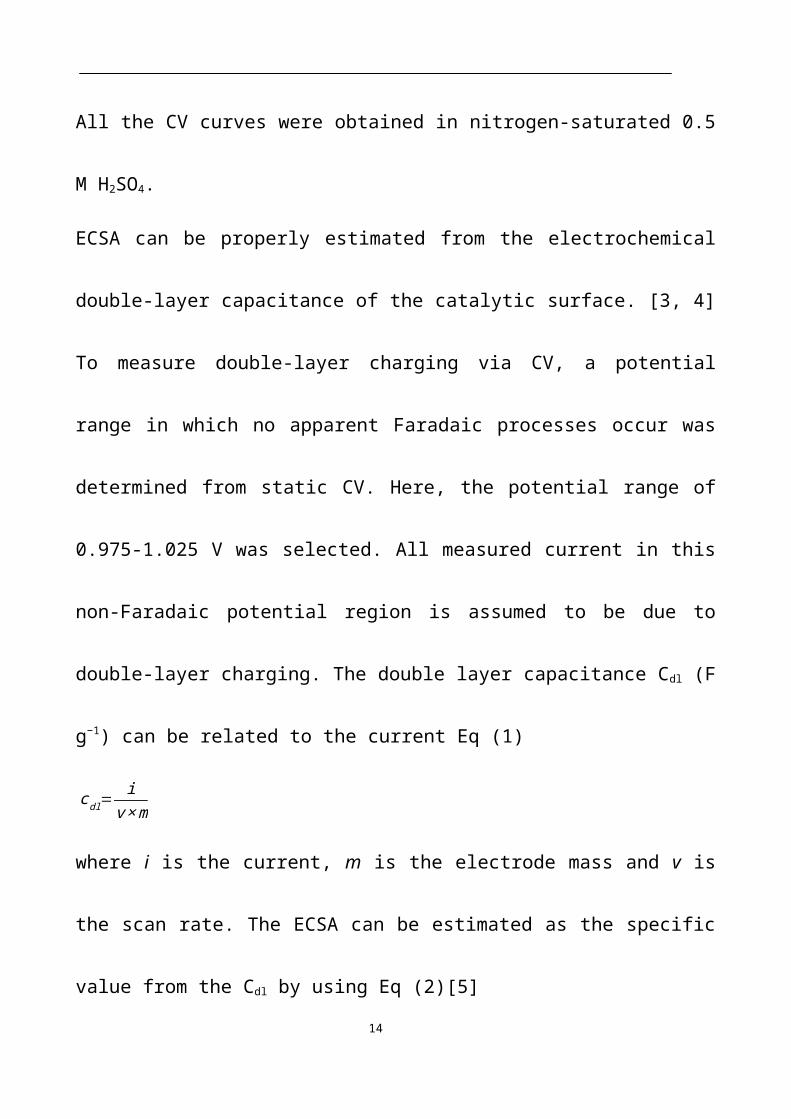
ECSA can be properly estimated from the electrochemical double-layer capacitance
of the catalytic surface. [3, 4] To measure double-layer charging via CV, a potential
range in which no apparent Faradaic processes occur was determined from static CV.
Here, the potential range of 0.975-1.025 V was selected. All measured current in this
non-Faradaic potential region is assumed to be due to double-layer charging. The
double layer capacitance Cdl (F g−1) can be related to the current Eq (1)
cdl=i
v ×m
where i is the current, m is the electrode mass and v is the scan rate. The ECSA can be
estimated as the specific value from the Cdl by using Eq (2)[5]
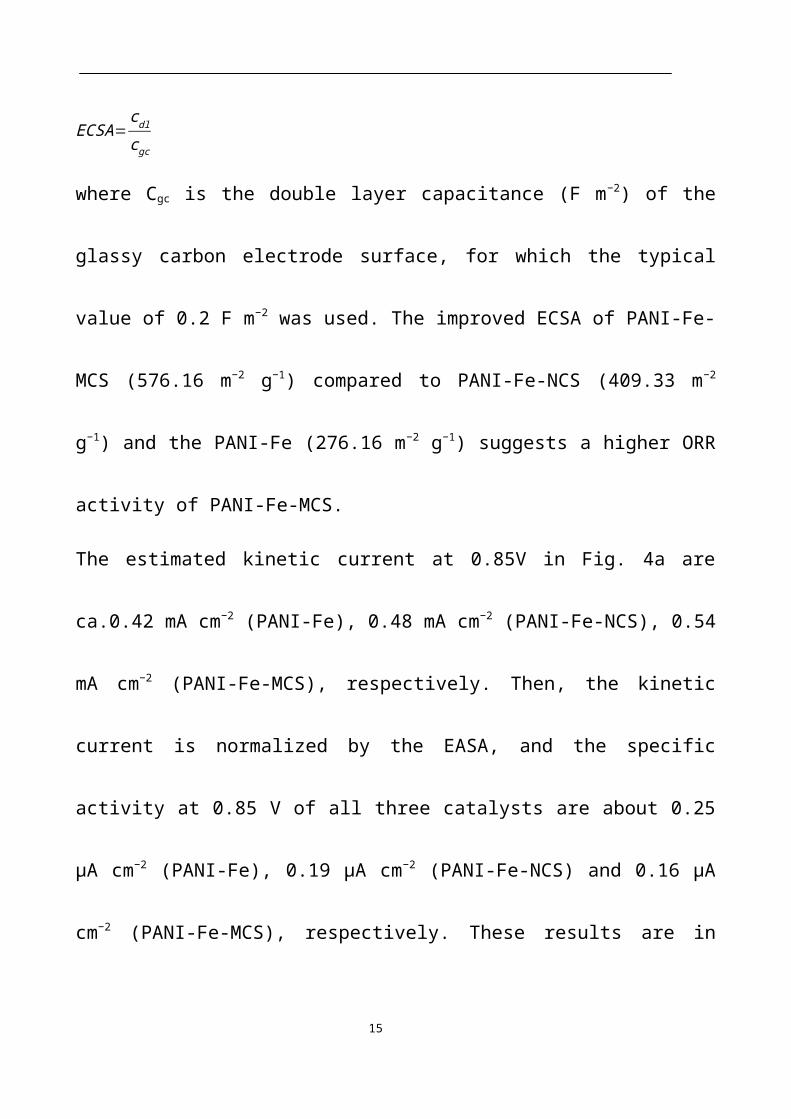
ECSA=cdlcgc
where Cgc is the double layer capacitance (F m−2) of the glassy carbon electrode
surface, for which the typical value of 0.2 F m−2 was used. The improved ECSA of
PANI-Fe-MCS (576.16 m−2 g−1) compared to PANI-Fe-NCS (409.33 m−2 g−1) and the
PANI-Fe (276.16 m−2 g−1) suggests a higher ORR activity of PANI-Fe-MCS.
The estimated kinetic current at 0.85V in Fig. 4a are ca.0.42 mA cm−2 (PANI-Fe),
13
Page 14
0.48 mA cm−2 (PANI-Fe-NCS), 0.54 mA cm−2 (PANI-Fe-MCS), respectively. Then,
the kinetic current is normalized by the EASA, and the specific activity at 0.85 V of
all three catalysts are about 0.25 μA cm−2 (PANI-Fe), 0.19 μA cm−2 (PANI-Fe-NCS)
and 0.16 μA cm−2 (PANI-Fe-MCS), respectively. These results are in line with
PEMFC performances in Fig. S11, where the ORR kinetic overpotentials are very
close in all three catalysts, while PANI-Fe has the lowest kinetic overpotential (ORR).
14
Page 15
0 1 2 3 40.0
0.2
0.4
0.6
0.8
1.0
1.2
1.4Erev=1.2 V
ORR = 415 mV
iR-free and tx-free Ecell iR-free Ecell measured Ecell
PANI-Fe
E ce
ll
Current density (A cm2)
785 mV
437 mV
288 mV
tx= 348 mV
Eohmic= 149 mV
0 1 2 3 40.0
0.2
0.4
0.6
0.8
1.0
1.2
1.4
ORR
=437mV
E ce
ll
Current density (A cm2)
iR-free and tx-free Ecell iR-free Ecell measured Ecell
PANI-Fe-MCS
tx=49mV
Eohmic=101mV
763 mV
714 mV613 mV
0 1 2 3 40.0
0.2
0.4
0.6
0.8
1.0
1.2
1.4
ORR
=425mV
PANI-Fe-NCS
E ce
ll
Current density (A cm2)
iR-free and tx-free Ecell iR-free Ecell measured Ecell
775 mV
697 mV
590 mV
tx=78 mV
Eohmic=107mV
0.01 0.1 10.6
0.7
0.8
0.9
1.0
iR c
orre
cted
vol
tage
(V)
Log Current density (A cm2)
PANI-Fe-MCS
69 mV/decade
0.01 0.1 10.6
0.7
0.8
0.9
1.0
68 mV/decade
PANI-Fe-NCS
iR-fr
ee v
olta
ge (V
)
Log Current density (A cm2)
(a) (c) (e)
(b) (f)(d)
0.01 0.1 10.6
0.7
0.8
0.9
1.0
65 mV/decade
PANI-Fe
iR-fr
ee v
olta
ge (V
)
Log Current density (A cm2)
Fig. S11. a), c) and d) Tafel plots of the PEMFC iR-free polarization curves. b), d)
and f), Square symbols: measured performance of single-cells. Triangular symbols:
iR-corrected voltage by Fuel Cell instrument. Circular symbols: mass-transport-free
(tx-free) and ohmically corrected (iR-free) Ecell/Current density curve of measured
polarization plots.
Fig. S11 was prepared to quantify the voltage loss contributions from: (i) the sluggish
O2 reduction kinetics, ORR, (ii) the ohmic losses, Eohmic and (iii) the mass-transport
15
Page 16
losses, tx.[6, 7] Therefore, the cell voltage, Ecell, of a H2-O2 fuel cell can be described
as:
Eq.3
Ecell=Erev (P H 2 , PO2,T )−∆ Eohmic−ORR−tx
Eq.4
Erev (PH 2 , PO2 ,T )=EH 2 /O2o −E
H 2 /H +¿o+ RT2 F
ln( PH 2PO2
12
PH2O)¿
The first term on the right-hand side of Eq. (3) is the reversible H2-O2 cell voltage,
which depends on the partial pressures of the reactants and the cell temperature,
equating to 1.2 V under the operating conditions.
The ohmic voltage loss, Eohmic, can be measured directly via high-frequency
resistance (HFR) measurements. The HFR values obtained by the Fuel cell instructor
are ca.0.16, ca. 0.12 and ca. 0.11 Ω cm2 for PANI-Fe, PANI-Fe-NCS, and PANI-Fe-
MCS, respectively. Then the iR-free cell voltage can be determined. The iR-free cell
voltage of the MEAs at low current densities (< 0.1 A cm−2) is controlled solely by
the voltage loss due to the O2 reduction kinetics, and then Tafel-slope can be
16
Page 17
determined in this current region (Fig S11 a, c, e). The resulted Tafel-slope values are
65 mV/decade, 68 mV/decade and 69 mV/decade for PANI-Fe, PANI-Fe-NCS and
PANI-Fe-MCS, respectively. Therefore, a conceptual polarization curve which would
be obtained in the absence of mass transport and ohmic resistances (tx = Eohmic = 0)
can be constructed by extrapolating the iR-free cell voltage obtained at low current
densities (< 0.1 A cm−2), resulting in a loss of 65 mV (68mV and 69 mV) for every
10-fold increase in current density. According to this Eq.3, after deducting kinetic and
ohmic voltage losses, the calculated tx of PANI-Fe, PANI-Fe-NCS and PANI-Fe-
MCS were 348, 78 and 49 mV at 1 A cm−2, respectively. This result indicates the
PANI-Fe-MCS catalyst has less mass transfer resistance than that of PANI-Fe, PANI-
Fe-NCS.
17
Page 18
0 1 2 3 40.0
0.2
0.4
0.6
0.8
1.0
Current density (A cm2)
Cell
volta
ge (V
)
0.0
0.4
0.8
1.2
1.6 Pt/C
Pow
er d
ensi
ty (W
cm
2)
H2-O2
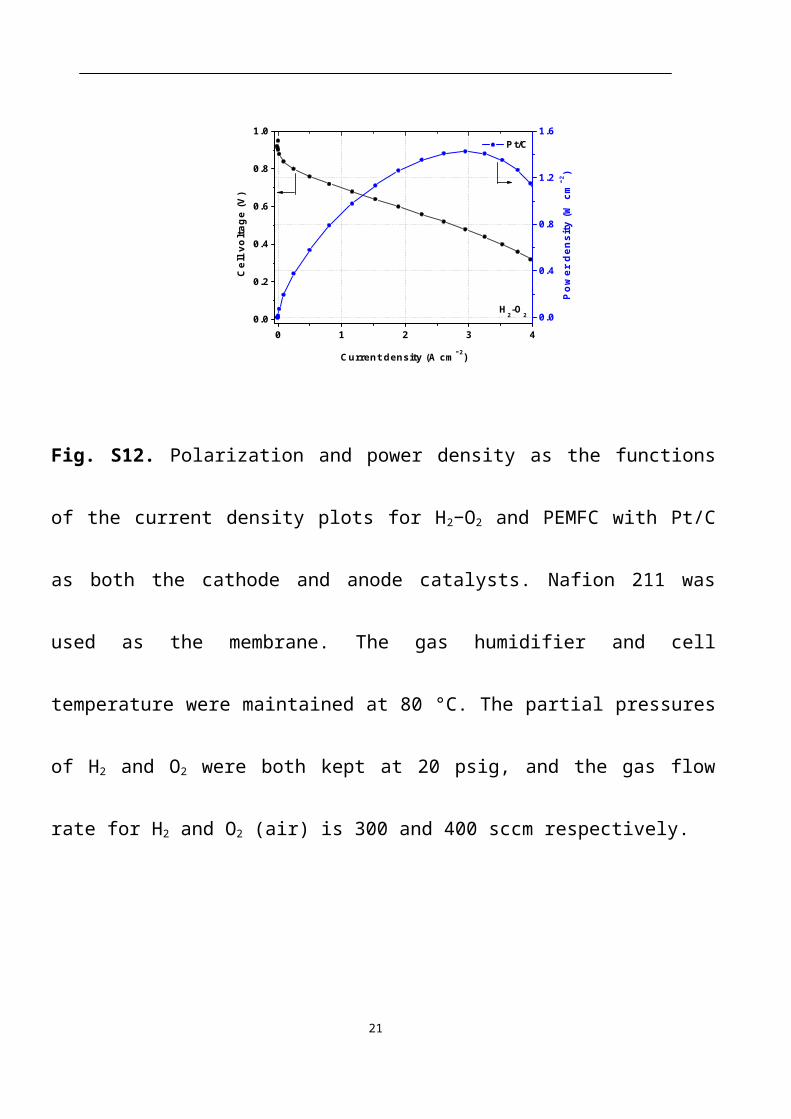
Fig. S12. Polarization and power density as the functions of the current density plots for
H2−O2 and PEMFC with Pt/C as both the cathode and anode catalysts. Nafion 211 was
used as the membrane. The gas humidifier and cell temperature were maintained at 80
°C. The partial pressures of H2 and O2 were both kept at 20 psig, and the gas flow rate
for H2 and O2 (air) is 300 and 400 sccm respectively.
18
Page 19
0.0 0.2 0.4 0.6 0.8 1.0 1.2
0.2
0.4
0.6
0.8
1.0
Current density (A cm2)
Cell
volta
ge (V
) Pt/C 0.0
0.2
0.4
0.6
H2-air
Power density (W
cm2)
(a) (b)
0.0 0.5 1.0 1.5
0.2
0.4
0.6
0.8
1.0
Current density (mA cm2)
Cell
volta
ge (V
)
0.0
0.1
0.2
0.3
0.4
H2air
PANI-Fe PANI-Fe-NCS PANI-Fe-MCS
Pow
er d
ensi
ty (m
W c
m2)
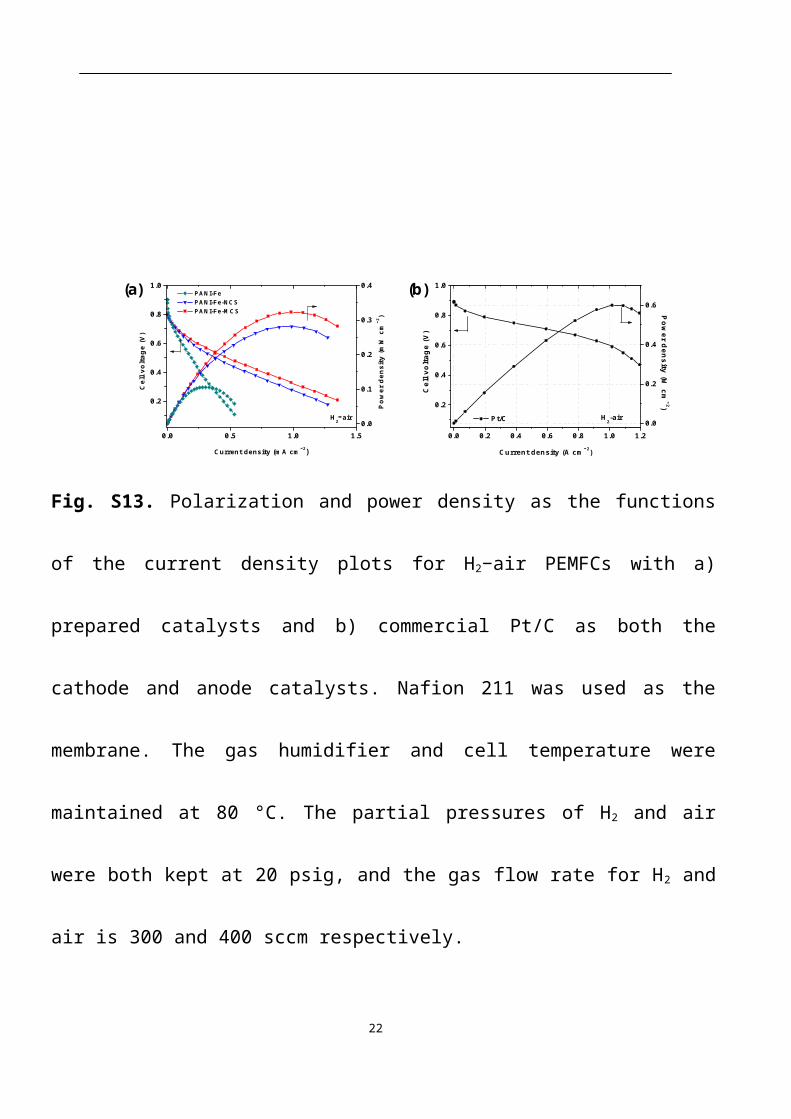
Fig. S13. Polarization and power density as the functions of the current density plots for
H2−air PEMFCs with a) prepared catalysts and b) commercial Pt/C as both the cathode
and anode catalysts. Nafion 211 was used as the membrane. The gas humidifier and cell
temperature were maintained at 80 °C. The partial pressures of H2 and air were both kept
at 20 psig, and the gas flow rate for H2 and air is 300 and 400 sccm respectively.
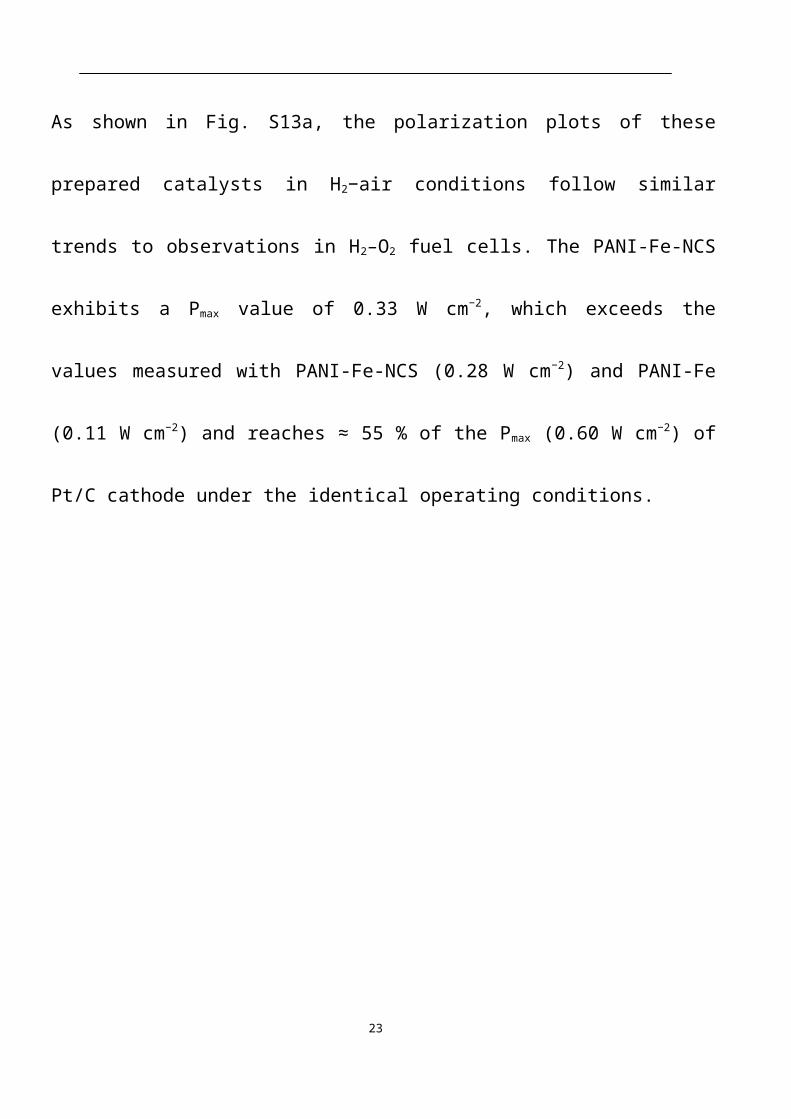
As shown in Fig. S13a, the polarization plots of these prepared catalysts in H2−air
conditions follow similar trends to observations in H2–O2 fuel cells. The PANI-Fe-NCS
exhibits a Pmax value of 0.33 W cm−2, which exceeds the values measured with PANI-Fe-
19
Page 20
NCS (0.28 W cm−2) and PANI-Fe (0.11 W cm−2) and reaches ≈ 55 % of the Pmax (0.60 W
cm−2) of Pt/C cathode under the identical operating conditions.
20
Page 21
Rohm
Rct, cathode
CPE
Fig. S14. Equivalent circuit models used to fit the impedance spectra for PEM fuel
cell through Gamry software.
To interpret these spectra the assumption was made that the anode impedances are
negligible, so the charge transfer resistance (Rct) is only from cathode. A constant
phase element (CPE) is used to represent the double layer capacitance of cathode.[8]
Because these MEAs were fabricated by the same technique with the same
membrane, and the cell components were kept under the same conditions for all tests,
so the variation of the resistances could only from the differences of catalysts powder.
21
Page 22
0 10 20 30 40 500.0
0.1
0.2
0.3
0.4
0.5Cu
rren
t den
sity
(A c
m2
)
Time (hours)
H2air
PANI-Fe-MCS
Fig. S15. Stability test of a PANI-Fe-MCS catalyst at a constant fuel cell voltage of
0.40 V in H2-air. Membrane: Nafion 115; cathode catalyst loading: 4 mg cm−2.
22
Page 23
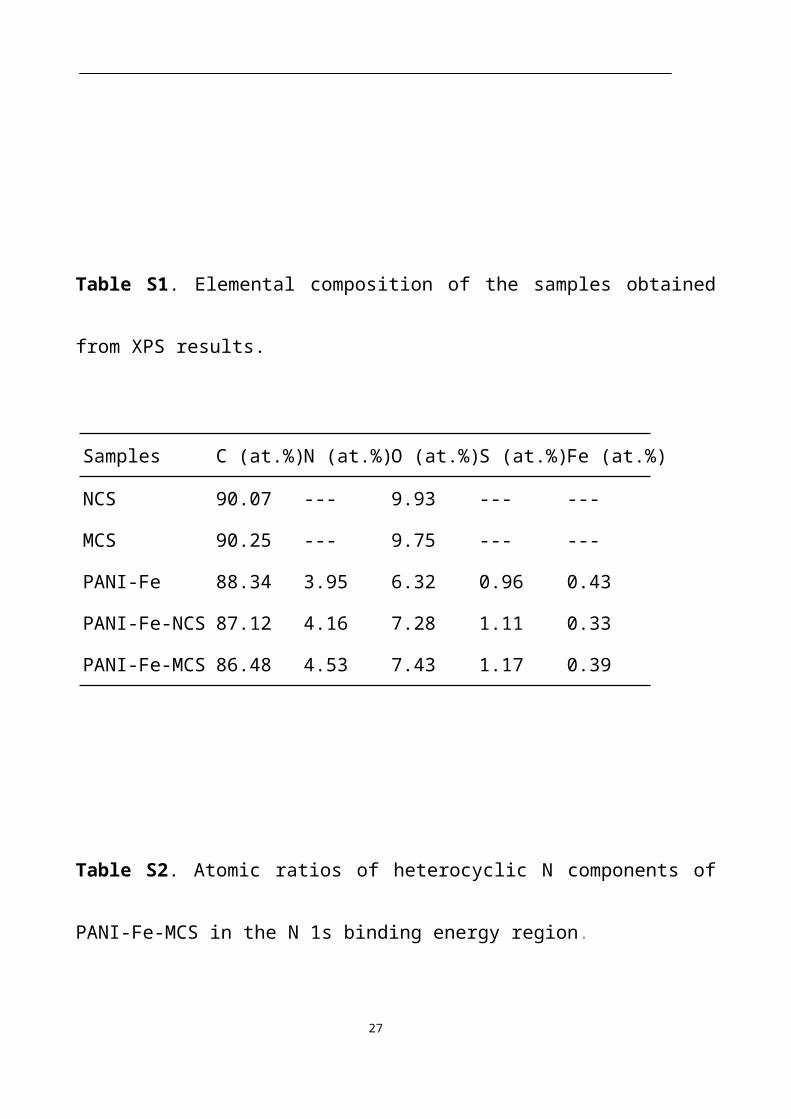
Table S1. Elemental composition of the samples obtained from XPS results.
Samples C (at.%) N (at.%) O (at.%) S (at.%) Fe (at.%)
NCS 90.07 --- 9.93 --- ---
MCS 90.25 --- 9.75 --- ---
PANI-Fe 88.34 3.95 6.32 0.96 0.43
PANI-Fe-NCS 87.12 4.16 7.28 1.11 0.33
PANI-Fe-MCS 86.48 4.53 7.43 1.17 0.39
Table S2. Atomic ratios of heterocyclic N components of PANI-Fe-MCS in the N 1s
binding energy region.
Samples Pyridinic N Fe-N Pyrrolic N Graphitic N Oxidized N
23
Page 24
398.2 eV 399.0 eV 400.1 eV 401.1 eV 403 eV
PANI-Fe-MCS 21.40% 10.60% 11.00% 46.70% 0.34%
24
Page 25
Table S3. Comparison of fuel cell performance of PANI-Fe-MCS materials
with published state-of-the-art M-N-C catalysts
CatalystT cell
(°C)
H2/O2
flow rate
(sccm)
Back
pressur
e
(gauge)
(psig)
MEA
area
(cm−2)
Pmax in H2−O2
fuel cell
(W cm−2)
Referenc
e
PANI-Fe-MCS 80 300/400 20 5 0.83This
work
F/N/C-SCN 80 300/300 15 1 0.94 [9]
Fe/Phen/Z8 80 300/300 15 5 0.91 [10]
Fe/N/CF 80 300/400 22 5 0.90 [11]
PFeTPP-1000 80 300/300 15 5 0.73 [12]
Zn (mIm)2TPIP 80 400/400 15 5 0.62 [13]
Fe/PI-1000-III-
NH3
80 300/300 29 1 0.60 [14]
FeCBDZ 80 100/100 25 5 0.70 [15]
PANI-FeCo-C 80 200/600 26 5 0.55 [16]
NMCC-C-SiO2 75 300/400 30 5 0.45 [17]
25
Page 26
Table S4. Electrochemical characteristics of the cells prepared with different
catalysts.
Samples PANI-Fe
Ω cm2
PANI-Fe-NCS
Ω cm2
PANI-Fe-MCS
Ω cm2
@ 0.60 V Rohm 0.16 0.12 0.11
Rct 0.92 0.22 0.14
26
Page 27
Table S5. Comparison of fuel cell durability of PANI-Fe-MCS materials with
published state-of-the-art M-N-C catalysts
Catalyst
Oxida
nt
Gas
flow
rate
(sccm)
Back
pressu
re
(gauge
)
(psig)
Test
time
(h)
Test
voltage
(V)
Initial
current
loss
(%)
Referen
ce
PANI-Fe-MCSH2/air
H2/O2
300/40
0
300/40
0
20
20
50
50
0.4
0.4 ca. 5 %
ca.23 %
This
work
F/N/C-SCN H2/O2
300/30
015 100 0.5 ca. 37% [9]
PANI-FeCo-C H2/air200/60
033 700
0.4ca. 3% [16]
Fe/Phen/Z8H2/air
H2/O2
300/30
0
300/30
0
29
29
100
100
0.5
0.5 ca. 15 %
ca.40 %[10]
Fe/N/CF H2/air
H2/O2
300/40
0
300/40
29
29
100
100
0.5
0.5
ca. 35 %
ca. 40 %
[11]
27
Page 28
0
Zn
(mIm)2TPIPH2/O2
400/40
015 100
0.5ca. 75% [18]
NMCC-C-SiO2 H2/air300/40
030 100
0.4ca. 21% [17]
References:
[1] Y. Lu, H. Fan, A. Stump, T.L. Ward, T. Rieker, C.J. Brinker, Aerosol-
assisted self-assembly of mesostructured spherical nanoparticles, Nature, 398
(1999) 223-226.
[2] H. Sohn, M.L. Gordin, T. Xu, S. Chen, D. Lv, J. Song, A. Manivannan, D.
Wang, Porous Spherical Carbon/Sulfur Nanocomposites by Aerosol-Assisted
Synthesis: The Effect of Pore Structure and Morphology on Their
Electrochemical Performance As Lithium/Sulfur Battery Cathodes, ACS Appl.
Mater. Interfaces, 6 (2014) 7596-7606.
[3] C.C.L. McCrory, S. Jung, J.C. Peters, T.F. Jaramillo, Benchmarking
Heterogeneous Electrocatalysts for the Oxygen Evolution Reaction, J. Am.
Chem. Soc., 135 (2013) 16977-16987.
[4] H. Hu, B. Guan, B. Xia, X.W. Lou, Designed Formation of
Co3O4/NiCo2O4 Double-Shelled Nanocages with Enhanced Pseudocapacitive
28
Page 29
and Electrocatalytic Properties, J. Am. Chem. Soc., 137 (2015) 5590-5595.
[5] S. Gupta, S. Zhao, O. Ogoke, Y. Lin, H. Xu, G. Wu, Engineering Favorable
Morphology and Structure of Fe-N-C Oxygen-Reduction Catalysts through
Tuning of Nitrogen/Carbon Precursors, ChemSusChem, 10 (2017) 774-785.
[6] H.A. Gasteiger, S.S. Kocha, B. Sompalli, F.T. Wagner, Activity benchmarks
and requirements for Pt, Pt-alloy, and non-Pt oxygen reduction catalysts for
PEMFCs, Appl. Catal., B, 56 (2005) 9-35.
[7] H.Z. Jianlu Zhang, Jinfeng Wu, Jiujun Zhang, PEM Fuel Cell Testing and
Diagnosis, (2013).
[8] X. Yuan, H. Wang, J. Colin Sun, J. Zhang, AC impedance technique in
PEM fuel cell diagnosis—A review, Int. J. Hydrogen Energy, 32 (2007) 4365-
4380.
[9] Y.-C. Wang, Y.-J. Lai, L. Song, Z.-Y. Zhou, J.-G. Liu, Q. Wang, X.-D. Yang,
C. Chen, W. Shi, Y.-P. Zheng, M. Rauf, S.-G. Sun, S-Doping of an Fe/N/C
ORR Catalyst for Polymer Electrolyte Membrane Fuel Cells with High Power
Density, Angew. Chem. Int. Ed., 54 (2015) 9907–9910.
[10] E. Proietti, F. Jaouen, M. Lefèvre, N. Larouche, J. Tian, J. Herranz, J.-P.
Dodelet, Iron-based cathode catalyst with enhanced power density in polymer
electrolyte membrane fuel cells, Nat Commun, 2 (2011) 416.
[11] J. Shui, C. Chen, L. Grabstanowicz, D. Zhao, D.-J. Liu, Highly efficient
nonprecious metal catalyst prepared with metal–organic framework in a
continuous carbon nanofibrous network, Proc. Natl. Acad. Sci. U. S. A., 112
29
Page 30
(2015) 10629-10634.
[12] S. Yuan, J.-L. Shui, L. Grabstanowicz, C. Chen, S. Commet, B. Reprogle,
T. Xu, L. Yu, D.-J. Liu, A Highly Active and Support-Free Oxygen Reduction
Catalyst Prepared from Ultrahigh-Surface-Area Porous Polyporphyrin, Angew.
Chem. Int. Ed., 52 (2013) 8349-8353.
[13] C. Zhang, Y.-C. Wang, B. An, R. Huang, C. Wang, Z. Zhou, W. Lin,
Networking Pyrolyzed Zeolitic Imidazolate Frameworks by Carbon Nanotubes
Improves Conductivity and Enhances Oxygen-Reduction Performance in
Polymer-Electrolyte-Membrane Fuel Cells, Adv. Mater., (2016) 1604556.
[14] Y. Nabae, Y. Kuang, M. Chokai, T. Ichihara, A. Isoda, T. Hayakawa, T.
Aoki, High performance Pt-free cathode catalysts for polymer electrolyte
membrane fuel cells prepared from widely available chemicals, Journal of
Materials Chemistry A, 2 (2014) 11561-11564.
[15] A. Serov, K. Artyushkova, P. Atanassov, Fe-N-C Oxygen Reduction Fuel
Cell Catalyst Derived from Carbendazim: Synthesis, Structure, and Reactivity,
Adv. Energy Mater., 4 (2014) 1301735.
[16] G. Wu, K.L. More, C.M. Johnston, P. Zelenay, High-Performance
Electrocatalysts for Oxygen Reduction Derived from Polyaniline, Iron, and
Cobalt, Science, 332 (2011) 443-447.
[17] G. Liu, X. Li, P. Ganesan, B.N. Popov, Studies of oxygen reduction
reaction active sites and stability of nitrogen-modified carbon composite
catalysts for PEM fuel cells, Electrochim. Acta, 55 (2010) 2853-2858.
30
Page 31
[18] D. Zhao, J.-L. Shui, L.R. Grabstanowicz, C. Chen, S.M. Commet, T. Xu,
J. Lu, D.-J. Liu, Highly Efficient Non-Precious Metal Electrocatalysts Prepared
from One-Pot Synthesized Zeolitic Imidazolate Frameworks, Adv. Mater., 26
(2014) 1093-1097.
31