Page 1
ARSENIC SPECIATION AND EVALUATION OF AN ADSORPTION MEDIA IN RUPANDEHI AND
NAWALPARASI DISTRICTS OF NEPAL
by
Tommy Ka Kit Ngai
B.A.Sc. Chemical and Environmental Engineering University of Toronto 2001
Submitted to the Department of Civil and Environmental Engineering in Partial Fulfillment of the Requirements for the Degree of
MASTER OF ENGINEERING IN CIVIL AND ENVIRONMENTAL ENGINEERING
at the MASSACHUSETTS INSTITUTE OF TECHNOLOGY
June 2002
© 2002 Tommy K.K. Ngai. All Rights Reserved.
The author hereby grants to MIT permission to reproduce and to distribute publicly paper
and electronic copies of this thesis document in whole or in part.
Signature of Author:
Tommy Ka Kit Ngai Department of Civil and Environmental Engineering
May 15, 2002 Certified by:
Susan E. Murcott Lecturer, Department of Civil and Environmental Engineering
Thesis Supervisor Accepted by:
Oral Buyukozturk Chairman, Departmental Committee on Graduate Studies
Page 2
ARSENIC SPECIATION AND EVALUATION OF AN ADSORPTION MEDIA IN RUPANDEHI AND
NAWALPARASI DISTRICTS OF NEPAL
by
Tommy Ka Kit Ngai
Submitted to the Department of Civil and Environmental Engineering on May 15, 2002 in partial fulfillment of the requirements for the degree of
Master of Engineering in Civil and Environmental Engineering
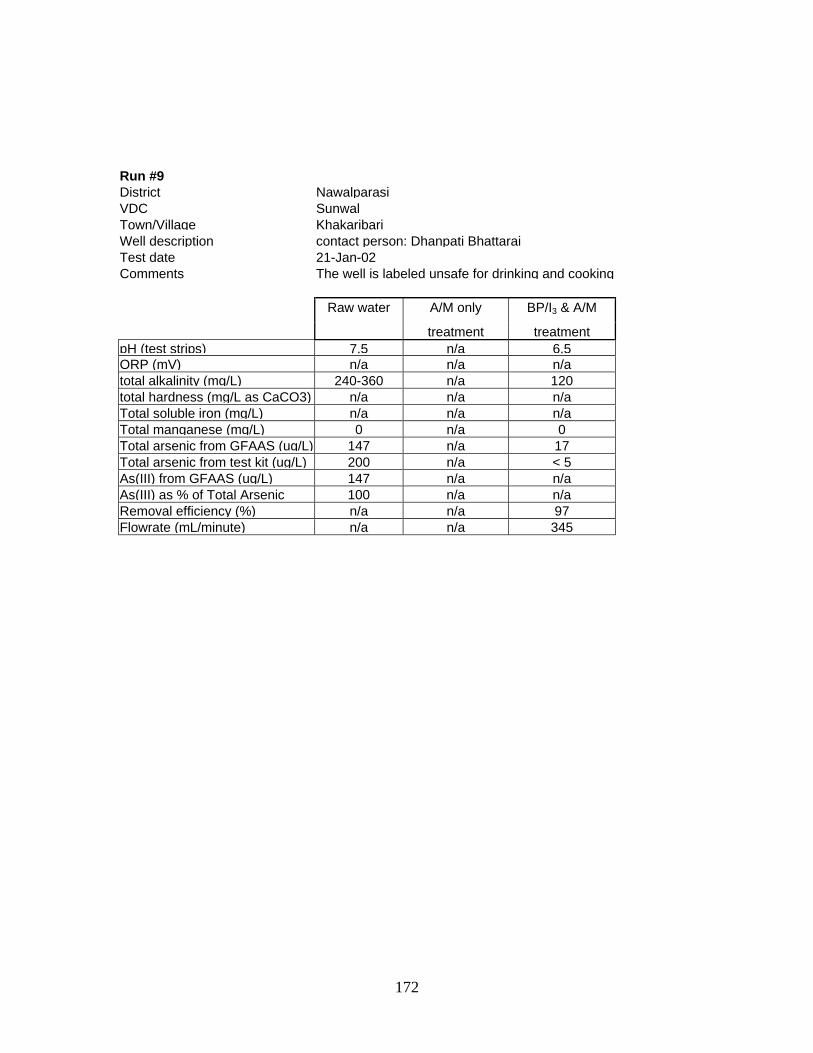
ABSTRACT A study of arsenic speciation in the drinking water of Nepal and an evaluation of an arsenic adsorption media was conducted as part of the 2001-2002 Massachusetts Institute of Technology Nepal Water Project. Over 40 tubewell water samples were collected in the Nawalparasi and Rupandehi Districts of Nepal where arsenic contamination is known to occur. Arsenic (III) and arsenic (V) in the raw water were separated using Bio-Rad AG1-X8 strong ion exchange resin. Arsenic concentration was analyzed in Nepal using Industrial Test Systems Quick Arsenic Test Kit. Samples were also preserved and brought back to MIT for analysis using Graphite Furnace Atomic Absorption Spectrometry. Results showed that arsenic (III) is the dominant inorganic arsenic species. On average, 79% of all inorganic arsenic is in the (+III) oxidation state, while the rest is in (+V) oxidation state. There is a strong correlation between arsenic speciation and the oxidation reductive potential (ORP) as measured by a Digi-Sense Digital pH/mV/ORP Meter. An activated alumina manganese oxide (A/M) adsorption media was tested at 9 locations with total arsenic in the raw water ranging from 147 µg/L to 863 µg/L. In all 9 runs, the treated water contained arsenic below detection limit (<5 µg/L). Based on these promising results, further evaluation of the A/M media on its technical, social, and economic aspects is recommended. Thesis Supervisor: Susan Murcott, Title: Lecturer, Department of Civil and Environmental Engineering
Page 3
3
Acknowledgements I would like to thank my thesis advisor, Ms. Susan Murcott, for coordinating this amazing project. Her genuine counsel reaches far beyond the project scope, to my personal and professional life as well. My work with her for the past year has been very positive and rewarding. I would also like to thank Dr. Eric Adams and the Department of Civil and Environmental Engineering for making this project possible. Thanks to the Nepal team, including Jeff Hwang, Barika Poole, Chian Siong Low, Yong Xuan Gao, Luca Morganti, Heather Lukacs, and Hannah Sullivan, for the teamwork in making the trip unforgettable. Special thanks to the people I met in Nepal, including Ulla and Kari for their hospitality at Butwal, Kalawati for arranging my field work, Umesh and Bhim for their help in sample collection, Devi and Dhan Bhahadur for their wonderful meals. Also thanks to Roshan and Arinita at ENPHO for organizing my Parasi work, and Upendra for making my stay comfortable. I would like to thank Bhikkhu for an enjoyable Lumbini visit. I would like to thank Professor Harry Hemond for the use of his laboratory GFAAS, and Jenny Jay for her patience in teaching me to properly use the instrument. Thanks to my friends I met here in Boston for their support throughout the year, including my roommates, brothers and sisters at HKSBS and BCEC, and my fellow classmates. My life has been enriched by them. Also thanks to my loving family, who are always behind me. Finally, thank my Lord, Jesus Christ for his perfect guidance through tough times. May His will lead me in my future.
Page 4
4
TABLE OF CONTENTS
Abstract ............................................................................................................................... 2
Table of Contents................................................................................................................ 4
List of Figures ..................................................................................................................... 8
List of Tables .................................................................................................................... 10
Chapter 1 Introduction................................................................................................... 11
1.1 Nepal Water Project Overview ........................................................................ 11
1.2 Project Motivation ............................................................................................ 12
1.3 Project Goal ...................................................................................................... 12
Chapter 2 Background............................................................................................... 14
2.1 Arsenic in the Environment .............................................................................. 14
2.2 Arsenic Chemistry ............................................................................................ 14
2.2.1 Acid-base Chemistry................................................................................. 15
2.2.2 Reduction-Oxidation (redox) Chemistry .................................................. 17
2.3 Arsenic Situation in South Asia........................................................................ 19
2.4 Arsenic Situation in Nepal ................................................................................ 21
2.5 Origins of Arsenic............................................................................................. 22
2.5.1 Pyrite Oxidation Hypothesis ..................................................................... 23
2.5.2 Iron Oxyhydroxide Reduction Hypothesis ............................................... 23
2.6 Arsenic Treatment Technologies ...................................................................... 24
2.7 Alternative Water Source.................................................................................. 25
Chapter 3 Health Effects................................................................................................ 26
3.1 Route of Entry................................................................................................... 26
3.2 Acute Toxicity of Arsenic (III) and (V)............................................................ 26
3.3 Chronic Toxicity of Arsenic (III) and (V) ........................................................ 27
3.3.1 Dermal....................................................................................................... 27
3.3.2 Vascular Effects ........................................................................................ 28
3.3.3 Cancer ....................................................................................................... 29
Chapter 4 Analytic Method ........................................................................................... 30
4.1 Total Inorganic Arsenic .................................................................................... 30
Page 5
5
4.1.1 Industrial Test Systems Inc. Arsenic CheckTM Field Test Kit 481196 ..... 31
4.1.2 Graphite Furnace Atomic Adsorption Spectrometry (GFAAS) ............... 33
4.2 Arsenic Speciation ............................................................................................ 34
4.2.1 Bio-Rad Laboratory’s AG1-X8 Ion-exchange Resin ............................... 34
4.3 pH...................................................................................................................... 36
4.3.1 Cole Parmer Digi-Sense Digital pH/mV/ORP Meter EW-5938-50 ......... 36
4.3.2 Industrial Test Systems pH Test Strips 4800005...................................... 37
4.3 Oxidation-Reduction Potential (ORP) .............................................................. 38
4.3.1 Cole Parmer Digi-Sense Digital pH/mV/ORP Meter EW-5938-50 ......... 38
4.4 Total Alkalinity................................................................................................. 38
4.4.1 Industrial Test Systems Total Alkalinity Test Strips ................................ 39
4.5 Total Hardness as CaCO3.................................................................................. 39
4.5.1 WaterWorksTM Total Hardness (as calcium carbonate) Test Strips ....... 40
4.6 Total Soluble Iron ............................................................................................. 40
4.6.1 CHEMetsTM Iron Kit K-6010.................................................................... 40
4.7 Manganese ........................................................................................................ 41
4.7.1 CHEMetsTM Manganese Kit K-6502........................................................ 41
Chapter 5 Arsenic Removal Technology......................................................................... 43
5.1 Poly-Benzyl Pyridinium Tri-Iodide (BP/I3)...................................................... 43
5.2 Activated Alumina Manganese Oxide (A/M)................................................... 47
5.3 Apparatus Setup ................................................................................................ 49
5.3.1 A/M Only System ..................................................................................... 49
5.3.2 BP/I3 & A/M System ............................................................................... 49
Chapter 6 Experiment Setup and Procedures ................................................................ 52
6.1 Arsenic Removal Technology Evaluation ........................................................ 52
6.1.1 Apparatus Setup ........................................................................................ 52
6.1.2 Field Experiment....................................................................................... 52
6.2 Arsenic Speciation of Tubewell Water ............................................................. 55
6.2.1 Apparatus Setup ........................................................................................ 55
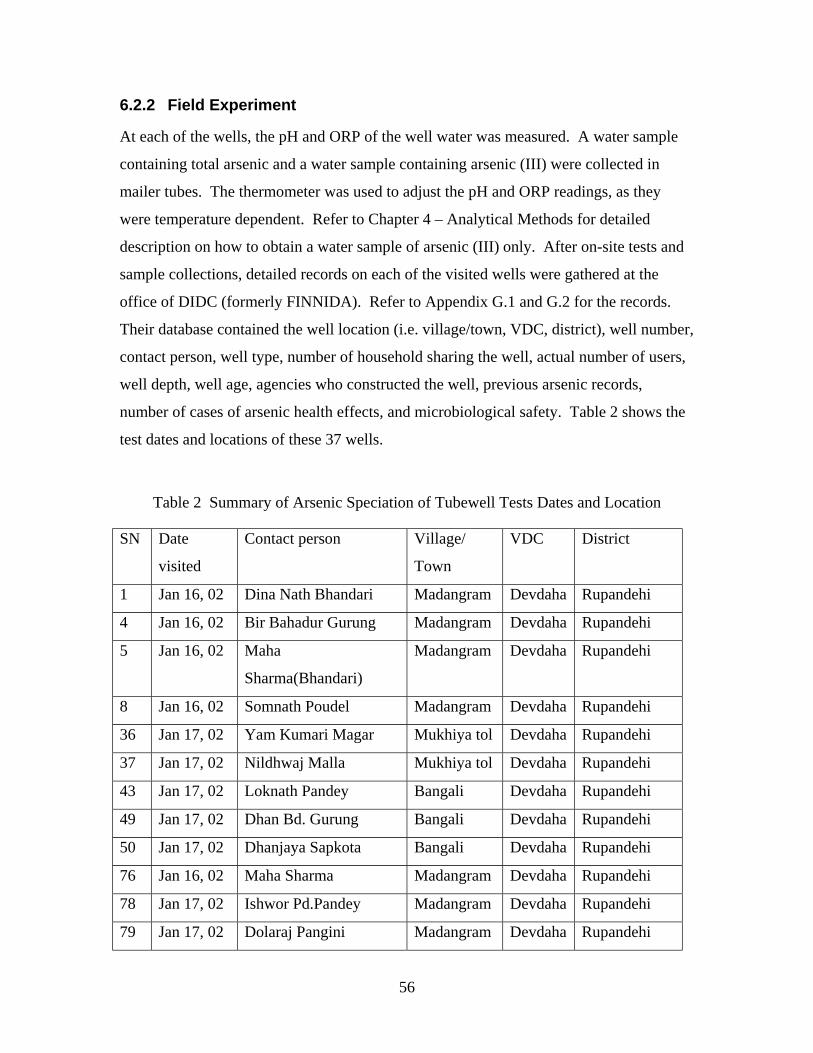
6.2.2 Field Experiment....................................................................................... 56
6.3 Arsenic Oxidation Kinetics............................................................................... 58
Page 6
6
6.3.1 Apparatus Setup ........................................................................................ 58
6.3.2 Field Experiment....................................................................................... 58
Chapter 7 Results and Discussions................................................................................ 60
7.1 Arsenic Removal Technology Evalution .......................................................... 60
7.1.1 Arsenic Removal Results.......................................................................... 60
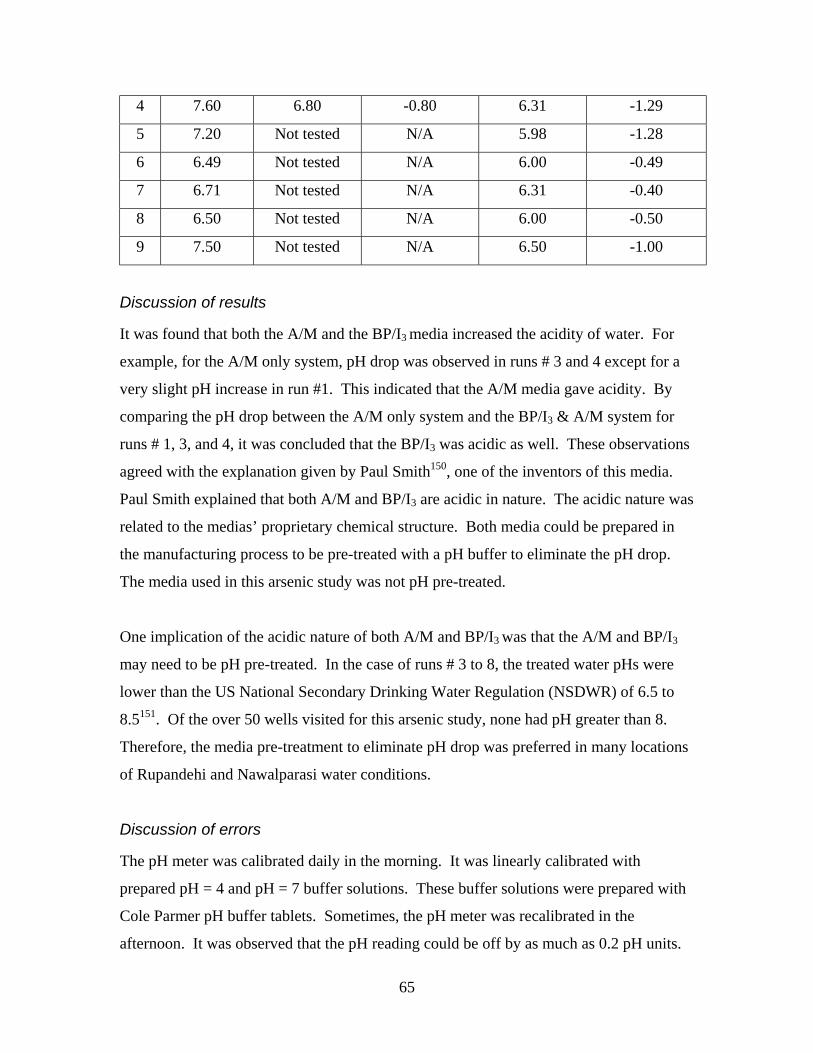
7.1.2 pH Results................................................................................................. 64
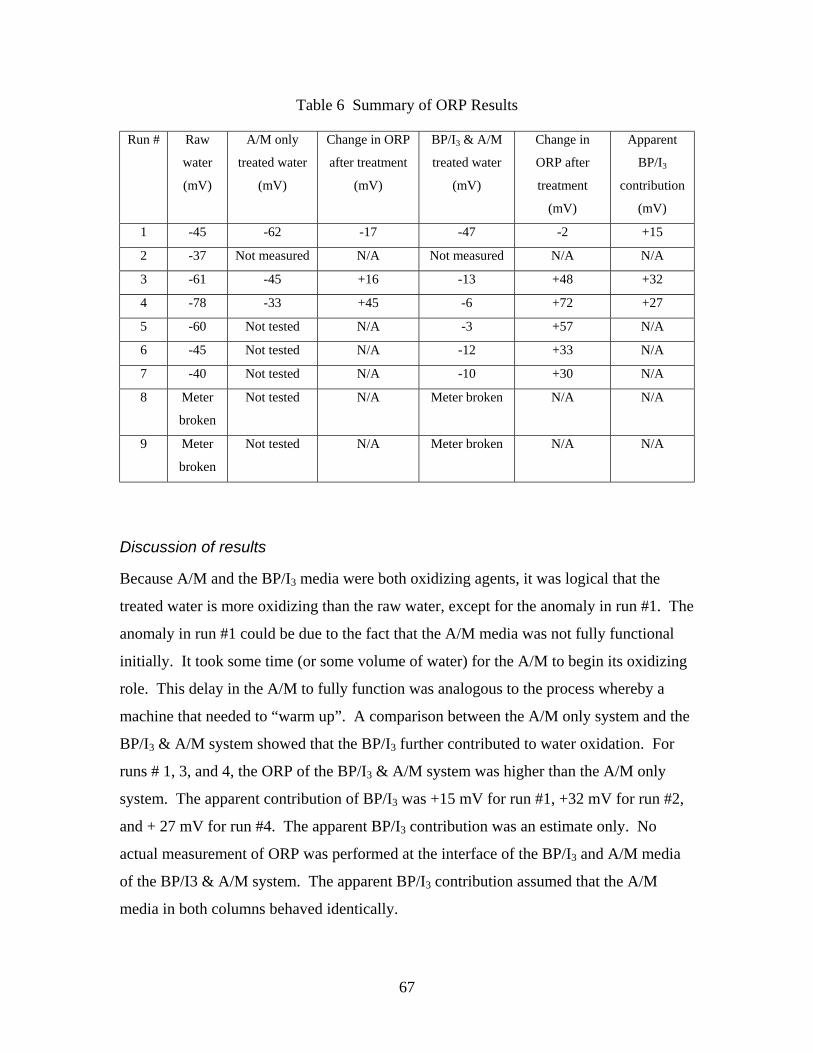
7.1.3 Oxidation-Reduction Potential (ORP) Results ......................................... 66
7.1.4 Total Alkalinity Results ............................................................................ 68
7.1.5 Hardness Results....................................................................................... 70
7.1.6 Total Soluble Iron Results ........................................................................ 71
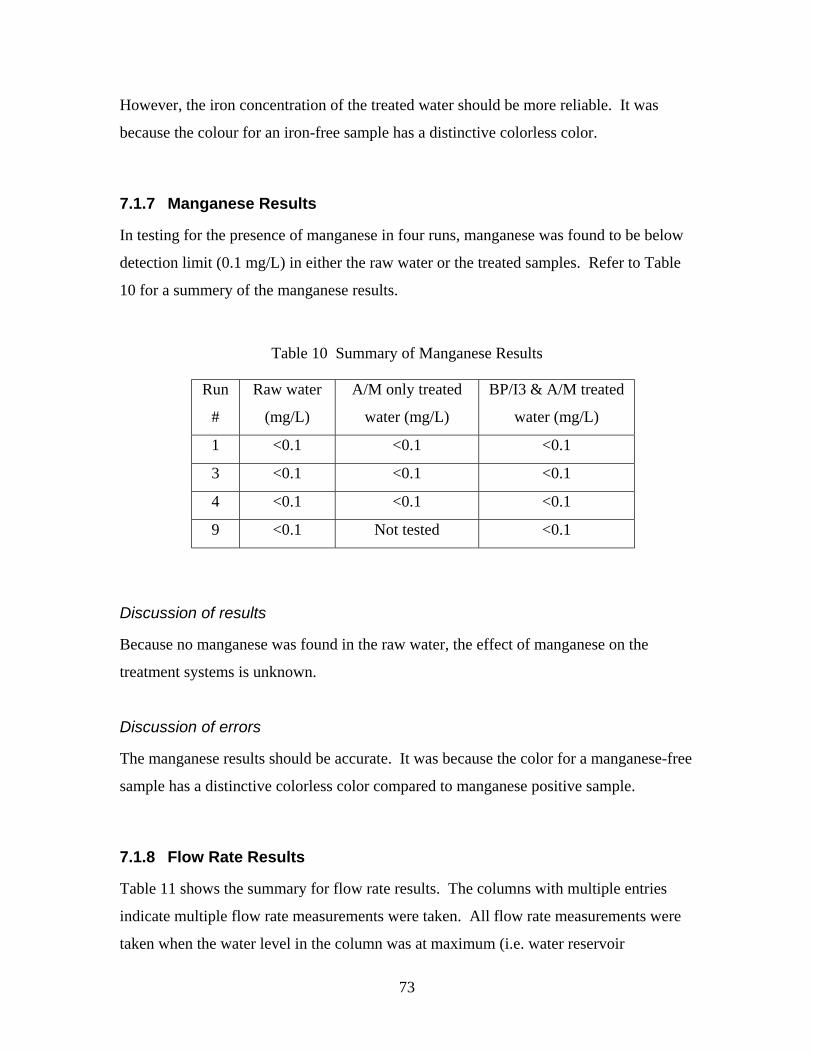
7.1.7 Manganese Results.................................................................................... 73
7.1.8 Flow Rate Results ..................................................................................... 73
7.1.9 Summary of Important Results on the Arsenic Removal Technology ..... 75
7.2 Arsenic Speciation in Tubewell Water ............................................................. 77
7.2.1 Total Arsenic and Arsenic Speciation....................................................... 77
7.2.2 Correlation with pH .................................................................................. 83
7.2.3 Correlation with ORP ............................................................................... 84
7.2.4 Correlation with Well Depth..................................................................... 86
7.2.5 Correlation with Number of Users............................................................ 90
7.2.6 Correlation with Number of Households Sharing the Well...................... 91
7.2.7 Summary of Important Results on Arsenic Speciation in Tubewell......... 93
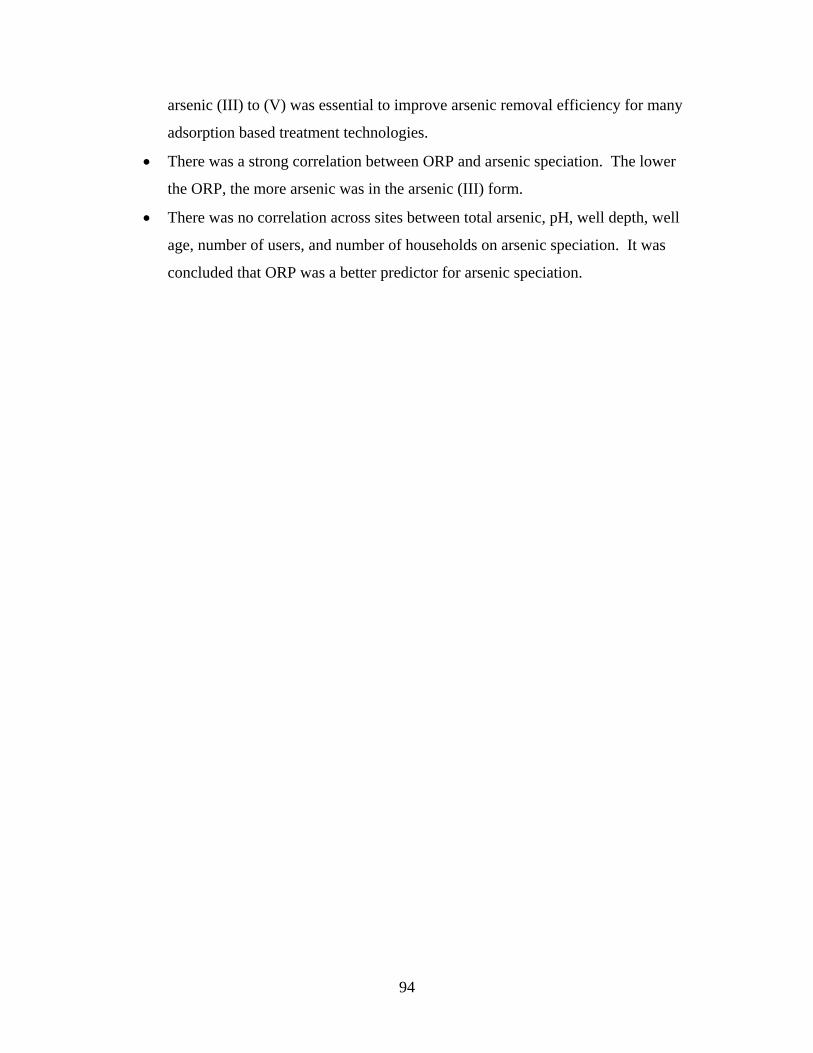
7.3 Arsenic Oxidation Kinetics.............................................................................. 95
7.3.1 Total arsenic and speciation results .......................................................... 95
7.3.1 pH and ORP results................................................................................... 98
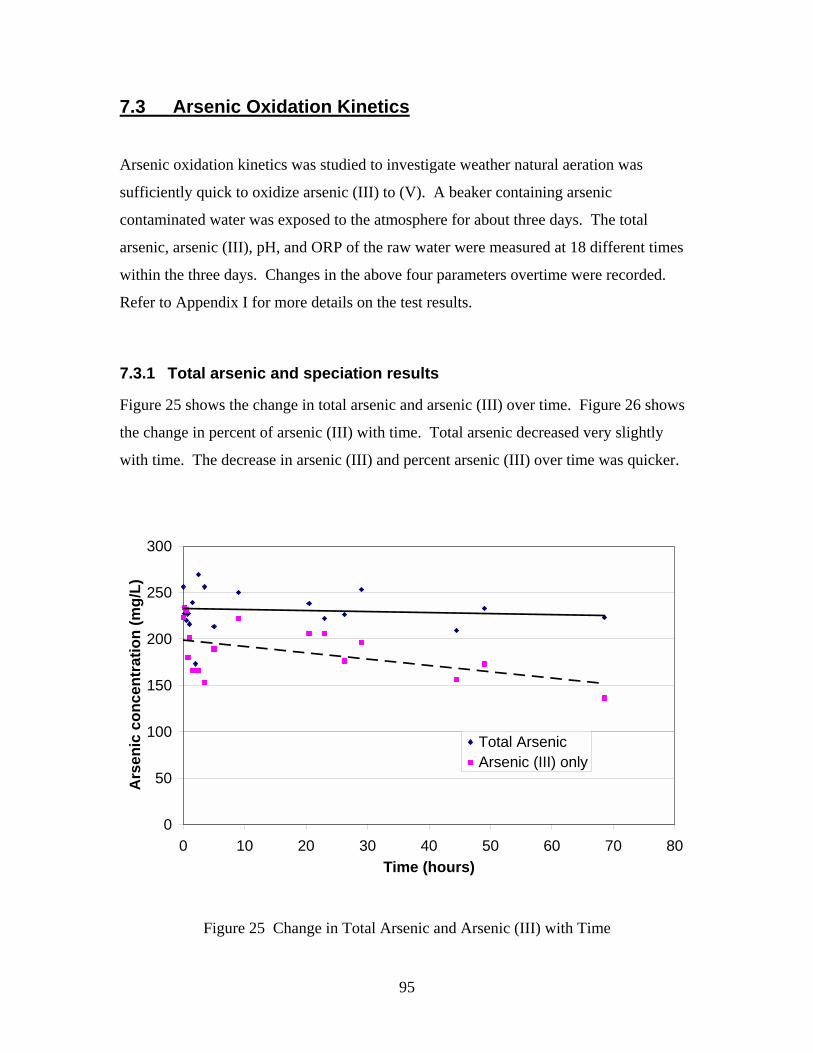
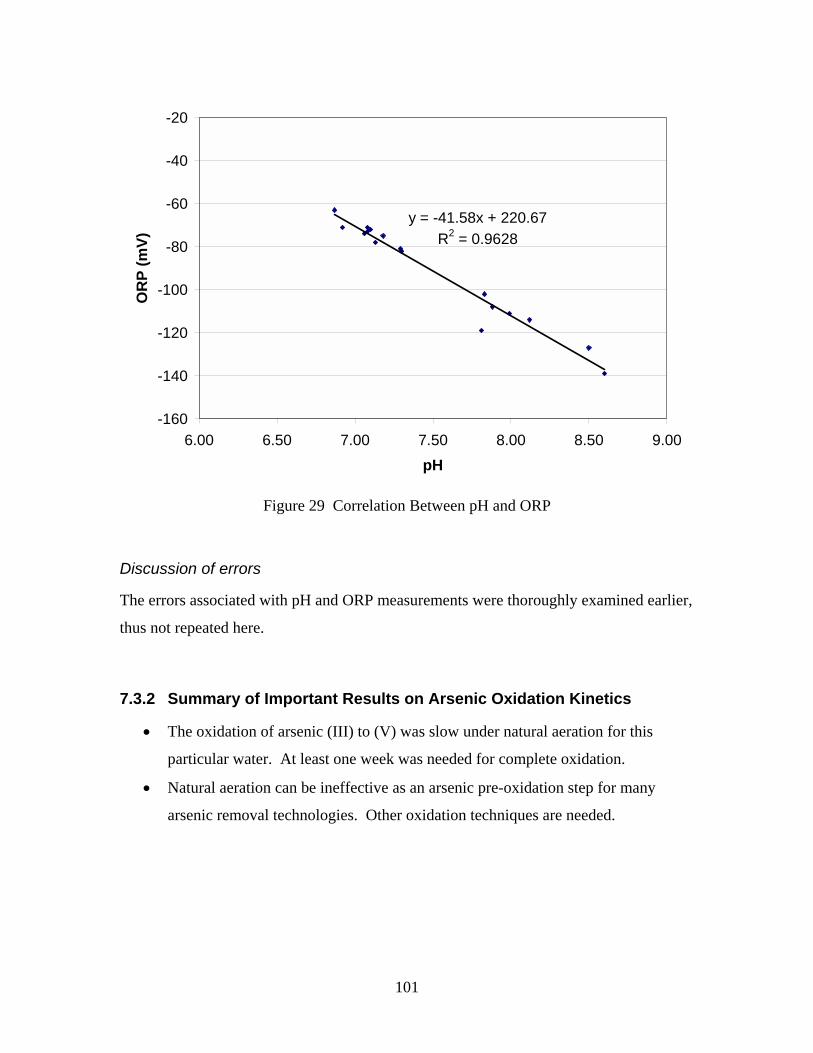
7.3.2 Summary of Important Results on Arsenic Oxidation Kinetics ............. 101
Chapter 8 Conclusions and Recommendations ........................................................... 102
8.1 Arsenic Removal Technology Evaluation ...................................................... 102
8.2 Arsenic Speciation in Tubewell Water ........................................................... 103
Appendix A Aquatic Treatment Systems, Inc. ............................................................ 105
A.1 Company Profile ............................................................................................. 105
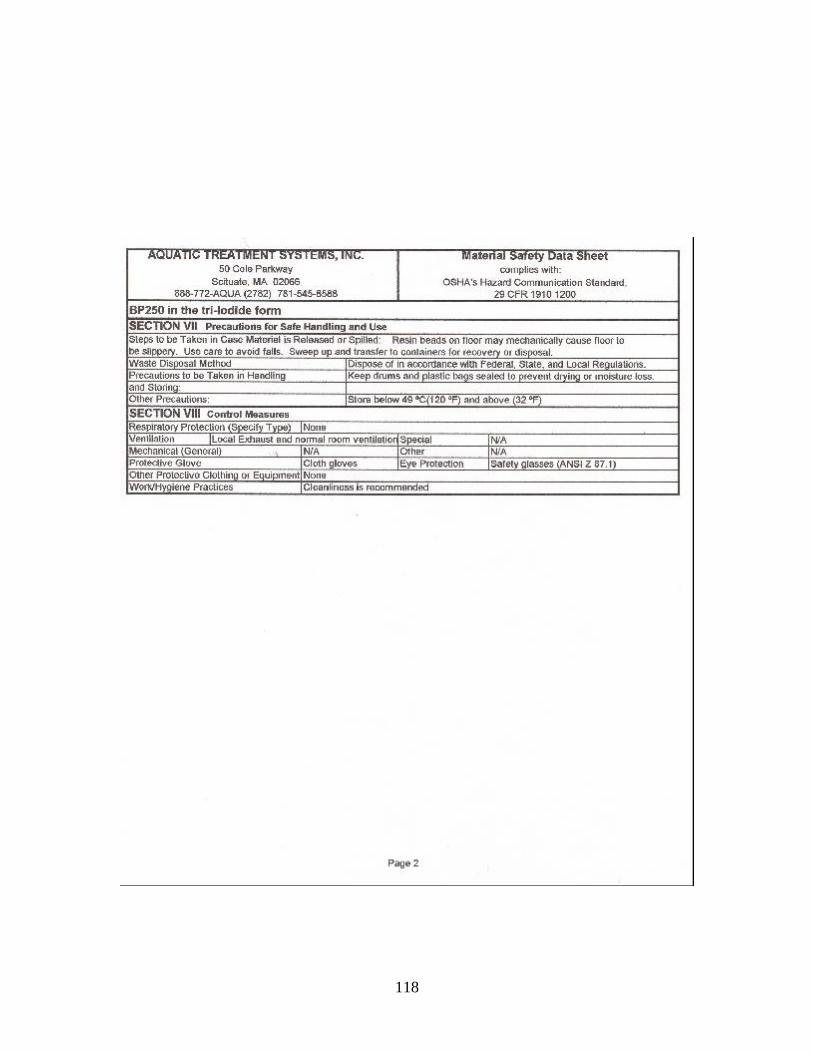
A.2 MSDS.............................................................................................................. 116
Page 7
7
A.2 MSDS.............................................................................................................. 117
Appendix B Parasi Survival Guide ............................................................................. 121
Appendix C Trip Schedule and Expense..................................................................... 124
C.1 Schedule.......................................................................................................... 124
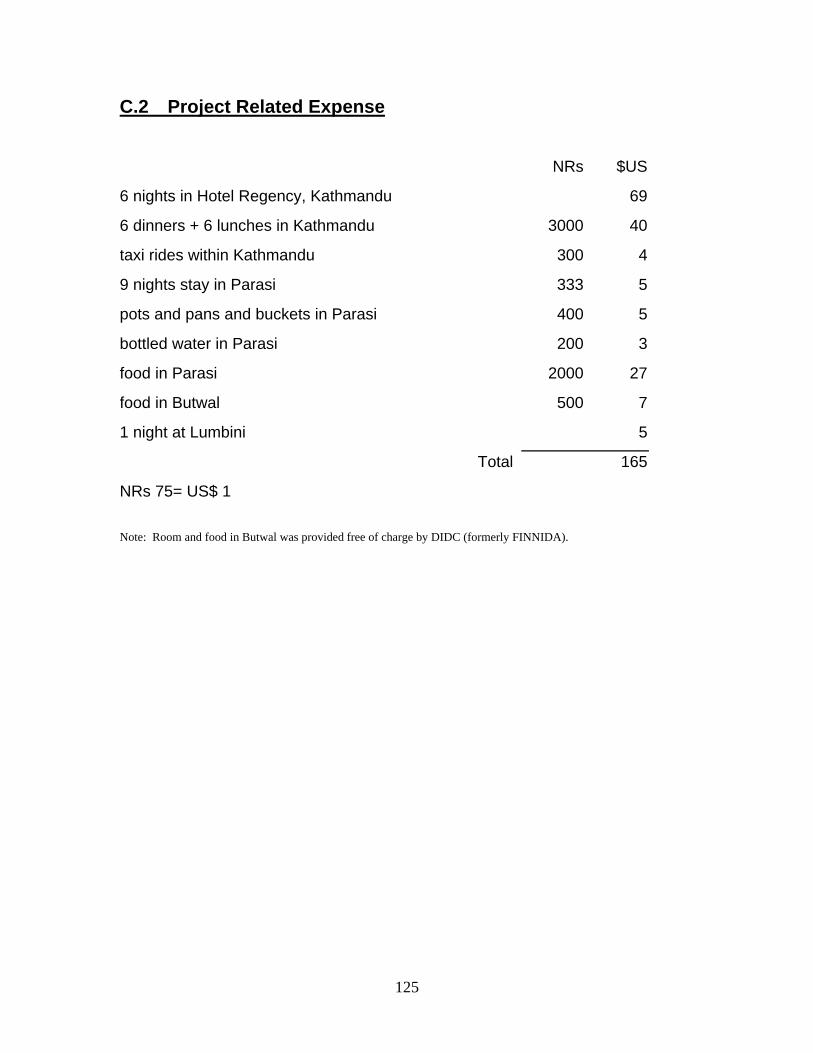
C.2 Project Related Expense ................................................................................. 125
Appendix D Contacts in Nepal.................................................................................... 126
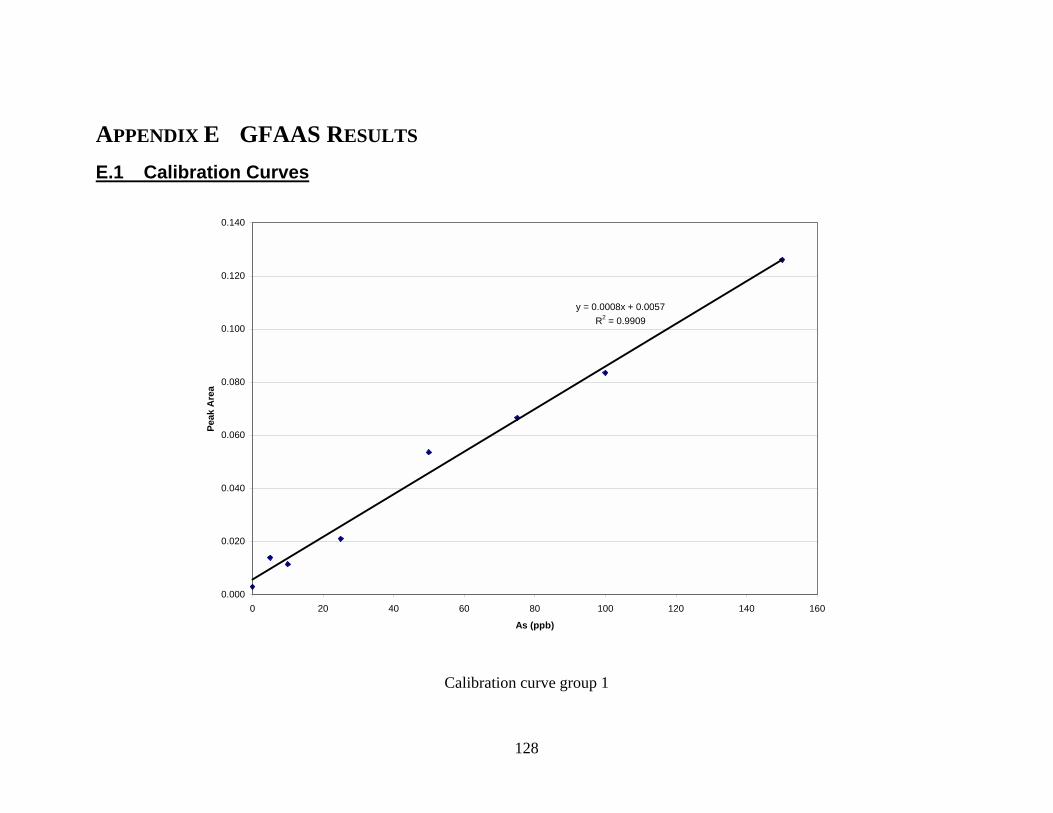
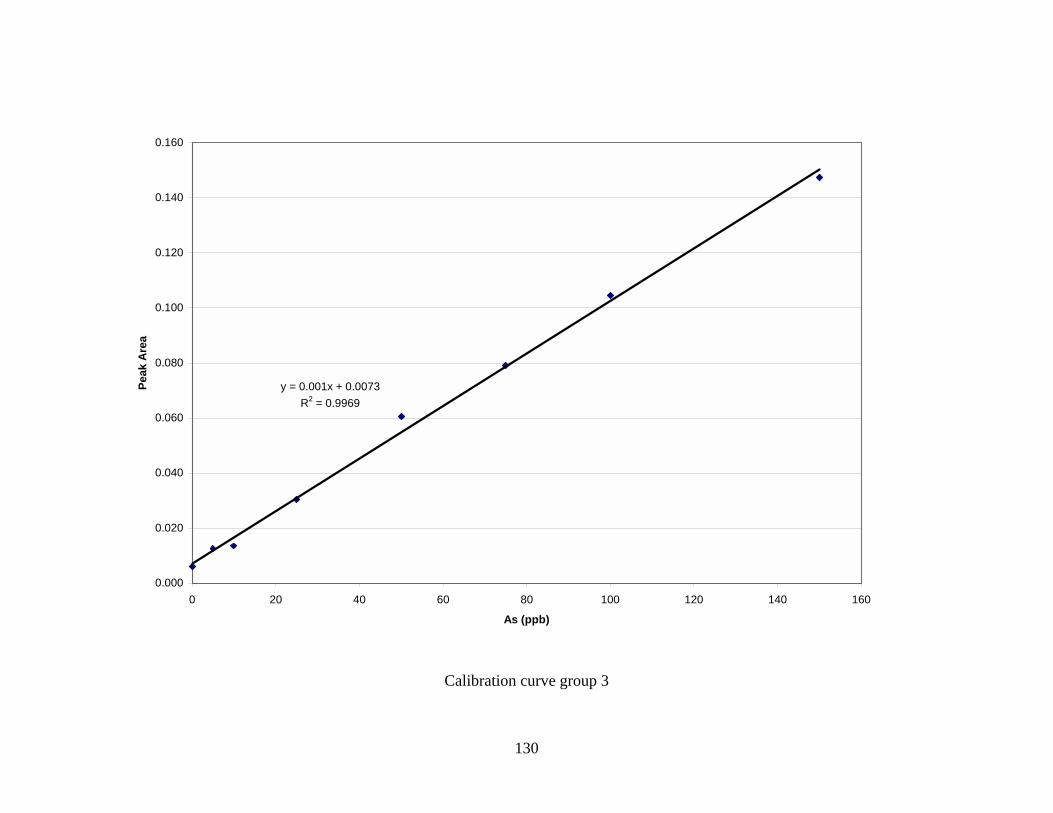
Appendix E GFAAS Results....................................................................................... 128
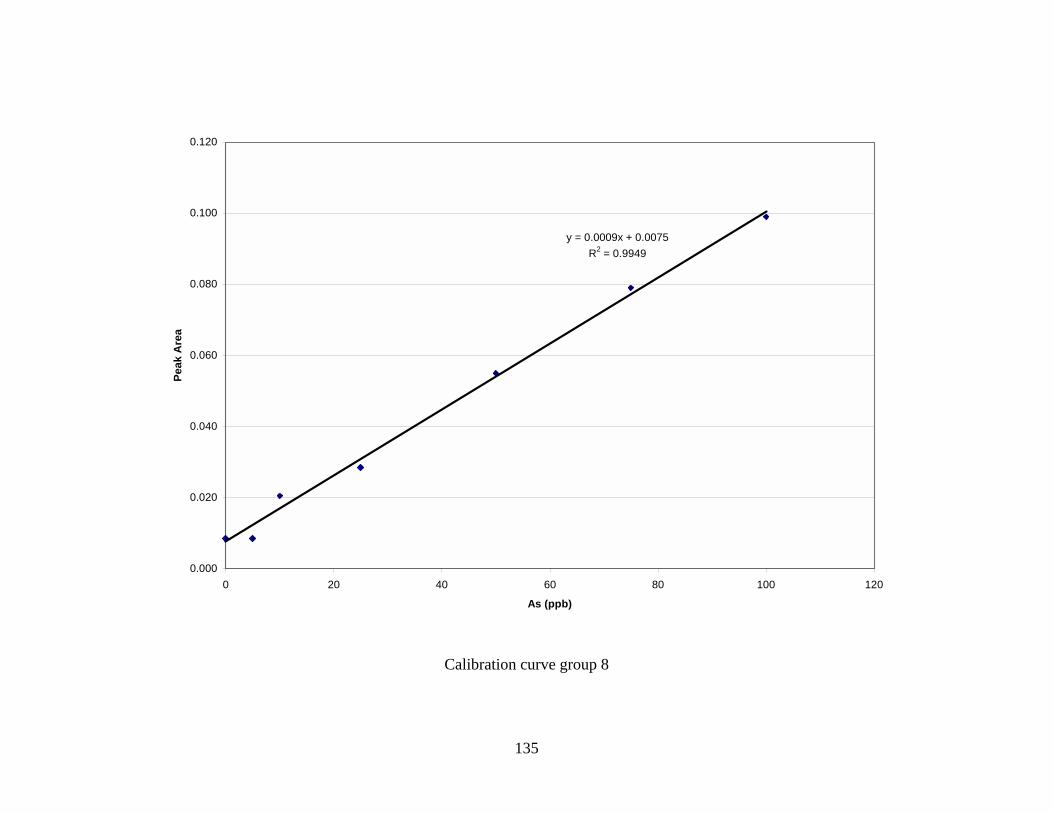
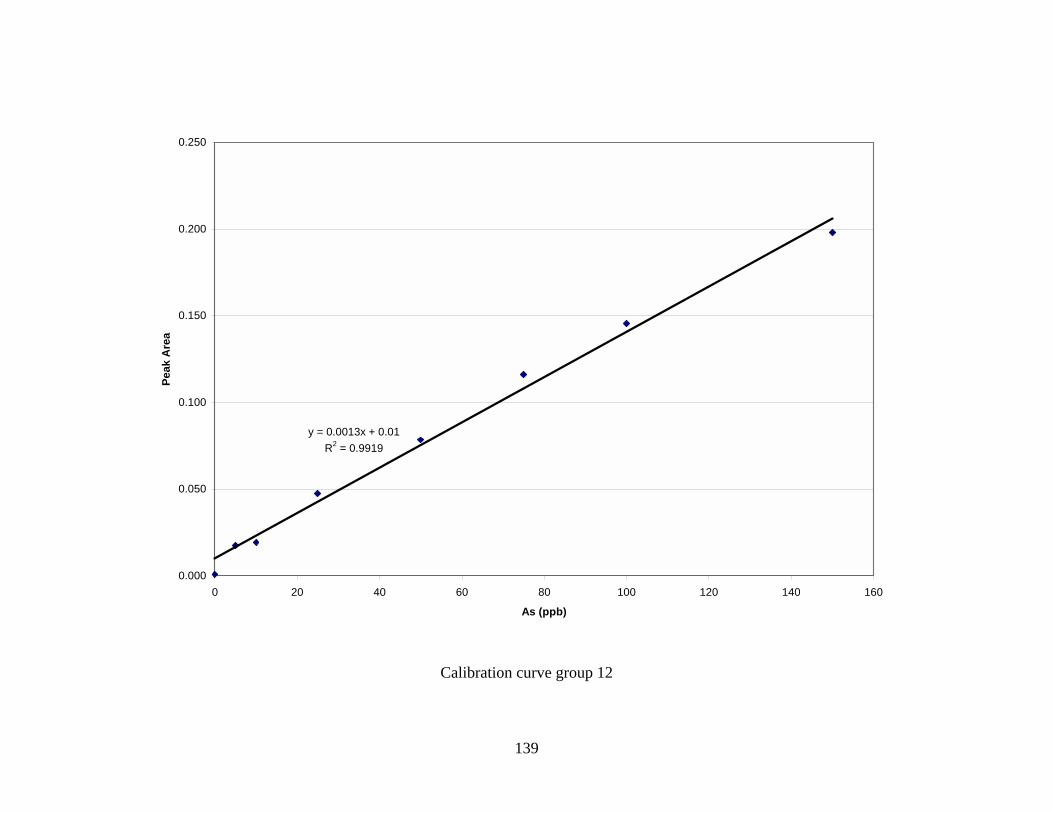
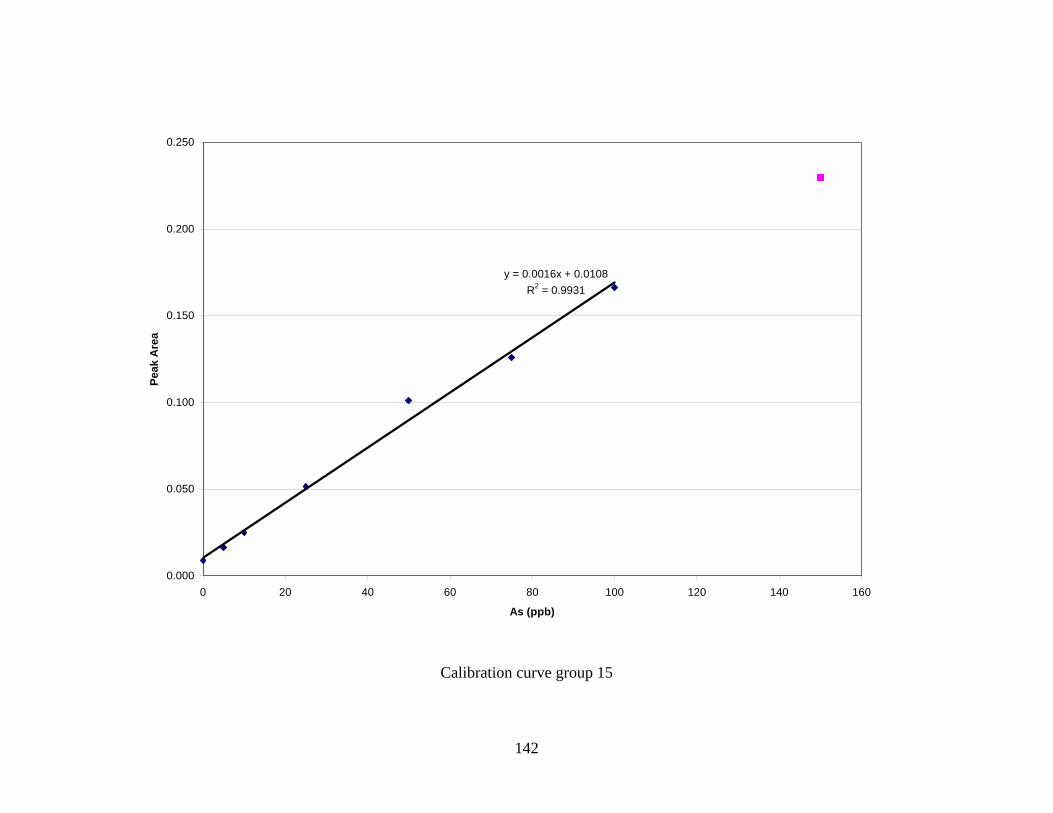
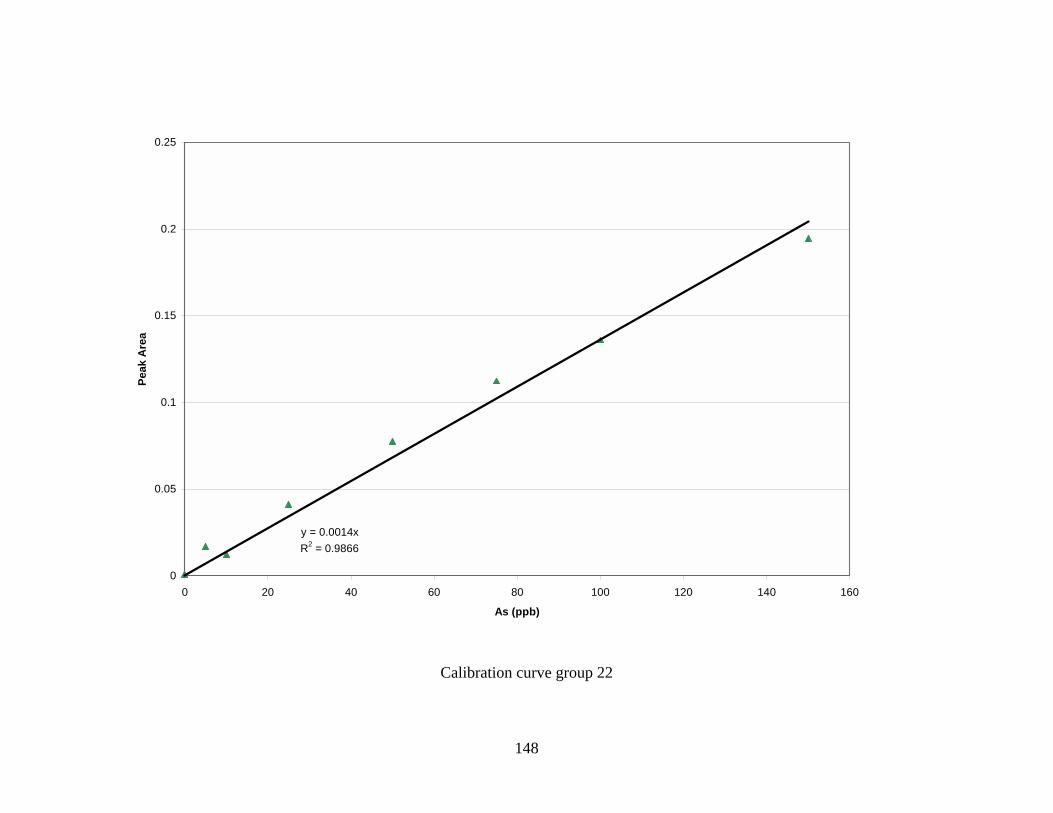
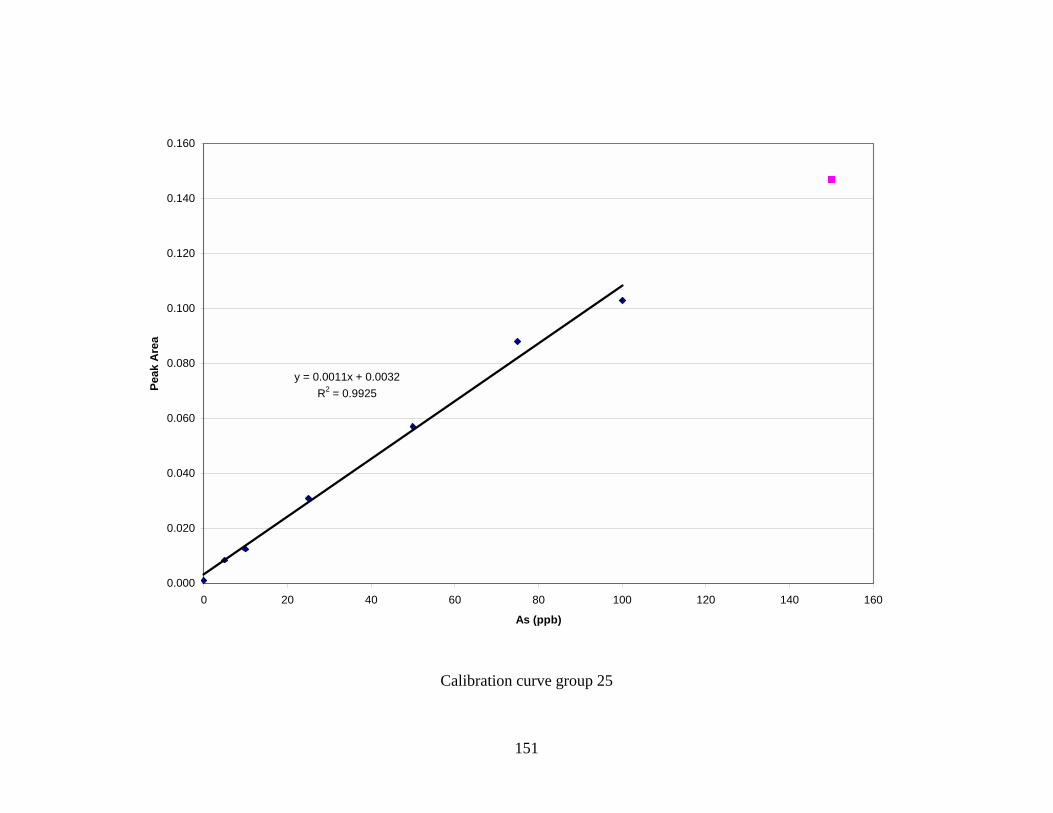
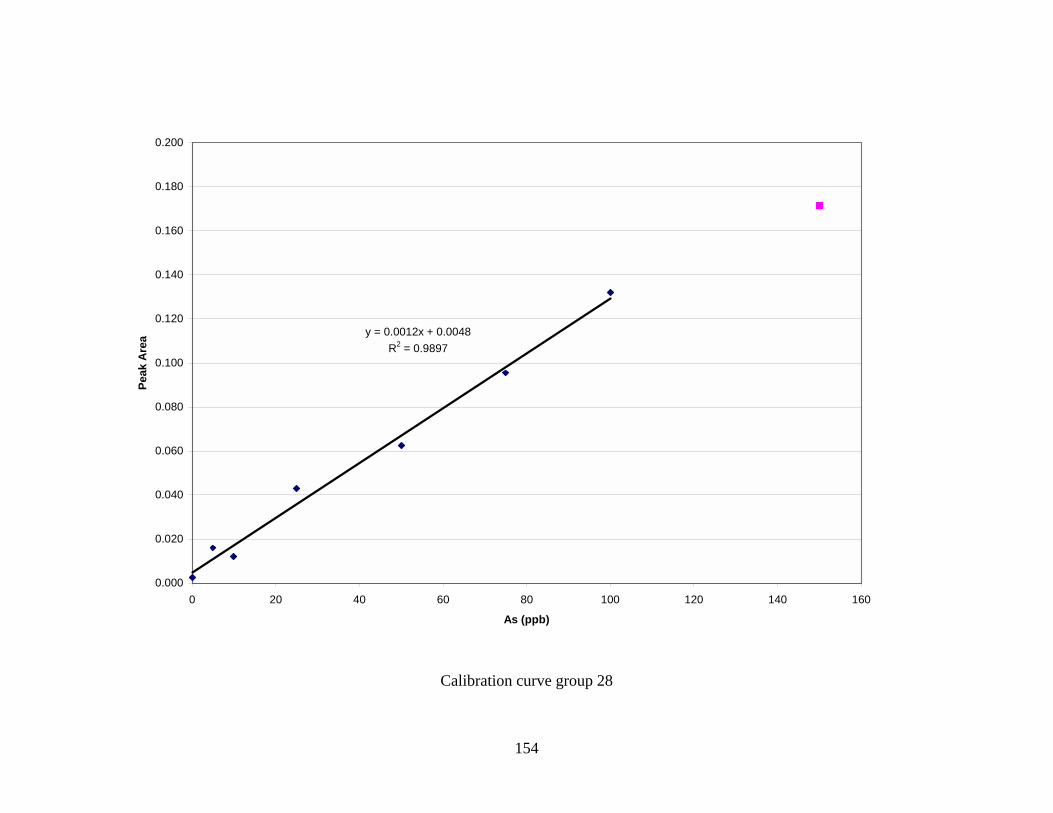
E.1 Calibration Curves .......................................................................................... 128
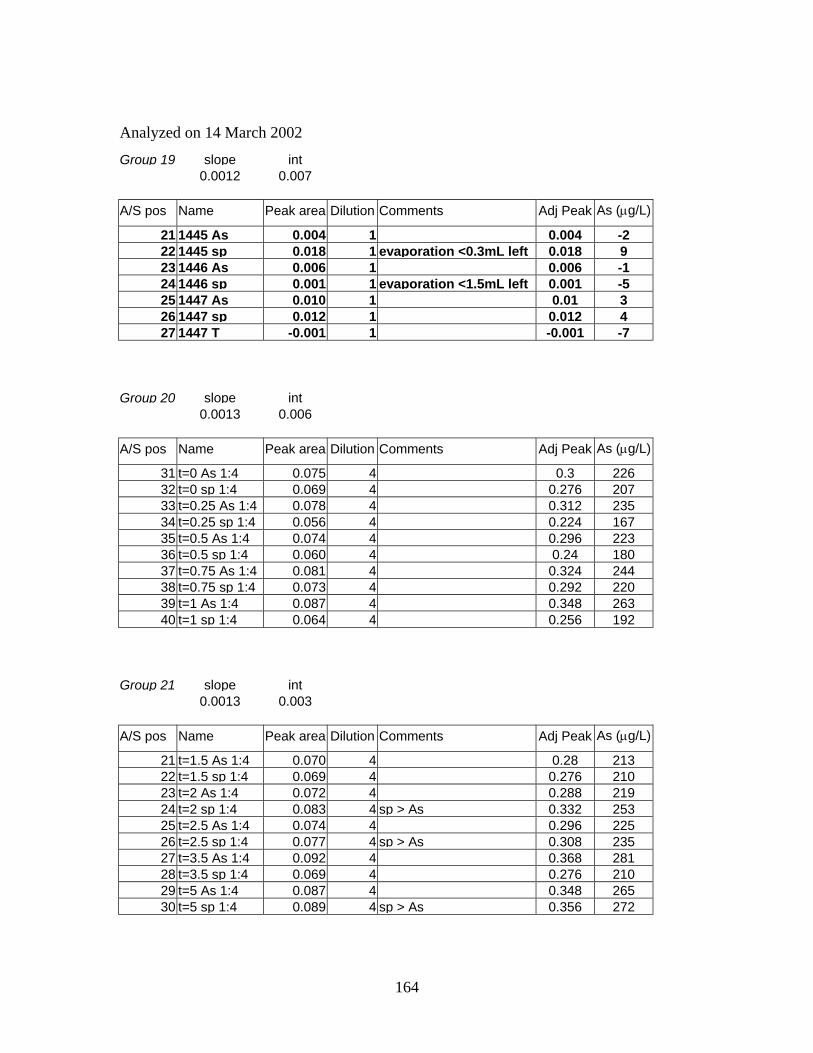
E.2 Interpolated Results ........................................................................................ 158
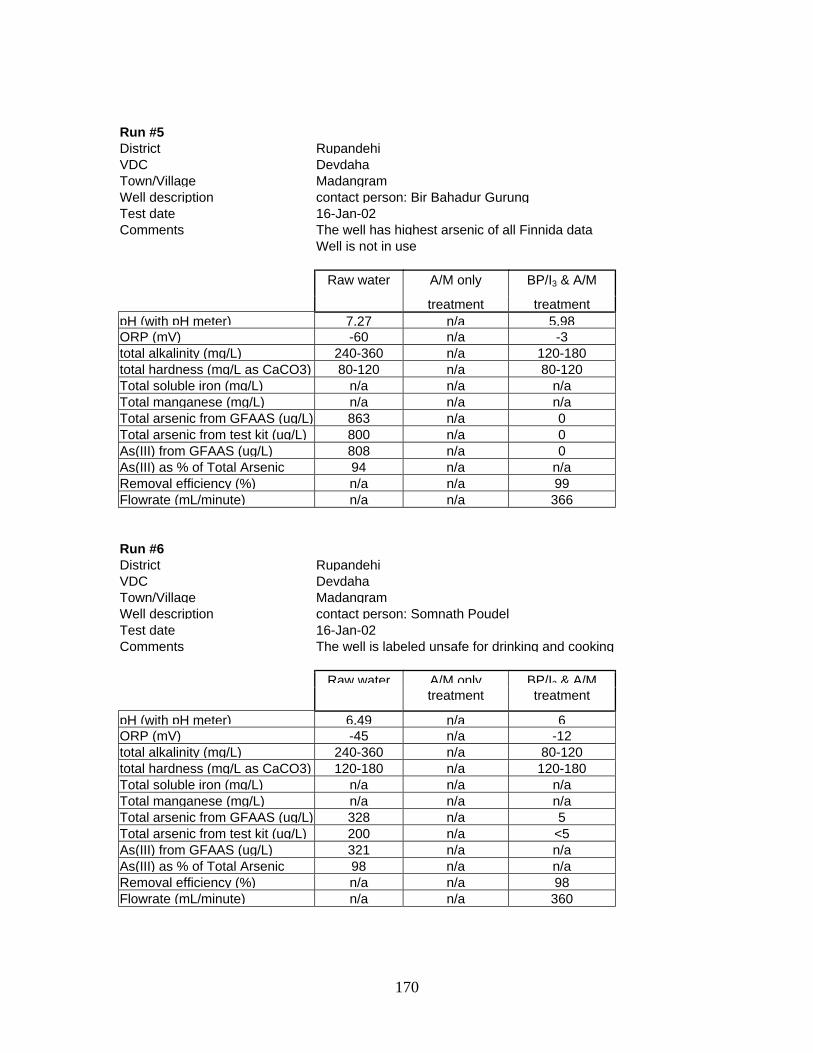
Appendix F Arsenic Removal Technology Data ........................................................ 168
Appendix G DIDC Well Data Master List .................................................................. 173
G.1 Basic Well Information................................................................................... 173
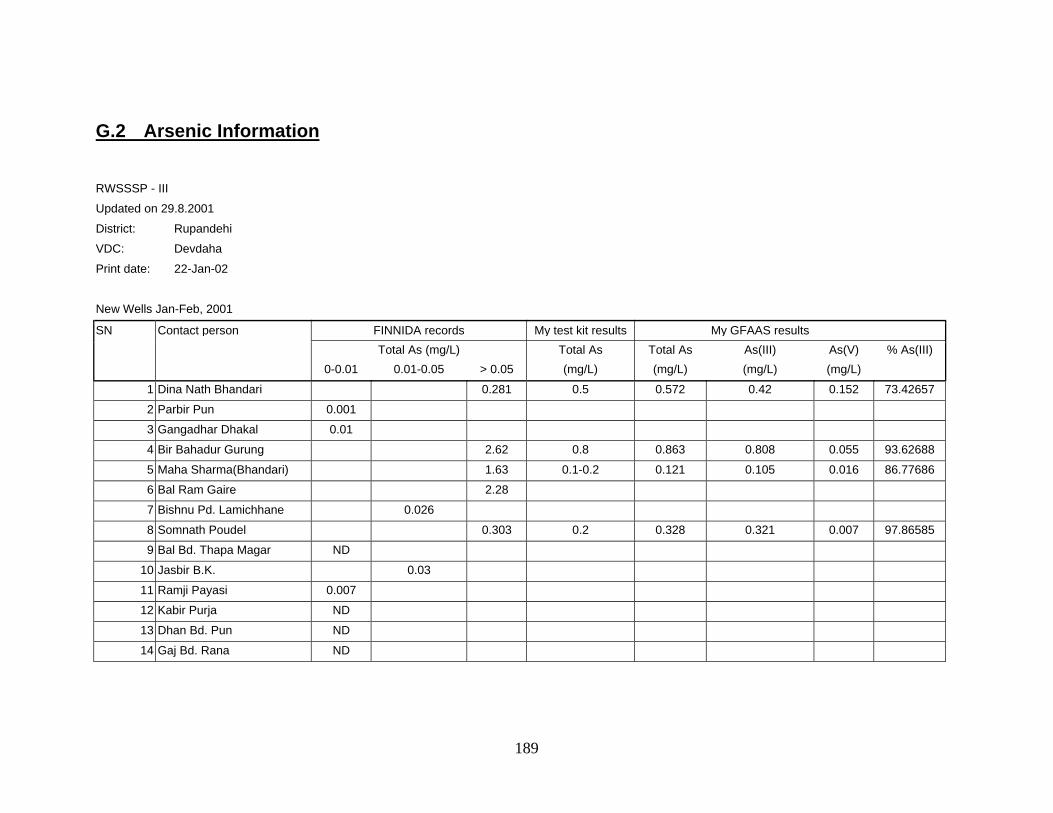
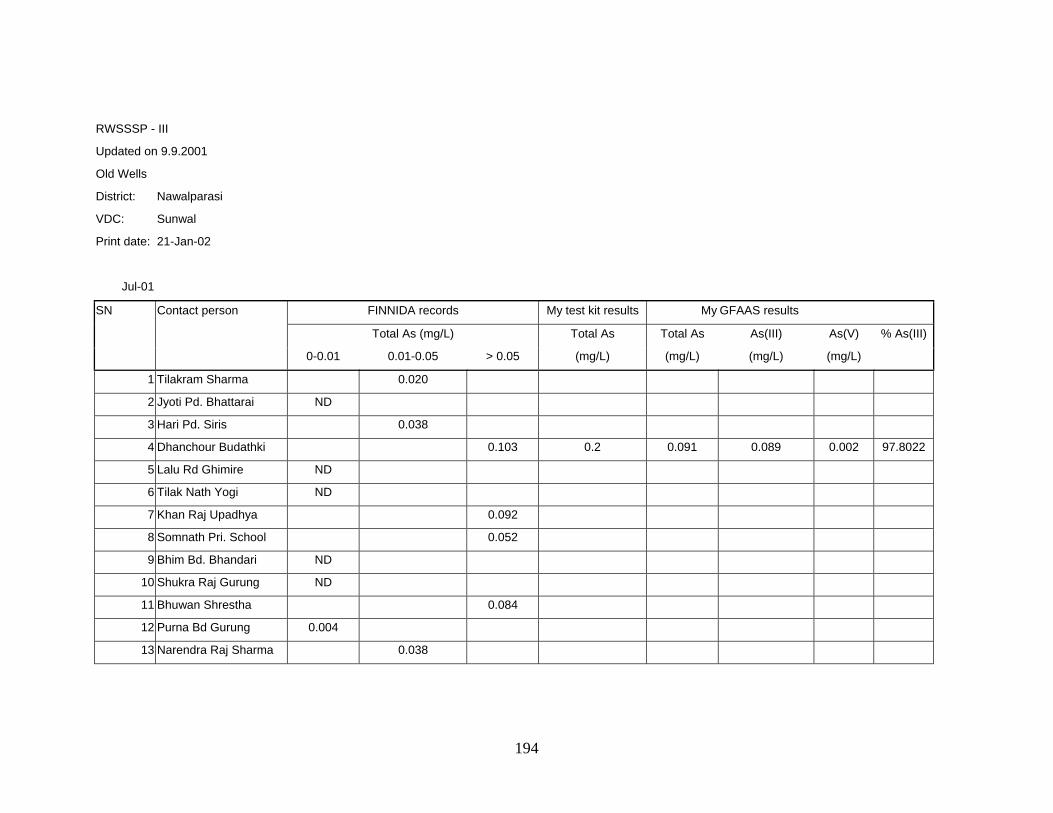
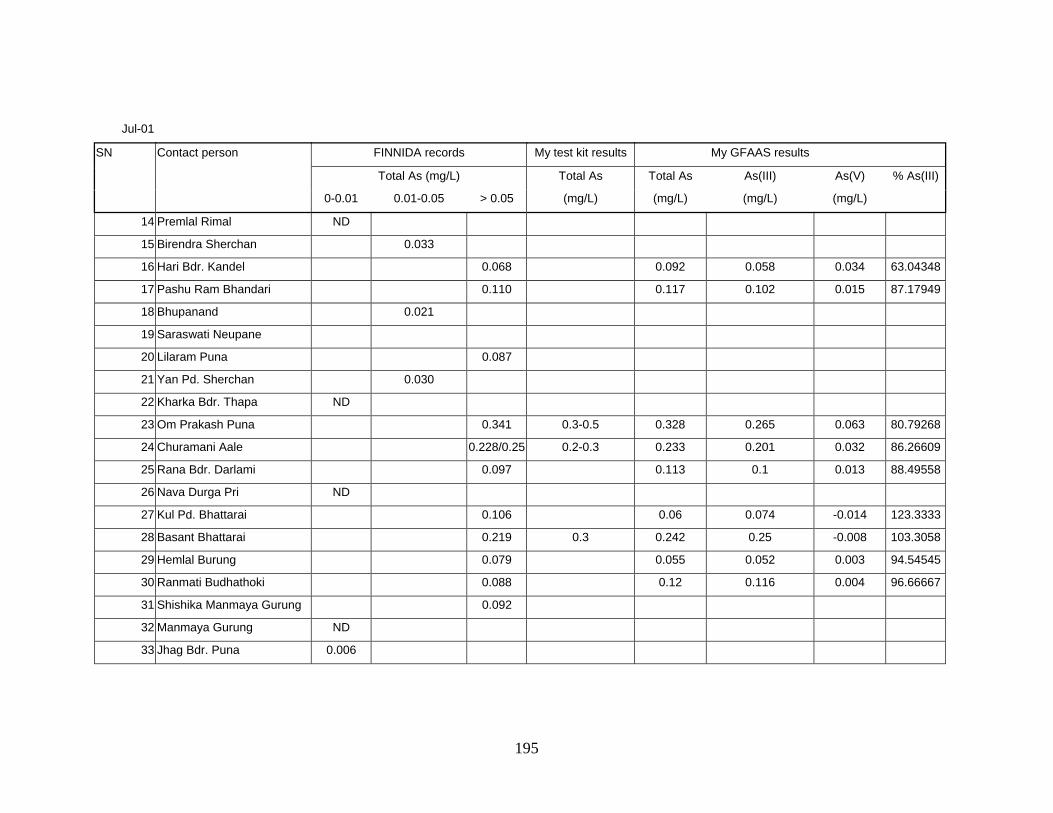
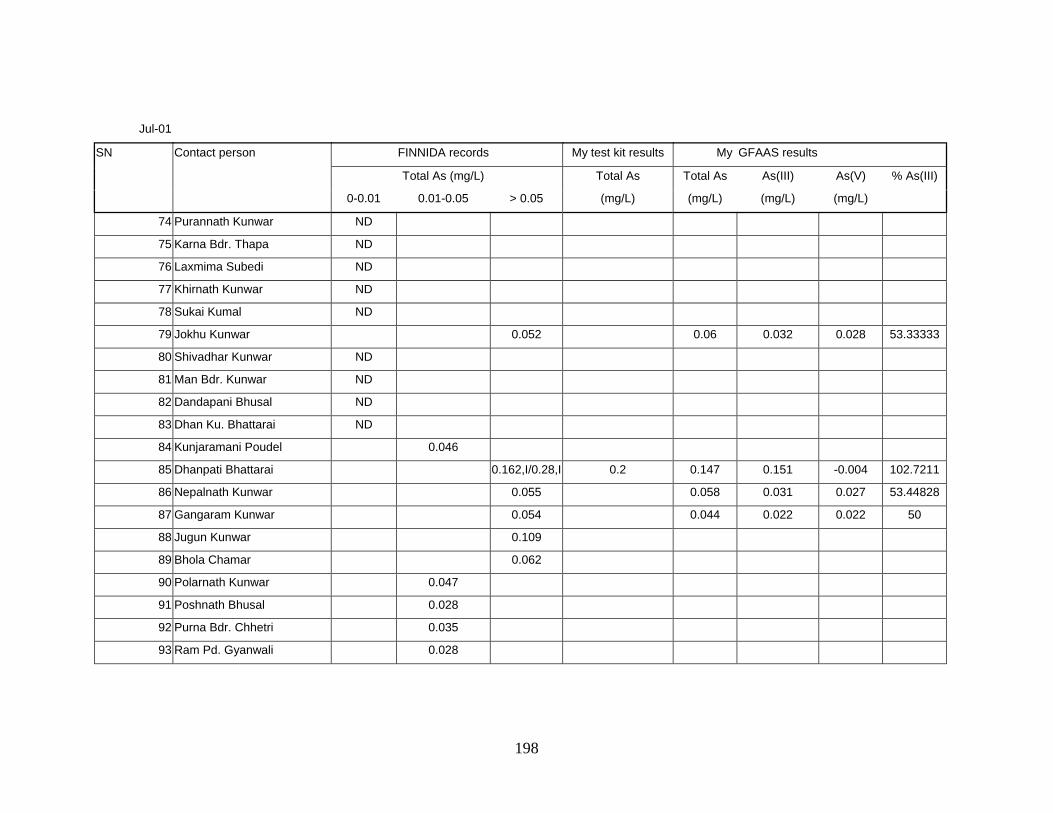
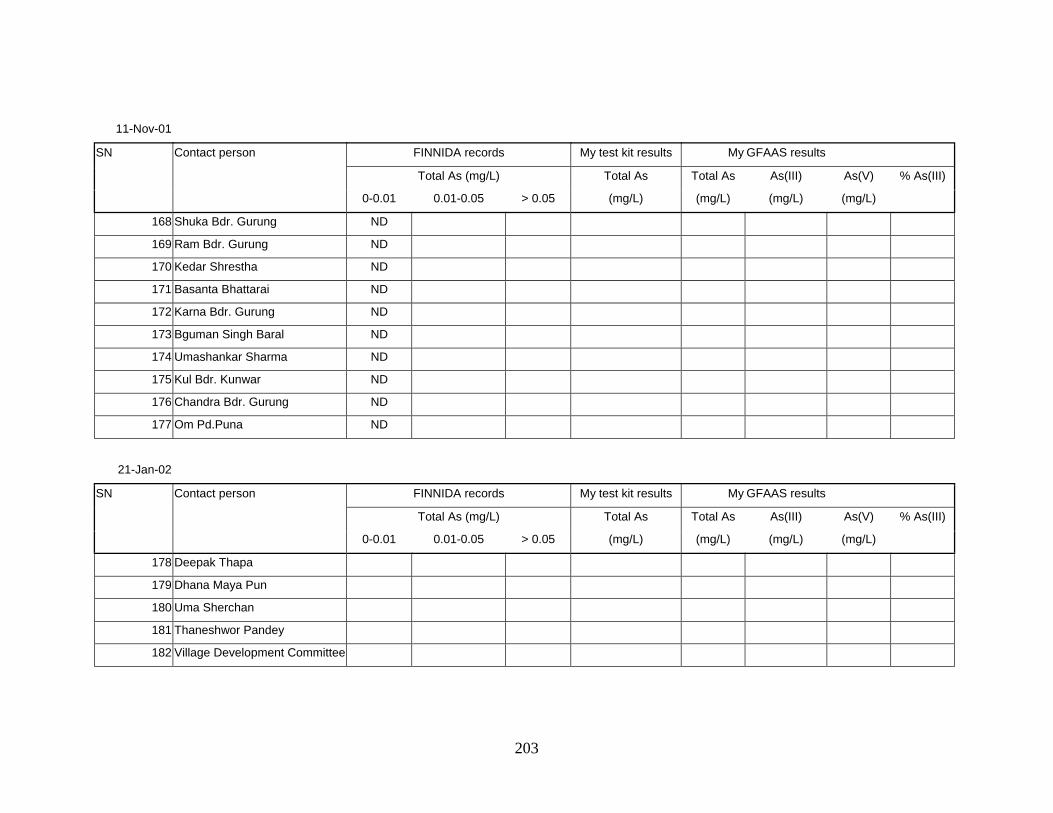
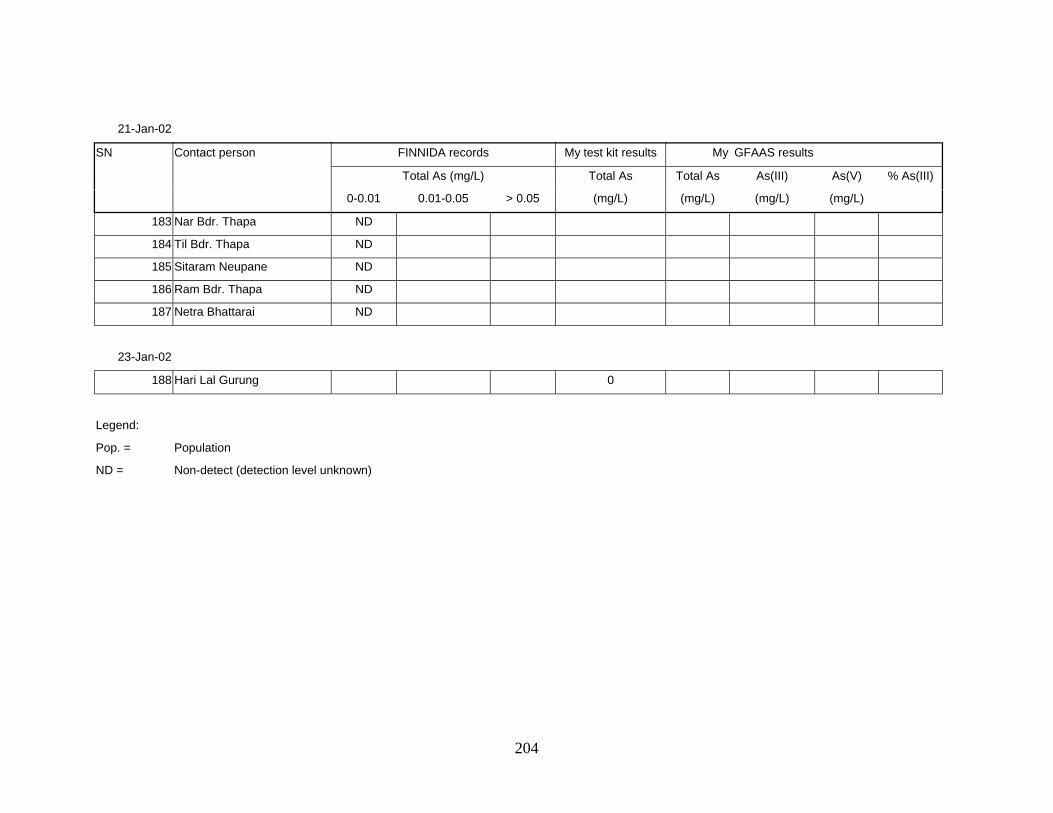
G.2 Arsenic Information ........................................................................................ 189
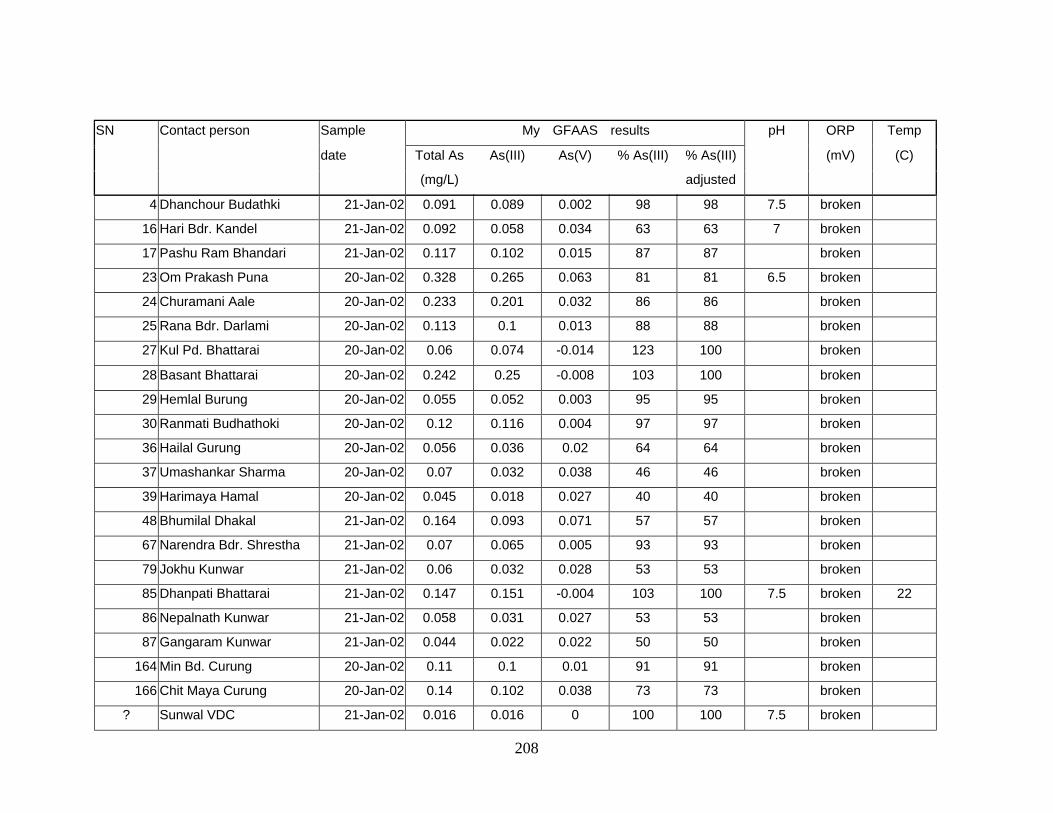
Appendix H Tubewell Speciation Data ....................................................................... 205
H.1 Basic Well Information................................................................................... 205
H.2 Site Visit Information ..................................................................................... 207
H.3 Total Arsenic Correlations.............................................................................. 209
Appendix I Oxidation Kinetics Data.......................................................................... 217
References....................................................................................................................... 218
Page 8
8
LIST OF FIGURES
Figure 1 A Typical Lift Tubewell.................................................................................... 13
Figure 2 A Typical Suction Tubewell.............................................................................. 13
Figure 3 Protonation Forms of Arsenic (III) at Various pH ............................................ 16
Figure 4 Protonation Forms of Arsenic (V) at Various pH ............................................. 16
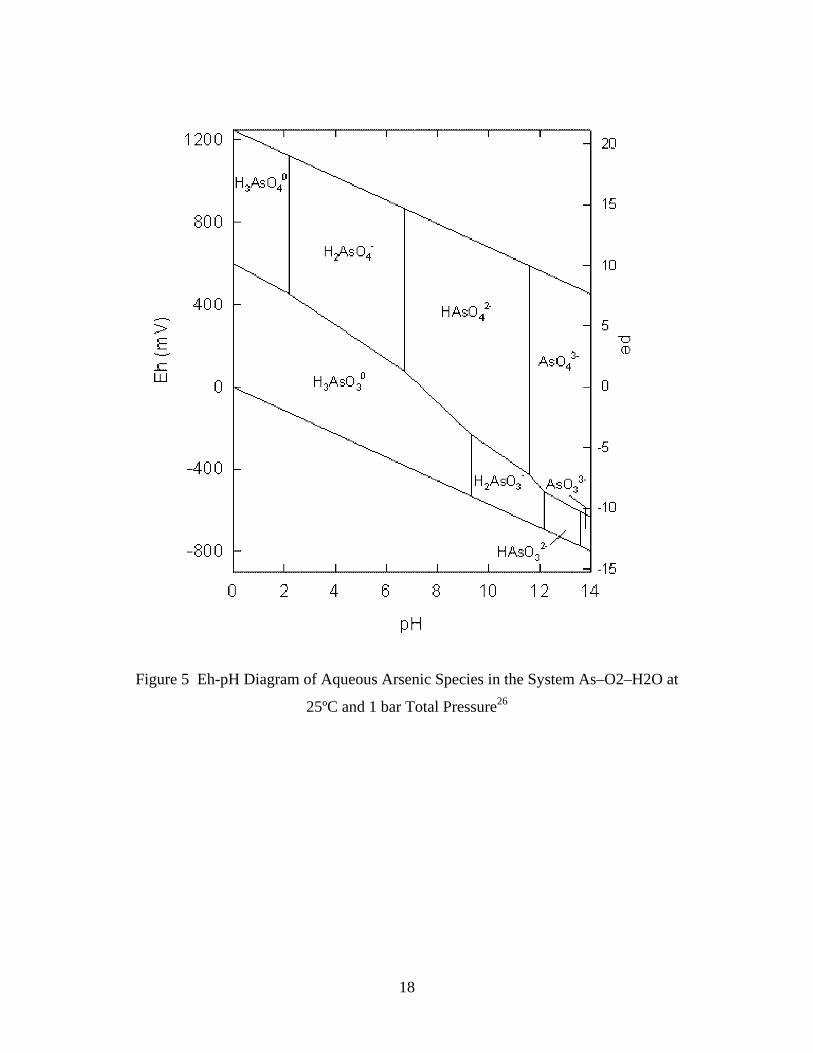
Figure 5 Eh-pH Diagram of Aqueous Arsenic Species in the System As–O2–H2O at
25ºC and 1 bar Total Pressure................................................................................... 18
Figure 6 Relative Location of Nepal, Bangladesh and West Bengal.............................. 21
Figure 7 A Keratosis Victim........................................................................................... 28
Figure 8 Industrial Test Systems Arsenic CheckTM Field Test Kit 481196.................... 31
Figure 9 The Chemical Structure of Poly-Benzyl Pyridinium Tri-Iodide ...................... 44
Figure 10 Oxidizing and Adsorption Capacity of A/M Media ....................................... 48
Figure 11 Schematic Diagram Showing the Setup of the A/M Only and the BP/I3 &
A/M Treatment Systems. .......................................................................................... 50
Figure 12 The Actual Column Used in this Arsenic Study ............................................ 51
Figure 13 Map of Nepal Showing all Districts ............................................................... 53
Figure 14 Fluctuation in 8 Calibration Curves obtained on March 12, 2002. ................ 64
Figure 15 Results for Total Arsenic for the 37 Wells in Various Villages..................... 79
Figure 16 Arsenic (III) as % of Total Arsenic for the 37 Wells in Various Villages. ..... 80
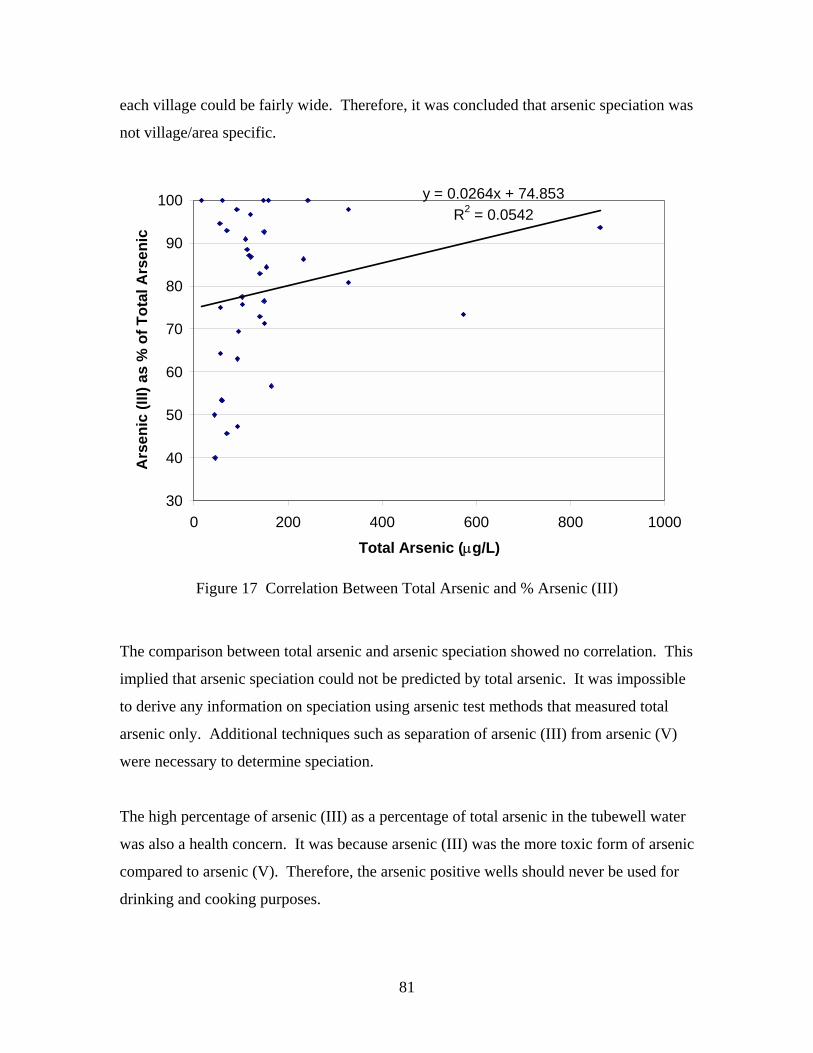
Figure 17 Correlation Between Total Arsenic and % Arsenic (III)................................. 81
Figure 18 Correlation Between pH and Arsenic Speciation............................................ 83
Figure 19 Correlation Between ORP and Arsenic Speciation ......................................... 85
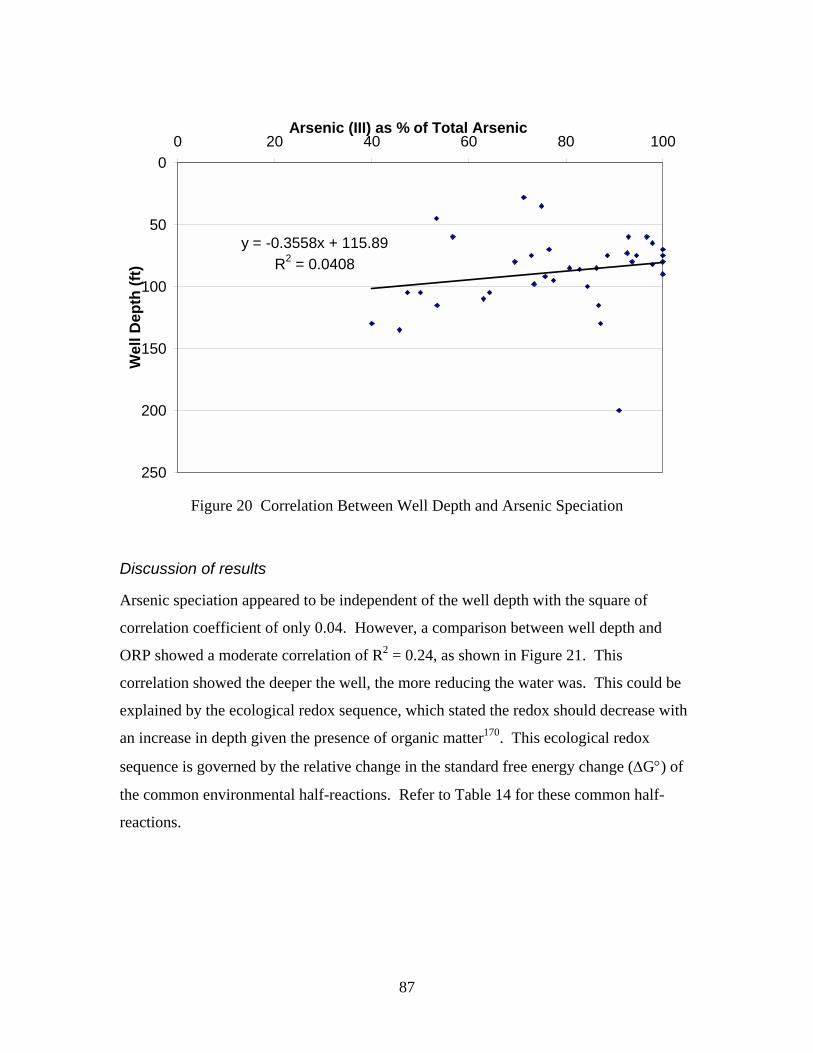
Figure 20 Correlation Between Well Depth and Arsenic Speciation .............................. 87
Figure 21 Correlation Between Well Depth and ORP..................................................... 88
Figure 22 Correlation Between Number of Users and Arsenic Speciation ..................... 90
Figure 23 Correlation Between Number of Households and Arsenic Speciation ........... 92
Figure 24 Correlation Between the Number of Households and Users........................... 93
Figure 25 Change in Total Arsenic and Arsenic (III) with Time .................................... 95
Figure 26 Change in % Arsenic (III) with Time.............................................................. 96
Figure 27 Change in pH with Time ................................................................................. 99
Page 9
9
Figure 28 Change in ORP with Time ............................................................................ 100
Figure 29 Correlation Between pH and ORP ................................................................ 101
Figure 30 Schematic Map of Parasi Town Centre and Well Locations......................... 121
Figure 31 Street Scene of Parasi .................................................................................... 123
Figure 32 Backyard Well ............................................................................................... 123
Page 10
10
LIST OF TABLES
Table 1 Summary of Arsenic Removal Technology Test Dates and Locations .............. 55
Table 2 Summary of Arsenic Speciation of Tubewell Tests Dates and Location ........... 56
Table 3 Summary of Oxidation Kinetics Tests Dates and Time ..................................... 58
Table 4 Summary of Arsenic Removal Results............................................................... 61
Table 5 Summary of pH Results...................................................................................... 64
Table 6 Summary of ORP Results ................................................................................... 67
Table 7 Summary of Total Alkalinity Results ................................................................. 69
Table 8 Summary of Total Hardness Results .................................................................. 70
Table 9 Summary of Total Soluble Iron Results ............................................................. 71
Table 10 Summary of Manganese Results....................................................................... 73
Table 11 Summary of Flow Rate Results ........................................................................ 74
Table 12 Results for Total Arsenic for the 37 Wells in Rupandehi and Nawalparasi
Districts ..................................................................................................................... 77
Table 13 Comparion of test kit and GFAAS arsenic results............................................ 82
Table 14 Common environmental redox half-reactions .................................................. 88
Page 11
11
CHAPTER 1 INTRODUCTION
1.1 Nepal Water Project Overview
The Massachusetts Institute of Technology (MIT) Nepal Water Project 2001-2002 is a
program intended to increase the awareness of water quality problems in the country of
Nepal, and to provide assistance in solving these problems. Since 1999, 20 Master of
Engineering students at the MIT Civil and Environmental Engineering Department
traveled to Nepal to study various water quality and household/community level water
treatment issues. This year’s project is a collective effort of eight students: Heather
Lukas, Chian Siong Low, Hannah Sullivan, Yong Xuan Gao, Luca Morganti, Barika
Poole, Jeff Hwang, and Tommy Ngai.
Starting in September 2001, these eight students conducted background research into the
water issues in Nepal. They traveled with Susan Murcott, their project advisor, to Nepal
for three weeks in Jan 2002 to carry out their field studies. While in Nepal, these
students worked closely with local agencies including Environment and Public Health
Organization (ENPHO) in Kathmandu and in Parasi, International Buddhist Society
(IBS) in Lumbini, and the Finnish Department of International Development Co-
operation (DIDC), formerly called the Finnish International Development Agency
(FINNIDA), in Butwal.
The MIT Nepal Water Project is completed as part of the degree requirements for the
Master of Engineering program in the Civil and Environmental Engineering Department
of MIT. Each student writes an independent thesis and the team produces a group report.
This thesis is one of those independent theses.
Page 12
12
1.2 Project Motivation
Nepal is a developing country in south central Asia landlocked between China to the
north and India to the south. The land area is 140 000 km2 and the year 2000 population
is 23 millions, of which 20 millions is rural1. Nepal is one of the world’s poorest and
least developed countries. The average annual income per capita is $210 US2. About
42% of the people live below the national poverty line3. Due to the poor economic
conditions and ineffective institutional programs, proper water and sanitation services are
inadequate, resulting in serious health concerns. The severity of the water problems is
even more prominent in the rural remote villages. The infant mortality rate is very high
at 74/1000 live births, compared with 5/1000 in the U.S. The under five mortality is even
higher at 105/1000 birth4. 54% of the children suffers moderate to severe stunting on
account of water borne diseases5. Diarrheal diseases kill 44000 children annually. The
average life expectancy is only 58, compared with 77 in the U.S.6. Their serious health
concern is the main motivation for this project
1.3 Project Goal
The MIT Nepal Water Project 2001-2002 is a continuation and expansion of the two
previous Nepal Water Projects. As in past years, the aim of the project is to improve the
health situation in Nepal through improvement in water supply quality. For this year,
there are three main goals. The first goal is to continue to monitor microbial and arsenic
contamination in Nepal. The second goal is to study the appropriateness of various point-
of-use household water treatment systems based on technical performance, social
acceptability, and affordability. Technologies investigated include filtration, and arsenic
removal. The last goal is to evaluate past pilot studies and/or implement new projects,
including the Lumbini pilot study, a tubewell maintenance program, and a chlorine
generation micro-enterprise project.
Arsenic is a toxin that causes serious health effects such as cancer. The evaluation of an
arsenic removal technology, as well as arsenic speciation in tubewell water are the focus
Page 13
13
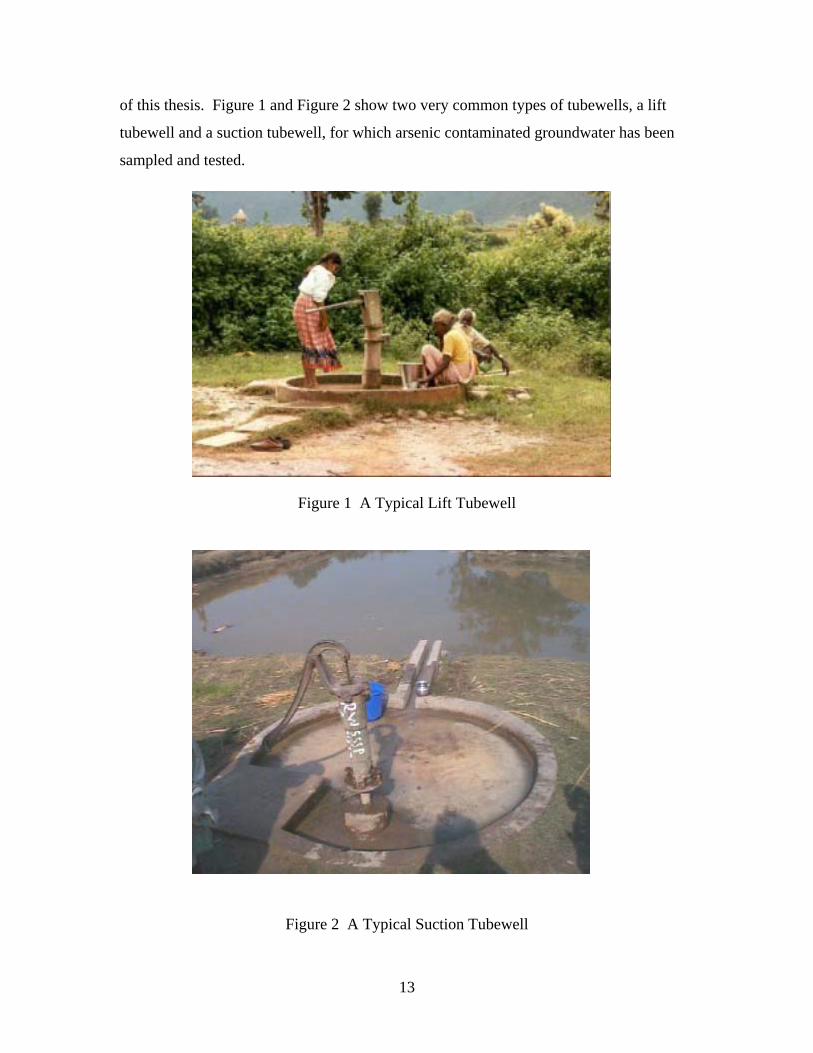
of this thesis. Figure 1 and Figure 2 show two very common types of tubewells, a lift
tubewell and a suction tubewell, for which arsenic contaminated groundwater has been
sampled and tested.
Figure 1 A Typical Lift Tubewell
Figure 2 A Typical Suction Tubewell
Page 14
14
CHAPTER 2 BACKGROUND
2.1 Arsenic in the Environment Arsenic is a naturally occurring element widely distributed in the earth’s crust. It is the
51st most abundant element on earth, with an average level of 1.8 mg/kg in the earth’s
crust. Normal background concentration are 0.2-15 mg/kg in the lithosphere, less than 15
mg/kg in soils, 0.02-2.8 ng/m3 in the atmosphere, and less than 1 µg/L in aquatic
environment7.
Arsenic can be released into the environment by either natural or anthropogenic
processes. Dominant natural processes are volcanic activities and weathering of arsenic
bearing rocks, including realgar (AsS), orpiment (As2S3), arsenopyrite (FeAsS), and
lollingite (FeAs2)8, 9. Anthropogenic sources of arsenic are numerous. They include the
application of arsenical pesticides on land, incineration of arsenic containing substances,
industrial wastewater discharge, mine tailing/landfill leaching, and manufacturing of
arsenic compounds10, 11, 12.
Since arsenic is an element, it is indestructible. It can only change from one form to
another, and be transported from one medium to another13. Arsenic in air will settle to
the ground or be washed out by rain. Arsenic in water may precipitate out of the
solution, or adsorbed onto rocks and soils. Arsenic-containing rocks and soils may
release arsenic into the water by dissolution or desorption14. Of the above media,
aqueous arsenic is of most concern because high levels arsenic have found in drinking
water in various places around the world, and are known to cause serious adverse health
effects. Therefore aqueous arsenic will be the main focus in this report.
2.2 Arsenic Chemistry Arsenic is a group V element with an atomic mass of 74.9 g/mol15. Contrary to popular
belief, arsenic is not a metal, but a metalloid. Arsenic forms a number of inorganic and
Page 15
15
organic compounds. Naturally occurring inorganic arsenic is stable in oxidation states of
-III as in arsine gas (AsH3), 0 as in crystalline arsenic, +III as in arsenite, and +V as in
arsenate16. Organic arsenic species include monomethylarsonic acid (MMAA), and
dimethylarsonic acid (DMAA)17. They may be produced by biological activity, mostly in
surface waters, but are rarely quantitatively important. Organic forms may, however,
occur where waters are significantly impacted by industrial pollution18. In the relatively
pristine natural ground water environment, arsenic (III) and arsenic (V) are typically the
dominant forms of arsenic.
2.2.1 Acid-base Chemistry
Depending on pH, different forms of arsenic (III) are H3AsO3, H2AsO3-, HAsO3
2-, and
AsO33- whereas different forms of arsenic (V) are H3AsO4, H2AsO4
-, HAsO42-, and
AsO43-. Refer to Figure 3 and Figure 4 for the protonation forms of arsenic (III) and
arsenic (V) at various pH. These diagrams are generated by the following equilibrium
relationships19.
For arsenic (III),
H3AsO3 ! H2AsO3- + H+ pKa1 = 9.22 (1)
H2AsO3- ! HAsO3
2- + H+ pKa2 = 12.13 (2)
HasO32- ! AsO3
3- + H+ pKa3 = 13.40 (3)
For arsenic (V),
H3AsO4 ! H2AsO4- + H+ pKa1 = 2.20 (4)
H2AsO4- ! HAsO4
2- + H+ pKa2 = 6.97 (5)
HAsO42- ! AsO4
3- + H+ pKa3 = 11.53 (6)
Page 16
16
Figure 3 Protonation Forms of Arsenic (III) at Various pH
Figure 4 Protonation Forms of Arsenic (V) at Various pH
Page 17
17
The amount of protonation of both arsenic (III) and arsenic (V) is an important factor
governing the mobility of these chemical species. For example, the pH of groundwater is
often between 6 to 8. Within this range, arsenic (III) is uncharged while arsenic (V) is
negatively charged. As a result, arsenic (III) is more mobile than arsenic (V). The
movement of arsenic (V) is retarded by electrostatic attraction to positively charged
particles, such as iron hydroxides20. This information is also useful in designing effective
arsenic removal technologies and in determining the arsenic speciation by ion exchange
separation technique.
2.2.2 Reduction-Oxidation (redox) Chemistry
Given the acid-base chemistry, combined with Gibb’s free energy change of the
oxidation/reduction reactions between arsenic (III) and arsenic (V), an Eh-pH diagram
(Pourbaix diagram) can be constructed21,22. Refer to Figure 5 for an Eh-pH diagram of
arsenic.
The Eh-pH diagram shows the exact arsenic speciation and oxidation states at a particular
pH and redox potential23. The diagram also shows the expected change in arsenic state
when environmental conditions differ. For example, anoxic groundwater usually has a
low redox potential. When the water is pumped to the ground surface and exposed to the
atmosphere, the presence of dissolved oxygen increases the redox potential. As a result,
arsenic (III) will naturally oxidize to arsenic (V).
This information is very useful because different oxidation states of arsenic also have
different toxicities. Studies show arsenic (III) can be a degree of magnitude more toxic
than arsenic (V)24, 25. Refer to Chapter 3 Health Effects, for more information on
toxicology. Refer to Chapter 7 Results and Discussions, for more information on the
kinetics of arsenic (III) oxidation.
Page 18
18
Figure 5 Eh-pH Diagram of Aqueous Arsenic Species in the System As–O2–H2O at
25ºC and 1 bar Total Pressure26
Page 19
19
2.3 Arsenic Situation in South Asia In the early 1970s, most of the rural population of Nepal and the neighboring countries of
Bangladesh and India received their drinking water from surface sources, including lakes,
rivers, and ponds. Because this water became increasingly polluted, water-borne diseases
were prevalent. Nearly a quarter of a million children died each year from these
diseases27. Throughout the late 1970s and the 1980s, there was a worldwide push to
improve the general health condition of the people in developing nations. Infant
mortality was one of the target health indicators. It was well understood that access to
clean drinking water source could reduce infant mortality28. As a result, many
international aid agencies such as the World Bank, and the United Nations International
Children’s and Educational Fund (UNICEF) became involved in funding the installation
of tubewells for domestic water supply. Since groundwater contains relatively less
microbial contamination than surface water, groundwater was believed to be a better
source of drinking water supply29. Tubewell construction was simple and cheap. In
addition, tubewells could be installed close to people’s home, saving time for them to
travel to surface water sources. Furthermore, tubewells provided rural villagers with a
year round source of water to irrigate their fields, greatly contributing to the green
revolution of food self-sufficiency. Millions of wells were built during the period of the
late 1970s to 1980s30, 31. In Bangladesh, the tubewell construction programs by various
foreign aid agencies were successful in improving coverage of “safe” drinking water to
over 97%32. Partly due to the results of various successful tubewell installation
programs, infant mortality in Bangladesh dropped significantly from 151/1000 live births
in 1960 to 83/1000 live births in 199633.
At the time, however, the standard water quality testing procedures did not include tests
for arsenic. Starting in 1983, cases of arsenic-induced skin diseases began to appear in
West Bengal, India34. However, the issue remained unnoticed. In 1993, the Bangladesh
Department of Public Health Engineering (DPHE) identified their first arsenic-affected
patient. Well testing was conducted in the western districts of Bangladesh in September
of the same year. Of the 33 tubewell samples tested, 13 had arsenic level more than
WHO guideline of 10 µg/L. A committee consisting of representatives from DPHE,
Page 20
20
National Institute of Preventive and Social Medicine (NIPSOM), Atomic Energy
Commission, Geological Survey of Bangladesh, UNICEF, and other concerned
organization was formed in 1994 to review the situation of arsenic in drinking water in
Bangladesh. Further well survey was recommended. The Government of Bangladesh
was contacted as well, but the government remained silent. The arsenic situation again
remained unnoticed. In June 1996, a non-profit NGO called the Dhaka Community
Hospital (DCH) received several patients showing signs of arsenical skin lesions35. DCH
promptly tested tubewells in the area, and found high arsenic content in the water. DCH
informed the local officials and made newspaper reports. Arsenic contamination concern
began to surface in Bangladesh. Finally in 1997, the Bangladesh Government officially
confirmed that its country’s drinking water supply is seriously contaminated with arsenic.
Arsenic in Bangladesh made headlines around the world36.
Bangladesh currently faces the world’s most serious arsenic crisis. It is estimated
between 20-60 million people of the country's total population of 125 million are at risk
of exposure to arsenic in their drinking water over the Bangladesh standard of 50
µg/L37,38. At least 100 000 cases of debilitating skin lesions are believed to have already
occurred39. Another 4-7 million people are at risk in neighboring West Bengal.40 Figure
6 shows the relative locations of Nepal, Bangladesh, and West Bengal (India).
Page 21
21
Figure 6 Relative Locations of Nepal, Bangladesh and West Bengal
2.4 Arsenic Situation in Nepal The Nepal Terai is the flat plain region in the southern part of the country, a part of the
Gangetic watershed. Due to its proximity to Bangladesh and West Bengal, various
groups became concerned that arsenic can be a problem in Nepali drinking water. In
1999, the Department of Water Supply and Sewerage (DWSS) received financial support
of World Health Organization (WHO) and UNICEF to initiate various arsenic monitoring
programmes41. These programmes were conducted on the groundwater of southern Nepal
by a number of national and international organizations. In the 1999 study by DWSS in
Page 22
22
the districts of Jhapa, Morang, and Sunsari in eastern Nepal, it was found that 9% of the
268 tube well water samples contained arsenic above the WHO guideline of 10 µg/L.
The highest concentration was found to be 75 µg/L42. In January 2000, a study by Halsey
of the MIT Nepal Water Project 1999-2000 showed that 18% of the 172 tested tube wells
of the Terai region were contaminated with arsenic level above the WHO guideline43. In
the same year, in study by the Nepal Red Cross Society (NRCS) in the three districts of
eastern Terai namely Jhapa, Saptari and Sarlahi, it was found that 5.1% of the tube wells
has arsenic contamination above the WHO guideline. The highest level detected was 56
µg/L 44. The NRCS also conducted a study in 2001 in eight other districts of the Terai
region including Rautahat, Bara, Parsa, Nawalparasi, Rupandehi, Kapilvastu, Banke, and
Bardiya. It was found that 22% of the total investigated tube wells have arsenic level
exceeding the WHO guideline, and the maximum level of contamination was found to be
165 µg/L45. Also in 2001, the Rural Water Supply and Sanitation Support Program
(RWSSSP) in collaboration with the Finnish International Development Co-operation
(DIDC), formerly called the Finnish International Development Agency (FINNIDA)
showed that 9.8% of 1508 samples in the districts of Rupandehi, Nawalparasi, and Palpa
have over 10 µg/L of arsenic 46. The highest was measured in the village development
community (VDC) of Devdaha of Rupandehi district where two wells have over 2000
µg/L of arsenic47. From these studies, it is clear that arsenic is a problem in the
groundwater of the Nepal Terai region. It can potentially escalate into a serious health
issue if the problem is not addressed properly.
2.5 Origins of Arsenic Due to the low level of industrial activities in Nepal and Bangladesh, it is generally
agreed that natural processes, as opposed to anthropogenic activities, are the dominant
source of arsenic in these regions. Several hypotheses have been put forward as to the
source and release mechanisms of arsenic in groundwater. The two most popular
hypotheses are pyrite oxidation and iron oxyhydroxide reduction48.
Page 23
23
2.5.1 Pyrite Oxidation Hypothesis
The pyrite oxidation hypothesis was proposed by Dr. Dipankar Chakraborti and his
group49. Studies have shown that there is a high level of arsenopyrite in the alluvial
regions of Bangladesh50. After tubewells were installed, the water table was lowered due
to increased pumping. As a result, atmospheric oxygen invaded the aquifer by diffusing
into the pore spaces of the soil and into the groundwater. The oxygen interacts with the
arsenopyrite, turns the mineral into water-soluble form, thus releasing arsenic into the
groundwater51, 52, 53.
However, this hypothesis was not consistent with the observation that shallow, oxic wells
generally contained much lower level of arsenic than deeper, anoxic wells54. In addition,
if pyrite was oxidized, the aquifer should be rich in sulfate, but it was not55. Recent
works by Harvey et al found sulfate levels were lower at locations with higher arsenic
concentration56. In the conference on arsenic mitigation in Dhaka on January 14th -16th
2002, there was a widespread feeling that the oxidation theory was not reasonable57.
2.5.2 Iron Oxyhydroxide Reduction Hypothesis
According to the iron oxyhydroxide reduction hypothesis, the source of arsenic was from
the Ganges source region upstream of Bangladesh, where arsenic-rich sulfide minerals
were weathered during the late Pleistocene-Recent times. As these weathered minerals
traveled down the Ganges, arsenic was adsorbed to iron oxyhydroxide (FeOOH). The
arsenic-rich iron oxyhydroxide were deposited at the Gangetic delta, and formed an
alluvial aquifer. Due to a wide variety of processes, such as agriculture or groundwater
pumping, organic carbon was introduced into the aquifer. The mineralization of organic
carbon caused anoxic condition in the aquifer, and lowered the redox potential. The
reducing environment caused the breakdown of iron oxyhydroxide, and released the
previously adsorbed arsenic58, 59.
One of the arguments supporting this hypothesis was that studies showed arsenic
correlated well with iron and dissolved bicarbonate60. Arsenic concentration also
Page 24
24
increased with depth61. These observations suggested that arsenic was released when
arsenic-rich iron oxyhydroxide was reduced in the anoxic condition, a process that
mobilized iron and its absorbed load, and increased bicarbonate concentration62.
Recent works by Harvey et al63 further supports this hypothesis by showing strong
correlations between arsenic and several key chemical species, including calcium,
ammonium, organic carbon, sulfate, and iron in groundwater at various depth. For
example, arsenic and sulfate shows a strong negative correlation, meaning that arsenic
concentrations are high when sulfate concentrations are low. One explanation for low
sulfate concentration at a particular depth is that sulfate reduction is taking place.
According to the ecological redox sequence, sulfate reduction should occur after iron
reduction, because sulfate reduction is less energetically favorable then iron reduction64.
Therefore, at depths with low sulfate, iron reduction should have already occurred. The
reduction of iron released arsenic into the groundwater. As a result, arsenic
concentrations are high when sulfate concentrations are low.
2.6 Arsenic Treatment Technologies Since the discovery of arsenic in Bangladesh and West Bengal, many researchers
worldwide have focused their efforts on developing appropriate arsenic removal
technologies to treat the arsenic contaminated groundwater. These technologies can be
broadly categorized according to their dominant removal process. They include
oxidation, coagulation/precipitation, filtration, adsorption, ion exchange, membrane
processes, and biological processes65. Although many of these technologies are
theoretically sound and work well in a controlled laboratory environment, many of them
have not been field tested for their performance and appropriateness. In the MIT Nepal
Water Project 2000-2001, Hurd evaluated the performance and appropriateness of three
promising technologies: Three-Gagri System, Jerry Can System, and Arsenic Treatment
Unit (ATU)66. The Three-Gagri System was found to be both effective and appropriate,
but clogging and possible microbial growth were potentially the main problems. The
Jerry Can System was found to be ineffective and inappropriate with its current design.
Page 25
25
The ATU was quite effective, but too expensive for mass implementation in South Asian
contexts.
2.7 Alternative Water Source
Besides removing arsenic from groundwater, alternative water sources such as rainwater
harvesting, dugwell, and deep wells may provide arsenic-free drinking water to the
Nepali people. Rainwater harvesting is under studied by DIDC and the preliminary
results are encouraging67. The town of Parasi in the Nawalparasi district currently taps
into a deep aquifer to provide drinking water of low arsenic concentration to the
townspeople. However, construction of deep wells requires more sophisticated
equipment and is thus more expensive, at about US$500 per well68.
Page 26
26
CHAPTER 3 HEALTH EFFECTS
Arsenic has been long known as a poison. Even at low concentration, it can produce
devastating human health effects69. The toxic character of arsenic species mainly
depends upon their chemical form. The most toxic form is arsine gas, followed by
inorganic trivalent compounds, organic trivalent compounds, inorganic pentavalent
compounds, organic pentavalent compounds and elemental arsenic70, 71. Both the WHO
and EPA have classified inorganic arsenic as a toxin and carcinogen72.
3.1 Route of Entry Given that arsenic can be found in different environmental media, possible routes of entry
include inhalation of arsenic contaminated air, ingestion of arsenic containing food and
water, and skin contact73. Air borne arsenic concentration is usually between 0.02 and 4
ng/m3. This concentration is too low to induce any noticeable health effects by
inhalation74. As for skin contact, arsenic does not readily absorb into skin upon contact.
Therefore, inhalation and skin contact are negligible source of entry for arsenic. The
ingestion of arsenic containing food and/or water is the most important route of entry. Of
the many food categories, fish and shellfish contain the highest level of arsenic75. Up to
40 µg of arsenic per gram of dry weight fish can be found. Fortunately, over 90% of the
arsenic is in organic form, which is only very mildly toxic76. In contrast, for arsenic
contaminated drinking water, most of the arsenic is in the more toxic inorganic form.
Arsenic levels in groundwater typically average around 1 to 2 µg/L. However, in areas
with volcanic rock and sulphide mineral deposits, arsenic levels in excess of 3000 µg/L
have been measured77. Therefore, arsenic in drinking water is of the most concern.
3.2 Acute Toxicity of Arsenic (III) and (V) Ingestion of large doses of arsenic usually results in symptoms within 30 to 60 minutes,
but may be delayed when taken with food. Acute arsenic poisoning usually starts with a
metallic or garlic-like taste, burning lips and dysphagia. Then, violent vomiting and
Page 27
27
hematemesis may occur78. These gastrointestinal symptoms are a result of intestinal
injury caused by dilatation of splanchnic vessels leading to mucosal vesiculation. After
the initial gastrointestinal problems, multi-organ failures may occur, followed by death.
Survivors of acute arsenic poisoning commonly incur damage to their peripheral nervous
system79.
Arsenic (III) and (V) behaves differently in acute poisoning. Arsenic (III) binds and
inactivates sulfhydryl-containing enzymes necessary for proper body functions. On the
other hand, arsenic (V) elicits toxicity by mimicking phosphate and interfering with ATP
production in the mitochondria80.
Acute poisoning has a mortality rate of 50-75% and death usually occurs within 48 hours.
A lethal does will vary with the arsenic form, but 0.2-0.3 g of arsenic trioxide is usually
fatal for adult humans81. Reported arsenic (V) LD50 values in rats are 110 mg/kg, while
the LD50 values in rats for arsenic (III) varies from 15 mg/kg to 110 mg/kg. Therefore,
arsenic (III) is a magnitude more acutely toxic than arsenic (V)82. However, in the
context of drinking water supply, acute poisoning is less common than chronic exposure.
3.3 Chronic Toxicity of Arsenic (III) and (V) Chronic exposure to low level of arsenic has long since been linked to adverse health
effects in human. There are contradictory beliefs on the relative chronic toxicity of
arsenic (III) and (V). On one hand, arsenic (III) should be more toxic than (V), as an
extension of acute toxicity data. On the other hand, some believe that chronic toxicity at
low arsenic levels, as found in most groundwater, is influenced only by total arsenic
concentration, not speciation83. No matter which hypothesis is correct, long-term
exposure to arsenic has proven to cause dermal, vascular, and cancer effects84.
3.3.1 Dermal
Initially, chronic exposure to arsenic causes skin changes such as hyperpigmentation and
keratosis. Hyperpigmentation is an alteration in color resulting in spots on the skin and
Page 28
28
keratosis is a hardening of skin bulges, usually found in palms and soles. Following
hyperkeratosis and hyperpigmentation, cancer may occur. After 10 years of exposure,
cancer of the skin may develop85. Figure 2 shows a keratosis victim. Recent studies
from West Bengal, India and Bangladesh in populations showed that that the age-
adjusted prevalence of keratosis rose from zero in the lowest exposure level (< 50 µg/L)
to 8.3 per 100 women drinking water containing > 800 µg/L86. For men, the age-adjusted
prevalence rates rose from 0.2 per 100 in the lowest exposure category to 10.7 per 100 in
the high exposure group87. For hyperpigmentation prevalence, similar results were
reported88. Figure 7 shows a victim of keratosis.
Figure 7 A Keratosis Victim
3.3.2 Vascular Effects
Exposure to arsenic has been linked to various vascular diseases affecting both the large
(cardio-vascular) and small blood vessels (peripheral vascular). Blackfoot disease (BFD)
in parts of Taiwan is an example of peripheral vascular disease. BFD is characterized by
coldness and numbness in the feet, followed by ulceration, black discoloration and
Page 29
29
subsequently dry gangrene of the affected parts. In addition many of the BDF-patients
have shown significantly higher death rate from cardio-vascular problems89.
3.3.3 Cancer
In additional to skin cancer, arsenic exposure in drinking water causes lung, bladder and
kidney cancer may appear after 20 years or more years90. Studies have consistently
shown high mortality risks from lung, bladder and kidney cancers among populations
exposed to arsenic via drinking water. Moreover, the risk of cancer for these sites
increases with increasing exposure91.
Page 30
30
CHAPTER 4 ANALYTIC METHOD
Numerous relevant water quality parameters were measured in this arsenic study. These
parameters include:
• Total inorganic arsenic
• Arsenic speciation
• pH
• Oxidation-reduction potential (ORP)
• Total alkalinity
• Total hardness as CaCO3
• Total soluble iron
• Manganese
A description of each of the above water quality parameters and their test methods are
explained in this section.
4.1 Total Inorganic Arsenic Description
Total inorganic arsenic in Rupandehi and Nawalparasi districts of Nepal was comprised
mainly of arsenic (III) and arsenic (V). Total inorganic arsenic was first measured with
an Industrial Test Systems Inc. Arsenic CheckTM Field Test Kit, and then confirmed with
a Graphite Furnace Atomic Adsorption Spectrometry (GFAAS). Other forms of arsenic
were irrelevant at these sites, thus were not measured. For example, other inorganic
forms of arsenic such as arsine or arsenic element were not found in natural waters.
Organic arsenic was formed only by bacteria methylation of arsenite92, 93. The level of
organic arsenic was believed to be low in anoxic groundwater. Furthermore, the toxicity
of organic arsenic was very low compared to inorganic forms; therefore, organic arsenic
was ignored.
Page 31
31
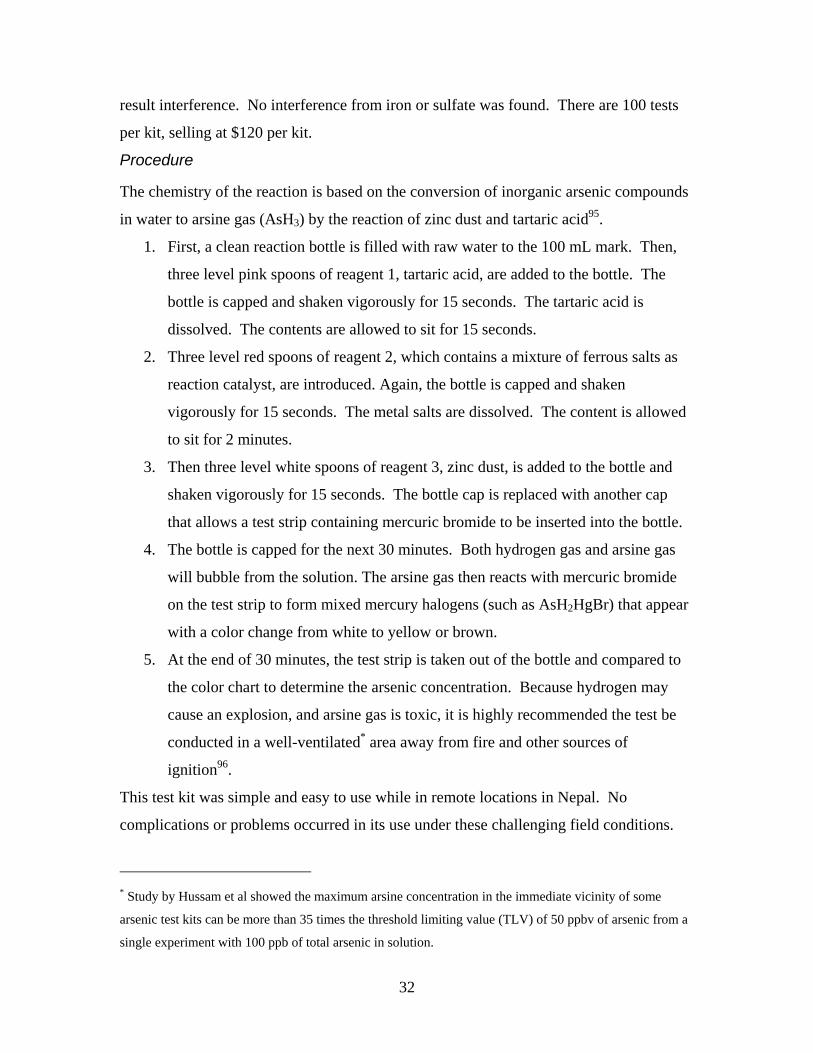
4.1.1 Industrial Test Systems Inc. Arsenic CheckTM Field Test Kit 48119694
This arsenic field test kit shown in Figure 8 provides a safe, simple, and reliable method
to test for aqueous inorganic arsenic. It requires no electricity and no refrigeration. The
detection range is from 0 to 800 µg/L. The upper detection limit can be extended to 4000
µg/L with a simple 1 to 5 dilution. All components are supplied in the kit, including a
detailed description of the test method, a color chart, three chemical reagents with
material safety data sheets, three measuring spoons for the reagents, test strips, two
reaction bottles, four bottle caps, a thermometer, and a zip-loc test strips disposal bag.
Figure 8 Industrial Test Systems Arsenic CheckTM Field Test Kit 481196
The test results are determined by colorimetry. The color chart is standardized at 25°C,
starting at pure white for 0 µg/L arsenic, a tint of yellow for 5 µg/L arsenic, to slightly
more yellow at 10 µg/L, and increasing yellow intensity at 20, 50, 100, 200, and 500
µg/L. At 500 µg/L arsenic, the color is dark brown. It is recommended that the water
sample temperature be between 20°C and 30°C for accurate reading off the color chart.
This test tolerates up to 2 mg/L hydrogen sulfide and 0.5 mg/L antimony without test
Page 32
32
result interference. No interference from iron or sulfate was found. There are 100 tests
per kit, selling at $120 per kit.
Procedure
The chemistry of the reaction is based on the conversion of inorganic arsenic compounds
in water to arsine gas (AsH3) by the reaction of zinc dust and tartaric acid95.
1. First, a clean reaction bottle is filled with raw water to the 100 mL mark. Then,
three level pink spoons of reagent 1, tartaric acid, are added to the bottle. The
bottle is capped and shaken vigorously for 15 seconds. The tartaric acid is
dissolved. The contents are allowed to sit for 15 seconds.
2. Three level red spoons of reagent 2, which contains a mixture of ferrous salts as
reaction catalyst, are introduced. Again, the bottle is capped and shaken
vigorously for 15 seconds. The metal salts are dissolved. The content is allowed
to sit for 2 minutes.
3. Then three level white spoons of reagent 3, zinc dust, is added to the bottle and
shaken vigorously for 15 seconds. The bottle cap is replaced with another cap
that allows a test strip containing mercuric bromide to be inserted into the bottle.
4. The bottle is capped for the next 30 minutes. Both hydrogen gas and arsine gas
will bubble from the solution. The arsine gas then reacts with mercuric bromide
on the test strip to form mixed mercury halogens (such as AsH2HgBr) that appear
with a color change from white to yellow or brown.
5. At the end of 30 minutes, the test strip is taken out of the bottle and compared to
the color chart to determine the arsenic concentration. Because hydrogen may
cause an explosion, and arsine gas is toxic, it is highly recommended the test be
conducted in a well-ventilated* area away from fire and other sources of
ignition96.
This test kit was simple and easy to use while in remote locations in Nepal. No
complications or problems occurred in its use under these challenging field conditions.
* Study by Hussam et al showed the maximum arsine concentration in the immediate vicinity of some
arsenic test kits can be more than 35 times the threshold limiting value (TLV) of 50 ppbv of arsenic from a
single experiment with 100 ppb of total arsenic in solution.
Page 33
33
4.1.2 Graphite Furnace Atomic Adsorption Spectrometry (GFAAS)97
GFAAS is one of the USEPA methods for measuring arsenic in drinking water. Atomic
adsorption is based on the principle that atoms will absorb light at some characteristic
wavelength. These wavelengths are related to the atomic structure of an element and the
energy required for the promotion of its electrons from one quantum level to another.
Therefore each element has its own characteristic wavelength. A wavelength of 193.7
nm is recommended for arsenic. The amount of light absorbed by an element at a certain
wavelength can be correlated to the concentration of the element within the linear
calibration range. The reliable calibration range is as low as 1-5 µg/L, and as high as 200
µg/L. Dilution of samples with higher arsenic concentrations may be required. Chemical
interference may occur, but it can be ameliorated by the use of matrix modifiers. This
method is not suitable for field use because of its large size and the sensitivity of the
delicate components to transportation. The GFAAS requires electricity, but no
refrigeration. A GFAAS instrument is available for use in the R.M. Parsons Laboratory
at MIT.
Procedure
1. Water samples from Nepal were first preserved by adding a drop of 6 M
hydrochloric acid (HCl) per 10 mL of sample at the time of collection. The
acidification prevents the precipitation of aqueous iron that would otherwise
adsorb arsenic.
2. In the MIT laboratory, 1 mL of the water sample is carefully pipetted into a
specially made plastic vial for GFAAS analysis. The vial is placed on the
sampling dish. A set of standard arsenic solutions and matrix modifiers are also
placed on the sampling dish. The dish has a capacity of 75 samples.
3. A pre-programmed arsenic testing procedure is loaded on the GFAAS computer
control. Information on the test samples is entered into the computer.
Page 34
34
4. Click to start the test procedure. The instrument then automatically takes a small
amount of the sample and volatilizes the arsenic atoms by intense heating. Once
the atoms are excited, a monochrome lamp at 193.7 nm sends an optical beam
through the headspace above the sample. The instrument measures the absorption
and reports it as a peak focused around the 193.7 nm wavelength. The area under
the peak is numerically integrated. The integrated results are displayed on the
computer screen and on a printer printout.
5. By comparing the area under the peak of the sample water with standard arsenic
solutions, the concentration of the sample can be determined. Because of the
variances associated with the instrument, a standard calibration curve was
developed for every six to eight samples analyzed to maintain accurate
measurements.
4.2 Arsenic Speciation
Description
Arsenic speciation refers to the proportion of arsenic (III) to arsenic (V) in water.
Speciation is dependent on the groundwater chemistry. Speciation is an important
measure in many respects. For example, arsenic (III) is much more toxic than arsenic
(V)98. Arsenic (III) is charged thus more mobile than neutral arsenic (V) under normal
groundwater conditions. Furthermore, many current arsenic removal technologies can
effectively remove arsenic (V), but not arsenic (III). The arsenic speciation test was
performed using Bio-Rad Laboratory’s AG1-X8 ion exchange resin, 100-200 mesh,
acetate form.
4.2.1 Bio-Rad Laboratory’s AG1-X8 Ion-exchange Resin
The fundamental requirement for the arsenic speciation test is the separation of arsenic
(III) from (V) in the water99, 100. While there are many separation methods, the Bio-Rad
Laboratory’s AG1-X8 ion exchange resin, 100-200 mesh, acetate form is based on ion-
Page 35
35
exchange. Ion exchange processes are chemical reactions between ions in solution and
ions in an insoluble solid phase. Depending on the ion-exchange media, certain aqueous
ionic species are removed by the ion-exchange solid. Since electron-neutrality must be
maintained, the solid releases replacement ions to the solution101. For the case of arsenic
speciation at a pH range of 2 to 9, arsenic (III) is an uncharged aqueous species while
arsenic (V) is a negatively charged aqueous species. The AG1-X8 resin is an ion
exchange resin that only attracts and binds arsenic (V) in the solution. Virtually all
arsenic (V) can be removed by the resin, leaving behind only arsenic (III) in the solution.
Then the arsenic (III) solution can be tested for arsenic content. By comparing this result
with water sample containing both arsenic (III) and (V), the amount of arsenic (V) can be
easily determined by a simple subtraction.
Procedure
1. The pH of the water sample is checked with a pH meter. If the pH falls within 2-
9, then no pH adjustment is required. Otherwise, pH adjustment using strong acid
such as HCl or strong base such as NaOH is necessary.
2. For every 10mL of water sample collected, 0.2 g of resin is needed. In case that a
balance is not available, the resin has a density of 0.75 g/mL. The desired resin
weight can be determined by measuring the required volume in a graduated
cylinder. When in doubt, use more resin than prescribed.
3. For samples collected in mailer tubes that have a volume of about 14 mL, 0.3-0.4
g of resin was added to the sample. The tube is capped and shaken vigorously for
5 minutes. The shaking action allows efficient contact between the resin and
arsenate species. Virtually all arsenate is adsorbed onto the ion-exchange resin
within 5 minutes. Because arsenic (V) is very strongly adsorbed onto the resin,
the vigorous shaking is not going to release the arsenic (V) back into the solution.
4. The content is then left undisturbed for 5 minutes. The resin settles to the bottom
of the tube. The supernatant, containing only arsenic (III), is decanted into a
clean mailer tube. This water sample is preserved by acidification with HCl as
described before.
Page 36
36
5. Another mailer tube is used to collect a water sample containing total inorganic
arsenic. This sample is preserved by acidification with HCl as well.
6. The two sample sets (arsenic (III) only and total arsenic) are then brought back to
MIT to be analyzed by the GFAAS.
4.3 pH Description
pH is a measure of the acidity of a solution. It is a very important water quality
parameter because in natural water, many chemical reactions associated with the
formation, alteration, and dissolution of minerals are pH dependent102. This is especially
true for carbonate minerals, as the equilibrium of carbon dioxide (CO2), bicarbonate
(HCO32-), and carbonate (CO3
2-) are dictated by pH103. Many biological activities, such
as photosynthesis and respiration, are also influenced by pH through their respective
abilities to decrease and increase the concentration of dissolved carbon dioxide104. As a
result, an observed change in pH may provide clues on the types and direction of
reactions occurring in a solution. Another use of pH is that the protonation of many
species are dependent on pH, such as arsenic (III) and (V). In addition to pH’s
significance in chemical reactions, pH is also a key aesthetic objective in drinking water.
For example, the US National Secondary Drinking Water Regulation (NSDWR) sets a
pH guideline of 6.5 to 8.5105. In this arsenic study, pH in the field site was tested with
two methods: Digi-Sense Digital pH/mV/ORP meter by Cole Parmer, and pH Test Strips
by Industrial Test Systems.
4.3.1 Cole Parmer Digi-Sense Digital pH/mV/ORP Meter EW-5938-50
The Cole Parmer pH meter measures pH using a combination electrode. The electrode
incorporates both glass and reference electrodes in one body106. The pH-sensitive part of
the electrode is the thin glass bulb at the bottom of the electrode. When the electrode is
immersed in a solution, the electric potential difference across the two electrodes is
measured and converted to a pH reading107.
Page 37
37
Procedure
1. The pH meter must be calibrated before use. Calibration solutions are prepared
with pH buffer tablets. Three buffer solutions must be prepared, at pH = 4, pH =
7, and pH = 10.
2. The temperature of the buffer solutions are measured and entered into the pH
meter.
3. The electrode is dipped into the pH = 7 buffer solution. The pH reading on the
meter is set to 7.
4. Then the electrode is dipped into the pH = 4 buffer solution. Adjust the slope
screw on the meter to a pH reading of 4. Now the pH meter is ready for use, with
accuracy optimized for solutions with pH between 4 to 7. If the expected solution
pH is above 7, then the pH = 10 buffer solution is used instead of the pH = 4
buffer solution. The slope screw is adjusted to a pH reading of 10.
5. Since pH is temperature dependent, it is important to enter the solution
temperature into the meter in order to obtain the best readings.
6. The pH electrode should be immersed in a strong KCl solution (use tap water if
KCl is not available) when not in use.
4.3.2 Industrial Test Systems pH Test Strips 4800005
The test strips are very easy for field study use. The test strips come in a bottle of 50
strips. Printed on the bottle is a color chart corresponding to pH values from 6.0 to 9.0 at
a 0.5 interval. Due to the proprietary nature of the product, the author was unsuccessful
in obtaining details on the underlying chemistry of how the strips work.
Procedure
1. A test strip is taken out from the bottle, and immersed in the sample solution for
10 seconds without any motion.
2. Remove and immediately match the color on the strip with the color chart. Color
on the strip will start to fade after 15 seconds.
Page 38
38
4.3 Oxidation-Reduction Potential (ORP) Description
Oxidation and reduction (redox) reactions involve the transfer of electrons. Redox
reactions are important because they mediate the behavior of many chemical constituents
in drinking water108. Arsenic is an excellent example. The speciation of arsenic is
dependent on the redox potential of the solution. While redox potential is an exact
chemical quantity, ORP is an approximate measurement of the redox potential of a
solution. Digi-Sense Digital pH/mV/ORP meter by Cole Parmer was used in the field
study to measure ORP.
4.3.1 Cole Parmer Digi-Sense Digital pH/mV/ORP Meter EW-5938-50
The measurement of ORP is based on the potential difference measured between a
measuring electrode and a reference electrode. For the Cole Parmer meter, the reference
electrode for ORP is identical to that for pH measurements. When the electrode is
immersed in a solution containing a reversible chemical reaction system, a migration of
electrons is established between the electrode and the system. The electron flow is
measured and converted to an ORP reading109.
Procedure
1. ORP calibration is not performed on the meter because the procedure is not
explained in the user manual.
2. Place the electrode into a sample solution. Select ORP mode on the meter.
Record ORP value when the reading stabilizes.
4.4 Total Alkalinity Description
Alkalinity of water is its acid-neutralizing capacity. Total alkalinity can be defined as the
sum of all the titratable bases110, 111. In groundwater, where the carbonate system is the
dominant buffering system, alkalinity is primarily a function of pH, bicarbonate, and
Page 39
39
carbonate*. Therefore, it can be taken as an indication of the concentration of these
constituents112,113. In this arsenic study, the total alkalinity was measured with Total
Alkalinity Test Strips by Industrial Test Systems.
4.4.1 Industrial Test Systems Total Alkalinity Test Strips
The test strips are very easy for field study use. The test strips come in a bottle of 50
strips. Printed on the bottle is a color chart corresponding to total alkalinity values of 0,
80, 120, 180, 240, and 360 mg/L. Due to the proprietary nature of the product, the author
was unsuccessful in obtaining details on the underlying chemistry of how the strips work.
Procedure
1. A test strip is taken out from the bottle, and immersed in the sample solution for
10 seconds without any motion.
2. Remove and immediately match the color on the strip with the color chart. Color
on the strip will start to fade after 15 seconds.
4.5 Total Hardness as CaCO3
Description
Hardness is a measure of the total amount of calcium and magnesium** that has naturally
leached into the water, as mg/L of calcium carbonate. If the subsurface contains
abundant calcium and magnesium rich formations, such as calcite (CaCO3) and dolomites
(CaCO3•MgCO3), then the groundwater from that region may have high hardness.
Hardness of more than 300 mg/L as CaCO3 is consider excessive for public use because
of high soap consumption and formation of scale in water fixtures114. Most people prefer
* Total Alkalinity ≈ -[H+] + [OH-] + [HCO3
-] + 2[CO32-] given that the carbonate system is the only
significant buffer system ** Although ions of iron, manganese, strontium, and aluminum also produce hardness, they are not present
in significant quantities in natural water.
Source: Viessman, W., Hammer, M. “Water Supply and Pollution Control.” 6th Edition. Addison-Wesley
Longman, Inc.: Menlo Park, CA. USA. 1998.
Page 40
40
water of less than 150 mg/L hardness115. Hardness was measured in this study with Total
Hardness (as calcium carbonate) Test Strips made by WaterWorksTM
4.5.1 WaterWorksTM Total Hardness (as calcium carbonate) Test Strips
The test strips are very easy for field study use. The test strips come in a pack of 30
individually wrapped strips. Found in the pack is a color chart corresponding to hardness
values of 0, 40, 80, 120, 180, 250, and 425 mg/L as CaCO3. Due to the proprietary
nature of the product, the author was again unsuccessful in obtaining details on the
underlying chemistry of how the strips work.
Procedure
1. A test strip is immersed in the sample solution for three seconds.
2. Remove and immediately match the color on the strip with the color chart. Color
on the strip is stable for one minute.
4.6 Total Soluble Iron Description
The two most common oxidation states for groundwater iron are Fe(+II) and Fe(+III)116.
Soluble iron refers to mostly Fe(II) because it is highly soluble. The solubility of Fe(III)
is very low. Iron is a very important water quality parameter in this arsenic study
because iron hydroxide, Fe(OH)3, is a strong adsorbent for arsenic117. Therefore, the
presence of high iron can aid arsenic removal. Iron was measured in the field sites in
Nepal using Chemetics Inc.’s CHEMetsR Iron Kit K-6010.
4.6.1 CHEMetsTM Iron Kit K-6010
The iron test kit is simple to use. The test kit contains 30 ampoules, a sample cup, a
bottle of A-6000 Activator Solution, and two sets of colour comparator. The first set of
color comparator is for iron range of 0 to 1.0 mg/L at 0.1 mg/L intervals. The second set
Page 41
41
is for iron range of 1 to 10 mg/L at 1 mg/L interval. The iron concentration
quantification is based on colorimetry. Each molecule of soluble iron in water is chelated
by three molecules of phenanthroline in the reagent ampoules to produce an orange-red
complex118. The colored solution obeys Beer’s law; the higher the iron concentration, the
intenser the orange-red colour. Quantitative manganese concentration is determined by
comparison to the standardized colour comparator.
Procedure
1. Fill the sample cup to the 25mL mark with sample water
2. Place the reagent ampoule in the sample cup and snap the tip by pressing the glass
ampoule against the side of the cup. Because the ampoule is vacummized, sample
water would flow into the ampoule. The ampoule contains phenanthroline.
3. Invert the ampoule several times to thoroughly mix its contents. Wait one minute
for colour development
4. Compare the colour of the ampoule with the standard colour comparators to
determine the iron concentration.
4.7 Manganese Description
Manganese is an important water quality parameter because it can catalyze the oxidation
of arsenic (III) to arsenic (V)119, 120. Manganese was measured in the field sites in Nepal
using Chemetics Inc.’s CHEMetsR Manganese Kit K-6502.
4.7.1 CHEMetsTM Manganese Kit K-6502
The manganese test kit is simple to use. The test kit contains 30 ampoules, a sample cup,
a bottle of A-6500 Activator Solution, and a color comparator. The kit has a detection
range of 0 to 2 mg/L of manganese. The kit is suitable for field study use.
The manganese concentration quantification is based on colorimetry. Manganese in
water reacts with sodium meta periodate in reagent ampoules, and the manganese
activator solution to produce a purple color. The higher the manganese concentration, the
Page 42
42
intenser the purple colour. Quantitative manganese concentration is determined by
comparison to the standardized colour comparator.
Procedure
1. Fill the sample cup to the 5mL mark with sample water.
2. Five drops of the A-6500 Manganese Activator Solution is added to the sample
cup. The Activator Solution contains citric acid, sodium sulfate, sodium
phosphate, and deionized water. Use the tip of a glass ampoule to mix the content
of the sample cup.
3. Place the ampoule in the sample cup and snap the tip by pressing the glass
ampoule against the side of the cup. Because the ampoule is under negative
pressure, sample water will flow into the ampoule.
4. Invert the ampoule several times to thoroughly mix its contents. Wait one minute
for colour development
5. Compare the colour of the ampoule with the standard colour comparator to
determine the manganese concentration.
Page 43
43
CHAPTER 5 ARSENIC REMOVAL TECHNOLOGY
The arsenic removal technology evaluated in this thesis is based on two proprietary
products designed, manufactured, and distributed by a Massachusetts firm, Aquatic
Treatment Systems, Inc121. The two products are Poly-Benzyl Pyridinium Tri-Iodide
(BP/I3) and Activated Alumina Manganese Oxide (A/M). The description of the BP/I3 and
A/M is explained first, followed by the apparatus setup. Refer to Appendix A.1, A.2 for
the company profile, and the material safety data sheets (MSDS) for both media.
5.1 Poly-Benzyl Pyridinium Tri-Iodide (BP/I3) Description
BP/I3 media is designed to provide an on-demand* oxidant to convert arsenic (III) to
arsenic (V). It is made from a water insoluble, porous polymer (poly-benzyl pyridinium).
BP/I3 media is a quaternary amine (pyridinium) divinylbenzene copolymer in the tri-
iodide form, with 35-65% water122. Figure 9 shows the structure of the BP/I3 media.
BP/I3 is a dark brown, free flowing polymer bead with mean diameter of 568 micron (28
mesh)123. It is easily handled in open air and has no odor. Fluid containing reducing
species such as sulfide, sulfite, iron (II) and arsenic (III) are readily oxidized on-demand
when contacted by BP/I3124. The dark brown color of the media turns into a light tan
color as its oxidizing capacity is exhausted. Therefore, the remaining useful life of the
BP/I3 can be easily determined.
* On-demand means that the BP/I3 oxidizes only when in contact with a reducing agent. BP/I3 remains
inert when reducing agents are not present.
Page 44
44
Figure 9 The Chemical Structure of Poly-Benzyl Pyridinium Tri-Iodide
BP/I3 is very stable, and does not deteriorate upon drying. Iodide on the media is released
during oxidation. However, the iodide is subsequently re-captured on the benzyl
pyridinium polymer. No detectable iodide should be found in the treated water. As a
result, unlike ion-exchange, no by-products are found in the treated water125. BP/I3 is
produced in a manufacturing facility exclusively for Aquatic Treatment Systems, Inc.
under supervision and quality control by the company. It is suitable for use as a food
grade material.
Oxidation Mechanism
For arsenic (III), a contact time of as little of one second can completely oxidize it into
arsenic (V)126. The quick oxidation is due to iodide. In the presence of oxygen, the
oxidation of arsenic (III) to (V) is catalyzed by iodide127. To achieve the one-second
reaction rate, arsenic must be in contact with iodide. One of the best contact methods is
in a flowing bed. Ideally, water containing arsenic should flow through a BP/I3 bed. If
the bed is not flowing, as in standing water, arsenic in the water can only reach the iodide
by diffusion mass transfer. Diffusion can be a slow process128.
Oxidation Capacity
The capacity of BP/I3 in terms of equivalents of oxidizing power is 0.250 mol/L. This
means every liter of BP/I3 can accept up to 0.25 moles of electrons for oxidation
Page 45
45
purpose129. The volume of water treated depends on the nature of the water and amount
of dissolved reducing species. The following calculation shows the theoretical amount of
arsenic (III) that can be oxidized with 1 L of BP/I3.
Consider a 1 L solution containing pure water and 1000 µg of arsenic (III). The
molecular weight of arsenic is 74.9 g/mol130. Therefore 1000 µg arsenic = 0.00001335
mol arsenic. In this solution, arsenic (III) is the only reducing agent. To convert arsenic
(III) to (V), two moles of electrons are given up per mole of arsenic. As a result,
0.0000267 mol of electrons is released. Given that 1 L of BP/I3 can accept up to 0.25
mol of electrons, therefore 1 L of BP/I3 can treat up to about 9360 L of a 1000 µg/L
arsenic (III) solution. For a household that uses about 50 L of drinking water per day*,
9460 L represents about 187 days (or 6 months) of water use**.
In actual practice, the volume of water treated can be much lowered. This is because the
presence of other reducing agents in the solution will deplete BP/I3 as well. For example,
groundwater may contain 10 mg/L of iron (II). The molecular weight of iron is 55.8
g/mol131. Therefore 10 mg of iron (II) = 0.000179 mole of iron. Each mole of iron (II)
releases one mole of electron to oxidize to iron (III). As a result, 0.000179 mole of
electrons is released. Given that 1 L of BP/I3 can accept up to 0.25 mol of electrons,
therefore 1 L of BP/I3 can treat only 1400 L of a 10 mg/L iron (II) solution. For a
household that uses about 50 L of drinking water per day, 1400 L represents about 28
days (or < 1 month) of water use***. If there are other reducing agents in the water, such
as sulfides and arsenic (III), then the volume treated by BP/I3 can be even less. Removal
of iron, sulfide, and other non-arsenic reducing agents by alternative methods is therefore
recommended in order to prolong the life of BP/I3132.
* Based on a household of 5 people, each use 10 L of drinking water for drinking, cooking and other
purposes. ** Based on 1000 µg/L of arsenic (III) in raw water and no other reducing agent. *** Based on 10 mg/L of iron (II) in raw water and no other reducing agent.
Page 46
46
Disinfection
In addition to its oxidizing capacity, BP/I3 has also demonstrated ability to disinfect.
Preliminary studies by the company showed positive disinfection results with
Pseudomonas Aeruonosa, Legionella, total coliform, and E. Coli133. However, the
disinfecting properties of BP/I3 will not be studied in this thesis.
Disinfection Mechanism
In a packed bed of BP/I3, there are intra-granular pores on the media surface and
intergranular pores between the particles. When raw water containing pathogens passes
through a packed bed of BP/I3, some of the pathogens are trapped in the inter-granular
pores, while some are trapped in the intra-granular pores. Trapping in either type of
pores is the primary mechanism to remove pathogens134. If the water is not flowing, as in
standing water, or if the BP/I3 is used in a jar test, then pathogens are not trapped. In
addition to the above mechanism, a second pathogen removal process is by
disinfection/oxidation135. The triiodide (I3) is a disinfectant because of its strong
oxidative capability. Pathogens can be inactivated by oxidation.
Cost
BP/I3 is sold by Aquatic Treatment Systems, Inc. at a price of US$1000 per cubic foot136.
It is currently available only in the mainland U.S. Tim Badger of Aquatic Treatment
Systems, Inc. is currently in negotiating with a firm in Hyderabad, India to manufacture
BP/I3. The selling price in the Indian-subcontinent will be at least 25% less than the
U.S.137 However, Paul Smith of Aquatic Treatment Systems, Inc. does not think the
Indian deal will be successful, casting doubt that BP/I3 will be available in Asia in the
near future138.
Page 47
47
5.2 Activated Alumina Manganese Oxide (A/M) Description
The A/M media is designed to adsorb arsenic (V). It also has a limited ability to oxidize
arsenic (III) to (V). The chemical structure of the media is not available, but it is based
on some proprietary modification of activated alumina.
The A/M media appears as very dark brown granules. It is easily handled in open air and
has no odor139. It requires no chemical additions to achieve complete arsenic removal.
Temperature, pH, and contaminants affect little or no change in the adsorption
performance of the A/M media140. Because arsenic binds so strongly to the A/M media,
arsenic will not leach off. The A/M media is not designed for regeneration. This media
is approved by the USEPA under NSF 61 protocol as a safe non-hazardous solid waste141.
Direct disposal can be a safe alternative to the generation of arsenic waste upon
regeneration.
Adsorption Mechanism
Water containing arsenic (III) is first oxidized to arsenic (V). Then, arsenic (V) is
permanently adsorbed on the A/M media by complexation reactions with the A/M
media142. The new complex is stable. In order to improve the efficiency of arsenic
removal, water containing arsenic should flow through a pack bed of A/M media. The
water flowrate should not exceed 0.8 bed volumes per minute for arsenic concentration
above 2500 µg/L, and should not exceed 1.0 bed volumes per minute for lower arsenic
concentration to achieve optimal arsenic removal143.
Adsorption Capacity
The company claims each volume of A/M media can treat in excess of 80 000 volumes of
water contaminated with 100 µg/L arsenic. The presence of sulfate and/or fluoride does
not significantly affect the arsenic removal results. The treated water should consistently
remove arsenic to below detectable levels of 2 µg/L. Figure 10 shows an experiment
Page 48
48
done by the company to determine the oxidation and adsorption capacity of the A/M
media.
Figure 10 Oxidizing and Adsorption Capacity of A/M Media
Cost
A/M is sold by Aquatic Treatment Systems, Inc. at a price of US$100 per cubic foot144.
It is currently available only in the mainland U.S. Tim Badger of Aquatic Treatment
Systems, Inc. is currently in negotiating with a firm in Hyderabad, India to manufacture
BP/I3. The selling price in the Indian-subcontinent will be at least 25% less than the
U.S.145 However, Paul Smith of Aquatic Treatment Systems, Inc. does not think the
Indian deal will be successful, casting doubt that A/M will be available in Asia in the
near future146.
Page 49
49
5.3 Apparatus Setup
5.3.1 A/M Only System
The A/M only system consisted of a clear plastic column, a spigot, a piece of felt, A/M
media, and a metal retort stand with clamps. The column was 2 3/4 inch (7 cm) in
diameter and 94 cm tall. A spigot was connected to the bottom end of the column to
control the water flow. A round piece of felt 0.5 cm thick and 7 cm in diameter sat inside
the column just above the spigot. 800 mL of prepared A/M media was contained in the
column above the felt. The purpose of the felt was to block any A/M from leaving the
column. The A/M occupied about 34 cm height of column. The top 60 cm height of the
column served as a water reservoir. The column was secured to the metal retort stand
with 2 plastic clamps.
On account of its current production method, the A/M must be prepared before use. The
raw A/M media contained impurities such as dirt that may foul the system and/or discolor
the water. The A/M preparation was simple. 800 mL of A/M was first measured in a 1 L
plastic beaker. Arsenic-free water was then added to the beaker. The content was stirred
and the cloudy supernatant was discarded. The rinsing procedure was repeated for 10
times, using about 10 L of water in total. Now the A/M was ready for use.
The cost of 800 mL of A/M media was about US$2.83 based on US$100 per cubic foot*.
5.3.2 BP/I3 & A/M System
The BP/I3 & A/M system setup was similar to the A/M only system except that an extra
400 mL of BP/I3 was used. The BP/I3 & A/M system consisted of a clear plastic column,
a spigot, a piece of felt, A/M media, BP/I3 media, and a metal retort stand with clamps.
The column was 2 3/4 inch (7 cm) in diameter and 100 cm in height. A spigot was
connected to the bottom end of the column to control the water flow. A round piece of
felt 0.5 cm thick and 6 cm in diameter sat inside the column just above the spigot. 800 * 1 cubic feet = about 28.3 L
Page 50
50
mL of prepared A/M was contained in the column above the felt. 400 mL of BP/I3 was
placed directly on top of the A/M. The purpose of the felt was to block any A/M from
escaping the system. The A/M and the BP/I3 occupied about 33 cm and 20 cm height of
column respectively. The top 47 cm height of the column served as a water reservoir.
The column was secured to the metal retort stand with 2 plastic clamps. See Figure 11
for a schematic diagram showing the setup of the A/M only and the BP/I3 & A/M
systems. Figure 12 shows a picture of the actual BP/I3 & A/M systems.
Figure 11 Schematic Diagram Showing the Setup of the A/M Only and the BP/I3 &
A/M Treatment Systems.
Raw water entered here
Water Reservoir
400 mL BP/I3
800 mL A/M
Raw water entered here
Treated water exited here Treated water exited here
A/M only system BP/I3 & A/M system
Page 51
51
Figure 12 The Actual Column Used in this Arsenic Study
The preparation of A/M was the same as was previously discussed. The BP/I3 must also
be prepared before use in order to remove impurities. The preparation procedure for
BP/I3 was identical to A/M.
The cost of 400 mL of A/M media was about US$14.13 based on US$100 per cubic
foot*. * 1 cubic feet = about 28.3 L
Water
Reservoir
BP/I3
A/M
Page 52
52
CHAPTER 6 EXPERIMENT SETUP AND PROCEDURES
There are three main part of the field study. They are
• Arsenic Removal Technology Evaluation
• Arsenic Speciation of Tubewell Water
• Arsenic Oxidation Kinetics
6.1 Arsenic Removal Technology Evaluation Two treatment systems were setup Parasi, one with A/M media only, and the other with
BP/I3 & A/M media. The technical performance of both systems were measured and
compared.
6.1.1 Apparatus Setup
A/M only system
Equipment needed to evaluate the A/M only arsenic removal system included a pH/ORP
meter, a thermometer, some mailer tubes, some sampling bottles of at least 100 mL
volume, and the A/M only treatment system column as described in Chapter 5.
BP/I3 & A/M system
Equipments needed to evaluate the BP/I3 & A/M arsenic removal system included a
pH/ORP meter, a thermometer, some mailer tubes, some sampling bottles of at least 100
mL volume, an the BP/I3 & A/M treatment system column as described in Chapter 5.
6.1.2 Field Experiment
A/M only system
The A/M only system was tested four times in the town of Parasi in the Nawalparasi
District. Refer to Figure 13 for a map showing the different districts of Nepal.
Page 53
53
Figure 13 Map of Nepal Showing all Districts
Page 54
54
Nawalparasi and Rupandehi are in central south. Parasi is a town in the Nawalparasi
District. This is the town where the author stayed from Jan 6, 2002 to Jan 14, 2002. The
first test was conducted on Jan 10, 2002 with raw water from the tubewell in the
backyard of the author’s residence. The second test was conducted on Jan 11, 2002 with
raw water from a tubewell in front of a restaurant in the town center. The third test was
conducted on Jan 13, 2002 with raw water from a tubewell in front of a shop across the
street from the author’s residence. The fourth test was conducted on Jan 14, 2002 with
raw water from the backyard tubewell again. See Appendix B for a map showing these
well locations. In all the above tests, water quality parameters for the raw water were
measured including pH, temperature, oxidation-reduction-potential (ORP), total soluble
iron, total arsenic, arsenic (III), manganese, hardness, and alkalinity. Then the column
was flushed with three liters of raw water before a treated water sample was taken. The
flushing was intended to purge any water remaining from prior tests (i.e. memory effect).
This ensures that the treated water sample comes from freshly input raw water. The
treated water was also analyzed for the above water quality parameters. In addition to
these water quality tests, two to three flowrate measurements were done on each run
using a 100 mL plastic graduated cylinder.
BP/I3 & A/M system
The A/M only system and the BP/I3 & A/M system were tested simultaneously on the
four occasions in the Parasi. In addition to these four Parasi tests, the BP/I3 & A/M
system was tested at five more locations, while the author was staying in the city of
Butwal in Rupandehi District from Jan 15, 2002 to Jan 22, 2002. The fifth test was
conducted on Jan 16, 2002 with raw water from a well in the village of Madangram in the
Devdaha village development committee (VDC) in the Rupandehi district. The sixth test
was conducted on Jan 16, 2002 in the village of Madangram as well. The seventh test was
conducted on Jan 17, 2002 in the village of Bangali in the Devdaha VDC of Rupandehi
District. The eighth test was conducted on Jan 20, 2002 in the village of Kirtipur-1 in the
Sunwal VDC of Nawalparasi District. The ninth test was conducted on Jan 21, 2002 in
the village of Khakaribari in the Sunwal VDC. These wells were chosen because of their
Page 55
55
known high arsenic concentrations. The test procedure for the A/M & BP/I3 system was
identical to the A/M only system. Table 1 summarizes all the test dates and locations.
Table 1 Summary of Arsenic Removal Technology Test Dates and Locations
Run
#
Date Village/
Town
VDC District Test on
A/M only
Test on
BP/I3 & A/M
1 Jan 10, 02 Parasi Parasi Nawalparasi Yes Yes
2 Jan 11, 02 Parasi Parasi Nawalparasi Yes Yes
3 Jan 13, 02 Parasi Parasi Nawalparasi Yes Yes
4 Jan 14, 02 Parasi Parasi Nawalparasi Yes Yes
5 Jan 16, 02 Madangram Devdaha Rupandehi No Yes
6 Jan 16, 02 Madangram Devdaha Rupandehi No Yes
7 Jan 17, 02 Bangali Devdaha Rupandehi No Yes
8 Jan 20, 02 Kirtipur-1 Sunwal Nawalparasi No Yes
9 Jan 21, 02 Khakaribari Sunwal Nawalparasi No Yes
6.2 Arsenic Speciation of Tubewell Water Raw water speciation refers to the determination of the ratio of arsenic (III) to total
arsenic. This test was conducted at 37 tubewells throughout Rupandehi and Nawalparasi
Districts between Jan 16, 2002 and Jan 21, 2002.
6.2.1 Apparatus Setup
Equipment needed to carry out raw water speciation tests included a pH/ORP meter, a
thermometer, some mailer tubes, some sampling bottles of at least 100 mL volume,
strong-ion exchange resin.
Page 56
56
6.2.2 Field Experiment
At each of the wells, the pH and ORP of the well water was measured. A water sample
containing total arsenic and a water sample containing arsenic (III) were collected in
mailer tubes. The thermometer was used to adjust the pH and ORP readings, as they
were temperature dependent. Refer to Chapter 4 – Analytical Methods for detailed
description on how to obtain a water sample of arsenic (III) only. After on-site tests and
sample collections, detailed records on each of the visited wells were gathered at the
office of DIDC (formerly FINNIDA). Refer to Appendix G.1 and G.2 for the records.
Their database contained the well location (i.e. village/town, VDC, district), well number,
contact person, well type, number of household sharing the well, actual number of users,
well depth, well age, agencies who constructed the well, previous arsenic records,
number of cases of arsenic health effects, and microbiological safety. Table 2 shows the
test dates and locations of these 37 wells.
Table 2 Summary of Arsenic Speciation of Tubewell Tests Dates and Location
SN Date
visited
Contact person Village/
Town
VDC District
1 Jan 16, 02 Dina Nath Bhandari Madangram Devdaha Rupandehi
4 Jan 16, 02 Bir Bahadur Gurung Madangram Devdaha Rupandehi
5 Jan 16, 02 Maha
Sharma(Bhandari)
Madangram Devdaha Rupandehi
8 Jan 16, 02 Somnath Poudel Madangram Devdaha Rupandehi
36 Jan 17, 02 Yam Kumari Magar Mukhiya tol Devdaha Rupandehi
37 Jan 17, 02 Nildhwaj Malla Mukhiya tol Devdaha Rupandehi
43 Jan 17, 02 Loknath Pandey Bangali Devdaha Rupandehi
49 Jan 17, 02 Dhan Bd. Gurung Bangali Devdaha Rupandehi
50 Jan 17, 02 Dhanjaya Sapkota Bangali Devdaha Rupandehi
76 Jan 16, 02 Maha Sharma Madangram Devdaha Rupandehi
78 Jan 17, 02 Ishwor Pd.Pandey Madangram Devdaha Rupandehi
79 Jan 17, 02 Dolaraj Pangini Madangram Devdaha Rupandehi
Page 57
57
81 Jan 17, 02 Gangadhar Dhakal Madangram Devdaha Rupandehi
90 Jan 16, 02 Krishna Rayamajhi Madangram Devdaha Rupandehi
91 Jan 16, 02 Shahadev Chaudhary Madangram Devdaha Rupandehi
4 Jan 21, 02 Dhanchour Budathki Sunwal Sunwal Nawalparasi
16 Jan 21, 02 Hari Bdr. Kandel Assamwasi Sunwal Nawalparasi
17 Jan 21, 02 Pashu Ram Bhandari Khaireni Sunwal Nawalparasi
23 Jan 20, 02 Om Prakash Puna Kirtipur-1 Sunwal Nawalparasi
24 Jan 20, 02 Churamani Aale Kirtipur-1 Sunwal Nawalparasi
25 Jan 20, 02 Rana Bdr. Darlami Kirtipur-1 Sunwal Nawalparasi
27 Jan 20, 02 Kul Pd. Bhattarai Kirtipur-1 Sunwal Nawalparasi
28 Jan 20, 02 Basant Bhattarai Kirtipur Sunwal Nawalparasi
29 Jan 20, 02 Hemlal Burung Kirtipur Sunwal Nawalparasi
30 Jan 20, 02 Ranmati Budhathoki Kirtipur Sunwal Nawalparasi
36 Jan 20, 02 Hailal Gurung Kirtipur-2 Sunwal Nawalparasi
37 Jan 20, 02 Umashankar Sharma Kirtipur-2 Sunwal Nawalparasi
39 Jan 20, 02 Harimaya Hamal Kirtipur-2 Sunwal Nawalparasi
48 Jan 21, 02 Bhumilal Dhakal Bisasaya Sunwal Nawalparasi
67 Jan 21, 02 Narendra Bdr. Shrestha Chauraha Sunwal Nawalparasi
79 Jan 21, 02 Jokhu Kunwar Khakaribari Sunwal Nawalparasi
85 Jan 21, 02 Dhanpati Bhattarai Khakaribari Sunwal Nawalparasi
86 Jan 21, 02 Nepalnath Kunwar Khakaribari Sunwal Nawalparasi
87 Jan 21, 02 Gangaram Kunwar Khakaribari Sunwal Nawalparasi
164 Jan 20, 02 Min Bd. Curung Kirtipur Sunwal Nawalparasi
166 Jan 20, 02 Chit Maya Curung Kirtipur Sunwal Nawalparasi
? Jan 21, 02 Sunwal VDC Sunwal Sunwal Nawalparasi
Page 58
58
6.3 Arsenic Oxidation Kinetics The objective of the kinetics experiment was to determine the rate at which arsenic (III)
oxidizes to arsenic (V) under natural aeration in an undisturbed environment.
6.3.1 Apparatus Setup
The apparatus required included a 1 L plastic beaker, a pH/ORP meter, a thermometer,
and a clock.
6.3.2 Field Experiment
On Jan 12, 2002, the 1 L plastic beaker was filled with raw water from the backyard well
in Parasi. The beaker was left undisturbed and uncovered for the next three days. The
water temperature, pH, and ORP were measured at 18 different intervals over an
approximately three days time period after the initial water collection. Arsenic speciation
tests were performed at all of these time intervals. Table 3 shows the time and date for
these 18 data points.
Table 3 Summary of Oxidation Kinetics Tests Dates and Time
Data
point #
Date Time Hours since initial
water collection
1 Jan 12, 02 12 noon 0
2 Jan 12, 02 12:15 pm 0.25
3 Jan 12, 02 12:30 pm 0.5
4 Jan 12, 02 12:45 pm 0.75
5 Jan 12, 02 1:00 pm 1.0
6 Jan 12, 02 1:30 pm 1.5
7 Jan 12, 02 2:00 pm 2.0
8 Jan 12, 02 2:30 pm 2.5
9 Jan 12, 02 3:30 pm 3.5
Page 59
59
10 Jan 12, 02 5:00 pm 5.0
11 Jan 12, 02 9:00 pm 9.0
12 Jan 13, 02 8:30 am 20.5
13 Jan 13, 02 11:00 am 23.0
14 Jan 13, 02 2:15 pm 26.25
15 Jan 13, 02 5:00 pm 29.0
16 Jan 14, 02 8:30 am 44.5
17 Jan 14, 02 1:00 pm 49.0
18 Jan 15, 02 8:30 am 68.5
Page 60
60
CHAPTER 7 RESULTS AND DISCUSSIONS
In this section, the results for the arsenic removal technology evaluation will be discussed
first, followed by the arsenic speciation of tubewell results and then the arsenic oxidation
kinetics results.
7.1 Arsenic Removal Technology Evaluation
The A/M only system was tested on four occasions in Nepal. The BP/I3 & A/M system
was tested at five additional locations. For each of the nine runs, the following items
were measured:
• Arsenic removal
• pH
• Oxidation-Reduction Potential (ORP)
• Total alkalinity
• Total hardness as CaCO3
• Total soluble iron
• Manganese
• Flowrate
Detail results for each of these individual tests are in Appendix F.
7.1.1 Arsenic Removal Results
Table 4 shows a summary of the arsenic removal results. For the nine runs, the raw water
total arsenic ranged from 147 µg/L to 863 µg/L. The well with 863 µg/L total arsenic
was the highest arsenic concentration in DIDC’s (formerly FINNIDA’s) 1508 well data
set. The percentage of arsenic (III) ranged from 73% to 100%. All treated water from
the A/M only system contained non-detect level of total arsenic (i.e. < 5 µg/L) from the
field test kit. Therefore the A/M was 97-99% effective, and consistently reduce total
Page 61
61
arsenic to less than the WHO standard of 10 µg/L. For the BP/I3 & A/M system, all
treated water contains non-detect level of total arsenic as well.
Table 4 Summary of Arsenic Removal Results
Run
#
Raw water
total
arsenic
(µg/L)
As(III)
as % of
total
arsenic
A/M only
treatment
total arsenic
(µg/L)
%
arsenic
removal
BP/I3 & A/M
treatment total
arsenic (µg/L)
%
arsenic
removal
1 242 91 < 5 > 98 < 5 > 98
2 152 89 < 5 > 97 < 5 > 97
3 337 91 <5 > 99 < 5 > 99
4 323 73 < 5 > 98 < 5 > 98
5 863 94 Not tested N/A < 5 > 99
6 328 98 Not tested N/A < 5 > 98
7 149 77 Not tested N/A < 5 > 97
8 328 81 Not tested N/A < 5 > 98
9 147 100 Not tested N/A < 5 > 97
Discussion of results
By comparing the arsenic removal results between the A/M only system and the BP/I3 &
A/M systems, it appeared that the A/M by itself was sufficient for arsenic removal. BP/I3
was not required. Both systems reduced total arsenic to less than the WHO standard for
all runs. However, this was a short term study. The A/M system was tested for only 4
runs with an approximately 15-25 L of water treated; the BP/I3 & A/M system was tested
for only 9 runs with an approximately 40-50 L of water treated. When the A/M was
subjected to a long-term use, its oxidizing capacity might soon be exhausted, leading to
incomplete arsenic (III) to arsenic (V) oxidation. As a result, the arsenic removal
effectiveness may be lowered. In that case, the use of BP/I3, a strong oxidizing agent,
may prove to be useful in improving the removal effectiveness. A long-term study was
recommended.
Page 62
62
Another observation is that the raw water arsenic speciation does not seem to affect the
removal effectiveness of both treatment systems. Two hypotheses could be deduced
from this. First, both A/M and BP/I3 could 100% oxidize arsenic (III) into arsenic (V).
The A/M then adsorbed all arsenic (V). The second hypothesis was that the A/M could
100% adsorb all forms of arsenic regardless of speciation. The exact explanation was
unknown. It might be a combination of these two hypotheses. In order to better
understand the mechanism, it was suggested that an A/M only system be tested with an
arsenite solution of sufficiently high concentration such that the treated water had
appreciable amount of arsenic. The treated water was then speciation tested. If all the
arsenic is in the (+III) oxidation state, then it implied that A/M cannot 100% oxidize
arsenic (III) into arsenic (V). If all the arsenic was in the +5 state, then it implied that
A/M could 100% oxidize arsenic (III) into arsenic (V), but not able to adsorb all arsenic
(V). A similar test could also be performed on the BP/I3 & A/M system to determine the
oxidative power of BP/I3, and the adsorption effectiveness of A/M.
It was also observed that the top two centimeters of the BP/I3 changed color from deep
brown to light yellow after the nine runs. This was an indication that the oxidizing
capacity of the top two centimeters has been exhausted. The capacity was used up so
quickly not only because of the arsenic, but also because of hydrogen sulfide147.
Hydrogen sulfide is a reducing agent. It was oxidized by BP/I3 into sulfate. Hydrogen
sulfide was found in over 40% of the tubewells in the Terai148. Arsenic oxidation alone
could not justify the quick exhaustion of oxidizing capacity149. It was recommended that
oxidizing capacities of both the BP/I3 and A/M media be further studied.
Discussion of errors
Although the GFAAS should accurately detect arsenic to the 1 µg/L level, it was never
observed in the instrument used in this arsenic study. The detection limit determined in
the author’s analysis of arsenic sample was 10 µg/L. All arsenic reading from 0 µg/L to
about 10 µg/L were questionable. For example, when the instrument was calibrated, the
standard 0 µg/L arsenic solution can give an arsenic reading of as high as 10 µg/L. For a
Page 63
63
reading between 10 µg/L to 20 µg/L, the accuracy is better; however, confirmation with a
secondary test method (e.g. test kit) was advisable. The most accurate readings were for
arsenic concentration ranging from about 20 µg/L to about 75 µg/L. The calibration was
approximately linear for this arsenic range. For arsenic readings above 75 µg/L, the
accuracy drops. The reason was that the calibration curve is non-linear at this region.
Therefore, all water samples above 75 µg/L should be diluted to between 20 and 75 µg/L
in order to get more accurate readings. For this arsenic study, all water samples above 60
µg/L were diluted and retested. All water samples below 20 µg/L were regarded
unreliable unless confirmed by the test kit, which had a detection limit of 5 µg/L. All
water samples between 20 and 60 µg/L were considered at their face value. Refer to
Appendix E.1 for calibration curves and E.2 for interpolated results.
Fluctuation in lamp intensity resulting in fluctuation in the arsenic atomic signal from the
GFAAS with time was another concern. To illustrate the level of fluctuation, the eight
average-calibration curves obtained during the test on March 12, 2002 are shown in
Figure 14. All of these curves had a different slope and/or intercept. For example,
consider a water sample with peak area of 0.100. The top calibration curve translated this
peak area to an arsenic concentration of about 55 µg/L, while the bottom calibration
curve translated the same peak area to an arsenic concentration of about 70 µg/L. The
difference between 55 µg/L and 70 µg/L was approximately 20-30%. To reduce errors
associated with signal fluctuation in this arsenic study, a new calibration curve was
plotted for every 6 to 10 sample tested. These 6 to 10 samples were calibrated with the
average of the calibration curves before and after (i.e. average-calibration curve).
Page 64
64
Figure 14 Fluctuation in 8 Calibration Curves obtained on March 12, 2002.
7.1.2 pH Results
Table 5 shows a summary of the pH results. For the nine runs, the raw water pH ranged
from 6.49 to 7.60. The treated water for A/M only system ranged from 6.60 to 7.05;
BP/I3 & A/M system ranged from 5.89 to 7.03. A pH drop was observed in all runs,
except run #1.
Table 5 Summary of pH Results
Run
#
Raw water
pH
A/M only
treated water
Change in pH
after treatment
BP/I3 & A/M
treated water
Change in pH
after treatment
1 7.00 7.05 +0.05 7.03 +0.03
2 6.35 Not measured N/A Not measured N/A
3 6.90 6.60 -0.30 6.16 -0.74
0.000
0.020
0.040
0.060
0.080
0.100
0.120
0.140
0.160
0 10 20 30 40 50 60 70 80Total Arsenic (µg/L)
Peak
Are
a (a
bsor
banc
e)
Page 65
65
4 7.60 6.80 -0.80 6.31 -1.29
5 7.20 Not tested N/A 5.98 -1.28
6 6.49 Not tested N/A 6.00 -0.49
7 6.71 Not tested N/A 6.31 -0.40
8 6.50 Not tested N/A 6.00 -0.50
9 7.50 Not tested N/A 6.50 -1.00
Discussion of results
It was found that both the A/M and the BP/I3 media increased the acidity of water. For
example, for the A/M only system, pH drop was observed in runs # 3 and 4 except for a
very slight pH increase in run #1. This indicated that the A/M media gave acidity. By
comparing the pH drop between the A/M only system and the BP/I3 & A/M system for
runs # 1, 3, and 4, it was concluded that the BP/I3 was acidic as well. These observations
agreed with the explanation given by Paul Smith150, one of the inventors of this media.
Paul Smith explained that both A/M and BP/I3 are acidic in nature. The acidic nature was
related to the medias’ proprietary chemical structure. Both media could be prepared in
the manufacturing process to be pre-treated with a pH buffer to eliminate the pH drop.
The media used in this arsenic study was not pH pre-treated.
One implication of the acidic nature of both A/M and BP/I3 was that the A/M and BP/I3
may need to be pH pre-treated. In the case of runs # 3 to 8, the treated water pHs were
lower than the US National Secondary Drinking Water Regulation (NSDWR) of 6.5 to
8.5151. Of the over 50 wells visited for this arsenic study, none had pH greater than 8.
Therefore, the media pre-treatment to eliminate pH drop was preferred in many locations
of Rupandehi and Nawalparasi water conditions.
Discussion of errors
The pH meter was calibrated daily in the morning. It was linearly calibrated with
prepared pH = 4 and pH = 7 buffer solutions. These buffer solutions were prepared with
Cole Parmer pH buffer tablets. Sometimes, the pH meter was recalibrated in the
afternoon. It was observed that the pH reading could be off by as much as 0.2 pH units.
Page 66
66
In general, the fluctuation was less than 0.1 pH unit. Therefore, pH fluctuation was not a
significant issue.
Another potential problem was the slow pH meter response time. It could be due to a
variety of reasons such as drying of the pH probe tip, or aged probe, or low battery. The
issue of the pH probe drying up was prevented by inserting the probe into a bottle of
strong KCl solution whenever the probe is not in use. The problem of an aged probe
created some problems in the field*. The pH meter started to give erroneous results
starting on Jan 20, 2002. As a result, no further pH reading from the Cole Palmer pH
meter was possible. Subsequently, test strips were used to semi-quantitatively determine
the pH level of water. The test strips color chart could be difficult to compare pH values.
The pH intervals were every 0.5 pH units. Therefore, the pH measurements starting on
Jan 20, 2002 were not very accurate.
7.1.3 Oxidation-Reduction Potential (ORP) Results
Table 6 shows a summary of the ORP results. For the nine runs, the raw water ORP
ranged from –78 mV to –37 mV. The treated water ORP for A/M only system ranged
from –62 to –33 mV; BP/I3 & A/M system ranged from –47 mV to –3 mV. It was
observed the treated water was, in general, more oxidizing than the raw water.
* Note: Although a new probe has been purchased prior to this field study, it did not manage to arrive at the
author’s field site.
Page 67
67
Table 6 Summary of ORP Results
Run # Raw
water
(mV)
A/M only
treated water
(mV)
Change in ORP
after treatment
(mV)
BP/I3 & A/M
treated water
(mV)
Change in
ORP after
treatment
(mV)
Apparent
BP/I3
contribution
(mV)
1 -45 -62 -17 -47 -2 +15
2 -37 Not measured N/A Not measured N/A N/A
3 -61 -45 +16 -13 +48 +32
4 -78 -33 +45 -6 +72 +27
5 -60 Not tested N/A -3 +57 N/A
6 -45 Not tested N/A -12 +33 N/A
7 -40 Not tested N/A -10 +30 N/A
8 Meter
broken
Not tested N/A Meter broken N/A N/A
9 Meter
broken
Not tested N/A Meter broken N/A N/A
Discussion of results
Because A/M and the BP/I3 media were both oxidizing agents, it was logical that the
treated water is more oxidizing than the raw water, except for the anomaly in run #1. The
anomaly in run #1 could be due to the fact that the A/M media was not fully functional
initially. It took some time (or some volume of water) for the A/M to begin its oxidizing
role. This delay in the A/M to fully function was analogous to the process whereby a
machine that needed to “warm up”. A comparison between the A/M only system and the
BP/I3 & A/M system showed that the BP/I3 further contributed to water oxidation. For
runs # 1, 3, and 4, the ORP of the BP/I3 & A/M system was higher than the A/M only
system. The apparent contribution of BP/I3 was +15 mV for run #1, +32 mV for run #2,
and + 27 mV for run #4. The apparent BP/I3 contribution was an estimate only. No
actual measurement of ORP was performed at the interface of the BP/I3 and A/M media
of the BP/I3 & A/M system. The apparent BP/I3 contribution assumed that the A/M
media in both columns behaved identically.
Page 68
68
It was noted that for different runs, the change in ORP was also different. One reason
was that the water chemistry was different at different wells, thus requiring different
levels of oxidants to achieve the same change in ORP. Another reason was that the
oxidizing rate of the A/M and BP/I3 were dependent on water chemistry, flowrate,
temperature, and other factors such as the “warm-up” effect discussed above. Therefore
the amount of oxidation varied for each run. Further investigation into the oxidizing rate
could be done, but was not necessary. It was because the A/M and BP/I3 had already
achieved their main objective of arsenic removal. How much the ORP changed does not
matter. The ORP of drinking water is not regulated, nor is a health concern152.
Discussion of errors
Unlike pH, the ORP reading on the meter was not calibrated for this arsenic study.
Because the meter was not calibrated to a known reference state, all readings are relative.
Therefore, an ORP reading had no meaning by itself, except when compared to another
reading. One implication was that the same pH/ORP probe should be used throughout
the entire field experiment. If not, the ORP readings using one probe might not be
compatible with readings using another probe.
One problem with the pH/ORP probe was the slow response time. The causes and
corresponding remediation techniques are similar to the slow pH response, thus not
discussed here. As mentioned earlier, the pH/ORP meter started to give erroneous
results starting on Jan 20, 2002. As a result, no further ORP readings were possible.
7.1.4 Total Alkalinity Results
For the A/M only system, the total alkalinity between the raw and the treated water was
hardly changed. For the BP/I3 & A/M, the total alkalinity change ranged from slightly
lowered to significantly lowered. Refer to Table 7 for a summary for the alkalinity
results.
Page 69
69
Table 7 Summary of Total Alkalinity Results
Run
#
Raw Water
(mg/L)
A/M only
treated water
(mg/L)
Change in Alk
after treatment
BP/I3 & A/M
treated water
(mg/L)
Change in Alk after
treatment
1 180-240 120-180 Slightly lowered 0-80 Moderately lowered
2 120-180 Not measured N/A Not measured N/A
3 180-240 180-240 Not at all 0-80 Moderately lowered
4 80 80 Not al all 0-80 Slightly lowered
5 240-360 Not tested N/A 120-180 Moderately lowered
6 240-360 Not tested N/A 80-120 Significantly lowered
7 Not measured Not tested N/A Not measured N/A
8 240 Not tested N/A 120 Moderately lowered
9 240-360 Not tested N/A 120 Significantly lowered
Discussion of results
Since alkalinity was a measure of water’s acid-neutralizing capacity, the drop in
alkalinity indicated acid was introduced to the water. This observation was in agreement
with fact that A/M and BP/I3 gives acidity. In an attempt to neutralize the additional
acidity, alkalinity was consumed, thus lowered. For the A/M only system, the drop in
alkalinity was minimal. For the BP/I3 system, the drop in alkalinity was moderate. It
was because the BP/I3 gives acidity in addition to the A/M. On the other hand, if both
media were pre-treated with a pH buffer, then alkalinity might not drop.
Other factors such as the presence of other buffering systems, and addition/removal of
strong cations/anions, might affect alkalinity as well153. However, these factors were not
measured in this study.
The drop in alkalinity was not a concern from the perspective of providing a safe,
drinkable water. Alkalinity was not regulated and has no health consequences.
Page 70
70
Discussion of errors
The total alkalinity test results were based on color matching between the test strips and a
color chart. Frequently, none of the colors on the color chart matched with the color on
the test strip. In those cases, the average perceptions among two or three of the author’s
teammates were taken as the alkalinity reading. Often there was wide variability among
peoples’ perception; therefore, the accuracy of the total alkalinity results was low. It was
better to regard total alkalinity results as more of qualitative than quantitative
measurements. Nevertheless, total alkalinity readings were far from purely random. For
those runs with moderate to significant drops in alkalinity, it could be clearly seen that
there were color change before and after treatment.
7.1.5 Hardness Results
For most of the runs, total hardness was unchanged by the A/M or BP/I3 treatment.
Total hardness was slightly to moderately lowered in other cases. Refer to Table 8 for a
summary of the hardness results.
Table 8 Summary of Total Hardness Results
Run
#
Raw Water
Hardness (mg/L
as CaCO3)
A/M only treated
water (mg/L as
CaCO3)
Change in
Hardness after
treatment
BP/I3 & A/M
treated water
(mg/L as CaCO3)
Change in
Hardness after
treatment
1 250 180 Slightly lowered 250 No change
2 250-425 Not measured N/A Not measured N/A
3 250 120-180 Moderately
lowered
180-250 Slightly lowered
4 180-250 180-250 No change 180-250 No change
5 80-120 Not tested N/A 80-120 No change
6 120-180 Not tested N/A 120-180 No change
7 Not measured Not tested N/A Not measured N/A
8 180-250 Not tested N/A 180-250 No change
9 Not measured Not tested N/A Not measured N/A
Page 71
71
Discussion of results
It was concluded that A/M and BP/I3 had no or minimal effect on total hardness. The
observed lowering of hardness in a few runs might be attributed to errors in measuring
hardness. This was explained in more detail in the following paragraph.
Discussion of errors
Because total hardness was determined in the field in Nepal using test strips similar in
nature to the alkalinity test strips, many of the problems associated with the alkalinity test
strips applied to the total hardness test. For example, the color on the test strip did not
match any of the colors on the chart. Therefore, hardness measurements were again more
qualitative than quantitative measurements. All of the above hardness results were
questionable unless they are reconfirmed with more accurate tests.
7.1.6 Total Soluble Iron Results
Due to an insufficient number of available iron test ampoules, total soluble iron was
measured only for runs #1 and 3. For both cases, the raw water contained 2.5-3.5 mg/L
of soluble iron, while the treated water contained non-detect level (<0.1 mg/L) of soluble
iron. Refer to Table 9 for a summary of total soluble iron results.
Table 9 Summary of Total Soluble Iron Results
Run
#
Raw water
(mg/L)
A/M only treated
water (mg/L)
BP/I3 & A/M treated
water (mg/L)
1 2.5 <0.1 <0.1
3 3.5 <0.1 <0.1
Discussion of results
The two most common oxidation states for groundwater iron were Fe(+II) and
Fe(+III)154. Soluble iron referred mostly to Fe(II) because it is highly soluble. The
Page 72
72
solubility of Fe(III) was very low. The reduction of soluble iron could be explained by
two mechanisms. In the first mechanism, Fe(II) was oxidized into Fe(III). The oxidation
could be accomplished by exposure to the oxygen rich atmosphere, or by contact with
BP/I3 and/or A/M. Fe(III) then formed a precipitate, Fe(OH)3, and was trapped within
the BP/I3 and A/M media bed by physical filtration. The second iron removal
mechanism was its adsorption to the A/M media. Paul Smith155 confirmed that the A/M
media has an ability to adsorb iron. One drawback of the A/M’s ability to adsorb iron
was that adsorption sites occupied by iron could not be used to adsorb arsenic.
Therefore, high iron levels in the raw water could seriously reduce A/M’s capacity to
remove arsenic.
On the other hand, iron adsorption by the A/M media had its benefits. Currently in the
U.S. and Nepal, iron concentration in drinking water was recommended to be less than or
equal to 0.3 mg/L. The water in runs #1 and 3 were about 10 times the recommended
iron level. Although high iron was not a health concern, high iron gave an orange-red
color to the water. Water containers and cooking utensils could be stained. High iron
also gave taste and odor problems. As a result, people might incorrectly perceive high
iron water to be unsafe for drinking. In addition, numerous studies have shown that iron
is an excellent absorbent for arsenic156, 157, 158, 159, 160. Iron adsorbed on the A/M media
could in turn adsorb arsenic. Therefore, the loss in A/M’s capacity to remove arsenic
could be compensated by the gain in iron’s capacity to adsorb arsenic161. In contrast, if
iron was not adsorbed by the A/M media, but rather leached into the treated water; then
arsenic might be found together with the iron. Arsenic was thus not removed.
Discussion of errors
The determination of iron concentration was by color comparison. It was sometimes
difficult to match the colour of the iron test ampoules to the standard iron ampoules.
Different shades of orange could be hard to distinguish, especially for iron concentrations
above 1 mg/L. The color could also be affected by sunlight intensity and ampoule
orientation. Therefore, the raw water iron measurements were not very accurate.
Page 73
73
However, the iron concentration of the treated water should be more reliable. It was
because the colour for an iron-free sample has a distinctive colorless color.
7.1.7 Manganese Results
In testing for the presence of manganese in four runs, manganese was found to be below
detection limit (0.1 mg/L) in either the raw water or the treated samples. Refer to Table
10 for a summery of the manganese results.
Table 10 Summary of Manganese Results
Run
#
Raw water
(mg/L)
A/M only treated
water (mg/L)
BP/I3 & A/M treated
water (mg/L)
1 <0.1 <0.1 <0.1
3 <0.1 <0.1 <0.1
4 <0.1 <0.1 <0.1
9 <0.1 Not tested <0.1
Discussion of results
Because no manganese was found in the raw water, the effect of manganese on the
treatment systems is unknown.
Discussion of errors
The manganese results should be accurate. It was because the color for a manganese-free
sample has a distinctive colorless color compared to manganese positive sample.
7.1.8 Flow Rate Results
Table 11 shows the summary for flow rate results. The columns with multiple entries
indicate multiple flow rate measurements were taken. All flow rate measurements were
taken when the water level in the column was at maximum (i.e. water reservoir
Page 74
74
completely filled). For the A/M only system, the flow rate increased with each
subsequent run. For the BP/I3 & A/M system, the flow rate gradually decreased with
each subsequent run.
Table 11 Summary of Flow Rate Results
Run
#
A/M only
flowrate (mL/min)
A/M only
flowrate (L/hr)
BP/I3 & A/M
flowrate (mL/min)
BP/I3 & A/M
flowrate (L/hr)
1 228 13.7 324 19.4
2 240 14.4 444 26.6
3 384 23.0 378, 414 22.7, 24.8
4 408, 408 24.5, 24.5 396, 372 23.8, 22.3
5 Not tested Not tested 360, 372 21.6, 22.3
6 Not tested Not tested 348, 371 20.9, 22.3
7 Not tested Not tested 348, 354, 384 20.9, 21.2, 23.0
8 Not tested Not tested 354, 336 21.2, 20.2
9 Not tested Not tested 324, 342, 324 19.4, 20.5, 19.4
avg 334 20.0 364 21.8
Discussion of results
In general, a flow rate of about 20 L/hr was more than sufficient for an average
household need of about 20-30 L/day*. However, the flowrate was highly dependent on
the make of the media material, media porosity, trapped air bubbles, the column diameter
and length, the column orientation, and other factors. In another column configuration,
the flow rate would be completely different. Therefore the flow rate results were not
readily transferable to another column configuration unless detailed hydrodynamics
experiments were performed to understand the characteristics of the media. The use of
Darcy’s law162 or Ergun’s equation163 for flow through a porous bed might prove helpful.
* Based on a family of 5, with drinking/cooking water requirement of 4 L/person/day
Page 75
75
The exact reason for the increasing flow rate for the A/M media was unknown. One
explanation was that the media bed was loosely compacted for the first two runs. As a
result, air bubbles were present in the media bed, which restricted water flow. By run # 3
and 4, the bed became more compact, and resulted in no air bubble and better water flow.
For the BP/I3 & A/M system, compaction might explain the jump in flow rate between
runs # 1 and 2. The subsequent gradual decrease in flow rate was due to the
accumulation of dirt, sand, soil, and other materials in the column. These foreign
materials were from the raw water and were trapped as a layer above the BP/I3 media.
By the end of run #9, a layer of sand and dirt and soil could be clearly seen. The
accumulation of these materials in the column represented a barrier to water flow.
Therefore clogging could potentially be a serious problem, especially in long-term
operation. This problem could be ameliorated by periodic clearing of the accumulated
sludge, pre-filtering of sediments, using raw water that contains low level of solid
particulates, or take special precautions to better prepare and develop the well during
construction164.
Discussion of error
The flow rate measurements were carried out by collecting treated water using a 100 mL
plastic graduated cylinder over time intervals of 10 seconds, 15 seconds, or 20 seconds.
Error might be introduced due to the accuracy tolerance of the cylinder marking. Error
could also be due to imperfect timing. That is, the timing might be off by a second.
Nevertheless, these random errors associated with the above two reasons were relatively
insignificant. This was illustrated by runs #7 and 9 of which the three flowrate
measurements are very close to each other.
7.1.9 Summary of Important Results on the Arsenic Removal Technology
• Both the A/M only system and the BP/I3 & A/M system were capable of
removing total arsenic to below the WHO standard of 10 µg/L.
Page 76
76
• The use of BP/I3 to enhance arsenic removal was apparently not required for the
water samples tested in the field site, at least in the short duration of the tests
described in this arsenic study.
• The change in pH, ORP, total alkalinity, total hardness, total soluble iron,
manganese after treatment was not a concern in the water samples tested in the
field sites.
• Any effect of these parameters on arsenic removal was not observed.
• Iron might compete with arsenic in adsorption onto A/M media, raising the issue
of long-term capacity of A/M. However, iron bounded on A/M can adsorb
arsenic, replacing the loss in A/M’s arsenic adsorbing capacity.
• In addition, iron removal was advantageous because the high iron content in the
raw water was unpleasant, as iron gave color, taste, and perhaps odor.
• Clogging of the system with turbid raw water could reduce flowrate. Cleaning
might be required unless raw water has low turbidity.
Page 77
77
7.2 Arsenic Speciation in Tubewell Water
Thirty-seven arsenic contaminated wells throughout the Nawalparasi and Rupandehi
Districts were tested in order to obtain arsenic speciation results. For each of these wells,
the total arsenic, arsenic (III), pH, and ORP of the raw water were measured.
Correlations between arsenic (III) as % of total arsenic and the following parameters
were investigated and discussed:
• Total arsenic
• pH
• Oxidation-Reduction Potential (ORP)
• Well depth
• Well age
• Number of users
• Number of households sharing the well
Refer to Appendix H.1 and H.2 for more details on the above correlations. Appendix H.3
contains correlations between total arsenic and the above parameters.
7.2.1 Total Arsenic and Arsenic Speciation
Results for total arsenic and speciation are summarized in Table 12, Figure 15, Figure 16,
and Figure 17 The highest concentration was 863 µg/L in Bir Bahadur Gurung’s well.
The range of arsenic (III) as % of total arsenic was from 40% to 100% with a mean of
79%.
Table 12 Results for Total Arsenic for the 37 Wells in Rupandehi and Nawalparasi
Districts
SN Well contact person Village/ Town Total Arsenic
(µg/L)
As(III) as % of
total arsenic
1 Dina Nath Bhandari Madangram 572 73
4 Bir Bahadur Gurung Madangram 863 94
Page 78
78
5 Maha Sharma (Bhandari) Madangram 121 87
8 Somnath Poudel Madangram 328 98
36 Yam Kumari Magar Mukhiya tol 158 100
37 Nildhwaj Malla Mukhiya tol 149 93
43 Loknath Pandey Bangali 140 83
49 Dhan Bd. Gurung Bangali 149 77
50 Dhanjaya Sapkota Bangali 93 47
76 Maha Sharma Madangram 154 84
78 Ishwor Pd.Pandey Madangram 102 77
79 Dolaraj Pangini Madangram 103 76
81 Gangadhar Dhakal Madangram 95 69
90 Krishna Rayamajhi Madangram 56 75
91 Shahadev Chaudhary Madangram 150 71
4 Dhanchour Budathki Sunwal 91 98
16 Hari Bdr. Kandel Assamwasi 92 63
17 Pashu Ram Bhandari Khaireni 117 87
23 Om Prakash Puna Kirtipur-1 328 81
24 Churamani Aale Kirtipur-1 233 86
25 Rana Bdr. Darlami Kirtipur-1 113 88
27 Kul Pd. Bhattarai Kirtipur-1 60 100
28 Basant Bhattarai Kirtipur 242 100
29 Hemlal Burung Kirtipur 55 95
30 Ranmati Budhathoki Kirtipur 120 97
36 Hailal Gurung Kirtipur-2 56 64
37 Umashankar Sharma Kirtipur-2 70 46
39 Harimaya Hamal Kirtipur-2 45 40
48 Bhumilal Dhakal Bisasaya 164 57
67 Narendra Bdr. Shrestha Chauraha 70 93
79 Jokhu Kunwar Khakaribari 60 53
85 Dhanpati Bhattarai Khakaribari 147 100
Page 79
79
86 Nepalnath Kunwar Khakaribari 58 53
87 Gangaram Kunwar Khakaribari 44 50
164 Min Bd. Curung Kirtipur 110 91
166 Chit Maya Curung Kirtipur 140 73
? Sunwal VDC Sunwal 16 100
Average = 79
Figure 15 Results for Total Arsenic for the 37 Wells in Various Villages.
Each bar represents one well.
0100200300400500600700800900
1000
Madan
gram
Kirtipu
r-1
Kirtipu
r-2
Mukhiy
a tol
Banga
li
Sunwal
Khaka
ribari
Assam
wasi
Khaire
ni
Bisasa
ya
Chaura
ha
Name of Village
Tota
l Ars
enic
( µg/
L)
Page 80
80
Figure 16 Arsenic (III) as % of Total Arsenic for the 37 Wells in Various Villages.
Each bar represents one well.
Discussion of results
The three highest total arsenic concentrations were 863, 572, and 328 µg/L. They were
all found in the village of Madangram. Because the village of Madangram was a known
high arsenic area, 10 out of 37 wells were chosen in this village to better understand the
extent of arsenic contamination. Kirtipur-1 was another village with high arsenic in its
groundwater. The fourth, fifth, and sixth highest total arsenic concentration (328, 242,
233 µg/L) were found in this village. Nine of 37 wells were chosen in this village. These
results showed that the occurrence of high total arsenic was not random, but was
concentrated in specific villages. When installing a new well, extra care should be given
to the well location and its proximity to high arsenic concentration areas. This could
reduce the chance of the new well containing high arsenic.
On the other hand, the speciation results seemed to be random across the villages. No
village had a consistent level of arsenic (III) as a % of total arsenic. The range within
0102030405060708090
100
Madan
gram
Kirtipu
r-1
Kirtipu
r-2
Mukhiy
a tol
Banga
li
Sunwal
Khaka
ribari
Assam
wasi
Khaire
ni
Bisasa
ya
Chaura
ha
Village
Ars
enic
(III)
as
% o
f Tot
al A
rsen
ic
Page 81
81
each village could be fairly wide. Therefore, it was concluded that arsenic speciation was
not village/area specific.
Figure 17 Correlation Between Total Arsenic and % Arsenic (III)
The comparison between total arsenic and arsenic speciation showed no correlation. This
implied that arsenic speciation could not be predicted by total arsenic. It was impossible
to derive any information on speciation using arsenic test methods that measured total
arsenic only. Additional techniques such as separation of arsenic (III) from arsenic (V)
were necessary to determine speciation.
The high percentage of arsenic (III) as a percentage of total arsenic in the tubewell water
was also a health concern. It was because arsenic (III) was the more toxic form of arsenic
compared to arsenic (V). Therefore, the arsenic positive wells should never be used for
drinking and cooking purposes.
y = 0.0264x + 74.853R2 = 0.0542
30
40
50
60
70
80
90
100
0 200 400 600 800 1000Total Arsenic (µg/L)
Ars
enic
(III)
as
% o
f Tot
al A
rsen
ic
Page 82
82
Discussion of errors
The above arsenic results were determined by the GFAAS in the Ralph M Parson’s
laboratory at MIT. As discussed before, the GFAAS accuracy was best in the 20-75 µg/L
range. Many of the above results were also tested with the field test kits. In general, the
two results showed fairly high degree of agreement of 78%. Table 13 shows the
comparison of the GFAAS results with the field test kit results.
Table 13 Comparison of test kit and GFAAS arsenic results
Test Kit (µg/L) GFAAS (µg/L) Agreement
500 572 yes
800 863 yes
100-200 121 yes
200 328 no
50-100 158 no
100-200 149 yes
100 140 yes
50-100 93 yes
100 154 yes
100-200 102 yes
50-100 103 yes
100-200 96 no
50 95 no
50-100 56 yes
100-200 150 yes
200 91 no
300-500 328 yes
200-300 233 yes
300 242 yes
20-50 45 yes
Page 83
83
100 70 yes
200 147 yes
10 16 yes
Agreement % = 78 %
7.2.2 Correlation with pH
Figure 18 shows the correlation between pH and arsenic speciation. The pH ranges from
5.76 to 7.27.
Figure 18 Correlation Between pH and Arsenic Speciation
y = 8.8511x + 22.094R2 = 0.0521
0
10
20
30
40
50
60
70
80
90
100
5.5 6 6.5 7 7.5pH
Ars
enic
(III)
as
% o
f Tot
al A
rsen
ic
Page 84
84
Discussion of results
Arsenic speciation appeared independent of the water pH. The square of correlation
coefficient was only 0.05, indicating no correlation. According to the pH-Eh diagram,
pH could only affect the amount of protonation of arsenic (III) and arsenic (V), but not
the speciation of arsenic. Therefore, pH should have no correlation with speciation, as
indicated by the above results.
Discussion of errors
Some of the errors associated with pH measurements were already discussed in the
previous section concerning arsenic removal technology. An additional source of error in
this experiment concerning arsenic speciation in tubewell water was that the collected
water was not representative of the actual water condition in the well. For example, some
of the wells visited by the author had not been used for weeks or months. In order to
collect a water sample, these wells were primed. The priming procedure required
pouring a bucket of water into the well. This additional source of external water might
interfere with the existing water in the well. When water was pumped from the well, the
collected water could be a mixture of well water and priming water, thus not
representative of the actual water condition in the well.
7.2.3 Correlation with ORP
Figure 19 shows the correlation between ORP and arsenic speciation. The percent
arsenic (III) to total arsenic appeared to decrease with increasing ORP.
Page 85
85
Figure 19 Correlation Between ORP and Arsenic Speciation
Discussion of results
The observed trend of percent arsenic (III) decreasing with increasing ORP matched with
theoretical prediction. The higher the ORP, the more oxidizing the water was. More
arsenic would appear at its oxidized form, i.e. arsenic (V), than at its reduced form, i.e.
arsenic (III). In other words, the percent arsenic (III) decreased with increasing ORP as
more arsenic was in arsenic (V) form at high ORP165.
Discussion of error
Some of the errors associated with ORP measurements are already discussed in the
previous section concerning arsenic removal technology. An additional source of error in
this arsenic speciation in tubewell water experiment is that the collected water is not
representative of the actual water condition in the well. For example, some of the wells
visited by the author had not been used for weeks or months. In order to collect a water
sample, these wells must be primed. The priming procedure required pouring a bucket of
y = -0.6325x + 57.356R2 = 0.4066
40
50
60
70
80
90
100
-70 -60 -50 -40 -30 -20 -10 0ORP (mV)
Ars
enic
(III)
as
% o
f Tot
al A
rsen
ic
Page 86
86
water into the well. This additional source of external water might interfere with the
existing water in the well. When water was pumped from the well, the collected water
could be a mixture of well water and priming water, thus not representative of the actual
water condition in the well.
Another serious error with ORP measurement was its applicability to arsenic speciation.
ORP measurement was based on the dominant redox reaction couple in the water166. The
presence of multiple couples could limit the interpretation of ORP167. For example, if a
water contains both Fe(II)/Fe(III) and As(III)/As(V) couples, the speciation of each of
these couples should reach equilibrium according to the given water redox potential.
However, redox reactions could be very slow168. The As(III)/As(V) couple might have
reached equilibrium, while Fe(II)/Fe(III) has not. This implied that the Fe(II)/Fe(III)
couple did not reflect the true redox potential of the water. If, unfortunately,
Fe(II)/Fe(III) was the dominant redox reaction couple in the water, then the ORP
measurement would not reflect the true redox potential of the water. On the other hand,
if the iron couple has reached equilibrium but the arsenic couple has not, then the ORP
measurement based on the iron couple would not reflect the true arsenic speciation
condition in the water. In actual groundwater, many different redox couples existed,
further complicating the ORP interpretation. In addition, arsenic was usually not the
dominant couple due to its low concentration compared to other couples, such as iron.
Therefore, the ORP measurement in this arsenic speciation in tubewell water experiment
was not very accurate in predicting arsenic speciation, as suggested in works by Holm
and Curtiss169.
.
7.2.4 Correlation with Well Depth
Figure 20 shows the correlation between well depth and arsenic speciation. The well
depth ranged from 28 ft to 200 ft.
Page 87
87
Figure 20 Correlation Between Well Depth and Arsenic Speciation
Discussion of results
Arsenic speciation appeared to be independent of the well depth with the square of
correlation coefficient of only 0.04. However, a comparison between well depth and
ORP showed a moderate correlation of R2 = 0.24, as shown in Figure 21. This
correlation showed the deeper the well, the more reducing the water was. This could be
explained by the ecological redox sequence, which stated the redox should decrease with
an increase in depth given the presence of organic matter170. This ecological redox
sequence is governed by the relative change in the standard free energy change (∆G°) of
the common environmental half-reactions. Refer to Table 14 for these common half-
reactions.
y = -0.3558x + 115.89R2 = 0.0408
0
50
100
150
200
250
0 20 40 60 80 100Arsenic (III) as % of Total Arsenic
Wel
l Dep
th (f
t)
Page 88
88
Figure 21 Correlation Between Well Depth and ORP
Table 14 Common environmental redox half-reactions171
Half-reaction Half-reaction ∆G°
(kcal/mol)
Aerobic Respiration 0.25 O2 + H+ + e- ! 0.5 H2O -28.22
Denitrification 0.2 NO3- + 1.2 H+ + e- ! 0.1 N2(g) + 0.6 H2O -28.63
Manganese
Reduction
0.5 MnO2(s) + 2 H+ + e- ! 0.5 Mn2+ + H2O -28.56
Iron Reduction Fe(OH)3(s) + 3 H+ + e- ! Fe2+ + 3 H2O -22.44
Sulfate Reduction 0.125 SO42- + 1.125 H+ + e- ! 0.125 HS- + 0.5 H2O -5.78
Methanogenesis 0.125 CO2(g) + H+ + e- ! 0.125 CH4(g) + 0.25 H2O -3.90
y = -0.8736x + 50.251R2 = 0.2449
0
20
40
60
80
100
120
140
-70 -60 -50 -40 -30 -20 -10 0ORP (mV)
Wel
l dep
th (f
t)
Page 89
89
At shallow depth, oxygen is present due to easy diffusion from atmospheric oxygen. The
half-reaction involving oxygen also has one of the lowest ∆G°, indicating the reaction is
highly favorable compared to those half-reactions with less negative ∆G°. As a result,
the oxidation of organic matter by oxygen (aerobic respiration) is preferred over other
oxidants at shallow depth. At a deeper level where oxygen is depleted, the oxidation of
organic matter is dominated by half-reactions involving nitrate (denitrification) and
manganese oxide (Manganese reduction). At even deeper level, the less favorable iron
reduction, sulfate reduction, and methanogenesis may occur. The redox potential of the
water is defined by the dominant redox reaction occurring172. For aerobic respiration, the
pe is around +12 to +15. For denitrification and manganese reduction, the pe are around
+10 to +12 and +8 to +11 respectively. For iron reduction, sulfate reduction, and
methanogenesis, the pe are approximately –2 to +1, -5 to –2 and –7 to –4 respectively173.
Since pe is directly proportional to Eh (redox potential)* and ORP is a rough approximate
measure of Eh, the decrease in pe with increasing depth should correspond to a decrease
in ORP. This explained the moderate correlation between well depth and ORP174.
Recall from the previous discussion of ORP vs. arsenic speciation, it was observed that
the percentage arsenic (III) as total arsenic increased as ORP was lowered. Combining
this observation with the observation that ORP decreased with depth should yield the
conclusion that the % arsenic (III) should increase with depth. However, this was not
observed. This surprising result might be due to the limitation of ORP measurement to
predict arsenic speciation under the interference of multiple redox couples.
* Eh = 2.3 RT * pe /F where R = universal gas constant, T = temperature in Kelvin, F = Faraday’s
constant ~ 96500, and Eh is the redox potential.
Source: Strumm W., Morgan, J. “Aquatic Chemistry.” 2nd edition
Page 90
90
Discussion of errors
The errors associated with well depth should be minimal. Well depth was easy to
measure.
7.2.5 Correlation with Number of Users
Figure 22 shows the correlation between the number of users and arsenic speciation. The
number of users ranged from 6 to 160.
Figure 22 Correlation Between Number of Users and Arsenic Speciation
Discussion of results
Arsenic speciation appeared independent of the number of users. The square of
correlation coefficient was only 0.06, indicating no correlation. If it was assumed that the
number of users was approximately direct proportional to the amount of water use, then
water use did not correlate with arsenic speciation.
y = 0.1372x + 72.15R2 = 0.064
0
10
20
30
40
50
60
70
80
90
100
0 50 100 150 200Number of Users (i.e. population)
Ars
enic
(III)
as
% o
f Tot
al A
rsen
ic
Page 91
91
Discussion of errors
The number of users for a particular well was dependent on factors such as the population
in a village, the proximity to other wells, the well condition, the well water quality, and
the well ownership175,176. All wells visited by the author were public wells, accessible to
the entire village population. The number of users for a well might change as a result of
population growth, construction of a new well in the village, or changing water-collecting
habits of the villagers due to the closing of certain arsenic contaminated wells. As a
result, the actual number of users for a well might change from day to day. In addition, it
is common that villagers choose different water sources for different purposes177. This
further complicated the measurement of number of users. Therefore, the measurement
was not very accurate.
7.2.6 Correlation with Number of Households Sharing the Well
Figure 23 shows the correlation between the number of households and arsenic
speciation. The number of users per well ranges from 1 to 30.
Page 92
92
Figure 23 Correlation Between Number of Households and Arsenic Speciation
Discussion of results
Arsenic speciation appeared independent of the number of households. This was
consistent with the observation of no correlations between number of users and
speciation. It was because there was strong correlation between the number of
households and the number of users, as shown in Figure 24.
0
20
40
60
80
100
120
0 5 10 15 20 25 30 35Number of Households
Ars
enic
(III)
as
% o
f Tot
al A
rsen
ic
Page 93
93
Figure 24 Correlation Between the Number of Households and Users
Discussion of errors
Similar to the number of users, the number of households for a particular well was
subject to changes in village population, water-collection patterns of the villagers,
addition or closure of wells, and other factors. Therefore, the data on number of
households was not very accurate as it fluctuates daily.
7.2.7 Summary of Important Results on Arsenic Speciation in Tubewell
• Total arsenic appeared to be village/region dependent, while arsenic speciation
was not. This has implications for site selection in the constructing new wells to
obtain arsenic-free water.
• On average, 79% of the total arsenic was in the more toxic arsenic (III) form. The
removal of arsenic was therefore highly necessary. In addition, pre-oxidation of
y = 0.155x - 0.4841R2 = 0.8669
0
5
10
15
20
25
30
35
0 50 100 150 200Number of users
Num
ber o
f hou
seho
lds
Page 94
94
arsenic (III) to (V) was essential to improve arsenic removal efficiency for many
adsorption based treatment technologies.
• There was a strong correlation between ORP and arsenic speciation. The lower
the ORP, the more arsenic was in the arsenic (III) form.
• There was no correlation across sites between total arsenic, pH, well depth, well
age, number of users, and number of households on arsenic speciation. It was
concluded that ORP was a better predictor for arsenic speciation.
Page 95
95
7.3 Arsenic Oxidation Kinetics
Arsenic oxidation kinetics was studied to investigate weather natural aeration was
sufficiently quick to oxidize arsenic (III) to (V). A beaker containing arsenic
contaminated water was exposed to the atmosphere for about three days. The total
arsenic, arsenic (III), pH, and ORP of the raw water were measured at 18 different times
within the three days. Changes in the above four parameters overtime were recorded.
Refer to Appendix I for more details on the test results.
7.3.1 Total arsenic and speciation results
Figure 25 shows the change in total arsenic and arsenic (III) over time. Figure 26 shows
the change in percent of arsenic (III) with time. Total arsenic decreased very slightly
with time. The decrease in arsenic (III) and percent arsenic (III) over time was quicker.
Figure 25 Change in Total Arsenic and Arsenic (III) with Time
0
50
100
150
200
250
300
0 10 20 30 40 50 60 70 80Time (hours)
Ars
enic
con
cent
ratio
n (m
g/L)
Total ArsenicArsenic (III) only
Page 96
96
Figure 26 Change in % Arsenic (III) with Time
Discussion of results
The decrease in total arsenic could be due to adsorption to iron. The total soluble iron
concentration in the water was about 2.5 mg/L at the start of the kinetics experiment.
Over the next three days, as a result of exposure to the atmosphere, the soluble iron was
slowly oxidized into insoluble ferric hydroxide. Since ferric hydroxide was an excellent
adsorbent for arsenic178, 179, arsenic was removed from the solution.
The decrease in arsenic (III) could be explained by two hypotheses. First, arsenic (III)
was oxidized to arsenic (V). It could be due to oxygen in the air, or by other oxidation
means such as photo-oxidation. Second, arsenic (III) was adsorbed to ferric hydroxide.
Of the two hypotheses, the former is more likely. It is because arsenic (III) was not
adsorbed by iron hydroxide as readily as arsenic (V). If the latter hypothesis was true,
y = -0.2707x + 85.892R2 = 0.181
30
40
50
60
70
80
90
100
0 10 20 30 40 50 60 70 80Time (h)
Ars
enic
(III)
as
% o
f Tot
al A
rsen
ic
Page 97
97
then arsenic (III) should decrease at a rate slower than that of total arsenic, which
contains both arsenic (III) and (V). However, the contrary was observed. The rate of
arsenic (III) decrease was higher than that of total arsenic. This disproved the latter
hypothesis as the main mechanism. Therefore, arsenic oxidation was the main reason for
the drop in arsenic (III) with time. It follows that arsenic (III) as a percentage of total
arsenic decreased with time. It should be noted that the trend lines in Fig 7.11 and 7.12
are intended to highlight the direction of the trend. Theoretically, these trends might not
be straight lines. They could be first order decay, or any other mathematical functions.
The actual equation describing these trends could only be determined by a carefully
monitored experiment, and sophisticated analysis to understand the exact mechanisms.
These were beyond the scope of this arsenic speciation kinetics study.
It was concluded that the arsenic oxidation kinetics was slow180. Over the three day
period, the percent arsenic (III) decreased from about 85% to 65%. By extrapolation,
complete arsenic oxidation by natural aeration could take weeks. Because arsenic (V)
was more readily adsorbed than arsenic (III)181, many arsenic remediation technologies,
such as iron coated sand, activated alumina, iron filings, and arsenic treatment plants
(ATP) required a pre-oxidation step to improve arsenic removal efficiency.
The results from this experiment show that natural aeration might not be effective at
oxidation. The pre-oxidation must be accomplished by other means, such as the addition
of an oxidant. On the other hand, the slow oxidation kinetics allows the author to take his
time when performing speciation tests on this particular water. Since the speciation
conditions changed so slowly, no significant error was introduced if the speciation test
was delay for a few hours. One implication was that the speciation test might not needed
to be performed at the moment the water is collected at a tubewell. Samples could be
collected in the morning, and speciation tests carried out in the afternoon with no
significant error. However, another water could contain a catalyst for aeration oxidation.
Therefore, the speciation test protocols should not be changed unless more experimental
results confirmed the slow kinetics.
Page 98
98
Discussion of errors
The fluctuation in total arsenic and arsenic (III) could be attributed to the accuracy of the
GFAAS analysis. In addition, the time between when the samples were collected and
acidified and then analyzed in the laboratory was about two months. Water might have
vaporized within the headspace of the mailer tubes such that the arsenic concentration in
the solution appeared higher (arsenic is not volatile). Another potential error \was that
the speciation procedure required vigorous shaking of the mailing tube for five minutes.
During the five minutes, arsenic (III) might have oxidized into arsenic (V) due to the
presence of oxygen in the mailer tube. Therefore, the measured percent arsenic (III)
could be 10-20% lower than the actual percent arsenic (III)182.
7.3.1 pH and ORP results
Figure 27 and Figure 28 show the change of pH and ORP with time. It was observed that
pH increased with time, while ORP decreased with time.
Page 99
99
Figure 27 Change in pH with Time
Discussion of results
The increase in pH with time could be explained by the decarbonation of groundwater.
When water was underground, it might contain high total carbonate, CT*, as a result of
dissolution of underlying geologic formations such as calcite (CaCO3), and dolomite
(CaCO3•MgCO3)183. As the groundwater was taken out from the ground and was
exposed to the atmosphere, new equilibrium with the atmospheric carbon dioxide (CO2)
would be established. Usually, a lower level of total carbonate was expected for the new
equilibrium184. Decarbonation must occur. Of the different species in the carbonate
system, only [CO2](aq) could escape to the atmosphere as [CO2](g). To compensate for the
loss of [CO2](aq), the other carbonate species must be protonated to [H2CO3] and [CO2](aq)
in order to retain the carbonate system equilibrium. The protonation reactions consumed
[H+] in the solution. With less [H+], the water became less acidic. It followed that pH
should increase.
* CT = [H2CO3*] + [HCO3
-] + [CO32-] where [H2CO3*] = [CO2](aq) + [H2CO3](aq)
y = 0.0262x + 7.0687R2 = 0.9383
6.00
6.50
7.00
7.50
8.00
8.50
9.00
9.50
0 10 20 30 40 50 60 70 80Time (hours)
pH
Page 100
100
Figure 28 Change in ORP with Time
The decrease in ORP with time was puzzling. This observation was completely contrary
to the expected increase in ORP with time. The water should be more oxidizing with
time, as suggested by the arsenic oxidation results; therefore, ORP should increase with
time. The anomaly might be explained by the interference of the ORP by pH. Redox
potential was sensitive to pH if hydrogen ion or hydroxide ion was involved in the redox
half-cells. The ORP tended to decrease when pH increases185. As a result, the ORP
measurements were highly distorted and did not truly reflect the water condition. A
comparison between pH and ORP, as in Figure 29, shows a strong negative correlation
between pH and ORP.
y = -1.0866x - 73.437R2 = 0.9108
-160
-140
-120
-100
-80
-60
-40
-20
0 10 20 30 40 50 60 70 80Time (hours)
OR
P (m
V)
Page 101
101
Figure 29 Correlation Between pH and ORP
Discussion of errors
The errors associated with pH and ORP measurements were thoroughly examined earlier,
thus not repeated here.
7.3.2 Summary of Important Results on Arsenic Oxidation Kinetics
• The oxidation of arsenic (III) to (V) was slow under natural aeration for this
particular water. At least one week was needed for complete oxidation.
• Natural aeration can be ineffective as an arsenic pre-oxidation step for many
arsenic removal technologies. Other oxidation techniques are needed.
y = -41.58x + 220.67R2 = 0.9628
-160
-140
-120
-100
-80
-60
-40
-20
6.00 6.50 7.00 7.50 8.00 8.50 9.00pH
OR
P (m
V)
Page 102
102
CHAPTER 8 CONCLUSIONS AND RECOMMENDATIONS
8.1 Arsenic Removal Technology Evaluation The arsenic removal technology was very successful in removing arsenic. The A/M only
and the BP/I3 & A/M systems were tested at four and nine wells respectively, with raw
water total arsenic between 147 to 863 µg/L. In all of the above tests, the treated water
contains non-detect level (<5 µg/L) of total arsenic, which is below the WHO guideline
of 10 µg/L total arsenic. By comparing the arsenic removal results between the A/M
only system and the BP/I3 & A/M systems, it appeared that the A/M by itself was
sufficient for arsenic removal. BP/I3 is not required.
Iron was also oxidized and subsequently removed by the treatment systems, from 2.5-3.5
mg/L in the raw water to below detection limit of 0.1 mg/L in the treated water. On the
one hand, iron is undesirable because iron adsorption reduced the A/M’s capacity to bind
arsenic. On the other hand, the iron bound on the A/M surface could adsorb arsenic,
replacing the loss in A/M’s arsenic adsorbing capacity. In addition, iron removal was
advantageous because the high iron content in the raw water was unpleasant, as iron gave
color, taste, and perhaps odor.
The flow rate through the system was about 20 L/hour, which was more than sufficient
for an average household need of about 20-30 L/day. However, clogging of the treatment
system due to the accumulation of dirt, sand, and other matter found in the raw water
could potentially be a serious problem. Pre-filtering of the raw water might be needed.
Several key recommendations can be made based on this study. They are:
• Further investigations in the A/M media regarding its technical, social and
economic aspects is needed.
Page 103
103
• For the technical aspect, a practical filter column design using local materials
should be developed. Examples include the use of buckets, or plastic water
bottles. The plastic column setup used in this arsenic study was not locally
available and was therefore not appropriate for household use.
• The long-term oxidation and adsorption capacity of A/M should be assessed.
• The treated water should be tested for the full set of water quality parameters in
the drinking water standards.
• For the social aspect, issues regarding the ease of setup, operation and
maintenance, availability of the media, and the perceived quality of the treated
water should be addressed.
• For the economic aspect, a users’ willingness-to-pay study is suggested to
understand how much the villagers can afford.
• Long-term cost of the A/M media based on its arsenic adsorption capacity, and
the capital cost of the treatment system should be estimated in order to evaluate its
economic viability, especially relative to other possible systems appropriate for
Nepal.
8.2 Arsenic Speciation in Tubewell Water Speciation tests at 37 wells showed, on average, 79% of the total arsenic was in the more
toxic arsenic (III) form. The removal of arsenic is therefore highly necessary. In
addition, pre-oxidation of arsenic (III) to (V) was essential to improve arsenic removal
efficiency for many adsorption-based treatment technologies. Simple aeration was not
effective to oxidize arsenic.
There was a strong correlation between ORP and arsenic speciation. The lower the ORP,
the more arsenic was in the arsenic (III) form. On the other hand, there was no
correlation between total arsenic, pH, well depth, well age, number of users, and number
of households on arsenic speciation based on the well water tested. It was concluded that
ORP was a suitable predictor for arsenic speciation.
Page 104
104
Several key recommendations can be made based on the speciation aspect of this study.
They are:
• The currently available scientific data on the toxicity of arsenic (III) vs. (V) is still
primitive. Further studies are needed.
• The speciation test method used in this study should be checked with an
alternative test method in order to confirm the validity of the results.
• More wells should be speciation tested to explore undiscovered correlations and
trends.
Access to adequate safe water supply is a basic human right. Every effort should be
taken to protect this right.
Page 105
105
APPENDIX A AQUATIC TREATMENT SYSTEMS, INC. A.1 Company Profile
Page 117
117
A.2 MSDS
For BP/I3
Page 121
121
APPENDIX B PARASI SURVIVAL GUIDE Three members of the MIT Nepal Water Project Team 2001-2002 were based on Parasi
for part of their study. Parasi is a small town of approximately 2000 people in the
Nawalparasi district. It is 6 hours car ride from Kathmandu, or 1hour car drive from
Butwal or Lumbini.
The three major streets in Parasi are lined on both sides with general stores and shops.
Simple essential items used by the Nepali can be brought there. For example, toothpaste,
bar soap, mosquito coils, clothing, bedding, rugs, bottled water, and water buckets can be
easily found. On the other hand, medical supplies or Western goods are hardly found.
Figure 30 shows a schematic map of Parasi town center and well locations. Figure 31
shows the street scene of the main street looking east.
Figure 30 Schematic Map of Parasi Town Centre and Well Locations
Author’s house
Restaurants Shop
Backyard well
Frontyard Well
Restaurant Well
main street
To India (10km)
To Kathmandu and Butwal
NRCS Shops
Shops Shop well
Shops
N
Map not to scale
Shops
Page 122
122
There are two Nepali restaurants (shacks) in Parasi, serving mostly spicy Indian or Nepali
dishes. Besides eating out, cooking at home is another option. Kerosene stove, cooking
utensils, pots and pans, and fuel can be easily bought. Fresh vegetables, rice, eggs,
chicken, oranges, cooking oil, and seasonings can be found throughout the town as well.
The ENPHO house is a typical Nepali house. It is minimally furnished, with only beds,
chairs and tables in the house. The rooms are lit by dim electric light bulbs, with
intermittent power supply. There is a squat style latrine in the backyard separated from
the house. The latrine has no light, and must be pour flushed (manually flushed with a
bucket of water). Water is available from a tubewell in the backyard about 10 meters
away from the latrine, as shown in Figure 32. The water is not safe for dinking, as it
contains about 300 µg/L arsenic and is microbiologically contaminated. Drinking water
is collected from the town water supply pipe in the front yard next to the main street.
Town water is generally available daily from 7am to 8am and 4pm to 4:30pm. It comes
from a deep boring well northeast of town. Besides drinking and cooking, this water
supply is usually used for washing or taking a shower. Most Nepali drink directly from
this water supply; however, drinking without boiling is not advised.
The weather in Parasi during January is very comfortable. It is usually sunny and dry
with highs around 20-25 °C. Nevertheless, it can be chilly at night, as the mercury dips
to about 10 °C. Mosquitoes are always a problem, even in the middle of winter.
Therefore, malaria pills should be taken. Mosquito coils and pads sold in Parasi are
effective in keeping mosquitoes away.
Phone calls to Kathmandu can be made at numerous places in the town, but international
calls are fairly expensive (US$2-3 per minute) and not easy to make.
It is recommended to bring the following items: toilet paper, flash light with extra
batteries, matches or lighter, detergents or dishwashing liquid, chlorine disinfectant
solution called Piyush or equivalent disinfection agents, warm clothes, a pair of boots and
Page 123
123
sandals. Expect to spend less than NRs 500 per day* (~US$6.7) in Parasi for normal
daily needs. Bringing electronic equipment is not advised. Electricity is unreliable and
blackouts occur frequently.
Figure 31 Street Scene of Parasi
Figure 32 Backyard Well
* In Jan 2002, US$1 = NRs 75 (Nepali Rupees)
Page 124
124
APPENDIX C TRIP SCHEDULE AND EXPENSE C.1 Schedule Date Activities
Fri 4-Jan-02 Arrived at Kathmandu, sightseeing in Thamel in the evening.
Sat 5-Jan-02 Sightseeing in Patan in the morning. Thamel in the evening.
Sun 6-Jan-02 Morning meeting at ENPHO to discuss work plan, traveled Parasi
Mon 7-Jan-02 Tour of ENPHO's arsenic treatment plants (ATPs) in Parasi vicinity.
Tue 8-Jan-02 Attended NRCS meeting in the morning, tour more ATPs in
Wed 9-Jan-02 Setup A/M and BP/I3 & A/M systems.
Thu 10-Jan-02 Arsenic test on different waters (town, bottled, well, etc.). Test run # 1.
Fri 11-Jan-02 Performed some speciation tests. Test run # 2.
Sat 12-Jan-02 Began arsenic oxidation kinetics experiment.
Sun 13-Jan-02 Kinetics experiment continued. Test run # 3.
Mon 14-Jan-02 Kinetics experiment continues. Test run # 4.
Tue 15-Jan-02 Traveled to Butwal in the morning. Visited FINNIDA sites and collected
Wed 16-Jan-02 Speciation tests in Rupandehi. Test runs # 5 and 6.
Thu 17-Jan-02 Speciation tests in Rupandehi. Test run # 7.
Fri 18-Jan-02 Observed new well construction. Treated for lunch by a local family.
Sat 19-Jan-02 Sightseeing in Lumbini in the morning. Traveled to and stayed in Butwal.
Sun 20-Jan-02 Speciation tests in Nawalparasi. Test run # 8.
Mon 21-Jan-02 Speciation tests in Nawalparasi. Test run # 9.
Tue 22-Jan-02 Wrapped up all my works at FINNIDA office.
Wed 23-Jan-02 Traveled to Kathmandu.
Thu 24-Jan-02 Presented to ENPHO, IBS, and FINNIDA at ENPHO's office on works
Fri 25-Jan-02 Began Annapura trekking trip. Traveled to Pokhara, and Dhampus.
Sat 26-Jan-02 Passed towns of Pothana, Deurali, Tolka to arrive at Newbridge.
Sun 27-Jan-02 Wonderful lunch at Jhinu Danda. Arrived at our final destination, Chomrong,
Mon 28-Jan-02 Left Chomrong in mid-morning. Traveled through Kimrong to Ghandrung.
Tue 29-Jan-02 Trekked through Birethanti to Naya Pul. Taxi ride back to Pokhara.
Wed 30-Jan-02 Traveled back to Kathmandu.
Thu 31-Jan-02 Visited Bhaktapur in the morning, Kathmandu city center in the evening.
Fri 1-Feb-02 Flew back to Boston.
Page 125
125
C.2 Project Related Expense
NRs $US
6 nights in Hotel Regency, Kathmandu 69
6 dinners + 6 lunches in Kathmandu 3000 40
taxi rides within Kathmandu 300 4
9 nights stay in Parasi 333 5
pots and pans and buckets in Parasi 400 5
bottled water in Parasi 200 3
food in Parasi 2000 27
food in Butwal 500 7
1 night at Lumbini 5
Total 165
NRs 75= US$ 1
Note: Room and food in Butwal was provided free of charge by DIDC (formerly FINNIDA).
Page 126
126
APPENDIX D CONTACTS IN NEPAL
Roshan R. Shrestha Executive Chairman ENPHO Thapagaon, New Baneshwor, Kathmandu, Nepal. P.O.Box 4102 e-mail: [email protected] phone (home): 272590 phone (office): 491052, 491376
Arinita Maskey Assistant Programme Officer ENPHO Thapagaon, New Baneshwor, Kathmandu, Nepal. P.O.Box 4102 e-mail: [email protected] phone (home): 522354 phone (office): 491052, 491376 Ms. Kalawati Pokharel Health & Sanitation Specialist DIDC (formerly FINNIDA) R.W.S.S.S.P. P.O. Box 12 Butwal, Nepal e-mail: [email protected] phone (office): (977)-71-40782, 40513 fax (office): (977)-71-40842 Ulla Mustanoja Field Specialist DIDC (formerly FINNIDA) R.W.S.S.S.P. P.O. Box 12 Butwal, Nepal e-mail: [email protected] phone (office): (977)-71-40782, 40513 phone (res): (977)-71-44569 fax (office): (977)-71-40842
Page 127
127
Bhikkhu Maitri Chairman International Buddhist Society Buddha Nagar, Lumbini, Nepal e-mail: [email protected] , [email protected] phone (office): 00977-71-80133 fax (office): 00977-71-80124
Page 128
128
APPENDIX E GFAAS RESULTS E.1 Calibration Curves
Calibration curve group 1
y = 0.0008x + 0.0057R2 = 0.9909
0.000
0.020
0.040
0.060
0.080
0.100
0.120
0.140
0 20 40 60 80 100 120 140 160
As (ppb)
Peak
Are
a
Page 129
129
Calibration curve group 2
y = 0.0009x + 0.0073R2 = 0.9919
0.000
0.020
0.040
0.060
0.080
0.100
0.120
0.140
0.160
0 20 40 60 80 100 120 140 160
As (ppb)
Peak
Are
a
Page 130
130
Calibration curve group 3
y = 0.001x + 0.0073R2 = 0.9969
0.000
0.020
0.040
0.060
0.080
0.100
0.120
0.140
0.160
0 20 40 60 80 100 120 140 160
As (ppb)
Peak
Are
a
Page 131
131
Calibration curve group 4
y = 0.001x + 0.008R2 = 0.9959
0.000
0.020
0.040
0.060
0.080
0.100
0.120
0.140
0.160
0.180
0 20 40 60 80 100 120 140 160
As (ppb)
Peak
Are
a
Page 132
132
Calibration curve group 5
y = 0.0011x + 0.0108R2 = 0.9945
0.000
0.020
0.040
0.060
0.080
0.100
0.120
0.140
0.160
0.180
0.200
0 20 40 60 80 100 120 140 160
As (ppb)
Peak
Are
a
Page 133
133
Calibration curve group 6
y = 0.0012x + 0.0131R2 = 0.9982
0.000
0.020
0.040
0.060
0.080
0.100
0.120
0.140
0 20 40 60 80 100 120
As (ppb)
Peak
Are
a
Page 134
134
Calibration curve group 7
y = 0.0011x + 0.0104R2 = 0.9936
0.000
0.020
0.040
0.060
0.080
0.100
0.120
0.140
0 20 40 60 80 100 120
As (ppb)
Peak
Are
a
Page 135
135
Calibration curve group 8
y = 0.0009x + 0.0075R2 = 0.9949
0.000
0.020
0.040
0.060
0.080
0.100
0.120
0 20 40 60 80 100 120
As (ppb)
Peak
Are
a
Page 136
136
Calibration curve group 9
y = 0.0008x + 0.0085R2 = 0.9947
0.000
0.020
0.040
0.060
0.080
0.100
0.120
0.140
0.160
0 20 40 60 80 100 120 140 160
As (ppb)
Peak
Are
a
Page 137
137
Calibration curve group 10
y = 0.0014x + 0.0014R2 = 0.9975
-0.020
0.000
0.020
0.040
0.060
0.080
0.100
0.120
0.140
0.160
0.180
0.200
0 20 40 60 80 100 120 140 160
As (ppb)
Peak
Are
a
Page 138
138
Calibration curve group 11
y = 0.0014x + 0.0038R2 = 0.9965
0.000
0.050
0.100
0.150
0.200
0.250
0 20 40 60 80 100 120 140 160
As (ppb)
Peak
Are
a
Page 139
139
Calibration curve group 12
y = 0.0013x + 0.01R2 = 0.9919
0.000
0.050
0.100
0.150
0.200
0.250
0 20 40 60 80 100 120 140 160
As (ppb)
Peak
Are
a
Page 140
140
Calibration curve group 13
y = 0.0015x + 0.0075R2 = 0.9973
0.000
0.050
0.100
0.150
0.200
0.250
0 20 40 60 80 100 120 140 160
As (ppb)
Peak
Are
a
Page 141
141
Calibration curve group 14
y = 0.0015x + 0.0107R2 = 0.9958
0.000
0.050
0.100
0.150
0.200
0.250
0 20 40 60 80 100 120 140 160
As (ppb)
Peak
Are
a
Page 142
142
Calibration curve group 15
y = 0.0016x + 0.0108R2 = 0.9931
0.000
0.050
0.100
0.150
0.200
0.250
0 20 40 60 80 100 120 140 160
As (ppb)
Peak
Are
a
Page 143
143
Calibration curve group 16
y = 0.0017x + 0.0073R2 = 0.9896
0.000
0.050
0.100
0.150
0.200
0.250
0 20 40 60 80 100 120 140 160
As (ppb)
Peak
Are
a
Page 144
144
Calibration curve group 17
y = 0.0017x + 0.0057R2 = 0.9926
0.000
0.050
0.100
0.150
0.200
0.250
0 20 40 60 80 100 120 140 160
As (ppb)
Peak
Are
a
Page 145
145
Calibration curve group 19
y = 0.0012x + 0.0068R2 = 0.9972
0
0.02
0.04
0.06
0.08
0.1
0.12
0.14
0.16
0.18
0.2
0 20 40 60 80 100 120 140 160
As (ppb)
Peak
Are
a
Page 146
146
Calibration curve group 20
y = 0.0013x + 0.0064R2 = 0.9957
0
0.05
0.1
0.15
0.2
0.25
0 20 40 60 80 100 120 140 160
As (ppb)
Peak
Are
a
Page 147
147
Calibration curve group 21
y = 0.0013x + 0.003R2 = 0.9941
0
0.05
0.1
0.15
0.2
0.25
0 20 40 60 80 100 120 140 160
As (ppb)
Peak
Are
a
Page 148
148
Calibration curve group 22
y = 0.0014xR2 = 0.9866
0
0.05
0.1
0.15
0.2
0.25
0 20 40 60 80 100 120 140 160
As (ppb)
Peak
Are
a
Page 149
149
Calibration curve group 23
y = 0.0012x + 0.0127R2 = 0.9897
0
0.05
0.1
0.15
0.2
0.25
0 20 40 60 80 100 120 140 160
As (ppb)
Peak
Are
a
Page 150
150
Calibration curve group 24
y = 0.0013xR2 = 0.9674
0
0.05
0.1
0.15
0.2
0.25
0 20 40 60 80 100 120 140 160
As (ppb)
Peak
Are
a
Page 151
151
Calibration curve group 25
y = 0.0011x + 0.0032R2 = 0.9925
0.000
0.020
0.040
0.060
0.080
0.100
0.120
0.140
0.160
0 20 40 60 80 100 120 140 160
As (ppb)
Peak
Are
a
Page 152
152
Calibration curve group 26
y = 0.001x + 0.0057R2 = 0.9862
0.000
0.020
0.040
0.060
0.080
0.100
0.120
0.140
0.160
0 20 40 60 80 100 120 140 160
As (ppb)
Peak
Are
a
Page 153
153
Calibration curve group 27
y = 0.001x + 0.0081R2 = 0.9943
0.000
0.020
0.040
0.060
0.080
0.100
0.120
0.140
0.160
0.180
0 20 40 60 80 100 120 140 160
As (ppb)
Peak
Are
a
Page 154
154
Calibration curve group 28
y = 0.0012x + 0.0048R2 = 0.9897
0.000
0.020
0.040
0.060
0.080
0.100
0.120
0.140
0.160
0.180
0.200
0 20 40 60 80 100 120 140 160
As (ppb)
Peak
Are
a
Page 155
155
Calibration curve group 29
y = 0.0013x + 0.0099R2 = 0.9909
0.000
0.020
0.040
0.060
0.080
0.100
0.120
0.140
0.160
0.180
0.200
0 20 40 60 80 100 120 140 160
As (ppb)
Peak
Are
a
Page 156
156
Calibration curve group 30
y = 0.0011x + 0.0144R2 = 0.9953
0.000
0.020
0.040
0.060
0.080
0.100
0.120
0.140
0.160
0.180
0.200
0 20 40 60 80 100 120 140 160
As (ppb)
Peak
Are
a
Page 157
157
Calibration curve group 31
y = 0.001x + 0.0121R2 = 0.9908
0.000
0.020
0.040
0.060
0.080
0.100
0.120
0.140
0.160
0.180
0 20 40 60 80 100 120 140 160
As (ppb)
Peak
Are
a
Page 158
158
E.2 Interpolated Results
Analyzed on 7 March 2002
Group 2 slope intercept 0.0009 0.0073 A/S pos Name Peak area Dilution Comments Adj Peak As (µg/L)
51 1 Dina As 1:2 0.006 2 Error 0.012 5 51 1 Dina As 1:2 0.184 2 peak too high 0.368 401 52 1 Dina sp 1:2 0.179 2 peak too high 0.358 390 53 Z1 As 1:2 0.071 2 Sample #1473 0.142 150 54 Z1 sp 1:2 0.052 2 0.104 107 55 Z2 As 0.058 1 Sample #1474 0.058 56 56 Z2 sp 0.045 1 0.045 42 57 1 Dina As 0.213 1 peak too high 0.213 229 58 1 Dina sp 0.132 1 peak too high 0.132 139
Group 3 slope intercept 0.001 0.0073 A/S pos Name Peak area Dilution Comments Adj Peak As (µg/L)
61 3 Maha As 1:2 0.064 2 Sample #5 0.128 121 62 3 Maha sp 1:2 0.056 2 0.112 105 63 6 Som As 1:2 0.157 2 peak too high 0.314 307 64 6 Som T 1:2 0.006 2 0.012 5 65 6 Som sp 1:2 0.136 2 peak too high 0.272 265 66 6 Som sp2 1:2 0.157 2 peak too high 0.314 307 67 6 Som T sp 1:2 0.006 2 0.012 5
Group 4 slope intercept 0.001 0.008 A/S pos Name Peak area Dilution Comments Adj Peak As (µg/L)
68 1 Dina As 1:4 0.126 4 peak too high 0.504 496 69 1 Dina sp 1:4 0.105 4 peak too high 0.42 412 70 19 Maha As 1:2 0.081 2 Sample #987 0.162 154 71 19 Maha sp 1:2 0.069 2 0.138 130 72 Bis As 1:2 0.052 2 no sp data 0.104 96
Page 159
159
Group 5 slope intercept 0.0011 0.0108 A/S pos Name Peak area Dilution Comments Adj Peak As (µg/L)
21 Bir As1 1:5 0.16 5 peak too high 0.8 717 22 Bir As1 1:10 0.096 10 0.96 863 23 Bir As2 1:5 0.161 5 peak too high 0.805 722 24 Bir As2 1:10 0.089 10 0.89 799 25 Bir sp1 1:10 0.09 10 0.9 808 26 Bir sp2 1:10 0.09 10 0.9 808 27 6 Som As 1:4 0.093 4 duplicate 0.372 328 28 6 Som sp1 1:4 0.091 4 duplicate 0.364 321
Group 6 slope int 0.0012 0.0131 A/S pos Name Peak area Dilution Comments Adj Peak As (µg/L)
31 96 Dhap As 1:2 0.095 2 0.19 147 32 96 Dhap sp 1:2 0.097 2 sp > As 0.194 151 33 96 Dhap T 1:2 0.017 2 0.034 17 34 97 Nepal As 0.083 1 0.083 58 35 97 Nepal sp 0.05 1 0.05 31 36 98 Gang As 0.066 1 0.066 44 37 98 Gang sp 0.039 1 0.039 22
Group 7 slope int 0.0011 0.0104 A/S pos Name Peak area Dilution Comments Adj Peak As (µg/L)
38 1 Dina As 1:8 0.08 8 error mag 8X? 0.64 572 39 1 Dina sp 1:8 0.059 8 error mag 8X? 0.472 420 51 12 Nild As 1:2 0.078 2 0.156 132 52 12 Nild sp 1:2 0.08 2 0.16 136 53 11 Yam As 1:2 printer error 0 -9 54 11 Yam sp 1:2 printer error 0 -9 55 17 DhanB As 1:2 printer error 0 -9 56 17 DhanB sp 1:2 printer error 0 -9 57 17 DhanB T 1:2 printer error 0 -9
Page 160
160
Group 8 slope int 0.0009 0.0075 A/S pos Name Peak area Dilution Comments Adj Peak As (µg/L)
51 12 Nild As 1:2 0.071 2 duplicate 0.142 149 52 12 Nild sp 1:2 0.066 2 duplicate 0.132 138 53 11 Yam As 1:2 0.075 2 0.15 158 54 11 Yam sp 1:2 0.079 2 sp > As 0.158 167 55 17 DhanB As 1:2 0.071 2 0.142 149 56 17 DhanB sp 1:2 0.055 2 evaporation <2mL 0.11 114 57 17 DhanB T 1:2 0.002 2 0.004 -4
Group 9 slope int 0.0008 0.0085 A/S pos Name Peak area Dilution Comments Adj Peak As (µg/L)
58 18 Dhanj As 0.083 1 based on curve 9 0.083 93 59 18 Dhanj sp 0.044 1 based on curve 9 0.044 44 60 21 Ish As 1:2 0.045 2 based on curve 9 0.09 102 61 21 Ish sp 1:2 0.036 2 based on curve 9 0.072 79 62 22 Dolr As 0.409 1 instrument crashed 0.409 501
Page 161
161
Analyzed on 12 March 2002
Group 10 slope int 0.0014 0.001 A/S pos Name Peak area Dilution Comments Adj Peak As (µg/L)
51 22 Dolr As 0.138 1 peak too high 0.138 98 52 22 Dolr sp 0.096 1 peak too high 0.096 68 53 24 Gangad As 0.117 1 peak too high 0.117 83 54 24 Gangad sp1 0.085 1 peak too high 0.085 60 55 24 Gangad sp2 0.065 1 peak too high 0.065 45
Group 11 slope int 0.0014 0.004 A/S pos Name Peak area Dilution Comments Adj Peak As (µg/L)
56 114 Om As1 1:5 0.086 5 avg = 328 0.43 304 57 114 Om As2 1:5 0.099 5 avg = 328 0.495 351 58 114 Om sp 1:5 0.075 5 0.375 265 59 114 Om T1 0.004 1 0.004 0 60 114 Om T2 0.004 1 0.004 0 61 115 Chur As 1:5 0.066 5 0.33 233 62 115 Chur sp 1:5 0.057 5 0.285 201 63 116 Rana As 1:2 0.081 2 0.162 113 64 116 Rana sp 1:2 0.072 2 0.144 100
Group 12 slope int 0.0013 0.010 A/S pos Name Peak area Dilution Comments Adj Peak As (µg/L)
21 22 Dolr As 1:2 0.072 2 Sample # 990 0.144 103 22 22 Dolr sp 1:2 0.056 2 0.112 78 23 24 Gangad As 1:2 0.067 2 Sample # 992 0.134 95 24 24 Gangad sp1 1:2 0.050 2 0.1 69 25 24 Gangad sp2 1:2 0.045 2 avg = 66 0.09 62 26 118 Kul As 1:2 0.044 2 avg = 66 0.088 60 27 118 Kul sp 1:2 0.053 2 sp > As 0.106 74 28 119 Bas As 1:5 0.065 5 0.325 242 29 119 Bas sp 1:5 0.067 5 sp > As 0.335 250
Page 162
162
Group 13 slope int 0.0015 0.008 A/S pos Name Peak area Dilution Comments Adj Peak As (µg/L)
31 120 Hem As 1:2 0.045 2 0.09 55 32 120 Hem sp 1:2 0.043 2 0.086 52 33 121 Ranm As 1:2 0.094 2 0.188 120 34 121 Ranm sp 1:2 0.091 2 0.182 116 35 127 Haril As 0.091 1 0.091 56 36 127 Haril sp 0.062 1 0.062 36 37 128 Uma As 1:2 0.056 2 0.112 70 38 128 Uma sp 1:2 0.028 2 0.056 32
Group 14 slope int 0.0015 0.011 A/S pos Name Peak area Dilution Comments Adj Peak As (µg/L)
65 130 Harim As 0.078 1 0.078 45 66 130 Harim sp 0.038 1 0.038 18 67 15 Lok As 1:2 0.110 2 Sample #26 0.22 140 68 15 Lok sp 1:2 0.092 2 0.184 116 69 547 ChitM As 1:2 0.110 2 0.22 140 70 547 ChitM sp 1:2 0.082 2 0.164 102 71 540 MinBd As 1:2 0.088 2 0.176 110 72 540 MinBd sp 1:2 0.080 2 0.16 100
Group 15 slope int 0.0016 0.011 A/S pos Name Peak area Dilution Comments Adj Peak As (µg/L)
51 1438 As 0.002 1 no speciation data 0.002 -6 52 1439 As 0.005 1 0.005 -4 53 1439 sp -0.002 1 -0.002 -8 54 1440 As 0.001 1 0.001 -6 55 1440 sp 0.014 1 sp > As 0.014 2 56 1441 As 0.011 1 0.011 0 57 1441 sp 0.014 1 sp > As 0.014 2 58 1442 As 0.002 1 0.002 -6 59 1442 sp 0.001 1 sp > As 0.001 -6
Page 163
163
Group 16 slope int 0.0017 0.007 A/S pos Name Peak area Dilution Comments Adj Peak As (µg/L)
21 55 Dhanc As 1:2 0.081 2 0.162 91 22 55 Dhanc sp 1:2 0.079 2 0.158 89 23 79 Nar As 1:2 0.063 2 0.126 70 24 79 Nar sp 1:2 0.059 2 0.118 65 25 90 Jokhu As 0.110 1 0.11 60 26 90 Jokhu sp 0.061 1 0.061 32 27 107 Hari As 1:2 0.082 2 0.164 92 28 107 Hari sp 1:2 0.053 2 0.106 58 29 108 Pas As 1:2 0.103 2 0.206 117 30 108 Pas sp 1:2 0.090 2 0.18 102
Group 17 slope int 0.0017 0.006 A/S pos Name Peak area Dilution Comments Adj Peak As (µg/L)
61 138 Bhu As 1:2 0.111 2 0.222 127 62 138 Bhu sp 1:2 0.090 2 0.18 103 63 138 Bhu As 1:4 0.071 4 duplicate 0.284 164 64 138 Bhu sp 1:4 0.041 4 duplicate 0.164 93 65 Sunwal VDC As 0.033 1 0.033 16 66 Sunwal VDC sp 0.033 1 0.033 16 67 1443 As 0.007 1 0.007 1 68 1443 sp 0.006 1 0.006 0 69 1444 As 0.000 1 0 -3 70 1444 sp -0.001 1 -0.001 -4
Page 164
164
Analyzed on 14 March 2002
Group 19 slope int 0.0012 0.007 A/S pos Name Peak area Dilution Comments Adj Peak As (µg/L)
21 1445 As 0.004 1 0.004 -2 22 1445 sp 0.018 1 evaporation <0.3mL left 0.018 9 23 1446 As 0.006 1 0.006 -1 24 1446 sp 0.001 1 evaporation <1.5mL left 0.001 -5 25 1447 As 0.010 1 0.01 3 26 1447 sp 0.012 1 0.012 4 27 1447 T -0.001 1 -0.001 -7
Group 20 slope int 0.0013 0.006 A/S pos Name Peak area Dilution Comments Adj Peak As (µg/L)
31 t=0 As 1:4 0.075 4 0.3 226 32 t=0 sp 1:4 0.069 4 0.276 207 33 t=0.25 As 1:4 0.078 4 0.312 235 34 t=0.25 sp 1:4 0.056 4 0.224 167 35 t=0.5 As 1:4 0.074 4 0.296 223 36 t=0.5 sp 1:4 0.060 4 0.24 180 37 t=0.75 As 1:4 0.081 4 0.324 244 38 t=0.75 sp 1:4 0.073 4 0.292 220 39 t=1 As 1:4 0.087 4 0.348 263 40 t=1 sp 1:4 0.064 4 0.256 192
Group 21 slope int 0.0013 0.003 A/S pos Name Peak area Dilution Comments Adj Peak As (µg/L)
21 t=1.5 As 1:4 0.070 4 0.28 213 22 t=1.5 sp 1:4 0.069 4 0.276 210 23 t=2 As 1:4 0.072 4 0.288 219 24 t=2 sp 1:4 0.083 4 sp > As 0.332 253 25 t=2.5 As 1:4 0.074 4 0.296 225 26 t=2.5 sp 1:4 0.077 4 sp > As 0.308 235 27 t=3.5 As 1:4 0.092 4 0.368 281 28 t=3.5 sp 1:4 0.069 4 0.276 210 29 t=5 As 1:4 0.087 4 0.348 265 30 t=5 sp 1:4 0.089 4 sp > As 0.356 272
Page 165
165
Group 22 slope int 0.0014 0.000 A/S pos Name Peak area Dilution Comments Adj Peak As (µg/L)
51 A1 -0.001 1 -0.001 -1 52 B1 0.015 1 0.015 11 53 A2 0.002 1 0.002 1 54 B2 -0.005 1 -0.005 -4 55 A3 0.000 1 0 0 56 B3 0.005 1 0.005 4 57 A4 -0.003 1 -0.003 -2 58 B4 0.004 1 0.004 3 59 A5 -0.001 1 -0.001 -1 60 B5 0.009 1 0.009 6
Group 23 slope int 0.0012 0.013 A/S pos Name Peak area Dilution Comments Adj Peak As (µg/L)
61 1475-1 As 0.006 1 0.006 -6 62 1475-2 As 0.010 1 identical to 1475-1 As 0.01 -2 63 1475-1 sp 0.025 1 evaporation ? 0.025 10 64 1476 As 0.017 1 evaporation ? 0.017 4 65 1476 sp -0.003 1 -0.003 -13 66 1478 As 0.005 1 no speciation 0.005 -6
Page 166
166
Analyzed on 21 March 2002
Group 26 slope int 0.001 0.006 A/S pos Name Peak area Dilution Comments Adj Peak As (µg/L)
21 t=9 As 1:4 0.064 4 0.256 250 22 t=9 sp 1:4 0.057 4 0.228 222 23 t=20.5 As 1:4 0.061 4 0.244 238 24 t=20.5 sp 1:4 0.053 4 0.212 206 25 t=23 As 1:4 0.057 4 0.228 222 26 t=23 sp 1:4 0.053 4 0.212 206
Group 27 slope int 0.001 0.008 A/S pos Name Peak area Dilution Comments Adj Peak As (µg/L)
51 Bisleri 0.008 1 0.008 0 52 Good Water 0.003 1 0.003 -5 53 Distilled water 0.016 1 0.016 8 54 Frontyard 0.037 1 0.037 29 55 Rest As 1:4 0.040 4 0.16 152 56 Rest sp1 1:4 0.036 4 0.144 136 57 Rest sp2 1:4 0.035 4 0.14 132 58 Rest sp3 1:4 0.038 4 0.152 144
Group 28 slope int 0.0012 0.005 A/S pos Name Peak area Dilution Comments Adj Peak As (µg/L)
31 t=26.25 As 1:4 0.069 4 0.276 226 32 t=26.25 sp 1:4 0.054 4 0.216 176 33 t=29 As 1:4 0.077 4 0.308 253 34 t=29 sp 1:4 0.060 4 0.24 196 35 t=44.5 As 1:4 0.064 4 0.256 209 36 t=44.5 sp 1:4 0.048 4 0.192 156 37 t=49 As 1:4 0.071 4 0.284 233 38 t=49 sp 1:4 0.053 4 0.212 173 39 t=68.5 As 1:4 0.068 4 0.272 223 40 t=68.5 sp 1:4 0.042 4 0.168 136
Page 167
167
Group 29 slope int 0.0013 0.010 A/S pos Name Peak area Dilution Comments Adj Peak As (µg/L)
61 Back(A) As 1:4 0.081 4 0.324 242 62 Back(A) sp1 1:4 0.079 4 0.316 235 63 Back(A) sp2 1:4 0.074 4 0.296 220 64 Back(A) sp3 1:4 0.012 4 error 0.048 29 65 Back(B) As 1:4 0.078 4 0.312 232 66 Back(B) sp1 1:4 0.085 4 sp > As 0.34 254 67 Back(B) sp2 1:4 0.089 4 sp > As 0.356 266 68 Back(B) sp3 1:4 0.081 4 sp > As 0.324 242 69 Shop As 1:4 0.112 4 0.448 337 70 Shop sp 1:4 0.102 4 0.408 306
Group 30 slope int 0.0011 0.014 A/S pos Name Peak area Dilution Comments Adj Peak As (µg/L)
65 Back(B) As 1:5 0.074 5 duplicate 0.37 323 66 Back(B) sp1 1:5 0.055 5 duplicate 0.275 237 67 Back(B) sp2 1:5 0.038 5 high background 0.19 160 68 Back(B) sp3 1:5 0.048 5 duplicate 0.24 205 69 Shop As 1:5 0.057 5 high background 0.285 246 70 Shop sp 1:5 0.086 5 duplicate 0.43 378 21 t=0 As 1:4 0.074 4 0.296 256 22 t=0 sp 1:4 0.065 4 0.26 223 23 t=0.25 As 1:4 0.066 4 0.264 227 24 t=0.25 sp 1:4 0.068 4 sp > As 0.272 234 25 t=0.5 As 1:4 0.064 4 0.256 220 26 t=0.5 sp 1:4 0.067 4 sp > As 0.268 231 27 t=0.75 As 1:4 0.066 4 0.264 227 28 t=0.75 sp 1:4 0.053 4 0.212 180 29 t=1 As 1:4 0.063 4 0.252 216 30 t=1 sp 1:4 0.059 4 0.236 201
Page 168
168
APPENDIX F ARSENIC REMOVAL TECHNOLOGY DATA Run #1 District Nawalparasi VDC Parasi Town/Village Parasi Well description backyard Test date 10-Jan-02 Comments Well is in the backyard of the house I stayed Well currently used for washing and cleaning, but not drinking nor cooking Raw water A/M only BP/I3 & A/M
treatment treatment pH (with pH meter) 7 7.05 7.03 ORP (mV) -45 -62 -47 total alkalinity (mg/L) 180-240 120-180 0-80 total hardness (mg/L as CaCO3) 250 180 250 Total soluble iron (mg/L) 2.5 < 0.1 < 0.1 Total manganese (mg/L) 0 0 0 Total arsenic from GFAAS (ug/L) 242 0 11 Total arsenic from test kit (ug/L) 300 < 5 < 5 As(III) from GFAAS (ug/L) 220 n/a n/a As(III) as % of Total Arsenic 91 n/a n/a Removal efficiency (%) n/a 98 98 Flowrate (mL/minute) n/a 228 324 Run #2 District Nawalparasi VDC Parasi Town/Village Parasi Well description restaurant Test date 11-Jan-02 Comments Well is in the town center, next to a few restaurants The well use is unknown Raw water A/M only BP/I3 & A/M
treatment treatment pH (with pH meter) 6.35 n/a n/a ORP (mV) -37 n/a n/a total alkalinity (mg/L) 120-180 n/a n/a total hardness (mg/L as CaCO3) 250-425 n/a n/a Total soluble iron (mg/L) 7 n/a n/a Total manganese (mg/L) 0 n/a n/a Total arsenic from GFAAS (ug/L) 152 0 0 Total arsenic from test kit (ug/L) 200 < 5 < 5 As(III) from GFAAS (ug/L) 136 0 0 As(III) as % of Total Arsenic 89 n/a n/a Removal efficiency (%) n/a 97 97
Page 169
169
Run #3 District Nawalparasi VDC Parasi Town/Village Parasi Well description shop Test date 13-Jan-02 Comments Well is in front of some shops across the street from where I stayed The well is currently abandoned Raw water A/M only BP/I3 & A/M
treatment treatment pH (with pH meter) 6.9 6.6 6.16 ORP (mV) -61 -45 -13 total alkalinity (mg/L) 180-240 180-240 0-80 total hardness (mg/L as CaCO3) 250 120-180 180-250 Total soluble iron (mg/L) 3.5 < 0.1 < 0.1 Total manganese (mg/L) 0 0 0 Total arsenic from GFAAS (ug/L) 337 0 3 Total arsenic from test kit (ug/L) 250 < 5 < 5 As(III) from GFAAS (ug/L) 306 n/a n/a As(III) as % of Total Arsenic 91 n/a n/a Removal efficiency (%) n/a 99 99 Flowrate (mL/minute) n/a 384 378 Run #4 District Nawalparasi VDC Parasi Town/Village Parasi Well description backyard Test date 14-Jan-02 Comments Same well as run #1 Water condition is different today
Raw water A/M only BP/I3 & A/M treatment treatment
pH (with pH meter) 7.6 6.8 6.31 ORP (mV) -78 -33 -6 total alkalinity (mg/L) 80 80 0-80 total hardness (mg/L as CaCO3) 180-250 180-250 180-250 Total soluble iron (mg/L) n/a n/a n/a Total manganese (mg/L) 0 0 0 Total arsenic from GFAAS (ug/L) 323 0 6 Total arsenic from test kit (ug/L) 280 < 5 < 5 As(III) from GFAAS (ug/L) 237 0 0 As(III) as % of Total Arsenic 73 n/a n/a Removal efficiency (%) n/a 98 98 Flowrate (mL/minute) n/a 408 384
Page 170
170
Run #5 District Rupandehi VDC Devdaha Town/Village Madangram Well description contact person: Bir Bahadur Gurung Test date 16-Jan-02 Comments The well has highest arsenic of all Finnida data Well is not in use Raw water A/M only BP/I3 & A/M
treatment treatment pH (with pH meter) 7.27 n/a 5.98 ORP (mV) -60 n/a -3 total alkalinity (mg/L) 240-360 n/a 120-180 total hardness (mg/L as CaCO3) 80-120 n/a 80-120 Total soluble iron (mg/L) n/a n/a n/a Total manganese (mg/L) n/a n/a n/a Total arsenic from GFAAS (ug/L) 863 n/a 0 Total arsenic from test kit (ug/L) 800 n/a 0 As(III) from GFAAS (ug/L) 808 n/a 0 As(III) as % of Total Arsenic 94 n/a n/a Removal efficiency (%) n/a n/a 99 Flowrate (mL/minute) n/a n/a 366 Run #6 District Rupandehi VDC Devdaha Town/Village Madangram Well description contact person: Somnath Poudel Test date 16-Jan-02 Comments The well is labeled unsafe for drinking and cooking
Raw water A/M only BP/I3 & A/M treatment treatment
pH (with pH meter) 6.49 n/a 6 ORP (mV) -45 n/a -12 total alkalinity (mg/L) 240-360 n/a 80-120 total hardness (mg/L as CaCO3) 120-180 n/a 120-180 Total soluble iron (mg/L) n/a n/a n/a Total manganese (mg/L) n/a n/a n/a Total arsenic from GFAAS (ug/L) 328 n/a 5 Total arsenic from test kit (ug/L) 200 n/a <5 As(III) from GFAAS (ug/L) 321 n/a n/a As(III) as % of Total Arsenic 98 n/a n/a Removal efficiency (%) n/a n/a 98 Flowrate (mL/minute) n/a n/a 360
Page 171
171
Run #7 District Rupandehi VDC Devdaha Town/Village Bangali Well description contact person: Dhan Bahadur Gurung Test date 17-Jan-02 Comments The well is labeled unsafe for drinking and cooking Raw water A/M only BP/I3 & A/M
treatment treatment pH (with pH meter) 6.71 n/a 6.31 ORP (mV) -40 n/a -10 total alkalinity (mg/L) n/a n/a n/a total hardness (mg/L as CaCO3) n/a n/a n/a Total soluble iron (mg/L) n/a n/a n/a Total manganese (mg/L) n/a n/a n/a Total arsenic from GFAAS (ug/L) 149 n/a 0 Total arsenic from test kit (ug/L) 150 n/a < 5 As(III) from GFAAS (ug/L) 114 n/a n/a As(III) as % of Total Arsenic 77 n/a n/a Removal efficiency (%) n/a n/a 97 Flowrate (mL/minute) n/a n/a 362 Run #8 District Nawalparasi VDC Sunwal Town/Village Kirtipur-1 Well description contact person: Om Prakash Test date 20-Jan-02 Comments The well is labeled unsafe for drinking and cooking
Raw water A/M only BP/I3 & A/M treatment treatment
pH (test strips) 6.5 n/a 6 ORP (mV) n/a n/a n/a total alkalinity (mg/L) 240 n/a 120 total hardness (mg/L as CaCO3) 180-250 n/a 180-250 Total soluble iron (mg/L) n/a n/a n/a Total manganese (mg/L) n/a n/a n/a Total arsenic from GFAAS (ug/L) 328 n/a 0 Total arsenic from test kit (ug/L) 350 n/a < 5 As(III) from GFAAS (ug/L) 265 n/a n/a As(III) as % of Total Arsenic 81 n/a n/a Removal efficiency (%) n/a n/a 98 Flowrate (mL/minute) n/a n/a 345
Page 172
172
Run #9 District Nawalparasi VDC Sunwal Town/Village Khakaribari Well description contact person: Dhanpati Bhattarai Test date 21-Jan-02 Comments The well is labeled unsafe for drinking and cooking Raw water A/M only BP/I3 & A/M
treatment treatment pH (test strips) 7.5 n/a 6.5 ORP (mV) n/a n/a n/a total alkalinity (mg/L) 240-360 n/a 120 total hardness (mg/L as CaCO3) n/a n/a n/a Total soluble iron (mg/L) n/a n/a n/a Total manganese (mg/L) 0 n/a 0 Total arsenic from GFAAS (ug/L) 147 n/a 17 Total arsenic from test kit (ug/L) 200 n/a < 5 As(III) from GFAAS (ug/L) 147 n/a n/a As(III) as % of Total Arsenic 100 n/a n/a Removal efficiency (%) n/a n/a 97 Flowrate (mL/minute) n/a n/a 345
Page 173
173
APPENDIX G DIDC WELL DATA MASTER LIST G.1 Basic Well Information RWSSSP - III Updated on 29.8.2001 District: Rupandehi VDC: Devdaha Print date: 22-Jan-02 New Wells Jan-Feb, 2001
SN Contact person Sample # Village Ward # Well type Pop. House- Well depth Age of well Constructed hold (ft) (years) by
1 Dina Nath Bhandari Madangram 5 STW 47 7 98 3 R-III 2 Parbir Pun Bairdanda 9 LTW 73 13 120 R-III 3 Gangadhar Dhakal Madangram 5 STW 45 8 98 3 R-III 4 Bir Bahadur Gurung Madangram 5 STW 55 10 80 3 R-III 5 Maha Sharma(Bhandari) Madangram 5 STW 36 7 115 3 R-III 6 Bal Ram Gaire Madangram 5 STW 118 19 110 4 R-III 7 Bishnu Pd. Lamichhane Madangram 5 STW 36 7 160 3 R-III 8 Somnath Poudel Madangram 5 STW 160 30 82 1 VDC 9 Bal Bd. Thapa Magar Madangram 5 STW 46 8 105 2 R-III
10 Jasbir B.K. Madangram 5 STW 62 9 105 2 R-III 11 Ramji Payasi 11 Madangram 5 STW 90 12 120 2 VDC 12 Kabir Purja Madangram 9 STW 25 3 104 4 private 13 Dhan Bd. Pun Madangram 9 STW 25 4 105 4 private 14 Gaj Bd. Rana Madangram 5 STW 65 8 18 10 private
Page 174
174
New Wells Jan-Feb, 2001
SN Contact person Sample # Village Ward # Well type Pop. House- Well depth Age of well Constructed
hold (ft) (years) by
15 Padam Thapa Madangram 5 STW 10 2 110 2 private
16 Kamal Neupane Madangram 5 DW 18 4 28 4 VDC
17 Tikaram B. K. 646 Madangram 5 STW 250 45 120 2 VDC
18 Balkumar Shrestha 1 Pragatinagar 1 STW 68 10 75 11 R-I
19 Balkumar Shrestha 2 Pragatinagar 1 STW 8 1 80 10 Private
Old Wells Jan-Feb, 2001
SN Contact person Sample # Village Ward # Well type Pop. House- Well depth Age of well Constructed
hold (ft) (years) by
20 Durga Pd. Neupane 3 Pragatinagar 1 STW 90 15 105 7 R-I
21 Jagat Bd. Thapa 4 Pragatinagar 1 STW 80 10 105 10 R-I
22 Dhan Bd. Malla 5 Pragatinagar 1 STW 35 7 105 7 R-I
23 Bhim Raj Neupane 6 Koluhawa 1 STW 35 7 108 7 R-I
24 Jhuma Poudel 7 Koluhawa 1 STW 25 5 110 7 R-I
25 Home Bd Thapa 8 Koluhawa 1 STW 70 14 35 7 R-I
26 Pahun Choudhari 9 Gurung Tola 1 STW 80 10 115 7 R-I
27 Gangadhar 10 Koluhawa 1 STW 30 5 110 7 R-I
28 Gyanumaya Pokhrael 11 Koluhawa 1 STW 35 4 105 7 R-I
29 Khemnarayan Lamsal 12 Pipaldanda 4 STW 90 15 90 7 R-I
Page 175
175
Old Wells Jan-Feb, 2001
SN Contact person Sample # Village Ward # Well type Pop. House- Well depth Age of well Constructed
hold (ft) (years) by
30 Sitaram Kumal 13 Tallokhaireni 4 STW 65 16 90 7 R-I
31 Madhav Kafle 14 Tallokhaireni 4 STW 22 3 38 7 R-I
32 Umakali Thapa 15 Bagali 6 STW 35 7 130 6 R-I
33 Bilram BK 16 Bagali 6 STW 32 11 109 7 R-I
34 Sumitra Midun 17 Bagali 6 STW 43 7 90 6 R-I
35 Gammar Singha 18 Bagali 6 STW 25 4 82 6 R-I
36 Yam Kumari Magar 19 Mukhiya tol 6 STW 20 4 90 6 R-I
37 Nildhwaj Malla 20 Mukhiya tol 6 STW 60 10 73 7 R-I
38 Shanti Lama 21 Mukhiya tol 6 STW 54 9 85 7 R-I
39 Pimala Dumare 22 Mukhiya tol 6 STW 40 8 90 8 R-I
40 Dil Bd. Thapa 23 Bangali 6 STW 24 4 220 7 R-I
41 Basant Sinjali 24 Bangali 6 STW 12 3 120 7 R-I
42 Prithlal Tarau 25 Bangali 6 STW 42 7 115 7 R-I
43 Loknath Pandey 26 Bangali 6 STW 43 7 86 7 R-I
44 Ekadev Neupane 27 Bankitta 6 STW 18 2 30 7 R-I
45 Kul Bd. Thapa 28 Bankitta 6 STW 65 9 35 7 R-I
46 Birakha Bd. Kumal 29 Bangali 6 STW 120 19 146 6 R-I
47 Khum Bdr. Bhandari 30 Bangali 6 STW 35 4 50 7 R-I
48 Lower Secondary School 31 Devdaha STW 95 8 R-I
49 Dhan Bd. Gurung 32 Bangali 6 STW 38 7 70 7 R-I
Page 176
176
Old Wells Jan-Feb, 2001
SN Contact person Sample # Village Ward # Well type Pop. House- Well depth Age of well Constructed
hold (ft) (years) by
50 Dhanjaya Sapkota 33 Bangali 6 STW 7 105 7 R-I
51 Shanta Poudel 34 Mukhiya tol 6 STW 60 11 35 8 R-I
52 Laxami Shrestha 35 Mukhiya tol 6 STW 70 10 80 8 R-I
53 Jayalal Sapkota 36 Bangali 6 STW 50 5 10
54 Til Bd. Khatri 37 Bhaluhi 6 STW 60 11 98 8 R-I
55 Gabulal Choudhari 38 Bhaluhi 8 STW 50 8 98 8 R-I
56 Himal Malla 39 Bhaluhi 8 STW 12 2 95 8 R-I
57 Sapana Malla 40 Bhaluhi 8 STW 50 8 95 8 R-I
58 Jas Bd. Thapa 41 Bhaluhi 8 STW 25 4 98 8 R-I
59 Nar Bd. Bohara 42 Bagkumar 8 STW 5 1 97 8 R-I
60 Tap Bd. Bohara 43 Bagkumar 8 STW 55 10 105 8 R-I
61 Nar Bd. Pun 156 Rainikhola 8 STW 30 5 99 8 R-I
62 Bhim Bd. Thapa 157 Etta Bhatti Purb 8 STW 42 7 90 5 R-II
63 Shushila Pokharel 44 Bhaluhi 9 STW 14 1 105 8 R-I
64 Umakala Khatri 45 Bhaluhi 9 STW 55 9 95 8 R-II
65 Tek Bd. Neupane 46 Bhaluhi 9 STW 60 9 98 8 R-II
66 Radha Bohara 47 Bhaluhi 9 STW 75 10 95 8 R-II
67 Chudamani Poudel 48 Bhaluhi 9 STW 22 2 97 8 R-II
68 Banskharke Ganga Bdr. 49 Bhaluhi 9 STW 30 5 95 8 R-II
69 Umesh Pun 50 Bhaluhi 9 STW 20 4 100 8 R-II
70 Prem Pun 51 Bhaluhi 9 STW 15 5 90 8 R-II
Page 177
177
11-Nov-01
SN Contact person Sample # Village Ward # Well type Pop. House- Well depth Age of well Constructed
hold (ft) (years) by
74 Kamal Neupane 648 Madangram 5 STW 75 12 4 VDC
75 Homnath Dhakal 649 Sheetalnagar 5 STW 7 1 28 1
76 Maha Sharma 987 Madangram 5 STW 8 1 100 1 Private
77 Jhalak Pd. Aryal 988 Madangram 5 STW 100 12 86 4 Private
78 Ishwor Pd.Pandey 989 Madangram 5 STW 7 1 95 4 Private
79 Dolaraj Pangini 990 Madangram 5 STW 6 1 92 2 Private
80 Bishnu Malla 991 Shantinagar 5 STW 4 1 32 8 Private
81 Gangadhar Dhakal 992 Madangram 5 STW 45 7 80 1 R-III
82 Tika Bdr. Thapa 993 Madangram 5 STW 18 4 112 1 Private
83 Nanda Pd. Gralami 994 Devdaha 5 STW 85 13 140 1 Private
23-Nov-01
84 Kushmakhar Bhattarai 350 Bangali 6 STW 8 1 32 15 Private
85 Hari Pd. Neupane 351 Bangali 6 STW 7 1 27 14 Private
86 Tek Bdr. Gaha 352 Bangali 6 STW 8 1 27 13 Private
87 Shanta Karki 353 Mukhiya Tole 6 STW 6 1 30 5 Private
88 Namdev Neupane 354 Shantinagar 6 STW 35 5 75 1 Private
23-Jan-02
89 Keshav Pradhan 1360 Khaireni 3 Boring ? 1-7 Ward ? DWS
90 Krishna Rayamajhi 1474 Madangram 5 STW 8 1 35 1 Private
91 Shahadev Chaudhary 1473 Madangram 5 STW 21 3 28 3 Comm.
Page 178
178
RWSSSP - III
Updated on 9.9.2001
Old Wells
District: Nawalparasi
VDC: Sunwal
Print date: 21-Jan-02
Jul-01
SN Contact person Sample # Village Ward # Well type Pop. House- Well depth Age of well Constructed
hold (ft) (years) by
1 Tilakram Sharma 52 Sunwal 1 STW 25 5 57 6 R-II
2 Jyoti Pd. Bhattarai 53 Sunwal 1 STW 60 6 60 8 R-I
3 Hari Pd. Siris 54 Sunwal 1 STW 23 4 80 6 R-II
4 Dhanchour Budathki 55 Sunwal 1 STW 40 5 65 6 R-II
5 Lalu Rd Ghimire 56 Sunwal 1 STW 125 25 65 6 R-II
6 Tilak Nath Yogi 57 Sunwal 1 STW 60 6 75 6 R-II
7 Khan Raj Upadhya 58 Sunwal 1 STW 40 6 90 6 R-II
8 Somnath Pri. School 59 Sunwal 1 STW 350 ? 85 R-II
9 Bhim Bd. Bhandari 60 Sunwal 1 STW 20 5 13 R-II
10 Shukra Raj Gurung 61 Sunwal 1 STW 63 9 70 7 R-II
11 Bhuwan Shrestha 62 Sunwal 1 STW 30 5 75 7 R-II
12 Purna Bd Gurung 63 Sunwal 3 STW 30 5 70 7 R-II
13 Narendra Raj Sharma 104 Assamwasi 3 STW 70 12 70 7 R-II
Page 179
179
Jul-01
SN Contact person Sample # Village Ward # Well type Pop. House- Well depth Age of well Constructed
hold (ft) (years) by
14 Premlal Rimal 105 Assamwasi 3 STW 84 12 130 7 R-II
15 Birendra Sherchan 106 Assamwasi 3 STW 21 3 45 7 R-II
16 Hari Bdr. Kandel 107 Assamwasi 3 STW 16 2 110 7 R-II
17 Pashu Ram Bhandari 108 Khaireni 3 STW 35 5 130 6 R-II
18 Bhupanand 109 Khaireni 3 STW ? 5 55 6 R-II
19 Saraswati Neupane 110 Khaireni 3 STW 35 5 70 6 R-II
20 Lilaram Puna 111 Naduwa 3 STW 225 ? 35 6 R-II
21 Yan Pd. Sherchan 112 Naduwa 3 STW 28 4 36 6 R-II
22 Kharka Bdr. Thapa 113 Naduwa 3 STW ? 5 115 6 R-II
23 Om Prakash Puna 114 Kirtipur-1 3 STW 50 5 85 6 R-II
24 Churamani Aale 115 Kirtipur-1 3 STW ? 5 85 6 R-II
25 Rana Bdr. Darlami 116 Kirtipur-1 3 STW ? 4 75 6 R-II
26 Nava Durga Pri 117 Kirtipur-1 3 STW ? 10 80 7 R-II
27 Kul Pd. Bhattarai 118 Kirtipur-1 3 STW 52 6 75 7 R-II
28 Basant Bhattarai 119 Kirtipur 3 STW 80 10 80 6 R-II
29 Hemlal Burung 120 Kirtipur 3 STW 42 6 75 6 R-II
30 Ranmati Budhathoki 121 Kirtipur 3 STW ? 6 60 6 R-II
31 Shishika Manmaya Gurung 122 Kirtiput-2 6 STW 250 80 R-II
32 Manmaya Gurung 123 Kirtiput-2 6 STW 40 5 45 6 R-II
33 Jhag Bdr. Puna 124 Kirtiput-2 6 STW 80 10 60 6 R-II
Page 180
180
Jul-01
SN Contact person Sample # Village Ward # Well type Pop. House- Well depth Age of well Constructed
hold (ft) (years) by
34 Ram Pd. Gurung 125 Kirtiput-2 6 STW 35 5 45 R-II
35 Puna Bd. Rana 126 Kirtiput-2 6 STW 35 5 85 7 R-II
36 Hailal Gurung 127 Kirtiput-2 6 STW 42 7 105 7 R-II
37 Umashankar Sharma 128 Kirtiput-2 6 STW 35 5 135 7 R-II
38 Chauba Bdr. Gurung 129 Kirtiput-2 6 STW ? 5 56 7 R-II
39 Harimaya Hamal 130 Kirtiput-2 6 STW 42 6 130 7 R-II
40 Mek Bdr. Gurung 142 Kirtiput-1 6 STW 35 5 120 6 R-II
41 Bhagirathi Kunwar 131 Bisasaya 6 STW ? 3 ? 7 R-II
42 Chandra Pd. Kunwar 132 Bisasaya 6 STW ? 7 110 7 R-II
43 Prem Bdr. Chaudhari 133 Bisasaya 6 STW 55 7 80 7 R-II
44 Ammar Pd. Kunwar 134 Bisasaya 6 STW ? 10 180 7 R-II
45 Soharan Kunwar 135 Bisasaya 6 STW ? 6 70 7 R-II
46 Ram Pd. Kunwar 136 Sunwal ? STW ? 6 64 7 R-II
47 Nil Pd. Pathak 137 Bisasaya 6 STW 54 9 100 7 R-II
48 Bhumilal Dhakal 138 Bisasaya 6 STW ? 5 60 R-II
49 ? 139 Bisasaya 6 STW ? 5 80 4 R-II
50 ? 140 Bisasaya 6 STW ? 3 115 7 R-II
51 Jeevlal Pandey 141 Bisasaya 6 STW ? 7 57 7 R-II
52 Padam Bdr. Masrange 64 Banaha 4 STW 60 9 75 6 R-II
53 Padam Bdr. Thapa 65 Banaha 4 STW 35 6 30 6 R-II
Page 181
181
Jul-01
SN Contact person Sample # Village Ward # Well type Pop. House- Well depth Age of well Constructed
hold (ft) (years) by
54 Buddhiram Kunwar 66 Sunwal 4 STW 42 7 65 6 R-II
55 Ganesh Chapagain 67 Hadaha 4 STW 105 12 60 6 R-II
56 Krishna Pd. Acharya 68 Turiya 4 STW 45 7 100 6 R-II
57 Usha Hamal 69 Turiya 4 STW 35 9 46 6 R-II
58 Man Bdr. Rana 70 Turiya 4 STW 30 5 ? 6 R-II
59 Chhabilal Dhakal 71 Turiya 4 STW 17 1 35 6 R-II
60 Umakanta Upadhaya 72 Ramwapur 4 STW 400 95 6 R-II
61 Dilliram Dhakal 73 Ramwapur 4 STW 50 7 90 6 R-II
62 ? 74 Ramwapur 4 STW 70 1 25 3 R-II
63 Krishna Lamichhani 75 Ramwapur 4 STW 42 7 90 7 R-II
64 Nar Bdr. …. 76 Turiya 4 STW 20 5 72 6 R-II
65 Tim Bdr. Puna 77 Ramwapur 4 STW 42 7 84 6 R-II
66 Sampurna Nanda Bupta 78 Turiya 4 STW 50 10 82 6 R-II
67 Narendra Bdr. Shrestha 79 Chauraha 4 STW 100 10 60 6 R-II
68 Nawanarayan Bhattarai 80 Chauraha 4 STW 30 5 110 6 R-II
69 Lumbini Sugar Mill 1 Chauraha ? STW 700 200 ? R-II
70 Yam Bdr. Lamtari Magar 81 Gaha 4 STW 52 8 73 6 R-II
71 Durga Pd. Dumre 82 Sunwal 4 STW 20 4 60 6 R-II
72 Mohan Lal Shrestha 83 Sunwal 4 STW 70 10 85 6 R-II
73 Ganga Bdr. Gurung 84 Sunwal 4 STW 30 5 65 7 R-II
Page 182
182
Jul-01
SN Contact person Sample # Village Ward # Well type Pop. House- Well depth Age of well Constructed
hold (ft) (years) by
74 Purannath Kunwar 85 Gaindakhal 5 STW 48 7 80 7 R-II
75 Karna Bdr. Thapa 86 Gaindakhal 5 STW 50 5 95 7 R-II
76 Laxmima Subedi 87 Gaindakhal 5 STW 45 5 105 7 R-II
77 Khirnath Kunwar 88 Khakaribari 5 STW 28 4 48 7 R-II
78 Sukai Kumal 89 Khakaribari 5 STW 105 15 115 7 R-II
79 Jokhu Kunwar 90 Khakaribari 5 STW 85 9 45 7 R-II
80 Shivadhar Kunwar 91 Khakaribari 5 STW 40 10 105 7 R-II
81 Man Bdr. Kunwar 92 Sunwal 5 STW ? 10 104 7 R-II
82 Dandapani Bhusal 93 Khakaribari 5 STW ? 5 105 7 R-II
83 Dhan Ku. Bhattarai 94 Khakaribari 5 STW 350 115 7 R-II
84 Kunjaramani Poudel 95 Khakaribari 5 STW 35 5 115 R-II
85 Dhanpati Bhattarai 96 Khakaribari 5 STW ? 5 70 7 R-II
86 Nepalnath Kunwar 97 Khakaribari 5 STW 55 5 115 7 R-II
87 Gangaram Kunwar 98 Khakaribari 5 STW 28 4 105 7 R-II
88 Jugun Kunwar 99 Hasnapur 5 STW 35 8 10 7 R-II
89 Bhola Chamar 100 Hasnapur 5 STW 35 5 53 7 R-II
90 Polarnath Kunwar 101 Khakaribari 5 STW 24 2 115 7 R-II
91 Poshnath Bhusal 102 Khakaribari 5 STW 36 3 85 7 R-II
92 Purna Bdr. Chhetri 103 Simaldanda 5 STW 35 6 30 7 R-II
93 Ram Pd. Gyanwali 143 Sisahani 7 STW 75 12 45 7 R-II
Page 183
183
Jul-01
SN Contact person Sample # Village Ward # Well type Pop. House- Well depth Age of well Constructed
hold (ft) (years) by
94 Shree Janjariti Sec. School 144 Targauli 7 STW 426 105 7 R-II
95 Prem Bdr. Gurung 145 Targauli 7 STW 25 4 112 7 R-II
96 Kaladhar Kharel 146 Targauli 7 STW 72 9 148 7 R-II
97 Chinni Pd. Kathariya 147 Targauli 7 STW 65 15 115 7 R-II
98 Govinda Kunwar 148 Targauli 7 STW 65 9 120 7 R-II
99 Kul Bdr. Thapa 149 Gaurighat 7 STW 80 12 110 7 R-II
100 Shovakhar Sapkota 150 Targauli 7 STW 80 12 100 R-II
101 Prem Bdr. Tripali 151 Gaurighat 7 STW 48 8 50 7 R-II
102 Parshuran Aryal 152 Asaniya 7 STW 6 1 55 7 R-II
103 Sita Paudel 153 Asaniya 7 STW 84 12 58 7 R-II
104 Dilaram Bhandari 154 Asaniya 7 STW 28 5 45 7 R-II
105 Narayan Acharya 155 Jimire 7 STW 12 2 40 7 R-II
106 Purna Bdr. Darji 158 Vetlauri 7 STW 52 8 200 7 R-II
107 Jhin Bdr. Thapa 159 Ganesh Basti 7 STW 32 5 85 7 R-II
108 Imati Thapa 160 Ganesh Basti 7 STW 28 4 53 7 R-II
109 Lal Bdr. Thapa 161 Asaniya 7 STW 25 4 45 7 R-II
110 Durga Aryal 162 Asaniya 7 STW 24 4 45 7 R-II
111 Sher Bdr. Tamang 163 Asaniya 7 STW 32 4 90 7 R-II
112 Bam Bdr. Rana 164 Asaniya 7 STW 38 6 90 7 R-II
113 Tek Bdr. Rana 165 Asaniya 7 STW 65 10 125 7 R-II
Page 184
184
Jul-01
SN Contact person Sample # Village Ward # Well type Pop. House- Well depth Age of well Constructed
hold (ft) (years) by
114 Krishna Bdr. Bista 166 Asaniya 7 STW 43 6 52 7 R-II
115 Bir Bdr. Kurral 167 Jemire 7 STW 45 5 28 7 R-II
116 Ravi Roka 168 Jemire 7 STW 60 45 7 R-II
117 Tikaram Pantmi 169 Targauli 7 STW 85 11 45 7 R-II
118 Shyam Kandel 170 Asaniya 7 STW 25 3 58 7 R-II
119 Ram Bdr. Pawdel 171 Asaniya 7 STW 42 8 90 7 R-II
120 Lekh Bdr. Pamwar 172 Bairagnath 8 STW 75 10 210 7 R-II
121 Devman Gurung 173 Bairagnath 8 STW 84 12 82 7 R-II
122 Rajendra Thaoa 174 Bairagnath 8 STW 125 20 80 7 R-II
123 Lok Bdr. B. Ka. 175 Bairagnath 8 STW 95 12 150 7 R-II
124 Liladhar Regmi 176 Bairagnath 8 STW 125 16 80 7 R-II
125 Indrajit Agrabari 177 Bairagnath 8 STW 48 6 200 7 R-II
126 Man Bdr. Magar 178 Pane 8 STW 72 11 75 7 R-II
127 Yag Bdr. Gurung 179 Pane 8 STW 92 12 95 7 R-II
128 Bur Bdr. Gurung 180 Palat 8 STW 75 10 150 7 R-II
129 Ram Pd. Shrestha 181 Siran 8 STW 115 20 125 8 R-II
130 Gopal Thapa 182 Deviyan 8 STW 9 3 25 7 R-II
131 Sukmaya Tarrang 183 Deviyan 8 STW 200 28 70 7 R-II
132 Narayan Dutta Gautam 184 Deviyan 8 STW ? ? 65 7 R-II
133 Mim Bdr. Chhetri 185 Deviyan 8 STW 15 2 45 7 R-II
Page 185
185
Jul-01
SN Contact person Sample # Village Ward # Well type Pop. House- Well depth Age of well Constructed
hold (ft) (years) by
134 Jamuna Kanwar 186 Siran 8 STW 32 5 145 7 R-II
135 Dilip Pd. Kharal 187 Siran 8 STW 52 12 ? 7 R-II
136 Shyam Devi 188 Siran 8 STW 150 20 ? R-II
137 Sita Gurung 189 Bairagnath 8 STW 120 20 95 7 R-II
138 Krishna Pd. Strestha 190 Bairagnath 8 STW 75 15 95 7 R-II
139 Chandra Bdr. Rana 191 Plot. No. 4 8 STW 75 10 90 7 R-II
140 Meena Gurung 192 Plot. No. 4 8 STW 82 10 140 7 R-II
141 Padam Lohani 193 Plot. No. 4 8 STW 75 11 96 7 R-II
142 Hastalal Sanyasi 194 Plot. No. 4 8 STW 38 6 95 7 R-II
143 Punrna Pd. Regmi 195 Plot. No. 4 8 STW 42 6 95 7 R-II
144 Narayan Dawadi 196 Plot. No. 4 8 STW 200 30 260 7 R-II
145 Tulasi Pd. Regmi 197 Plot. No. 4 8 STW 32 4 105 7 R-II
146 Ram Bdr. Thapa 198 Plot. No. 4 8 STW 45 6 55 7 R-II
147 Ram Pd. Paudel 199 Plot. No. 4 8 STW 92 15 190 7 R-II
148 Dhan Bdr. Pura 200 Plot. No. 4 8 STW 48 6 125 7 R-II
149 Bhupal B. Ka. 201 Milan 8 STW 110 14 130 7 R-II
150 Jit Bdr. Bai 202 Milan 8 STW 130 16 190 7 R-II
151 Dhan Bdr. Nepali 203 Bairagnath 8 STW 85 11 140 7 R-II
152 Ram Bdr. Nagarkoti 204 Bairagnath 8 STW 150 24 210 7 R-II
153 Sanka Mardaniya 205 Bairagnath 8 STW 21 3 190 7 R-II
Page 186
186
Jul-01
SN Contact person Sample # Village Ward # Well type Pop. House- Well depth Age of well Constructed
hold (ft) (years) by
154 Jagat Bdr. Magar 206 Pokhari 8 STW 75 12 150 7 R-II
155 Hari Bdr. Burung 207 Pokhari 8 STW 125 20 140 7 R-II
156 Janga Bdr. Puna 208 Kalika 8 STW 73 12 150 7 R-II
157 Padam Bdr. Regmi 209 Kalika 8 STW 84 12 105 7 R-II
158 Sher Bdr. Nepali 210 Kalika 8 STW 77 11 210 7 R-II
159 Durga Pd. Rana 211 Tilkahana 9 STW 105 10 20 7 R-II
160 Karak Bdr. Chhetri 212 Tilkahana 9 STW 28 4 55 7 R-II
161 Nar Bdr. Rana 213 Tilkahana 9 STW 75 40 55 7 R-II
162 Bali Ram Roka 214 Tilkahana 9 STW 18 3 60 7 R-II
163 Dal Bdr. Puna 215 Tilkahana 9 STW 45 6 15 7 R-II
164 Min Bd. Curung 540 Kirtipur 3 LTW 45 6 200 NRC
165 Lila Ram Pun 553 Naduwa 3 STW 6 1 35 Private
166 Chit Maya Curung 547 Kirtipur 3 STW 6 1 75 Private
167 Dig Bd. Burung 546 Kirtipur 3 STW 18 1 75 Private
? Sunwal VDC ? Sunwal
Page 187
187
11-Nov-01
SN Contact person Sample # Village Ward # Well type Pop. House- Well depth Age of well Constructed
hold (ft) (years) by
168 Shuka Bdr. Gurung 541 Kirtipur-1 3 STW 7 1 18 Private
169 Ram Bdr. Gurung 542 Kirtipur 3 STW 5 1 15 Private
170 Kedar Shrestha 543 Kirtipur-1 3 STW 45 6 70 4 VDC
171 Basanta Bhattarai 544 Kirtipur-1 3 STW 50 Private
172 Karna Bdr. Gurung 545 Kirtipur-1 3 STW 10 108 Private
173 Bguman Singh Baral 548 Kirtipur-2 3 STW 45 Private
174 Umashankar Sharma 549 Kirtipur-2 3 STW 6 1 18 Private
175 Kul Bdr. Kunwar 550 Kirtipur-2 3 STW 50 7 75 Private
176 Chandra Bdr. Gurung 551 Kirtipur-2 3 STW 50 8 75 Com.
177 Om Pd.Puna 552 Kirtipur-1 3 STW 18 4 110 Private
21-Jan-02
SN Contact person Sample # Village Ward # Well type Pop. House- Well depth Age of well Constructed
hold (ft) (years) by
178 Deepak Thapa 1309 Kirtipur-1 3 STW 6 1 121 2 Private
179 Dhana Maya Pun 1310 Kirtipur-1 3 STW 8 1 72 22 Private
180 Uma Sherchan 1313 Naduwa Tole 3 STW 4 1 ? 3 Private
181 Thaneshwor Pandey 1315 Khahari Baari 5 STW 36 6 105 7 Comm.
182 Village Development Committee 1341 Sunwal 1 STW ? ? 35 5 Comm.
Page 188
188
21-Jan-02
SN Contact person Sample # Village Ward # Well type Pop. House- Well depth Age of well Constructed
hold (ft) (years) by
183 Nar Bdr. Thapa 1308 Kirtipur-1 3 STW 5 1 90 1 Private
184 Til Bdr. Thapa 1311 Kirtipur-1 3 STW 11 1 17 15 Private
185 Sitaram Neupane 1312 Kirtipur-1 3 STW 43 6 70 8 Comm.
186 Ram Bdr. Thapa 1314 Asamwasi 3 STW ? ? ? 3 Private
187 Netra Bhattarai 1316 Bairagnath 8 STW 5 1 25 2 Private
23-Jan-02
188 Hari Lal Gurung 1478 Kirtipur-2 3 STW 8 1 70 0
Legend:
Pop. = Population
STW = Suction Tubewell
LTW = Lift Tubewell
DW = Dug Well
R-I = RWSSSP phase 1
R-II = RWSSSP phase 2
R-III = RWSSSP phase 3
VDC = Village Development Committee
DWS = Department of Water Supply and Sewerage, Royal Government of Nepal
NRC = Nepal Red Cross
Page 189
189
G.2 Arsenic Information RWSSSP - III Updated on 29.8.2001 District: Rupandehi VDC: Devdaha Print date: 22-Jan-02 New Wells Jan-Feb, 2001
SN Contact person FINNIDA records My test kit results My GFAAS results Total As (mg/L) Total As Total As As(III) As(V) % As(III) 0-0.01 0.01-0.05 > 0.05 (mg/L) (mg/L) (mg/L) (mg/L)
1 Dina Nath Bhandari 0.281 0.5 0.572 0.42 0.152 73.42657 2 Parbir Pun 0.001 3 Gangadhar Dhakal 0.01 4 Bir Bahadur Gurung 2.62 0.8 0.863 0.808 0.055 93.62688 5 Maha Sharma(Bhandari) 1.63 0.1-0.2 0.121 0.105 0.016 86.77686 6 Bal Ram Gaire 2.28 7 Bishnu Pd. Lamichhane 0.026 8 Somnath Poudel 0.303 0.2 0.328 0.321 0.007 97.86585 9 Bal Bd. Thapa Magar ND
10 Jasbir B.K. 0.03 11 Ramji Payasi 0.007 12 Kabir Purja ND 13 Dhan Bd. Pun ND 14 Gaj Bd. Rana ND
Page 190
190
New Wells Jan-Feb, 2001
SN Contact person FINNIDA records My test kit results My GFAAS results
Total As (mg/L) Total As Total As As(III) As(V) % As(III)
0-0.01 0.01-0.05 > 0.05 (mg/L) (mg/L) (mg/L) (mg/L)
15 Padam Thapa ND
16 Kamal Neupane 0.01
17 Tikaram B. K. 0.01
18 Balkumar Shrestha 0.012
19 Balkumar Shrestha 0.008
Old Wells Jan-Feb, 2001
SN Contact person FINNIDA records My test kit results My GFAAS results
Total As (mg/L) Total As Total As As(III) As(V) % As(III)
0-0.01 0.01-0.05 > 0.05 (mg/L) (mg/L) (mg/L) (mg/L)
20 Durga Pd. Neupane ND
21 Jagat Bd. Thapa 0.001
22 Dhan Bd. Malla ND
23 Bhim Raj Neupane ND
24 Jhuma Poudel ND
25 Home Bd Thapa ND
26 Pahun Choudhari ND
27 Gangadhar 0.001
28 Gyanumaya Pokhrael 0.008
29 Khemnarayan Lamsal 0.048
Page 191
191
Old Wells Jan-Feb, 2001
SN Contact person FINNIDA records My test kit results My GFAAS results
Total As (mg/L) Total As Total As As(III) As(V) % As(III)
0-0.01 0.01-0.05 > 0.05 (mg/L) (mg/L) (mg/L) (mg/L)
30 Sitaram Kumal 0.035
31 Madhav Kafle 0.011
32 Umakali Thapa ND
33 Bilram BK ND
34 Sumitra Midun ND
35 Gammar Singha ND
36 Yam Kumari Magar 0.115 0.05-0.1 0.158 0.167 -0.009 105.6962
37 Nildhwaj Malla 0.152 0.1-0.2 0.149 0.138 0.011 92.61745
38 Shanti Lama ND
39 Pimala Dumare ND
40 Dil Bd. Thapa ND
41 Basant Sinjali 0.05
42 Prithlal Tarau 0.098
43 Loknath Pandey 0.102 0.1 0.14 0.116 0.024 82.85714
44 Ekadev Neupane ND
45 Kul Bd. Thapa 0.011
46 Birakha Bd. Kumal ND
47 Khum Bdr. Bhandari 0.046
48 Lower Secondary School ND
49 Dhan Bd. Gurung 0.133 error 0.149 0.114 0.035 76.51007
Page 192
192
Old Wells Jan-Feb, 2001
SN Contact person FINNIDA records My test kit results My GFAAS results
Total As (mg/L) Total As Total As As(III) As(V) % As(III)
0-0.01 0.01-0.05 > 0.05 (mg/L) (mg/L) (mg/L) (mg/L)
50 Dhanjaya Sapkota 0.08 0.05-0.1 0.093 0.044 0.049 47.31183
51 Shanta Poudel 0.008
52 Laxami Shrestha ND
53 Jayalal Sapkota
54 Til Bd. Khatri ND
55 Gabulal Choudhari ND
56 Himal Malla ND
57 Sapana Malla ND
58 Jas Bd. Thapa ND
59 Nar Bd. Bohara ND
60 Tap Bd. Bohara ND
61 Nar Bd. Pun ND
62 Bhim Bd. Thapa ND
63 Shushila Pokharel ND
64 Umakala Khatri 0.001
65 Tek Bd. Neupane ND
66 Radha Bohara ND
67 Chudamani Poudel ND
68 Banskharke Ganga Bdr. ND
69 Umesh Pun 0.001
70 Prem Pun ND
Page 193
193
11-Nov-01
SN Contact person FINNIDA records My test kit results My GFAAS results
Total As (mg/L) Total As Total As As(III) As(V) % As(III)
0-0.01 0.01-0.05 > 0.05 (mg/L) (mg/L) (mg/L) (mg/L)
74 Kamal Neupane ND
75 Homnath Dhakal ND
76 Maha Sharma 0.145 0.1 0.154 0.13 0.024 84.41558
77 Jhalak Pd. Aryal 0.156 0.1-0.2
78 Ishwor Pd.Pandey 0.147 0.1-0.2 0.102 0.079 0.023 77.45098
79 Dolaraj Pangini 0.094 0.05-0.1 0.103 0.078 0.025 75.72816
80 Bishnu Malla 0.156 0.1-0.2 0.096
81 Gangadhar Dhakal 0.081 0.05 0.095 0.066 0.029 69.47368
82 Tika Bdr. Thapa ND
83 Nanda Pd. Gralami ND
23-Nov-01
84 Kushmakhar Bhattarai ND
85 Hari Pd. Neupane ND
86 Tek Bdr. Gaha ND
87 Shanta Karki ND
88 Namdev Neupane ND
23-Jan-02
89 Keshav Pradhan ND
90 Krishna Rayamajhi ND 0.05-0.1 0.056 0.042 0.014 75
91 Shahadev Chaudhary 0.1-0.2 0.15 0.107 0.043 71.33333
Page 194
194
RWSSSP - III
Updated on 9.9.2001
Old Wells
District: Nawalparasi
VDC: Sunwal
Print date: 21-Jan-02
Jul-01
SN Contact person FINNIDA records My test kit results My GFAAS results
Total As (mg/L) Total As Total As As(III) As(V) % As(III)
0-0.01 0.01-0.05 > 0.05 (mg/L) (mg/L) (mg/L) (mg/L)
1 Tilakram Sharma 0.020
2 Jyoti Pd. Bhattarai ND
3 Hari Pd. Siris 0.038
4 Dhanchour Budathki 0.103 0.2 0.091 0.089 0.002 97.8022
5 Lalu Rd Ghimire ND
6 Tilak Nath Yogi ND
7 Khan Raj Upadhya 0.092
8 Somnath Pri. School 0.052
9 Bhim Bd. Bhandari ND
10 Shukra Raj Gurung ND
11 Bhuwan Shrestha 0.084
12 Purna Bd Gurung 0.004
13 Narendra Raj Sharma 0.038
Page 195
195
Jul-01
SN Contact person FINNIDA records My test kit results My GFAAS results
Total As (mg/L) Total As Total As As(III) As(V) % As(III)
0-0.01 0.01-0.05 > 0.05 (mg/L) (mg/L) (mg/L) (mg/L)
14 Premlal Rimal ND
15 Birendra Sherchan 0.033
16 Hari Bdr. Kandel 0.068 0.092 0.058 0.034 63.04348
17 Pashu Ram Bhandari 0.110 0.117 0.102 0.015 87.17949
18 Bhupanand 0.021
19 Saraswati Neupane
20 Lilaram Puna 0.087
21 Yan Pd. Sherchan 0.030
22 Kharka Bdr. Thapa ND
23 Om Prakash Puna 0.341 0.3-0.5 0.328 0.265 0.063 80.79268
24 Churamani Aale 0.228/0.25 0.2-0.3 0.233 0.201 0.032 86.26609
25 Rana Bdr. Darlami 0.097 0.113 0.1 0.013 88.49558
26 Nava Durga Pri ND
27 Kul Pd. Bhattarai 0.106 0.06 0.074 -0.014 123.3333
28 Basant Bhattarai 0.219 0.3 0.242 0.25 -0.008 103.3058
29 Hemlal Burung 0.079 0.055 0.052 0.003 94.54545
30 Ranmati Budhathoki 0.088 0.12 0.116 0.004 96.66667
31 Shishika Manmaya Gurung 0.092
32 Manmaya Gurung ND
33 Jhag Bdr. Puna 0.006
Page 196
196
Jul-01
SN Contact person FINNIDA records My test kit results My GFAAS results
Total As (mg/L) Total As Total As As(III) As(V) % As(III)
0-0.01 0.01-0.05 > 0.05 (mg/L) (mg/L) (mg/L) (mg/L)
34 Ram Pd. Gurung 0.054
35 Puna Bd. Rana ND
36 Hailal Gurung 0.068 0.056 0.036 0.02 64.28571
37 Umashankar Sharma 0.073 0.07 0.032 0.038 45.71429
38 Chauba Bdr. Gurung ND
39 Harimaya Hamal 0.054 0.02-0.05 0.045 0.018 0.027 40
40 Mek Bdr. Gurung ND
41 Bhagirathi Kunwar ND
42 Chandra Pd. Kunwar ND
43 Prem Bdr. Chaudhari ND
44 Ammar Pd. Kunwar ND
45 Soharan Kunwar ND
46 Ram Pd. Kunwar 0.044
47 Nil Pd. Pathak ND
48 Bhumilal Dhakal 0.124/0.25 0.164 0.093 0.071 56.70732
49 ? ND
50 ? 0.023
51 Jeevlal Pandey 0.030
52 Padam Bdr. Masrange ND
53 Padam Bdr. Thapa ND
Page 197
197
Jul-01
SN Contact person FINNIDA records My test kit results My GFAAS results
Total As (mg/L) Total As Total As As(III) As(V) % As(III)
0-0.01 0.01-0.05 > 0.05 (mg/L) (mg/L) (mg/L) (mg/L)
54 Buddhiram Kunwar ND
55 Ganesh Chapagain ND
56 Krishna Pd. Acharya 0.019
57 Usha Hamal ND
58 Man Bdr. Rana 0.023
59 Chhabilal Dhakal 0.008
60 Umakanta Upadhaya ND
61 Dilliram Dhakal ND
62 ? ND
63 Krishna Lamichhani 0.042
64 Nar Bdr. …. ND
65 Tim Bdr. Puna ND
66 Sampurna Nanda Bupta 0.025
67 Narendra Bdr. Shrestha 0.078 0.1-0.2 0.07 0.065 0.005 92.85714
68 Nawanarayan Bhattarai 0.014
69 Lumbini Sugar Mill ND
70 Yam Bdr. Lamtari Magar ND
71 Durga Pd. Dumre ND
72 Mohan Lal Shrestha ND
73 Ganga Bdr. Gurung
Page 198
198
Jul-01
SN Contact person FINNIDA records My test kit results My GFAAS results
Total As (mg/L) Total As Total As As(III) As(V) % As(III)
0-0.01 0.01-0.05 > 0.05 (mg/L) (mg/L) (mg/L) (mg/L)
74 Purannath Kunwar ND
75 Karna Bdr. Thapa ND
76 Laxmima Subedi ND
77 Khirnath Kunwar ND
78 Sukai Kumal ND
79 Jokhu Kunwar 0.052 0.06 0.032 0.028 53.33333
80 Shivadhar Kunwar ND
81 Man Bdr. Kunwar ND
82 Dandapani Bhusal ND
83 Dhan Ku. Bhattarai ND
84 Kunjaramani Poudel 0.046
85 Dhanpati Bhattarai 0.162,I/0.28,I 0.2 0.147 0.151 -0.004 102.7211
86 Nepalnath Kunwar 0.055 0.058 0.031 0.027 53.44828
87 Gangaram Kunwar 0.054 0.044 0.022 0.022 50
88 Jugun Kunwar 0.109
89 Bhola Chamar 0.062
90 Polarnath Kunwar 0.047
91 Poshnath Bhusal 0.028
92 Purna Bdr. Chhetri 0.035
93 Ram Pd. Gyanwali 0.028
Page 199
199
Jul-01
SN Contact person FINNIDA records My test kit results My GFAAS results
Total As (mg/L) Total As Total As As(III) As(V) % As(III)
0-0.01 0.01-0.05 > 0.05 (mg/L) (mg/L) (mg/L) (mg/L)
94 Shree Janjariti Secondary School 0.058
95 Prem Bdr. Gurung 0.123/0.200
96 Kaladhar Kharel ND
97 Chinni Pd. Kathariya 0.021
98 Govinda Kunwar 0.018
99 Kul Bdr. Thapa ND
100 Shovakhar Sapkota ND
101 Prem Bdr. Tripali ND
102 Parshuran Aryal 0.031
103 Sita Paudel ND
104 Dilaram Bhandari ND
105 Narayan Acharya ND
106 Purna Bdr. Darji ND
107 Jhin Bdr. Thapa ND
108 Imati Thapa ND
109 Lal Bdr. Thapa 0.030
110 Durga Aryal 0.074
111 Sher Bdr. Tamang ND
112 Bam Bdr. Rana ND
113 Tek Bdr. Rana ND
Page 200
200
Jul-01
SN Contact person FINNIDA records My test kit results My GFAAS results
Total As (mg/L) Total As Total As As(III) As(V) % As(III)
0-0.01 0.01-0.05 > 0.05 (mg/L) (mg/L) (mg/L) (mg/L)
114 Krishna Bdr. Bista ND
115 Bir Bdr. Kurral ND
116 Ravi Roka ND
117 Tikaram Pantmi ND
118 Shyam Kandel 0.025
119 Ram Bdr. Pawdel ND
120 Lekh Bdr. Pamwar ND
121 Devman Gurung 0.028
122 Rajendra Thaoa 0.08
123 Lok Bdr. B. Ka. 0.048
124 Liladhar Regmi ND
125 Indrajit Agrabari 0.015
126 Man Bdr. Magar ND
127 Yag Bdr. Gurung ND
128 Bur Bdr. Gurung ND
129 Ram Pd. Shrestha ND
130 Gopal Thapa ND
131 Sukmaya Tarrang ND
132 Narayan Dutta Gautam ND
133 Mim Bdr. Chhetri 0.027
Page 201
201
Jul-01
SN Contact person FINNIDA records My test kit results My GFAAS results
Total As (mg/L) Total As Total As As(III) As(V) % As(III)
0-0.01 0.01-0.05 > 0.05 (mg/L) (mg/L) (mg/L) (mg/L)
134 Jamuna Kanwar 0.034
135 Dilip Pd. Kharal ND
136 Shyam Devi ND
137 Sita Gurung ND
138 Krishna Pd. Strestha ND
139 Chandra Bdr. Rana ND
140 Meena Gurung ND
141 Padam Lohani ND
142 Hastalal Sanyasi ND
143 Punrna Pd. Regmi ND
144 Narayan Dawadi ND
145 Tulasi Pd. Regmi ND
146 Ram Bdr. Thapa ND
147 Ram Pd. Paudel ND
148 Dhan Bdr. Pura ND
149 Bhupal B. Ka. ND
150 Jit Bdr. Bai ND
151 Dhan Bdr. Nepali ND
152 Ram Bdr. Nagarkoti ND
153 Sanka Mardaniya ND
Page 202
202
Jul-01
SN Contact person FINNIDA records My test kit results My GFAAS results
Total As (mg/L) Total As Total As As(III) As(V) % As(III)
0-0.01 0.01-0.05 > 0.05 (mg/L) (mg/L) (mg/L) (mg/L)
154 Jagat Bdr. Magar ND
155 Hari Bdr. Burung ND
156 Janga Bdr. Puna ND
157 Padam Bdr. Regmi ND
158 Sher Bdr. Nepali 0.042
159 Durga Pd. Rana ND
160 Karak Bdr. Chhetri ND
161 Nar Bdr. Rana ND
162 Bali Ram Roka ND
163 Dal Bdr. Puna ND
164 Min Bd. Curung 0.136 0.11 0.1 0.01 90.90909
165 Lila Ram Pun 0.148
166 Chit Maya Curung 0.124 0.14 0.102 0.038 72.85714
167 Dig Bd. Burung 0.088
? Sunwal VDC 0.01 0.016 0.016 0 100
Page 203
203
11-Nov-01
SN Contact person FINNIDA records My test kit results My GFAAS results
Total As (mg/L) Total As Total As As(III) As(V) % As(III)
0-0.01 0.01-0.05 > 0.05 (mg/L) (mg/L) (mg/L) (mg/L)
168 Shuka Bdr. Gurung ND
169 Ram Bdr. Gurung ND
170 Kedar Shrestha ND
171 Basanta Bhattarai ND
172 Karna Bdr. Gurung ND
173 Bguman Singh Baral ND
174 Umashankar Sharma ND
175 Kul Bdr. Kunwar ND
176 Chandra Bdr. Gurung ND
177 Om Pd.Puna ND
21-Jan-02
SN Contact person FINNIDA records My test kit results My GFAAS results
Total As (mg/L) Total As Total As As(III) As(V) % As(III)
0-0.01 0.01-0.05 > 0.05 (mg/L) (mg/L) (mg/L) (mg/L)
178 Deepak Thapa
179 Dhana Maya Pun
180 Uma Sherchan
181 Thaneshwor Pandey
182 Village Development Committee
Page 204
204
21-Jan-02
SN Contact person FINNIDA records My test kit results My GFAAS results
Total As (mg/L) Total As Total As As(III) As(V) % As(III)
0-0.01 0.01-0.05 > 0.05 (mg/L) (mg/L) (mg/L) (mg/L)
183 Nar Bdr. Thapa ND
184 Til Bdr. Thapa ND
185 Sitaram Neupane ND
186 Ram Bdr. Thapa ND
187 Netra Bhattarai ND
23-Jan-02
188 Hari Lal Gurung 0
Legend:
Pop. = Population
ND = Non-detect (detection level unknown)
Page 205
205
APPENDIX H TUBEWELL SPECIATION DATA H.1 Basic Well Information RWSSSP - III Updated on 29.8.2001 District: Rupandehi + Nawalparasi VDC: Devdaha + others SN Contact person Sample # Village Pop. Number of Well depth Well age FINNIDA records households (ft) (years) Total As (mg/L)
1 Dina Nath Bhandari Madangram 47 7 98 3 0.281 4 Bir Bahadur Gurung Madangram 55 10 80 3 2.62 5 Maha Sharma(Bhandari) Madangram 36 7 115 3 1.63 8 Somnath Poudel Madangram 160 30 82 1 0.303
36 Yam Kumari Magar 19 Mukhiya tol 20 4 90 6 0.115 37 Nildhwaj Malla 20 Mukhiya tol 60 10 73 7 0.152 43 Loknath Pandey 26 Bangali 43 7 86 7 0.102 49 Dhan Bd. Gurung 32 Bangali 38 7 70 7 0.133 50 Dhanjaya Sapkota 33 Bangali 7 105 7 0.08 76 Maha Sharma 987 Madangram 8 1 100 1 0.145 78 Ishwor Pd.Pandey 989 Madangram 7 1 95 4 0.147 79 Dolaraj Pangini 990 Madangram 6 1 92 2 0.094 81 Gangadhar Dhakal 992 Madangram 45 7 80 1 0.081 90 Krishna Rayamajhi 1474 Madangram 8 1 35 1 0 91 Shahadev Chaudhary 1473 Madangram 21 3 28 3
Page 206
206
SN Contact person Sample # Village Pop. Number of Well depth Well age FINNIDA records
households (ft) (years) Total As (mg/L)
4 Dhanchour Budathki 55 Sunwal 40 5 65 6 0.103
16 Hari Bdr. Kandel 107 Assamwasi 16 2 110 7 0.068
17 Pashu Ram Bhandari 108 Khaireni 35 5 130 6 0.110
23 Om Prakash Puna 114 Kirtipur-1 50 5 85 6 0.341
24 Churamani Aale 115 Kirtipur-1 ? 5 85 6 0.228/0.25
25 Rana Bdr. Darlami 116 Kirtipur-1 ? 4 75 6 0.097
27 Kul Pd. Bhattarai 118 Kirtipur-1 52 6 75 7 0.106
28 Basant Bhattarai 119 Kirtipur 80 10 80 6 0.219
29 Hemlal Burung 120 Kirtipur 42 6 75 6 0.079
30 Ranmati Budhathoki 121 Kirtipur ? 6 60 6 0.088
36 Hailal Gurung 127 Kirtipur-2 42 7 105 7 0.068
37 Umashankar Sharma 128 Kirtipur-2 35 5 135 7 0.073
39 Harimaya Hamal 130 Kirtipur-2 42 6 130 7 0.054
48 Bhumilal Dhakal 138 Bisasaya ? 5 60 0.124/0.25
67 Narendra Bdr. Shrestha 79 Chauraha 100 10 60 6 0.078
79 Jokhu Kunwar 90 Khakaribari 85 9 45 7 0.052
85 Dhanpati Bhattarai 96 Khakaribari ? 5 70 7 0.162,I/0.28,I
86 Nepalnath Kunwar 97 Khakaribari 55 5 115 7 0.055
87 Gangaram Kunwar 98 Khakaribari 28 4 105 7 0.054
164 Min Bd. Curung 540 Kirtipur 45 6 200 0.136
166 Chit Maya Curung 547 Kirtipur 6 1 75 0.124
? Sunwal VDC ? Sunwal
Page 207
207
H.2 Site Visit Information RWSSSP - III
Updated on 29.8.2001
District: Rupandehi + Nawalparasi
VDC: Devdaha + others
SN Contact person Sample My GFAAS results pH ORP Temp
date Total As As(III) As(V) % As(III) % As(III) (mV) (C)
(mg/L) adjusted
1 Dina Nath Bhandari 16-Jan-02 0.572 0.42 0.152 73 73 6.71 -42
4 Bir Bahadur Gurung 16-Jan-02 0.863 0.808 0.055 94 94 7.27 -60
5 Maha Sharma(Bhandari) 16-Jan-02 0.121 0.105 0.016 87 87 6.5 -46 23
8 Somnath Poudel 16-Jan-02 0.328 0.321 0.007 98 98 6.49 -45
36 Yam Kumari Magar 17-Jan-02 0.158 0.167 -0.009 106 100 6.78 -46
37 Nildhwaj Malla 17-Jan-02 0.149 0.138 0.011 93 93 6.76 -44
43 Loknath Pandey 17-Jan-02 0.14 0.116 0.024 83 83 6.65 -37
49 Dhan Bd. Gurung 17-Jan-02 0.149 0.114 0.035 77 77 6.71 -40 24
50 Dhanjaya Sapkota 17-Jan-02 0.093 0.044 0.049 47 47 6.72 -21 25
76 Maha Sharma 16-Jan-02 0.154 0.13 0.024 84 84 6.38 -39
78 Ishwor Pd.Pandey 17-Jan-02 0.102 0.079 0.023 77 77 6.57 -26
79 Dolaraj Pangini 17-Jan-02 0.103 0.078 0.025 76 76 6.63 -34
81 Gangadhar Dhakal 17-Jan-02 0.095 0.066 0.029 69 69 6.68 -39
90 Krishna Rayamajhi 16-Jan-02 0.056 0.042 0.014 75 75 5.76 -5
91 Shahadev Chaudhary 16-Jan-02 0.15 0.107 0.043 71 71 6.02 -20 18
Page 208
208
SN Contact person Sample My GFAAS results pH ORP Temp
date Total As As(III) As(V) % As(III) % As(III) (mV) (C)
(mg/L) adjusted
4 Dhanchour Budathki 21-Jan-02 0.091 0.089 0.002 98 98 7.5 broken
16 Hari Bdr. Kandel 21-Jan-02 0.092 0.058 0.034 63 63 7 broken
17 Pashu Ram Bhandari 21-Jan-02 0.117 0.102 0.015 87 87 broken
23 Om Prakash Puna 20-Jan-02 0.328 0.265 0.063 81 81 6.5 broken
24 Churamani Aale 20-Jan-02 0.233 0.201 0.032 86 86 broken
25 Rana Bdr. Darlami 20-Jan-02 0.113 0.1 0.013 88 88 broken
27 Kul Pd. Bhattarai 20-Jan-02 0.06 0.074 -0.014 123 100 broken
28 Basant Bhattarai 20-Jan-02 0.242 0.25 -0.008 103 100 broken
29 Hemlal Burung 20-Jan-02 0.055 0.052 0.003 95 95 broken
30 Ranmati Budhathoki 20-Jan-02 0.12 0.116 0.004 97 97 broken
36 Hailal Gurung 20-Jan-02 0.056 0.036 0.02 64 64 broken
37 Umashankar Sharma 20-Jan-02 0.07 0.032 0.038 46 46 broken
39 Harimaya Hamal 20-Jan-02 0.045 0.018 0.027 40 40 broken
48 Bhumilal Dhakal 21-Jan-02 0.164 0.093 0.071 57 57 broken
67 Narendra Bdr. Shrestha 21-Jan-02 0.07 0.065 0.005 93 93 broken
79 Jokhu Kunwar 21-Jan-02 0.06 0.032 0.028 53 53 broken
85 Dhanpati Bhattarai 21-Jan-02 0.147 0.151 -0.004 103 100 7.5 broken 22
86 Nepalnath Kunwar 21-Jan-02 0.058 0.031 0.027 53 53 broken
87 Gangaram Kunwar 21-Jan-02 0.044 0.022 0.022 50 50 broken
164 Min Bd. Curung 20-Jan-02 0.11 0.1 0.01 91 91 broken
166 Chit Maya Curung 20-Jan-02 0.14 0.102 0.038 73 73 broken
? Sunwal VDC 21-Jan-02 0.016 0.016 0 100 100 7.5 broken
Page 209
209
H.3 Total Arsenic Correlations Total arsenic is correlated with the followings:
• DIDC (formerly FINNIDA) total arsenic records
• PH
• ORP
• Well depth
• Well age
• Population
• Number of households
Except for DIDC total arsenic records, no correlations were observed.
Page 210
210
Fig H.3.1 Correlation between DIDC (formerly FINNIDA) total arsenic records with the author’s GFAAS results
0
0.5
1
1.5
2
2.5
3
0 0.1 0.2 0.3 0.4 0.5 0.6 0.7 0.8 0.9 1
GFAAS Arsenic Data (mg/L total As)
Finn
ida
Ars
enic
Dat
a (m
g/L
tota
l As)
Page 211
211
Fig H.3.2 Correlation between total arsenic and pH
0
0.1
0.2
0.3
0.4
0.5
0.6
0.7
0.8
0.9
1
5.5 6 6.5 7 7.5 8
pH
Tota
l ars
enic
(mg/
L)
Page 212
212
Fig H.3.3 Correlation between total arsenic and ORP
0
0.1
0.2
0.3
0.4
0.5
0.6
0.7
0.8
0.9
1
-70 -60 -50 -40 -30 -20 -10 0
ORP (mV)
Tota
l ars
enic
(mg/
L)
Page 213
213
Fig H.3.4 Correlation between total arsenic and well depth
y = -12.618x + 90.007R2 = 0.0041
0
50
100
150
200
250
0 0.1 0.2 0.3 0.4 0.5 0.6 0.7 0.8 0.9 1
Total Arsenic (mg/L)W
ell D
epth
(ft)
Page 214
214
Fig H.3.5 Correlation between total arsenic and well age
0
0.1
0.2
0.3
0.4
0.5
0.6
0.7
0.8
0.9
1
0 1 2 3 4 5 6 7 8
Well age (years)
Tota
l ars
enic
(mg/
L)
Page 215
215
Fig H.3.6 Correlation between total arsenic and population (number of users)
Effect of # of Users on Total Arsenic
0
0.1
0.2
0.3
0.4
0.5
0.6
0.7
0.8
0.9
1
0 20 40 60 80 100 120 140 160 180
Number of users (i.e. population)
Tota
l Ars
enic
(mg/
L)
Page 216
216
Fig H.3.7 Correlation between total arsenic and number of households
y = 0.0103x + 0.0939R2 = 0.1005
0
0.1
0.2
0.3
0.4
0.5
0.6
0.7
0.8
0.9
1
0 5 10 15 20 25 30 35
Number of Households
Tota
l Ars
enic
(mg/
L)
Page 217
217
APPENDIX I OXIDATION KINETICS DATA
Time Total As As(III) As(V) % As(III) % As(III) pH ORP(h) (µg/L) (µg/L) (µg/L) adjusted (mV) 0 256 223 33 87 87 7.00
0.25 227 234 -7 103 100 7.06 -74 0.5 220 231 -11 105 100 6.92 -71 0.75 227 180 47 79 79 6.87 -63
1 216 201 15 93 93 7.10 -72 1.5 239 166 73 69 69 7.08 -71 2 173 166 7 96 96 7.13 -78
2.5 269 166 103 62 62 7.08 -73 3.5 256 153 103 60 60 7.18 -75 5 213 189 24 89 89 7.30 -82 9 250 222 28 89 89 7.29 -81
20.5 238 206 32 87 87 7.83 -102 23 222 206 16 93 93 7.88 -108
26.25 226 176 50 78 78 7.81 -119 29 253 196 57 77 77 7.99 -111
44.5 209 156 53 75 75 8.12 -114 49 233 173 60 74 74 8.50 -127
68.5 223 136 87 61 61 8.60 -139
Page 218
218
REFERENCES 1 World Bank Indicator Database April 2002. Accessed on April 25, 2002. Available: www.worldbank.org 2 United Nations Children’s Fund Statistics. “Nepal Country Information.” 29 Feb 2002. Available: http://www.unicef.org/statis/Country_1Page122.html 3 United Nations Children’s Fund Statistics. “Nepal Country Information.” 29 Feb 2002. Available: http://www.unicef.org/statis/Country_1Page122.html 4 World Bank Indicator Database April 2002. Accessed on April 25, 2002. Available: www.worldbank.org 5 United Nations Children’s Fund Statistics. “Nepal Country Information.” 29 Feb 2002. Available: http://www.unicef.org/statis/Country_1Page122.html 6 World Bank Group. “Nepal at a glance.” 29 Feb 2002. Available: http://www.worldbank.org/data/countrydata/aag/npl_aag.pdf 7 Technische Universitat Bergakadenie Freiberg. “Arsenic in Groundwater Water.” Internet. Nov 28, 2001. Available: www.geo.tu-freiberg.de/~planer/arsenic/home.htm 8 The Mineral Native Arsenic. Internet. Nov 28, 2001. Available: http://mineral.galleries.com/minerals/elements/arsenic/arsenic.htm 9 United States Geological Survey. “Arsenic bearing minerals.” Internet. Nov 28,. 2001. Available: http://wwwbrr.cr.usgs.gov/arsenic/minerals.htm 10 World Health Organization. “Arsenic in Drinking Water.” Internet. Nov 28, 2001. Available: www.who.int/inf-fsen/fact210.html 11 Nepal Red Cross Society “Research on Arsenic Contamination in the Groundwater of Terai Nepal.” Final Report. Sep 2000. 12 Halsey, Patricia M. “Arsenic Contamination Study of Drinking Water in Nepal.” MIT Master of Engineering Thesis. May 2000. 13 Agency for Toxic Substances and Disease Registry. “ToxFAQs for Arsenic.” Internet. Nov 28, 2001. Available: www.atsdr.cdc.gov/tfacts2.html 14 Agency for Toxic Substances and Disease Registry. “ToxFAQs for Arsenic.” Internet. Nov 28, 2001. Available: www.atsdr.cdc.gov/tfacts2.html
Page 219
219
15 Technische Universitat Bergakadenie Freiberg. “Arsenic in Groundwater Water.” Internet. Nov 28, 2001. Available: www.geo.tu-freiberg.de/~planer/arsenic/home.htm 16 World Health Organization. “United Nations Synthesis Report on Arsenic in Drinking Water.” Internet. Feb 28, 2002. Available: http://www.who.int/water_sanitation_health/Arsenic/ArsenicUNRep1.htm 17 Halsey, Patricia M. “Arsenic Contamination Study of Drinking Water in Nepal.” MIT Master of Engineering Thesis. May 2000. 18 World Health Organization. “United Nations Synthesis Report on Arsenic in Drinking Water.” Internet. Feb 28, 2002. Available: http://www.who.int/water_sanitation_health/Arsenic/ArsenicUNRep1.htm 19 University of Western Australia. “Arsenic water chemistry.” Internet. Nov 28, 2001. Available: www.cwr.uwa.edu.au/~linge/word/arsenic.htm 20 Domenico, P., Schwartz, F. “Physical and Chemical Hydrogeology.” 2nd Edition. John Wiley & Sons, Inc. New York, NY, USA. 1998 21 “Water Quality and Treatment.” 4th Edition. American Water Works Association (AWWA). 1990. 22 Morel, F., Hering, J. “Principles and Applications of Aquatic Chemistry.” John Wiley & Sons, Inc. New York, NY, USA. 1993 23 Gonzales, E. “Arsenic Speciation in Marine Sediment: Effects of Redox Potential and Reducing Conditions.” International Journal of Environmental Analytical Chemistry. Vol 68 (3), page 377-389. 1997. 24 Saranko, C.J., Halmes, N.C., Roberts, S.M. “The Toxicity of Arsenite and Arsenate.” Division of Waste Management, Florida Department of Environmental Protection. Nov 1998. 25 Coddington, K. “A Review of Arsenicals in Biology.” Toxicol. Environ. Chem. Vol 11, pages 281-290, 1986 26 World Health Organization. “United Nations Synthesis Report on Arsenic in Drinking Water.” Internet. Feb 28, 2002. Available: http://www.who.int/water_sanitation_health/Arsenic/ArsenicUNRep1.htm 27 World Bank. “Bangladesh Arsenic Mitigation Brief.” Internet. Accessed April 9, 2002. Available: http://wbln1018.worldbank.org/sar/sa.nsf/a22044d0c4877a3e852567de0052e0fa/b9afdd8008fdaf508525680800518020?OpenDocument
Page 220
220
28 Briscoe, J. “A Role for Water Supply and Sanitation in the Child Survival Revolution”. Bulletin of the Pan American Health Organization. Vol. 21, No.2, 1987 29 World Health Organization. “Researchers Warn of Impending Disaster from Mass Arsenic Poisoning.” Bulletin of the World Health Organization (WHO). Internet. Sep 8, 2000. Available: http://www.who.int/inf-pr-2000/en/pr2000-55.html 30 World Health Organization. “Researchers Warn of Impending Disaster from Mass Arsenic Poisoning.” Bulletin of the World Health Organization (WHO). Internet. Sep 8, 2000. Available: http://www.who.int/inf-pr-2000/en/pr2000-55.html 31 United Nations. “Arsenic Poisoning in Bangladesh and West Bengal.” UN Foundation Report Oct 1999. Internet. Accessed April 9, 2002. Available: http://www.unfoundation.org/grants/report_arsenic_poisoning_bangladesh_bengal.pdf 32 Harvard University. “Harvard Arsenic Project.” Internet. Updated on July 31, 2000. Accessed on April 9, 2002. Available: http://phys4.harvard.edu/~wilson/arsenic_project_countries.html 33 United Nations. “Arsenic Poisoning in Bangladesh and West Bengal.” UN Foundation Report Oct 1999. Internet. Accessed April 9, 2002. Available: http://www.unfoundation.org/grants/report_arsenic_poisoning_bangladesh_bengal.pdf 34 Clarke, T. “Bangladeshis to sue over Arsenic Poisoning.” Nature. Published on Oct 11, 2001. Internet. Accessed May 8, 2002. Available: www.nature.com/nsu/011011/-11-11-14.html 35 Dhaka Community Hospital Trust. “Arsenic Problem in Bangladesh.” Internet. Accessed April 9, 2002. Available: www.dchtrust.org/arsenic%20Problem.htm 36 Dhaka Community Hospital Trust. “Arsenic Problem in Bangladesh.” Internet. Accessed April 9, 2002. Available: www.dchtrust.org/arsenic%20Problem.htm 37 McArthur, J.M. “Arsenic in Groundwater: Testing Pollution Mechanisms for Sedimentary Aquifers in Bangladesh.” Water Resources Research. Vol 37 (1), page 109-117. 2001. 38 Harvard University “Harvard Arsenic Project.” Internet. April 28, 2002. Available: http://phys4.harvard.edu/~wilson
Page 221
221
39 World Health Organization. “Researchers Warn of Impending Disaster from Mass Arsenic Poisoning.” Bulletin of the World Health Organization (WHO). Internet. Sep 8, 2000. Available: http://www.who.int/inf-pr-2000/en/pr2000-55.html 40 Murcott, S. “Arsenic Removal Technology.” Presentation to 1111..447799 ccllaassss,, WWaatteerr aanndd SSaanniittaattiioonn IInnffrraassttrruuccttuurree PPllaannnniinngg iinn DDeevveellooppiinngg CCoouunnttrriieess.. FFeebbrruuaarryy 2255,, 22000022 41 Nepal Red Cross Society “Research on Arsenic Contamination in the Groundwater of Terai Nepal.” Final Report. Sep 2000. 42 Nepal Red Cross Society “Research on Arsenic Contamination in the Groundwater of Terai Nepal.” Final Report. Sep 2000. 43 Halsey, Patricia M. “Arsenic Contamination Study of Drinking Water in Nepal.” MIT Master of Engineering Thesis. May 2000. 44 Nepal Red Cross Society “Research on Arsenic Contamination in the Groundwater of Terai Nepal.” Final Report. Sep 2000. 45 Nepal Red Cross Society “Research on Arsenic Contamination in the Groundwater of Terai Nepal.” Final Report. Sep 2000. 46 Nepal Red Cross Society “Research on Arsenic Contamination in the Groundwater of Terai Nepal.” Final Report. Sep 2000. 47 Rural Water Supply and Sanitation support Program. “Summary of Arsenic Test Results.” Jan 2002. 48 Bridge, T. Husain, M., “Groundwater arsenic poisoning and a solution to the arsenic disaster in Bangladesh.” University of Kansas, Kansas, USA. 2000. 49 Ahmed, K. “Discussion Proceedings #2.” Associate Professor, Department of Geology, Dhaka University. Internet. Accessed May 12, 2002. Available: http://phys4.harvard.edu/~wilson/Proceedings2.html 50 Halsey, Patricia M. “Arsenic Contamination Study of Drinking Water in Nepal.” MIT Master of Engineering Thesis. May 2000. 51 Harvard University. “Harvard Arsenic Project, Introduction” Internet. Updated June 6, 2001. Accessed: May 12, 2002. Available: http://phys4.harvard.edu/%7Ewilson/arsenic_project_introduction.html 52 Bridge, T. “Arsenic Crisis: A challenge for Scientists to find the Origin of the Arsenic that caused the Poisoning Disaster in Bangladesh.” University of Kansas, Kansas, USA. 2000.
Page 222
222
53 Dainichi Consultants Inc. “Arsenic Calamity of Bangladesh.” Internet. Nov 28, 2001. Available: www.dainichi-consul.co.jp/english/arsen.htm 54 Nickson, R, et al. “Arsenic poisoning of Bangladesh groundwater.” Nature. Vol 395, page 338. Published Sep 24, 1998. Internet. Accessed May 12, 2002. Available: http://www.nature.com/cgi-taf/DynaPage.taf?file=/nature/journal/v395/n6700/full/395338a0_fs.html 55 Chowdhury, T., et al. “Arsenic poisoning in the Ganges delta.” Nature. Brief Communications. Vol 401, page 545-546. Published Oct 7, 1998. Internet. Accessed May 12, 2002. Available: http://www.nature.com/cgi-taf/DynaPage.taf?file=/nature/journal/v401/n6753/full/401545b0_fs.html 56 Harvey, C. “The Arsenic Crisis in Bangladesh: An Epidemiological, Hydrologic and Biogeochemical Analysis”. Associated Professor, Massachusetts Institute of Technology. Presentation on April 22, 2002. 57 Harvard University. “Harvard Arsenic Project, Introduction” Internet. Accessed: May 12, 2002. Available: http://phys4.harvard.edu/%7Ewilson/arsenic_project_introduction.html 58 Husain, M. “Oxyhydroxide Reduction and Agrochemical Hypotheses: Myth or Reality?” Kansas Dept. of Health And Environment, Kansas, USA. 2000. 59 Nickson, R, et al. “Arsenic poisoning of Bangladesh groundwater.” Nature. Vol 395, page 338. Published September 24, 1998. Internet. Accessed May 12, 2002. Available: http://www.nature.com/cgi-taf/DynaPage.taf?file=/nature/journal/v395/n6700/full/395338a0_fs.html 60 Nickson, R, et al. “Arsenic poisoning of Bangladesh groundwater.” Nature. Vol 395, page 338. Published September 24, 1998. Internet. Accessed May 12, 2002. Available: http://www.nature.com/cgi-taf/DynaPage.taf?file=/nature/journal/v395/n6700/full/395338a0_fs.html 61 Nickson, R, et al. “Arsenic poisoning of Bangladesh groundwater.” Nature. Vol 395, page 338. Published September 24, 1998. Internet. Accessed May 12, 2002. Available: http://www.nature.com/cgi-taf/DynaPage.taf?file=/nature/journal/v395/n6700/full/395338a0_fs.html 62 Nickson, R, et al. “Arsenic poisoning of Bangladesh groundwater.” Nature. Vol 395, page 338. Published September 24, 1998. Internet. Accessed May 12, 2002. Available: http://www.nature.com/cgi-taf/DynaPage.taf?file=/nature/journal/v395/n6700/full/395338a0_fs.html
Page 223
223
63 Harvey, C. “The Arsenic Crisis in Bangladesh: An Epidemiological, Hydrologic and Biogeochemical Analysis”. Associated Professor, Massachusetts Institute of Technology. Presentation on April 22, 2002. 64 Hemond, H., Fechner-Levy, E. “Chemical Fate and Transport in the Environment.” Academic Press. San Diego, CA, USA. 2000 65 World Health Organization. “United Nations Synthesis Report on Arsenic in Drinking Water.” Internet. Feb 28, 2002. Available: http://www.who.int/water_sanitation_health/Arsenic/ArsenicUNRep1.htm 66 Hurd, J “Evaluation of Three Arsenic Removal Technologies in Nepal.” MIT Master of Engineering Thesis. May 2000. 67 Environment and Public Health Organization. “A Survey Report on Water Quality Testing from Different Rain Water Collection Systems and Other Water Sources in Daugha BDC, Gulmi.” Kathmandu, Nepal. Nov 1996. 68 Harvey, C. “The Arsenic Crisis in Bangladesh: An Epidemiological, Hydrologic and Biogeochemical Analysis”. Associated Professor, Massachusetts Institute of Technology. Presentation on April 22, 2002. 69 World Health Organization. “United Nations Synthesis Report on Arsenic in Drinking Water.” Internet. Feb 28, 2002. Available: http://www.who.int/water_sanitation_health/Arsenic/ArsenicUNRep1.htm 70 Coddington, K. “A Review of Arsenicals in Biology.” Toxicol. Environ. Chem. Vol 11, pages 281-290, 1986 71 Saranko, C.J., Halmes, N.C., Roberts, S.M. “The Toxicity of Arsenite and Arsenate.” Division of Waste Management, Florida Department of Environmental Protection. Nov 1998. 72 World Health Organization. “United Nations Synthesis Report on Arsenic in Drinking Water.” Internet. Feb 28, 2002. Available: http://www.who.int/water_sanitation_health/Arsenic/ArsenicUNRep1.htm 73 World Health Organization. “United Nations Synthesis Report on Arsenic in Drinking Water.” Internet. Feb 28, 2002. Available: http://www.who.int/water_sanitation_health/Arsenic/ArsenicUNRep1.htm 74 World Health Organization. “United Nations Synthesis Report on Arsenic in Drinking Water.” Internet. Feb 28, 2002. Available: http://www.who.int/water_sanitation_health/Arsenic/ArsenicUNRep1.htm
Page 224
224
75 Martinez, A., Montoro, R., et al. “Effect of Cooking Temperatures on Chemical Changes in Species of Organic Arsenic in Seafood.” Journal of Agricultural Food Chemistry, 2001, vol. 49, page 2272-2276. 76 World Health Organization. “United Nations Synthesis Report on Arsenic in Drinking Water.” Internet. Feb 28, 2002. Available: http://www.who.int/water_sanitation_health/Arsenic/ArsenicUNRep1.htm 77 World Health Organization. “United Nations Synthesis Report on Arsenic in Drinking Water.” Internet. Feb 28, 2002. Available: http://www.who.int/water_sanitation_health/Arsenic/ArsenicUNRep1.htm 78 World Health Organization. “United Nations Synthesis Report on Arsenic in Drinking Water.” Internet. Feb 28, 2002. Available: http://www.who.int/water_sanitation_health/Arsenic/ArsenicUNRep1.htm 79 World Health Organization. “United Nations Synthesis Report on Arsenic in Drinking Water.” Internet. Feb 28, 2002. Available: http://www.who.int/water_sanitation_health/Arsenic/ArsenicUNRep1.htm 80 Saranko, C.J., Halmes, N.C., Roberts, S.M. “The Toxicity of Arsenite and Arsenate.” Division of Waste Management, Florida Department of Environmental Protection. Nov 1998. 81 University of Western Australia. “Arsenic Sources and Toxicity.” Internet. Feb 7, 2002. Available: http://www.cwr.usa.edu.au/~linge/word/Arsenic.htm 82 Saranko, C.J., Halmes, N.C., Roberts, S.M. “The Toxicity of Arsenite and Arsenate.” Division of Waste Management, Florida Department of Environmental Protection. Nov 1998. 83 Lehigh University. “Most Frequently Asked Questions about Arsenic.” Internet. Accessed 7 Feb 2002. Available: www.lehigh.edu/~aks0/questions.html 84 National Research Council, Committee on Toxicology, Board on Environmental Studies and Toxicology. “Arsenic in Drinking Water: 2001 Update.” National Academy Press, Washington D.C. 85 Halsey, Patricia M. “Arsenic Contamination Study of Drinking Water in Nepal.” MIT Master of Engineering Thesis. May 2000. 86 World Health Organization. “United Nations Synthesis Report on Arsenic in Drinking Water.” Internet. Feb 28, 2002. Available: http://www.who.int/water_sanitation_health/Arsenic/ArsenicUNRep1.htm
Page 225
225
87 World Health Organization. “United Nations Synthesis Report on Arsenic in Drinking Water.” Internet. Feb 28, 2002. Available: http://www.who.int/water_sanitation_health/Arsenic/ArsenicUNRep1.htm 88 World Health Organization. “United Nations Synthesis Report on Arsenic in Drinking Water.” Internet. Feb 28, 2002. Available: http://www.who.int/water_sanitation_health/Arsenic/ArsenicUNRep1.htm 89 World Health Organization. “United Nations Synthesis Report on Arsenic in Drinking Water.” Internet. Feb 28, 2002. Available: http://www.who.int/water_sanitation_health/Arsenic/ArsenicUNRep1.htm 90 Murcott, S. “Arsenic Removal Technology.” Presentation to 1111..447799 ccllaassss,, WWaatteerr aanndd SSaanniittaattiioonn IInnffrraassttrruuccttuurree PPllaannnniinngg iinn DDeevveellooppiinngg CCoouunnttrriieess.. FFeebbrruuaarryy 2255,, 22000022 91 World Health Organization. “United Nations Synthesis Report on Arsenic in Drinking Water.” Internet. Feb 28, 2002. Available: http://www.who.int/water_sanitation_health/Arsenic/ArsenicUNRep1.htm 92 Villa-Lojo et al. “Arsenic Speciation in Marine Sediments: Effects of Redox Potential and Reducing Conditions.” International journal of Environmental analytical Chemistry. Vol 68, issue 3, pages 377-389. 1997 93 Halsey, Patricia M. “Arsenic Contamination Study of Drinking Water in Nepal.” MIT Master of Engineering Thesis. May 2000. 94 Industrial Test Systems, Arsenic CheckTM field test kit. “Material Safety Data Sheets”, “Test Procedure”. 2000 95 Hussam, A. “Evaluation of Arsine Generation in Arsenic Field Kit.” Environmental Science and Technology, 1999, Vol 33, page 3686-3688. 96 Hussam, A. “Evaluation of Arsine Generation in Arsenic Field Kit.” Environmental Science and Technology, 1999, Vol 33, page 3686-3688. 97 U.S. Environmental Protection Agency. “Analytical Methods Support Document for Arsenic in Drinking Water”. 1999 98 Saranko, C.J., Halmes, N.C., Roberts, S.M. “The Toxicity of Arsenite and Arsenate.” Division of Waste Management, Florida Department of Environmental Protection. Nov 1998. 99 Ficklin, W. “Extraction and Speciation of Arsenic in Lacustrine Sediments.” Talanta. Vol. 37. No. 8. page 831-834, 1990
Page 226
226
100 Gissen, M., Gremm, T., Koklu, U., Frimmel, F. “Use of the Anion-Exchange Resin Amberlite IRA-93 for the Separation of Arsenite and Arsenate in Aqueous Samples.” Acta hydrochim hydrobiol. Vol 28 (1). Page 41-46. 2000 101 Geankoplis, C. “Transport Processes and Unit Operations.” 3rd Ed. Prentice-Hall, Inc. Englewood Cliffs, New Jersey. 1993 102 Stumm, W., Morgan, J. “Aquatic Chemistry.” 3rd Edition. Environmental Science and Technology. John Wiley & Sons Inc. New York, NY. USA. 1996 103 Stumm, W., Morgan, J. “Aquatic Chemistry.” 3rd Edition. Environmental Science and Technology. John Wiley & Sons Inc. New York, NY. USA. 1996 104 Stumm, W., Morgan, J. “Aquatic Chemistry.” 3rd Edition. Environmental Science and Technology. John Wiley & Sons Inc. New York, NY. USA. 1996 105 EPA “Current Drinking Water Standards.” Internet. April 11, 2002. Available: http://www.epa.gov/safewater/mcl.html 106 Harris, D. “Quantitative Chemical Analysis.” 5th edition. W.H. Freemand and Company: New York. 1998. 107 Harris, D. “Quantitative Chemical Analysis.” 5th edition. W.H. Freemand and Company: New York. 1998. 108 “Standard Methods for the Examination of Water and Wastewater.” 20th Edition. American Public Health Association, American Water Works Association, Water Environment Federation. 1998 109 Hanna Instruments “Measurement Theory & Application for ORP”. Internet April 11, 2002. Available: www.hannainst.com/products/electro/measure.htm 110 “Standard Methods for the Examination of Water and Wastewater.” 20th Edition. American Public Health Association, American Water Works Association, Water Environment Federation. 1998 111 Morel, F., Hering, J. “Principles and Applications of Aquatic Chemistry.” John Wiley & Sons, Inc. New York, NY, USA. 1993 112 “Standard Methods for the Examination of Water and Wastewater.” 20th Edition. American Public Health Association, American Water Works Association, Water Environment Federation. 1998 113 Viessman, W., Hammer, M. “Water Supply and Pollution Control.” 6th Edition. Addison-Wesley Longman, Inc.: Menlo Park, CA. USA. 1998.
Page 227
227
114 Viessman, W., Hammer, M. “Water Supply and Pollution Control.” 6th Edition. Addison-Wesley Longman, Inc.: Menlo Park, CA. USA. 1998. 115 Viessman, W., Hammer, M. “Water Supply and Pollution Control.” 6th Edition. Addison-Wesley Longman, Inc.: Menlo Park, CA. USA. 1998. 116 Vance, D. “Iron- the Environmental Impact of an Universal Element”, Environmental Technology. Internet. April 16, 2002. Available: http://2the4.net/iron.htm 117 Lackovic, J., Nikolaidis, N., and Dobbs, G. “Inorganic Arsenic Removal by Zero-Valent Iron.” Environmental Engineering Science, vol 17, number 1. Page 29-38. 2000 118 “Standard Methods for the Examination of Water and Wastewater.” 20th Edition. American Public Health Association, American Water Works Association, Water Environment Federation. 1998 119 Charlet, L. et al. “Arsenic(III) Oxidation by Birnessite and Precipitation of Manganese(II) Arsenate.” Environmental Science and Technology, vol 36, pages 493-500. 2000. 120 Smith, Paul. Aquatic Treatment Systems. Senior Syntheitc Organic Chemist. Phone conversation, March 5, 2002 121 Aquatic Treatment Systems, Inc. 50 Cole Parkway, Suite 26, Scituate, MA 02066. Phone (781 )545-8858 or (888) 772-AQUA (2782). Fax: (781) 545-8848. 122 Aquatic Treatment Systems, Inc. “Material Safety Data Sheet for BP 250 in the tri-Iodide form.” 123 Aquatic Treatment Systems, Inc. “Media for Arsenic Removal.” Confidential information. 124 Aquatic Treatment Systems, Inc. “Media for Arsenic Removal.” Confidential information. 125 Aquatic Treatment Systems, Inc. “Media for Arsenic Removal.” Confidential information. 126 Smith, Paul. Aquatic Treatment Systems. Senior Syntheitc Organic Chemist. Phone conversation, March 5, 2002 127 Smith, Paul. Aquatic Treatment Systems. Senior Syntheitc Organic Chemist. Phone conversation, March 5, 2002
Page 228
228
128 Geankoplis, C. “Transport Processes and Unit Operations.” 3rd Ed. Prentice-Hall, Inc. Englewood Cliffs, New Jersey. 1993 129 Aquatic Treatment Systems, Inc. “Media for Arsenic Removal.” Confidential information. 130 Technische Universitat Bergakadenie Freiberg. “Arsenic in Groundwater Water.” Internet. Nov 28, 2001. Available: www.geo.tu-freiberg.de/~planer/arsenic/home.htm 131 The pictorial periodic table. “Iron.”. Internet. April 30, 2002. Available : http://chemlab.pc.maricopa.edu/periodic/Fe.html 132 Aquatic Treatment Systems, Inc. “Media for Arsenic Removal.” Confidential information. 133 Aquatic Treatment Systems, Inc. “Media for Arsenic Removal.” Confidential information. 134 Smith, Paul. Aquatic Treatment Systems. Senior Syntheitc Organic Chemist. Phone conversation, March 5, 2002 135 Smith, Paul. Aquatic Treatment Systems. Senior Syntheitc Organic Chemist. Phone conversation, March 5, 2002 136 Badger, T. Aquatic Treatment Systems. Founder and CEO. Personal interview. Nov 19, 2001 137 Badger, T. Aquatic Treatment Systems. Founder and CEO. Personal interview. Nov 19, 2001 138 Smith, Paul. Aquatic Treatment Systems. Senior Syntheitc Organic Chemist. Phone conversation, March 5, 2002 139 Aquatic Treatment Systems, Inc. “Material Safety Data Sheet for A/M Comples 2001 Media.” 140 Aquatic Treatment Systems, Inc. “Company Report.” 2001 141 Aquatic Treatment Systems, Inc. “Company Report.” 2001 142 Badger, T. Aquatic Treatment Systems. Founder and CEO. Personal interview. Nov 19, 2001 143 Badger, T. Aquatic Treatment Systems. Founder and CEO. Phone Conversation. March 2, 2002
Page 229
229
144 Badger, T. Aquatic Treatment Systems. Founder and CEO. Personal interview. Nov 19, 2001 145 Badger, T. Aquatic Treatment Systems. Founder and CEO. Personal interview. Nov 19, 2001 146 Smith, Paul. Aquatic Treatment Systems. Senior Syntheitc Organic Chemist. Phone conversation, March 5, 2002 147 Smith, Paul. Aquatic Treatment Systems. Senior Syntheitc Organic Chemist. Phone conversation, March 5, 2002 148 Gao, Yongxuan. “Community-Based Water Supply: Tubewell Program in Lumbini Zone, Nepal.” MIT Master of Engineering Thesis. May 2002. 149 Smith, Paul. Aquatic Treatment Systems. Senior Syntheitc Organic Chemist. Phone conversation, March 5, 2002 150 Smith, Paul. Aquatic Treatment Systems. Senior Syntheitc Organic Chemist. Phone conversation, March 5, 2002 151 EPA “Current Drinking Water Standards.” Internet. April 11, 2002. Available: http://www.epa.gov/safewater/mcl.html 152 EPA “Current Drinking Water Standards.” Internet. April 23, 2002. Available: http://www.epa.gov/safewater/mcl.html 153 Morel, F., Hering, J. “Principles and Applications of Aquatic Chemistry.” John Wiley & Sons, Inc. New York, NY, USA. 1993 154 Vance, D. “Iron- the Environmental Impact of an Universal Element”, Environmental Technology. Internet. April 16, 2002. Available: http://2the4.net/iron.htm 155 Smith, Paul. Phone conversation, March 5, 2002 156 Lackovic, J., Nikolaidis, N., and Dobbs, G. “Inorganic Arsenic Removal by Zero-Valent Iron.” Environmental Engineering Science, vol 17, number 1. Page 29-38. 2000 157 Munir et al. “Evaluation of Performance of Sono 3-Kolshi Filter for Arsenic Removal from Groundwater Using Zero Valent Iron Through Laboratory and Field Studies.” Technologies for Arsenic Removal from Drinking Water. Page 171-189. May 2000 .
Page 230
230
158 Robins, R., Nishimura, T., Singh, P. “Removal of Arsenic from Drinking Water by Precipitation, Adsorption or Cementation.” Technologies for Arsenic Removal from Drinking Water. Page 31-41. May 2000 159 Meng, X., Korfiatis, G. “Removal of Arsenic from Bangladesh Well Water Using a Household Filtration System.” Technologies for Arsenic Removal from Drinking Water. Page 121-129. May 2000 160 Landi, W.M. and L. Lorenzen. “Factors affecting the mechanism of the adsorption of the arsenic species on activated carbon.” Minerals Engineering, 8: 557-569. 1994 161 Smith, Paul. Aquatic Treatment Systems. Senior Syntheitc Organic Chemist. Phone conversation, March 5, 2002 162 Freeze, A., Cherry, J. “Physical Properties and Principles.” Groundwater. Page 15-80. Prentice-Hall: New Jersey. 1979. 163 Munson et al. “Fundamentals of Fluid Mechanics.” 3rd Edition. John Wiley & Sons, Inc. New York, NY. USA. 1998. 164 Driscoll, F. “Water Well Design.” Groundwater and Wells. 2nd Edition. Johnson Filtration Systems Inc., St. Paul, Minnesota. 1986. 165 Holm, T., Curtiss, C. “A Comparison of Oxidation-Reduction Potentials Calculated from the As(V)/(As(III) and Fe(III)/Fe(II) Couples with Measured Platinum0Electrode Potentials in Groundwater.” Journal of Contaminant Hydrology. Vol 5. Page 67-81. 1989 166 Stumm, W., Morgan, J. “Aquatic Chemistry.” 3rd Edition. Environmental Science and Technology. John Wiley & Sons Inc. New York, NY. USA. 1996 167 “Standard Methods for the Examination of Water and Wastewater.” 20th Edition. American Public Health Association, American Water Works Association, Water Environment Federation. 1998 168 Stumm, W., Morgan, J. “Aquatic Chemistry.” 3rd Edition. Environmental Science and Technology. John Wiley & Sons Inc. New York, NY. USA. 1996 169 Holm, T., Curtiss, C. “A Comparison of Oxidation-Reduction Potentials Calculated from the As(V)/(As(III) and Fe(III)/Fe(II) Couples with Measured Platinum0Electrode Potentials in Groundwater.” Journal of Contaminant Hydrology. Vol 5. Page 67-81. 1989 170 Hemond, H., Fechner-Levy, E. “Chemical Fate and Transport in the Environment.” Academic Press. San Diego, CA, USA. 2000
Page 231
231
171 Hemond, H., Fechner-Levy, E. “Chemical Fate and Transport in the Environment.” Academic Press. San Diego, CA, USA. 2000 172 Morel, F., Hering, J. “Principles and Applications of Aquatic Chemistry.” John Wiley & Sons, Inc. New York, NY, USA. 1993 173 Hemond, H., Fechner-Levy, E. “Chemical Fate and Transport in the Environment.” Academic Press. San Diego, CA, USA. 2000 174 McArthur, J.M. “Arsenic in Groundwater: Testing Pollution Mechanisms for Sedimentary Aquifers in Bangladesh.” Water Resources Research. Vol 37 (1), page 109-117. 2001. 175 Briscoe, J., Chakraborty, M., and Ahmed. S. “How Bengali Villagers Choose Sources of Domestic Water.” Water Supply & Management 5: 161-181. 1981. 176 Whittington, D., Mu, S., and Roche, R. “Calculating the Value of Time Spent Collecting Water: Some Estimates for Ukunda, Kenya.” World Development 18(2): 269-280. 1990 177 Briscoe, J., Chakraborty, M., and Ahmed. S. “How Bengali Villagers Choose Sources of Domestic Water.” Water Supply & Management 5: 161-181. 1981. 178 Lackovic, J., Nikolaidis, N., and Dobbs, G. “Inorganic Arsenic Removal by Zero-Valent Iron.” Environmental Engineering Science, vol 17, number 1. Page 29-38. 2000 179 Smith, Paul. Aquatic Treatment Systems. Senior Syntheitc Organic Chemist. Phone conversation, October 23, 2001 180 Hug, S. “Solar Oxidation and Removal of Arsenic at Circumneutral pH in Iron Containing Waters.” Environmental Science and Technology. Vol 35, page 2114-2121. 2001 181 Lackovic, J., Nikolaidis, N., and Dobbs, G. “Inorganic Arsenic Removal by Zero-Valent Iron.” Environmental Engineering Science, vol 17, number 1. Page 29-38. 2000 182 Smith, Paul. Aquatic Treatment Systems. Senior Syntheitc Organic Chemist. Phone conversation, March 5, 2002 183 Hemond, H., Fechner-Levy, E. “Chemical Fate and Transport in the Environment.” Academic Press. San Diego, CA, USA. 2000 184 Morel, F., Hering, J. “Principles and Applications of Aquatic Chemistry.” John Wiley & Sons, Inc. New York, NY, USA. 1993
Page 232
232
185 “Standard Methods for the Examination of Water and Wastewater.” 20th Edition. American Public Health Association, American Water Works Association, Water Environment Federation. 1998