An HIV-1 clade C DNA prime, NYVAC boost vaccine regimen induces reliable, polyfunctional , and long-lasting T cell responses Received June 27, 2007; Accepted December 6, 2007. Abstract The EuroVacc 02 phase I trial has evaluated the safety and immunogenicity of a prime-boost regimen comprising recombinant DNA and the p oxvirus vector NYVAC, both expressing a common immunogen consisting of Env, Gag, Pol, and Nef polypeptide domain from human immunodeficiency virus (HIV)-1 clade C isolate, CN54. 40 volunteers were randomized to receive DNA C or nothing on day 0 and at week 4, followed by NYVAC C at weeks 20 and 24. The primary immunogenicity endpoints were measured at weeks 26 and 28 by the quantification of T cell responses using the interferon enzyme-linked immunospot assay. Our results indicate that the DNA C plus NYVAC C vaccine regimen was highly immunogenic, as indicated by the detection of T cell responses in 90% of vaccinees and was superior to responses induced by NYVAC C alone (33% of responders). The vaccine-induced T cell responses were (a) vigorous in the case of the env response (mean 480 spot-forming units/10 6 mononuclear cells at weeks 26/28), (b) polyfunctional for both CD4 and CD8 T cell responses, (c) broad (the average number of epitopes was 4.2 per responder), and (d) durable (T ce ll responses were present in 70% of vaccinees at week 72). The vaccine-induced T cell responses were strongest and most frequently directed against Env (91% o f vaccines), but smaller responses against Gag-Pol-Nefwere also observed in 48% of vaccinees. These results support the development o f the poxvirus platform in the HIV vaccine field and the further clinical development of the DNA C plus NYVAC C vaccine regimen. The control of HIV transmission remains one of the most pressing public health priorities for the 21st century. All past experience suggests t hat a vaccine will be the only intervention able to control the HIV epidemic. Although many successful antiretroviral drugs have been developed with enormous impact on HIV-associated morbidity and mortality, access to antiretrovi ral therapy remains limited to only 5% o f the total population of HIV-infected subjects in developing countries ( 1). Even in the face o f open access to therapy, HIV transmission continues. Over the past 10 yr there has been a progressive increase in resources for vaccine research, allowing the generation of several candidate vaccines capable of stimulating anti-HIV immunity (2 ±4). The ideal HIV vaccine shou ld be safe, thermostable, able to elici t bot h humoral (antibody) and cellular (both CD4 and CD8 T cells) effector functions, and to induce durable protective immunity (2 ±5). The goal of the ³antibody´ vaccines is to induce neutralizing antibodies to provide immunity that prevents or limi ts infect ion; so far, these have been reco mbinant envelope protein vaccines (2 ±4). One envelope protein vaccine has been tested in a phase III efficacy clinical trial, without any protective effect (2 ±4). This candidate, as well as other tested envelope protein vaccine candidates, induces antibodies with neutralizing activity against laboratory-
An HIV-1 clade C DNA prime, NYVAC boost vaccine regimeninduces reliable, polyfunctional, and long-lasting T cellresponsesReceived June 27, 2007; Accepted December 6, 2007.
AbstractThe EuroVacc 02 phase I trial has evaluated the safety and immunogenicity of a prime-boost
regimen comprising recombinant DNA and the poxvirus vector NYVAC, both expressing a
common immunogen consisting of Env, Gag, Pol, and Nef polypeptide domain from human
immunodeficiency virus (HIV)-1 clade C isolate, CN54. 40 volunteers were randomized to
receive DNA C or nothing on day 0 and at week 4, followed by NYVAC C at weeks 20 and 24.
The primary immunogenicity endpoints were measured at weeks 26 and 28 by the quantification
of T cell responses using the interferon enzyme-linked immunospot assay. Our results indicate
that the DNA C plus NYVAC C vaccine regimen was highly immunogenic, as indicated by the
detection of T cell responses in 90% of vaccinees and was superior to responses induced by
NYVAC C alone (33% of responders). The vaccine-induced T cell responses were (a) vigorous
in the case of the env response (mean 480 spot-forming units/106
mononuclear cells at weeks
26/28), (b) polyfunctional for both CD4 and CD8 T cell responses, (c) broad (the average
number of epitopes was 4.2 per responder), and (d) durable (T cell responses were present in
70% of vaccinees at week 72). The vaccine-induced T cell responses were strongest and most
frequently directed against Env (91% of vaccines), but smaller responses against Gag-Pol-Nef
were also observed in 48% of vaccinees. These results support the development of the poxvirus
platform in the HIV vaccine field and the further clinical development of the DNA C plus
NYVAC C vaccine regimen.
The control of HIV transmission remains one of the most pressing public health priorities for the
21st century. All past experience suggests that a vaccine will be the only intervention able to
control the HIV epidemic. Although many successful antiretroviral drugs have been developed
with enormous impact on HIV-associated morbidity and mortality, access to antiretroviral
therapy remains limited to only 5% of the total population of HIV-infected subjects in
developing countries (1). Even in the face of open access to therapy, HIV transmission
continues.
Over the past 10 yr there has been a progressive increase in resources for vaccine research,
allowing the generation of several candidate vaccines capable of stimulating anti-HIV immunity
(2 ± 4). The ideal HIV vaccine should be safe, thermostable, able to elicit both humoral (antibody)
and cellular (both CD4 and CD8 T cells) effector functions, and to induce durable protective
immunity (2 ± 5). The goal of the ³antibody´ vaccines is to induce neutralizing antibodies to
provide immunity that prevents or limits infection; so far, these have been recombinant envelope
protein vaccines (2 ± 4). One envelope protein vaccine has been tested in a phase III efficacy
clinical trial, without any protective effect (2 ± 4). This candidate, as well as other tested envelope
protein vaccine candidates, induces antibodies with neutralizing activity against laboratory-
The main objectives of the EuroVacc 02 (EV02) trial were to evaluate the safety and
immunogenicity of the prime-boost regimen, DNA C plus NYVAC C, compared with NYVAC
C alone. The DNA and the poxvirus vector NYVAC both expressed fused Gag-Pol-Nef and the
gp120 subunit of Env of the HIV-1 clade C isolate, CN54 (Fig. 1 A ). The
design was open for participants and clinical investigators, without a placebo control, and 40
volunteers were randomized to receive DNA C or nothing on day 0 and at week 4, followed by
NYVAC C at weeks 20 and 24 (Fig. 1 B ). The participants received 2 × 2-ml
injections of DNA C (1.05 mg per ml and a total dose of 4.2 mg) intramuscularly in the right and
left vastus lateralis and a 1-ml injection of NYVAC C (107.7
CCID50 per ml) intramuscularly in
the deltoid. The primary immunogenicity endpoints were measured at weeks 26 and 28 by thequantification of T cell responses using the IFN- ELISPOT assay. The T cell responses were
also measured on day 0 and at weeks 5, 20, 24, and 48. Comprehensive analyses of the
demographics of the trial population and of the safety of the vaccine regimens have been
described (unpublished data and reference 19). The results indicated that both DNA C and
NYVAC C candidate vaccines are safe and well tolerated.
Figure 1.
RNA- and codon-optimized GPN and Env gene vector inserts. (A and B) Schematic
representation of EV02 study design. Myr, myristoylation-deficient; FS (-1), placing
Gag and PolNef in one reading frame by removing the natural frameshift; PR, (more...)
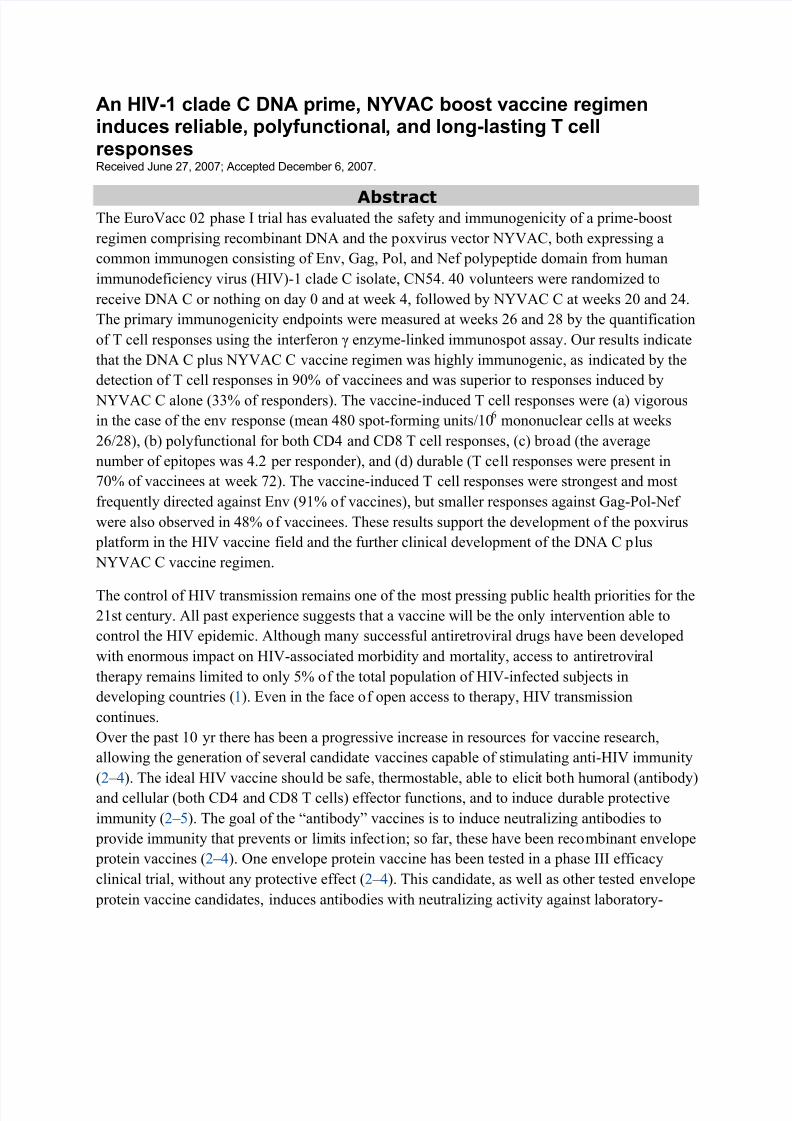
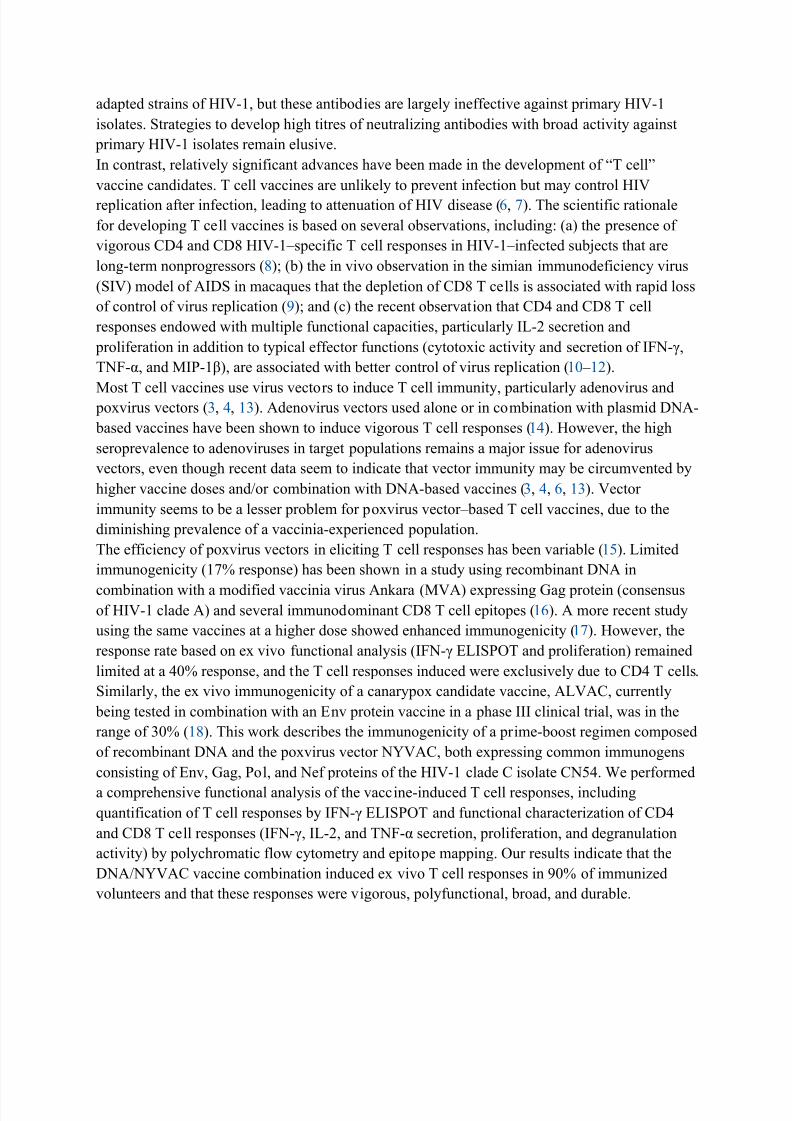
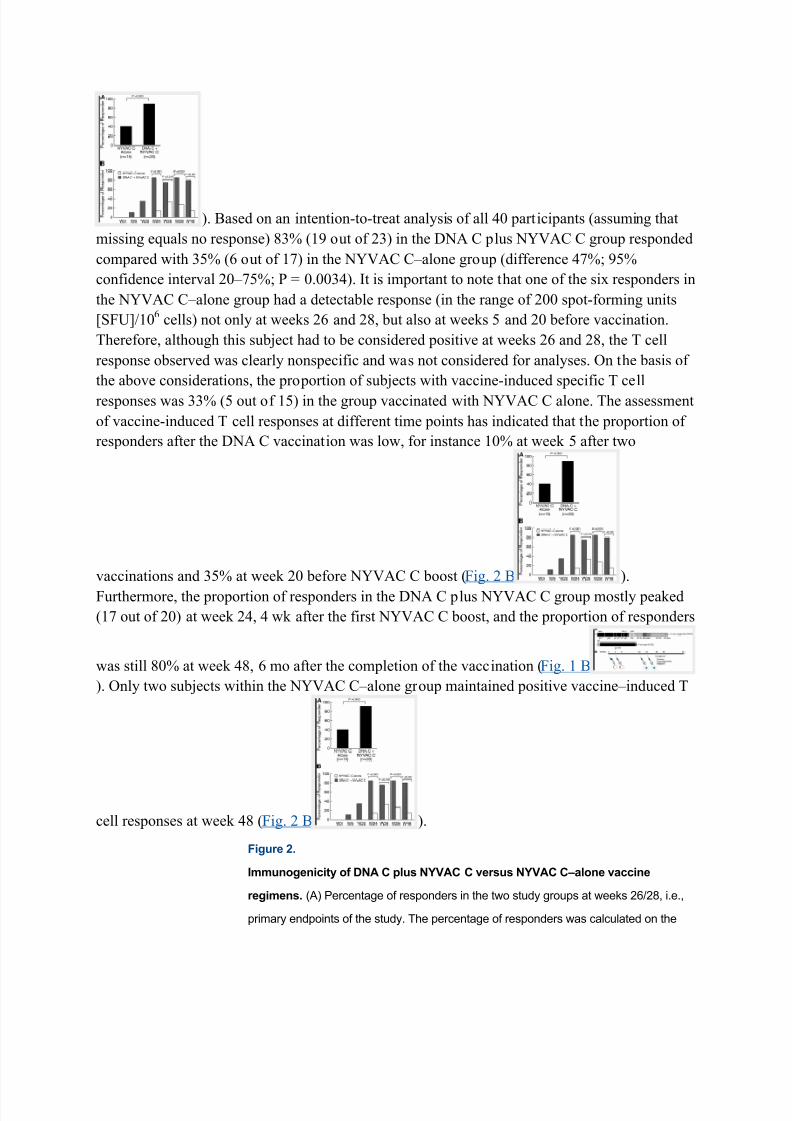
Propor ti on of r es ponder s af ter vaccinati on with DNA C pl us NYVAC C c ompar ed
with NYVAC C alone
Although 40 subjects entered the EV02 study, only 35 had completed vaccination. 20 subjects
were randomized to the DNA C plus NYVAC C group and 15 to the NYVAC C±alone group. As
mentioned above, T cell responses were measured at different time points during the 48-wk
study using the IFN- ELISPOT assay. The primary immunogenicity endpoints were, however,
evaluated on the basis of the proportion of subjects with positive vaccine-induced T cell
responses at weeks 26 and 28. There was a clear and significant difference (P = 0.003) in the
proportion of subjects with positive vaccine±induced T cell responses within the two study
groups. The proportion of responders was 90% (18 out of 20) in the DNA C plus NYVAC C
group compared with 40% (6 out of 15) in the NYVAC C±alone group (Fig. 2 A
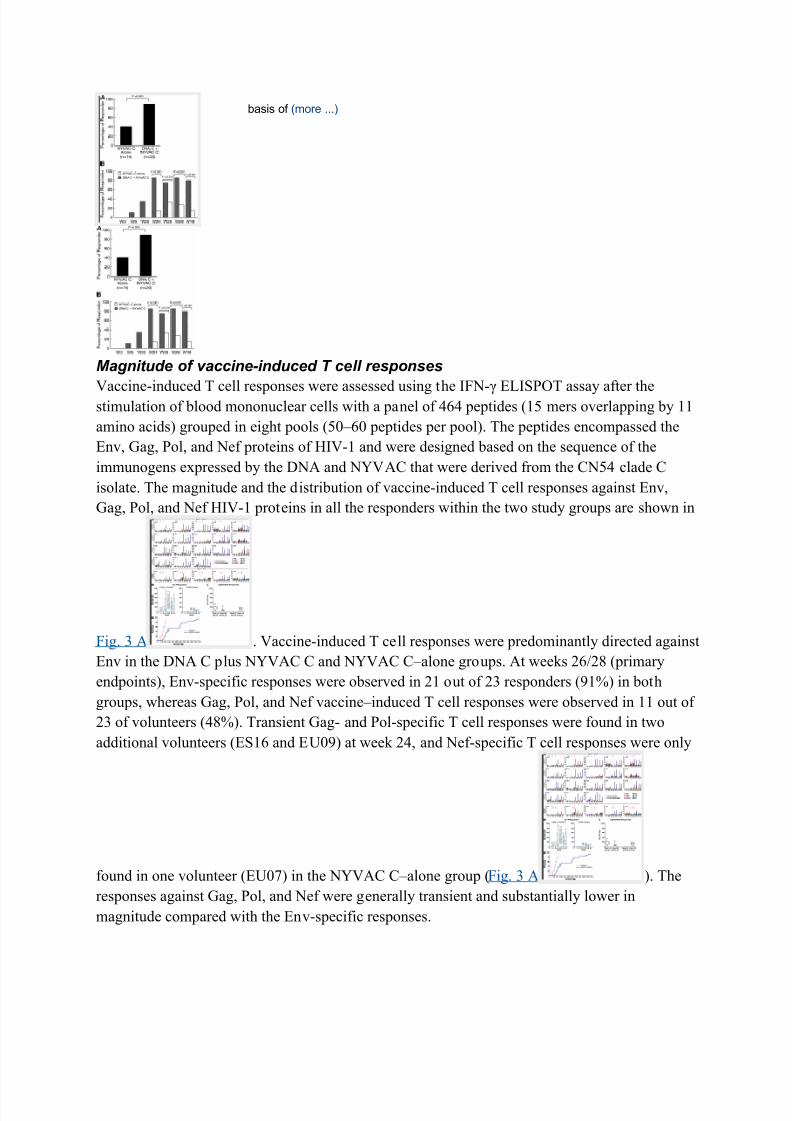
Vaccine-induced T cell responses were assessed using the IFN- ELISPOT assay after thestimulation of blood mononuclear cells with a panel of 464 peptides (15 mers overlapping by 11
amino acids) grouped in eight pools (50±60 peptides per pool). The peptides encompassed the
Env, Gag, Pol, and Nef proteins of HIV-1 and were designed based on the sequence of the
immunogens expressed by the DNA and NYVAC that were derived from the CN54 clade C
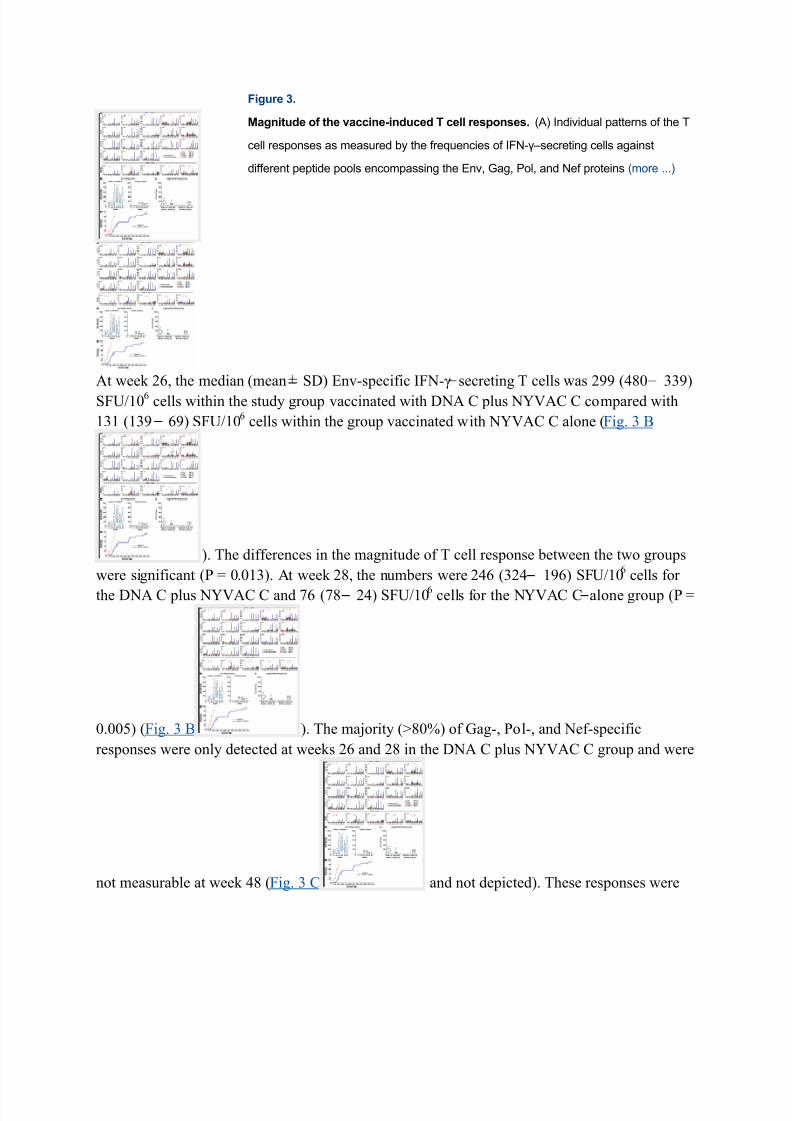
isolate. The magnitude and the distribution of vaccine-induced T cell responses against Env,
Gag, Pol, and Nef HIV-1 proteins in all the responders within the two study groups are shown in
Fig. 3 A . Vaccine-induced T cell responses were predominantly directed against
Env in the DNA C plus NYVAC C and NYVAC C±alone groups. At weeks 26/28 (primary
endpoints), Env-specific responses were observed in 21 out of 23 responders (91%) in both
groups, whereas Gag, Pol, and Nef vaccine±induced T cell responses were observed in 11 out of
23 of volunteers (48%). Transient Gag- and Pol-specific T cell responses were found in two
additional volunteers (ES16 and EU09) at week 24, and Nef-specific T cell responses were only
found in one volunteer (EU07) in the NYVAC C±alone group (Fig. 3 A ). The
responses against Gag, Pol, and Nef were generally transient and substantially lower in
magnitude compared with the Env-specific responses.
measurable only at week 26 in the NYVAC C±alone group (Fig. 3 C ). The
median magnitude of Gag-, Pol-, and Nef-specific T cell responses was ~100 SFU/106
cells (Fig.
3 C ).
In Fig. 3 D , one observes the individual maximum responses at week 26 or 28
(each ³step´ corresponds to the maximum response measured in each responder) and the
percentage of participants per arm with a maximum response up to a certain value. In the
NYVAC C±alone group, the maximum response was just above 200 SFU/106
cells, and 40% had
a maximum response of 100 or fewer. In the DNA C plus NYVAC C group, the maximumresponse was almost 1,100 SFU/10
6cells, and 33% had a maximum response of >600 SFU/10
6
cells.
Dist r ibuti on of the vaccine-induced T cell r es ponses in CD4 and CD8 T cell
popu l ati ons
The distribution of vaccine-induced T cell responses in CD4 and CD8 T cell populations was
assessed in 3 out of 5 responders of the NYVAC C±alone group and in 16 out of 18 responders
of the DNA C plus NYVAC C group. Only volunteers with IFN- ELISPOT responses in the
range of 100 SFU/106
blood mononuclear cells or above were characterized using polychromatic
flow cytometry. The vaccine-induced T cell responses were mediated by CD4 T cells in all the
investigated 19 responders (3 in the NYVAC alone and 16 in the DNA C plus NYVAC Cgroups). However, vaccine-induced CD8 T cell responses were observed in addition to CD4 T
cell responses in 1 out of 3 responders in the NYVAC C±alone group and in the 8 out of 16
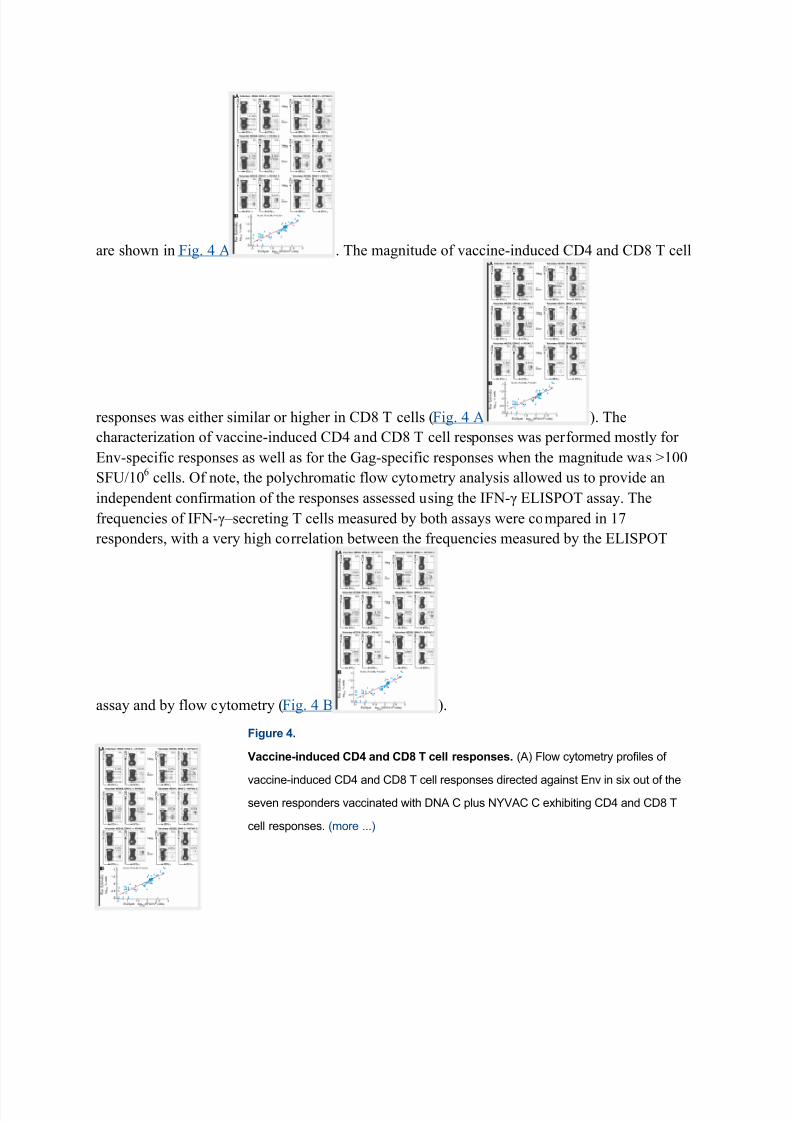
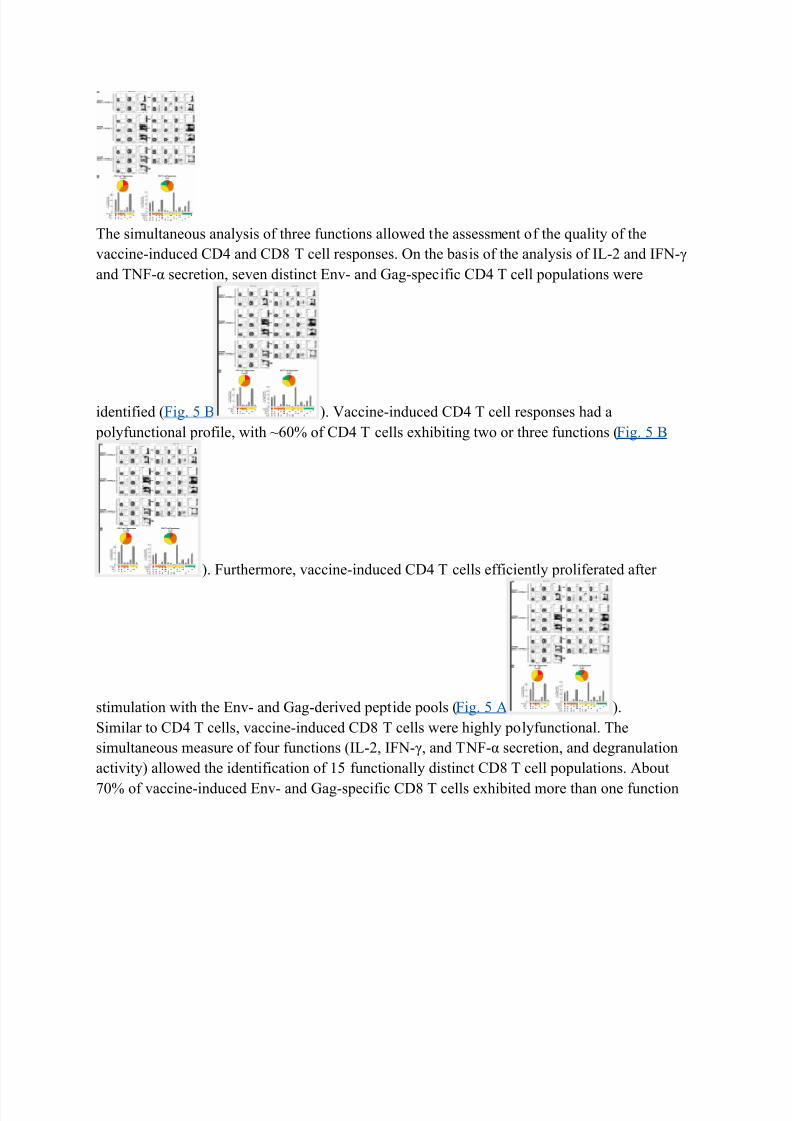
(50%) responders in the DNA C plus NYVAC C group (not depicted). Representative flow
cytometry profiles of Env-specific IFN-±secreting CD4 and CD8 T cells in six out of the seven
responders with both CD4 and CD8 T cell responses vaccinated with DNA C plus NYVAC C
are shown in Fig. 4 A . The magnitude of vaccine-induced CD4 and CD8 T cell
responses was either similar or higher in CD8 T cells (Fig. 4 A ). The
characterization of vaccine-induced CD4 and CD8 T cell responses was performed mostly for
Env-specific responses as well as for the Gag-specific responses when the magnitude was >100
SFU/106
cells. Of note, the polychromatic flow cytometry analysis allowed us to provide an
independent confirmation of the responses assessed using the IFN- ELISPOT assay. The
frequencies of IFN-±secreting T cells measured by both assays were compared in 17
responders, with a very high correlation between the frequencies measured by the ELISPOT
assay and by flow cytometry (Fig. 4 B ).
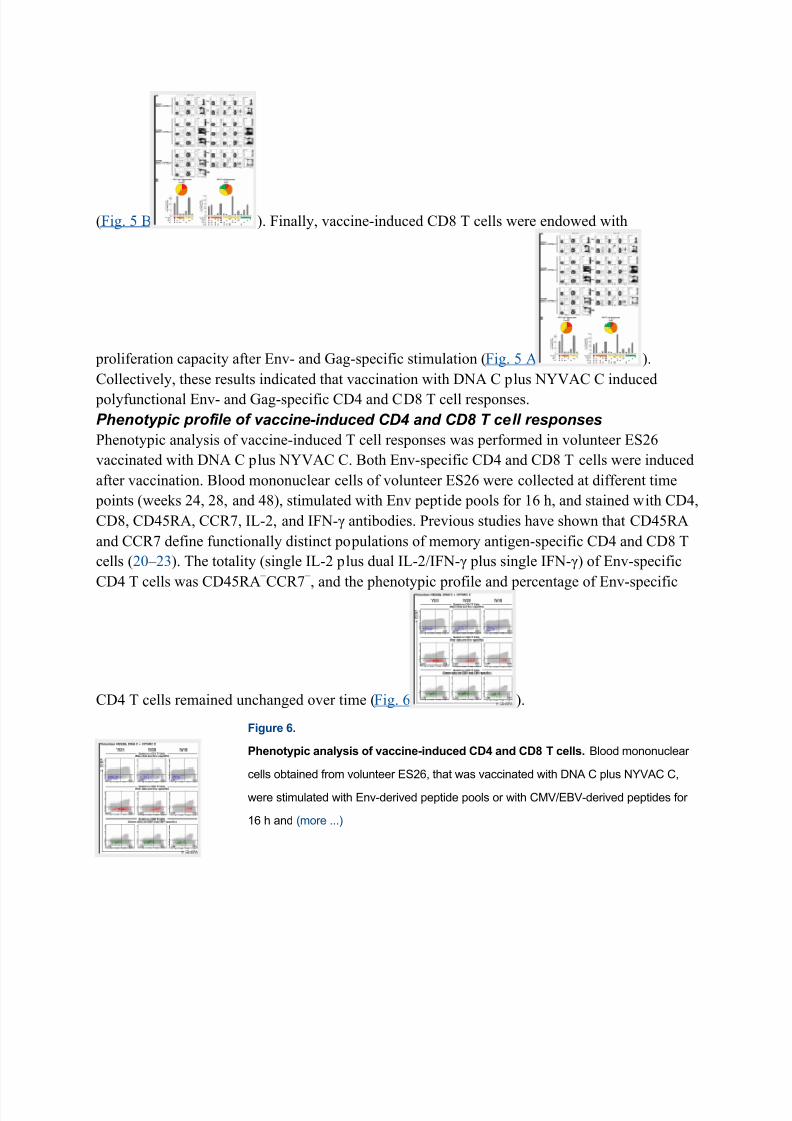
Figure 4.
Vaccine-induced CD4 and CD8 T cell responses. (A) Flow cytometry profiles of
vaccine-induced CD4 and CD8 T cell responses directed against Env in six out of theseven responders vaccinated with DNA C plus NYVAC C exhibiting CD4 and CD8 T
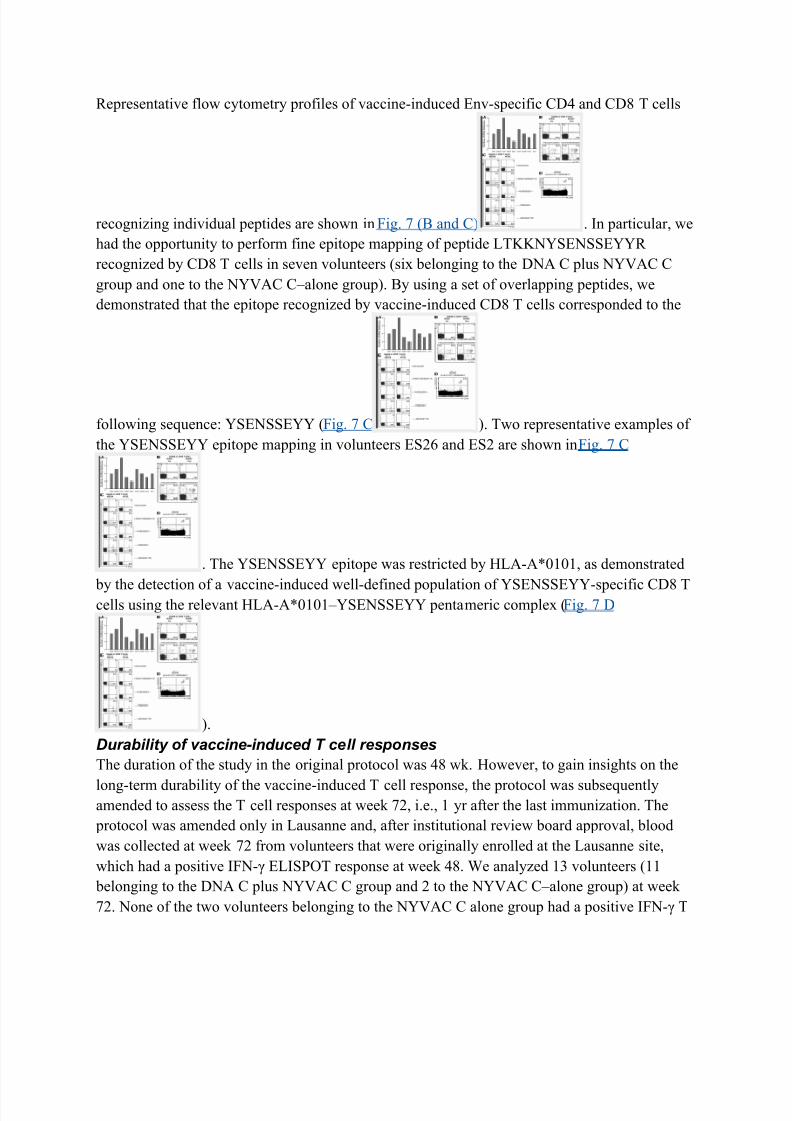
Representative flow cytometry profiles of vaccine-induced Env-specific CD4 and CD8 T cells
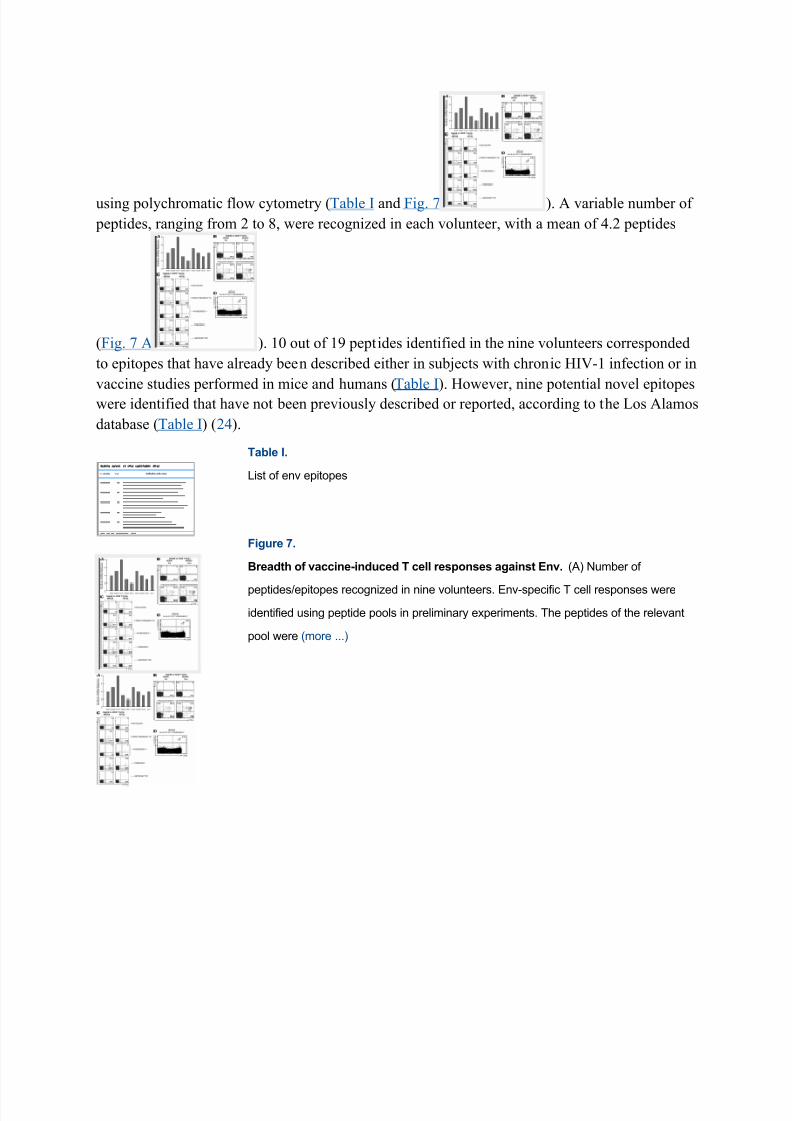
recognizing individual peptides are shown in Fig. 7 (B and C) . In particular, we
had the opportunity to perform fine epitope mapping of peptide LTKKNYSENSSEYYR
recognized by CD8 T cells in seven volunteers (six belonging to the DNA C plus NYVAC C
group and one to the NYVAC C±alone group). By using a set of overlapping peptides, we
demonstrated that the epitope recognized by vaccine-induced CD8 T cells corresponded to the
following sequence: YSENSSEYY (Fig. 7 C ). Two representative examples of
the YSENSSEYY epitope mapping in volunteers ES26 and ES2 are shown in Fig. 7 C
. The YSENSSEYY epitope was restricted by HLA-A*0101, as demonstrated
by the detection of a vaccine-induced well-defined population of YSENSSEYY-specific CD8 Tcells using the relevant HLA-A*0101±YSENSSEYY pentameric complex (Fig. 7 D
).
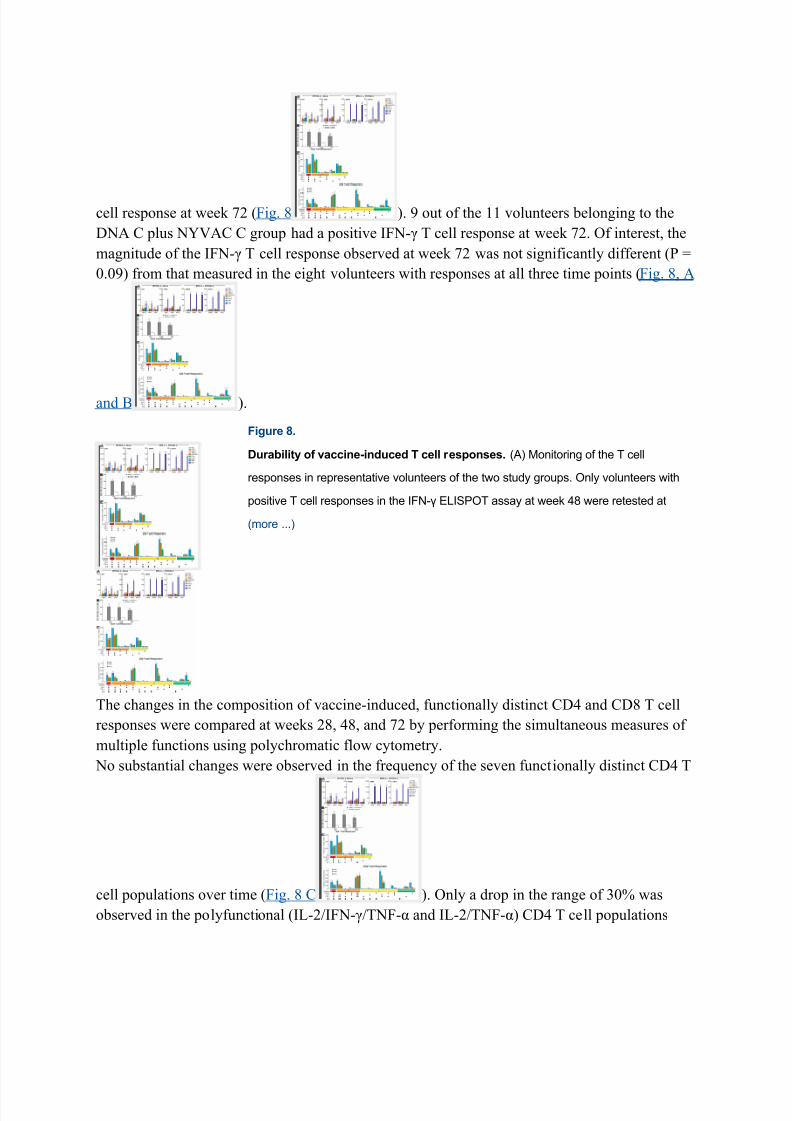
Du r abi l ity of vaccine-induced T cell r es ponses
The duration of the study in the original protocol was 48 wk. However, to gain insights on the
long-term durability of the vaccine-induced T cell response, the protocol was subsequentlyamended to assess the T cell responses at week 72, i.e., 1 yr after the last immunization. The
protocol was amended only in Lausanne and, after institutional review board approval, blood
was collected at week 72 from volunteers that were originally enrolled at the Lausanne site,
which had a positive IFN- ELISPOT response at week 48. We analyzed 13 volunteers (11
belonging to the DNA C plus NYVAC C group and 2 to the NYVAC C±alone group) at week
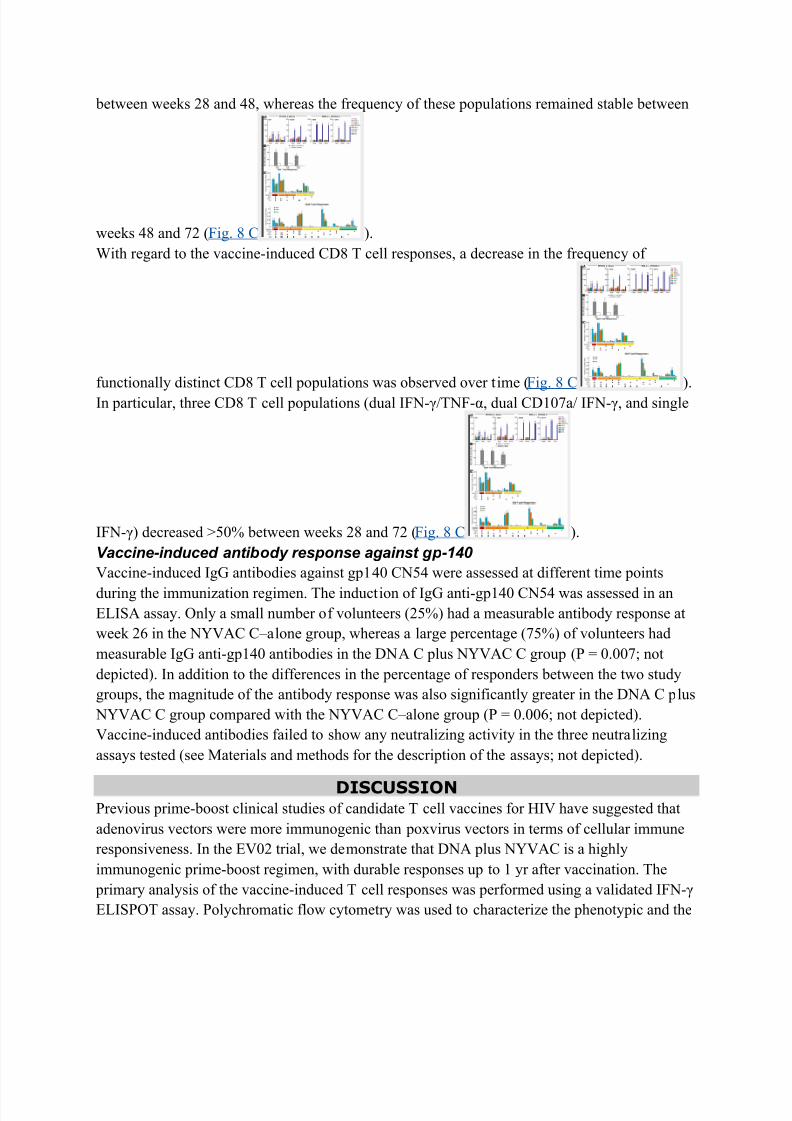
72. None of the two volunteers belonging to the NYVAC C alone group had a positive IFN- T
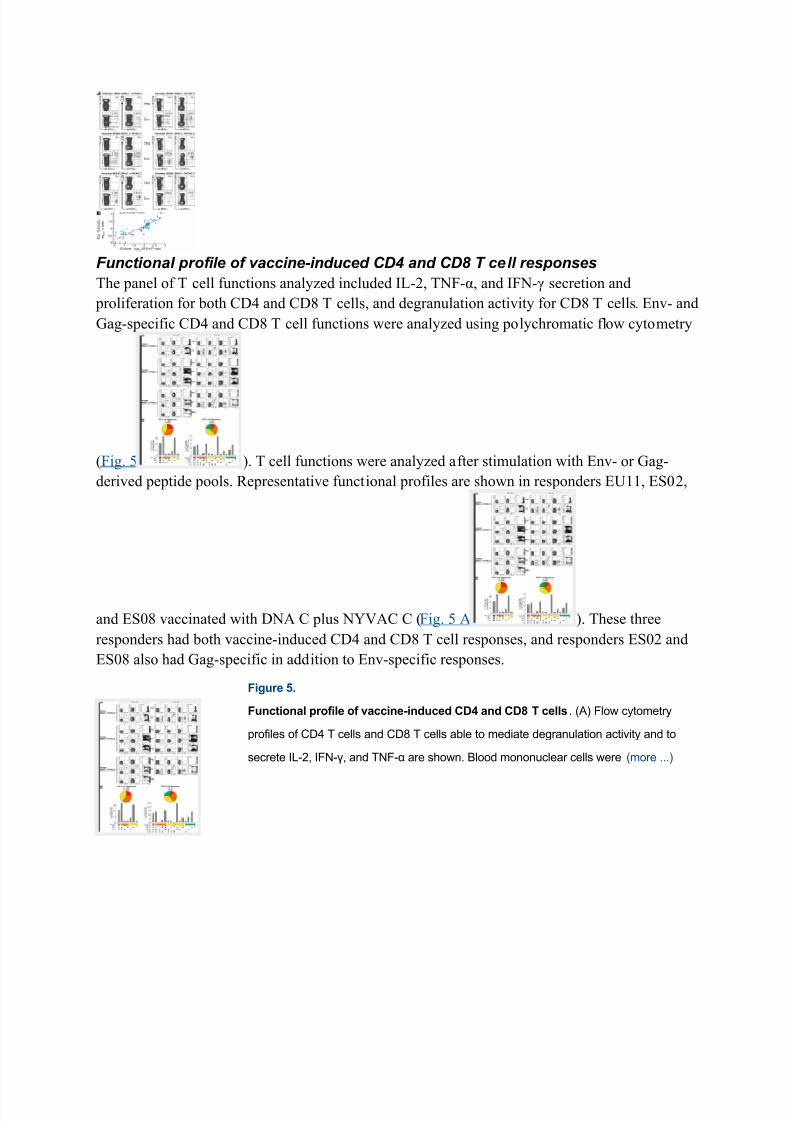
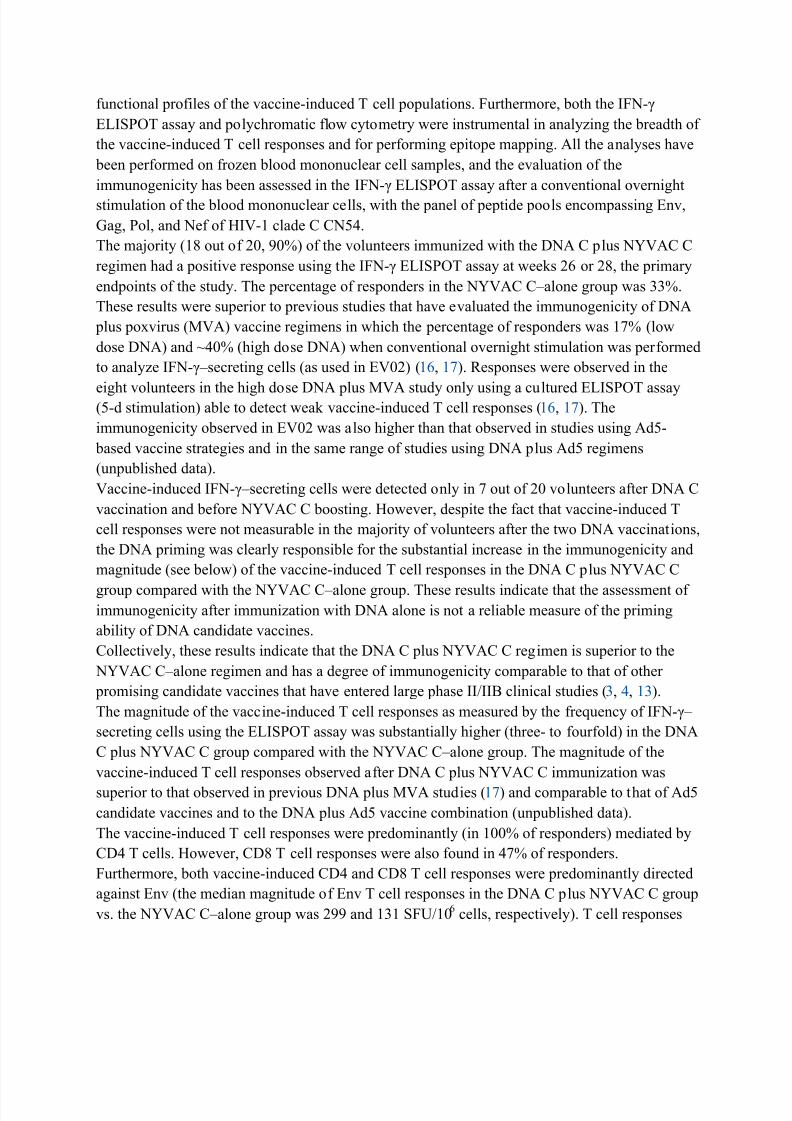
functional profiles of the vaccine-induced T cell populations. Furthermore, both the IFN-
ELISPOT assay and polychromatic flow cytometry were instrumental in analyzing the breadth of
the vaccine-induced T cell responses and for performing epitope mapping. All the analyses have
been performed on frozen blood mononuclear cell samples, and the evaluation of the
immunogenicity has been assessed in the IFN- ELISPOT assay after a conventional overnight
stimulation of the blood mononuclear cells, with the panel of peptide pools encompassing Env,
Gag, Pol, and Nef of HIV-1 clade C CN54.
The majority (18 out of 20, 90%) of the volunteers immunized with the DNA C plus NYVAC C
regimen had a positive response using the IFN- ELISPOT assay at weeks 26 or 28, the primary
endpoints of the study. The percentage of responders in the NYVAC C±alone group was 33%.
These results were superior to previous studies that have evaluated the immunogenicity of DNA
plus poxvirus (MVA) vaccine regimens in which the percentage of responders was 17% (low
dose DNA) and ~40% (high dose DNA) when conventional overnight stimulation was performed
to analyze IFN-±secreting cells (as used in EV02) (16, 17). Responses were observed in the
eight volunteers in the high dose DNA plus MVA study only using a cultured ELISPOT assay(5-d stimulation) able to detect weak vaccine-induced T cell responses (16, 17). The
immunogenicity observed in EV02 was also higher than that observed in studies using Ad5-
based vaccine strategies and in the same range of studies using DNA plus Ad5 regimens
(unpublished data).
Vaccine-induced IFN-±secreting cells were detected only in 7 out of 20 volunteers after DNA C
vaccination and before NYVAC C boosting. However, despite the fact that vaccine-induced T
cell responses were not measurable in the majority of volunteers after the two DNA vaccinations,
the DNA priming was clearly responsible for the substantial increase in the immunogenicity and
magnitude (see below) of the vaccine-induced T cell responses in the DNA C plus NYVAC C
group compared with the NYVAC C±alone group. These results indicate that the assessment of immunogenicity after immunization with DNA alone is not a reliable measure of the priming
ability of DNA candidate vaccines.
Collectively, these results indicate that the DNA C plus NYVAC C regimen is superior to the
NYVAC C±alone regimen and has a degree of immunogenicity comparable to that of other
promising candidate vaccines that have entered large phase II/IIB clinical studies (3, 4, 13).
The magnitude of the vaccine-induced T cell responses as measured by the frequency of IFN-±
secreting cells using the ELISPOT assay was substantially higher (three- to fourfold) in the DNA
C plus NYVAC C group compared with the NYVAC C±alone group. The magnitude of the
vaccine-induced T cell responses observed after DNA C plus NYVAC C immunization was
superior to that observed in previous DNA plus MVA studies (17) and comparable to that of Ad5
candidate vaccines and to the DNA plus Ad5 vaccine combination (unpublished data).
The vaccine-induced T cell responses were predominantly (in 100% of responders) mediated by
CD4 T cells. However, CD8 T cell responses were also found in 47% of responders.
Furthermore, both vaccine-induced CD4 and CD8 T cell responses were predominantly directed
against Env (the median magnitude of Env T cell responses in the DNA C plus NYVAC C group
vs. the NYVAC C±alone group was 299 and 131 SFU/106
profile of virus-specific CD4 and CD8 T cells capable of controlling virus replication in several
chronic virus infections, such as cytomegalovirus, Epstein-Barr virus, herpes simplex virus, and
HIV-1 in patients with nonprogressive disease (8, 10, 33). These data are consistent with our
previous study demonstrating that vaccine-induced CD8 T cells after vaccination with DNA C
plus NYVAC C were highly polyfunctional and that almost 75% of these cells had four or five
functions based on IFN-, TNF-, MIP-1, IL-2, and CD107a (34).
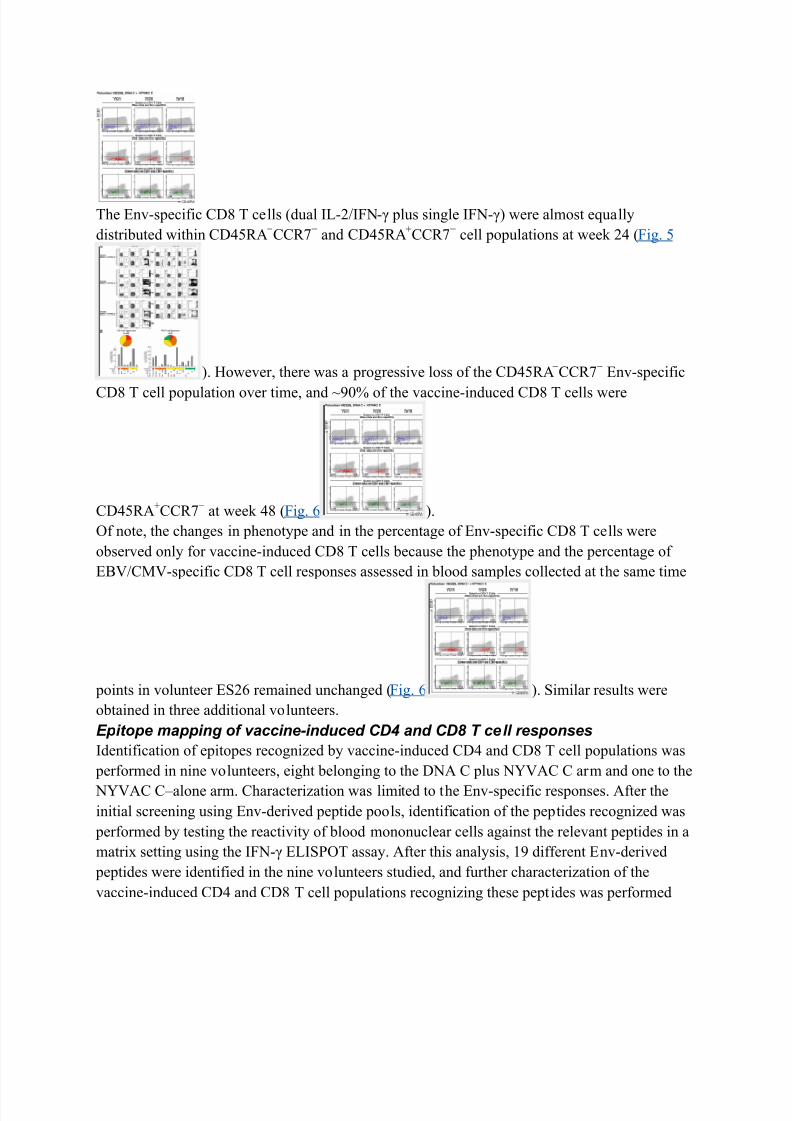
The polyfunctional vaccine-induced CD4 T cell populations were CD45RAíCCR7
í, a phenotype
of cells with effector functions but also with the ability to secrete IL-2 and endowed with
proliferation capacity (20 ± 23, 29, 30, 33). The phenotype of the vaccine-induced CD4 T cells
remained unchanged over time. The vaccine-induced CD8 T cells were either CD45RAíCCR7
í
or CD45RA+CCR7
í. This phenotypic profile defines memory CD8 T cells at intermediate and
advanced stages of differentiation and is consistent with our recent study using CD27 and
CD45RO (34). The presence and rapid appearance after immunization of CD45RA+CCR7
íCD8
T cells is of interest. This phenotype has been proposed to define effector CD8 T cells at
advanced stages of differentiation (21). Furthermore, virus-specific CD45RA
+
CCR7
í
CD8 Tcells have been found in controlled chronic virus infections such as CMV and EBV (21, 29, 30),
and a correlation between the percentage of this cell population and virus control has also been
shown in HIV-1 infection (8). The majority of the vaccine-induced CD45RAíCCR7
íCD8 T cell
population disappeared over time, whereas ~90% of vaccine-induced CD8 T cells were
CD45RA+CCR7
íat week 48, 6 mo after the last immunization. Therefore, the DNA C plus
NYVAC C vaccination likely induces the generation of a long-lived population of memory CD8
T cells.
Of interest, the DNA C plus NYVAC C vaccination induced a broad T cell response, with a
mean 4.2 epitopes recognized per volunteer. About 50% of epitopes identified in the EV02 study
have not previously been described according to the Los Alamos database (24), andapproximately two out of three of the total epitopes identified were located in constant regions.
A critical component of the effectiveness of vaccines is their ability to induce long-lasting
immunity. The results obtained in EV02 study after vaccination with DNA C plus NYVAC C are
extremely promising. More than 70% of volunteers have still measurable vaccine-induced T cell
responses 1 yr after the last vaccination and, more importantly, the magnitude of the T cell
responses is not substantially changed compared with 1 mo after the completion of the
vaccination regimen.
Poxvirus vectors have traditionally represented an interesting platform in the HIV vaccine arena
because of (a) their large and successful use in the veterinary field, (b) extensive safety data in
humans, (c) their use in vaccine platforms for other infectious diseases and cancer, and (d) their
facility to be manipulated and to be inserted with large gene fragments (4). However,
disappointing results on their immunogenicity in humans had seriously cast doubt on the validity
of the poxvirus platform and the rationale for their further development in the HIV vaccine
arena. The present data generated within the EV02 study have clearly demonstrated that a
poxvirus candidate vaccine, NYVAC, in combination with DNA is highly immunogenic, induces
vigorous and broad T cell responses, comprising of both CD4 and CD8 T cell responses, which
are polyfunctional, and more importantly, this vaccine regimen induces long-lasting T cell
immunity.
These promising results support the further development of the poxvirus platform and the move
of the DNA C plus NYVAC C vaccine regimen into larger clinical trials.
MATER IALS AND METHODS DNA immunogens GagPolNef (GPN) and Env.
RNA- and codon-optimized GPN and Env gene vector inserts were designed by GENEART AG
using the GeneOptimizer software package. Clade B/C' GPN and Env (gp120) sequences were
designed based on sequence information derived from a 97CN54 provirus clone (sequence
submitted to GeneBank) (35). The HIV C clade isolate CRF_70 B/C' 97CN54 was collected
from Sinkiang Province in China, biologically characterized, and sequenced in a collaboration of
China CDC (the Chinese Academy for Preventive Medicine) and the European Commission±
funded research cluster CHIVAC 1±3 in an attempt to generate region-specific candidate
vaccines. This and subsequently detected, closely related variants represent at least 60% of HIV
infections in China and are anti-genetically also close to other C clade isolates from India and
South and East Africa. The CN54 Env construct comprises 1,500 nucleotides encoding an
artificial signal peptide (MDRAKLLLLL LLLLLPQAQ), followed by gp120 CN54 (nucleotides
5,673±7,109). The 5 part of the 4,254 nucleotide CN54 GPN polygene construct encodes the
group-specific antigen (nucleotides 167±1,651) with a G2A modification rendering this
polyprotein myristylation deficient. The Gag coding sequence is followed by a 952-bp
(nucleotides 1,444±2,406) fragment encoding the 5 part of pol , including a D577N mutation
leading to an inactivation of the viral protease. A 618-bp fragment encoding a scrambled Nef
variant (5 end of nucleotides 8,170±8,469 linked to 3 end of nucleotides 8,470±8,787) was
fused to the 3 end of pol -coding sequence replacing the active site of the reverse transcription.The 3 pol reading frame (nucleotides 2,527±3,591) lacking the integrase gene was extended by
the 3 end of the scrambled Nef gene. The sequence stretch (nucleotides 2,407±2,514) encoding
the active site of the reverse transcription (amino acids 1,382±1,417 in GPN) was translocated to
the 3 end of the polygene construct, resulting in an open reading frame encoding the ~160-kD
nonglycosylated artificial GPN polyprotein. Both genes were placed under direct control of
CMV IE promoter/enhancer to generate pORT1a-GPN and pORT1a-gp120, lacking any
antibiotic resistance gene and instead using a repressor titration system for plasmid selection
(Cobra Biomanufacturing Plc.) (36). The genetic stability of both plasmids was evaluated in a
DH1lacdapD host strain up to 39 cell generations and controlled by double-strand DNA
sequencing (GENEART AG).Construction of recombinant NYVAC vector.
The NYVAC vector expressing Gag/Pol/Nef and Env of clade C HIV-1 97CN54 was used as
described previously (35). Plasmids containing codon-optimized clade C HIV-1 gagpolnef and
gp120 genes (pMA60gp120C/gagpolnef-C-14) were used. Functional expression of the donor
genes has been demonstrated by Western blot analysis of the proteins produced by the premaster
seed lot. Expression levels of the GagPolNef polygene and the Env gene were similar. The
(Cgp485-Cp721), Pol1 61 peptides (Cp725-Cpn817 and Cnp1017-Cp1161), Pol2 61 peptides
(Cp1165-Cp1403), Nef 49 peptides (Cn838-Cnp1030), Env1 49 peptides (CN9-CN249), and
Env2 63 peptides (CN253-CN485). In addition, Env peptides were either rearranged in a matrix
setting for the fine epitope mapping analyses or used as single peptides. NYSENSSEY,
YSENSSEYY, and SENSSEYYR were obtained from the peptide facility at the University of Lausanne. Furthermore, a set of peptides (n = 28) most frequently recognized in CMV, EBV, and
flu infection (CEF pool) (38, 39) was used as an additional positive control. The HLA-A*0101-
YSENSSEYY peptide±MHC pentameric complex was purchased from PROIMMUNE.
ELISPOT assays.
ELISPOT assays were performed at weeks 0, 5, 20, 24, 26, 28, and 48. In addition, 13 volunteers
recruited in Lausanne were also evaluated at week 72. ELISPOT assays were performed as per
the manufacturer's instructions (BD Biosciences). In brief, cryo-preserved blood mononuclear
cells were rested for 8 h at 37°C, and then 200,000 cells were stimulated with peptide pools (1 g
of each single peptide) in 100 l of complete media (RPMI plus 10% FBS) in quadruplicate
conditions. Media only was used as negative control. 200 ng/ml of staphylococcal enterotoxin B
(SEB) was used as a positive control on 50,000 cells, and stimulation with the CEF pool (on
200,000 cells) was used as an additional (antigen-specific) positive control. Results are expressed
as the mean number of SFU/106
cells from quadruplicate assays. Only cell samples with >80%
viability after thawing were analyzed, and only assays with <50 SFU/106 cells for the negative
control and >500 SFU/106 cells after SEB stimulation were considered valid.
Cryo-preserved blood mononuclear cells (1±2 × 10⁶) were stimulated overnight in 1 ml of
complete media containing 1l/ml Golgiplug (BD Biosciences) and 0.5 g/ml CD28 antibodies
(BD Biosciences) as described previously (29). For stimulation of blood mononuclear cells,
individual peptides or peptide pools were used at 1 g/ml for each peptide. SEB stimulation (200
ng/ml) served as positive control. For functional analyses (i.e., intracellular cytokine staining
[ICS] and assessment of the degranulation activity/CD107a mobilization), the following
antibodies were used in various combinations: CD4-FITC, -PerCP-Cy5.5, or -PB; CD8-PerCP-
Cy5.5, -PB, or APC-Alexa 700; CD3-ECD; CD14-PB; CD16-PB; CD19-PB; IFN--FITC or -
APC; IL-2-PE or -APC; TNF--FITC or -PECY-7; and CD107a-FITC or -PE. All antibodies
were from BD Biosciences, except CD8-APC-Alexa 700 (VWR International AG) and CD3-
ECD (Beckman Coulter). Furthermore, dead cells were excluded using the violet LIVE/DEAD
stain kit (Invitrogen). In addition, for phenotypic analyses, the following antibodies were used:
CCR7-FITC, -APC, or -APC-Alexa-647; CD45RA-ECD or -PerCP; and CD127-PE or -APC-
Alexa-647. CD45RA-ECD and CD127-PE were from Beckman Coulter. At the end of the
stimulation period, cells were washed, permeabilized (FACS Perm 2 solution; BD Biosciences)and stained as described previously (29). Data were acquired on a FACSCalibur or on an LSRII
three-laser (488, 633, and 405 nm) and analyzed using CELLQuest and DiVa software (Becton
Dickinson), respectively. Of note, analyses were also performed using SPICE 4.1.5 software
from Mario Roederer, Vaccine Research Center, National Institute of Allergy and Infectious
Diseases, National Institutes of Health. The number of lymphocyte-gated events ranged between
105
and 106
in the flow cytometry experiments shown. With regard to the criteria of positivity of
ICS, the background in the unstimulated controls never exceeded 0.01 to 0.02%. An ICS to be
considered positive had to have a background of <20% of the total percentage of cytokine+
cells
in the stimulated samples.
Ex vivo proliferation assay.After an overnight rest, cryo-preserved blood mononuclear cells were washed twice, resuspended
at 106/ml in PBS, and incubated for 7 min at 37°C with 0.25 M CFSE (Invitrogen) as described
previously (29). The reaction was quenched with 1 vol of FCS, and cells were washed and
cultured in the presence of 0.5 g/ml CD28 antibody (BD Biosciences). 1±2 × 10⁶
cells were
then stimulated with HIV-1 peptide or peptide pools (20 ng/ml of each peptide). SEB stimulation
(40 ng/ml) served as a positive control. At day 5, cells were harvested and stained with CD4-
PerCP-Cy5.5 and CD8-APC. Cells were fixed with CellFix (BD Biosciences) and acquired on an
LSRII. The number of lymphocyte-gated events ranged between 105 and 106.
Analysis of antibody responses.
The induction of HIV-specific antibodies was assessed using an ELISA assay. In brief, 1 g/ml
of recombinant gp140 of CN54 (provided by S. Jeffs, Imperial College, London, UK) in 100 mM
Na2HCO3, pH 9.6, was coated on plates (Maxisorp; Nunc) for one night at 4°C. After
elimination of the solution and blocking step with PBS, 5% nonfat dry milk, serum dilutions
made in PBS, 5% milk, and 3% Tween 20 (beginning at 1/20) were added for 1 h at 37°C.
Antibodies bound to the coated gp140 were revealed by an anti±human IgG±horseradish
peroxidase conjugate (1/25 000, A1070; Sigma-Aldrich). The inhibitory activity of antibodies
was assessed with three different assays. First, a multiple-round neutralization assay on PBMCs
was performed with the homologous primary isolate CN54 using experimental conditions
described previously (40). Second, antibody effects in a single-cycle infection of primary isolate
Bx08 in the engineered cell line (TZMbl) was measured as reported (41). Third, the inhibition by
antibodies of HIV-1 Bal multiplication in macrophages was determined according to the method
developed previously (42).
Statistical analysis.
An ELISPOT result was defined as positive if the number of SFU was �55 SFU/106
cells and
greater or equal to fourfold the negative control. The primary immunogenicity endpoint was a
positive ELISPOT result at weeks 26 and 28. Each participant was classified as a responder if
there was at least one positive response against any of the HIV peptides at weeks 26 or 28, and as
a nonresponder if responses at these weeks were all negative. The magnitude of a ELISPOT
response was described as the sum of SFU of all positive responses and²assuming that there is
no overlap in response across the eight peptide pools²expressed per 106
cells, either by peptide
pool or overall, without subtraction of background. An ICS was considered as positive if background was <20% of the total percentage of cytokine
+cells in the stimulated samples. Of
note, the background in the unstimulated controls never exceeded 0.01 to 0.02%. An antibody
response was classified as present if the OD measured with sera collected after immunization
was at least three times greater than the OD obtained with the corresponding preimmune serum.
Comparisons of categorical variables (e.g., the primary endpoint) were made using Fisher's exact
test. The magnitude of an ELISPOT response and other continuous variables was compared
between groups using nonparametric statistical tests (magnitude over time, paired Wilcoxon or
Friedman test; comparison between randomization groups, Mann-Whitney test). For the
comparison of flow cytometry and ELISPOT assay in measuring the frequency of IFN-±
secreting T cells, generalized estimating equations modeling was used to consider within- participant dependencies. The level of statistical significance was 5% for all analyses, without
adjustment for multiple comparisons.
AcknowledgmentsWe thank Ms. Song Ding from the EuroVacc Foundation for the support in the management of
the trial. Special thanks to Drs. Marc Girard, Jaap Goudsmit, and Michel Klein for their key
contributions in the EuroVacc EU-funded program. We are also thankful to all the EuroVacc
program investigators. We are grateful to the volunteers participating in the study.
The Ev02 clinical trial has been sponsored by the EuroVacc Foundation. The EuroVacc program
has been supported by the European Commission fifth framework program under research grantsQLK2-CT-1999-01321, QLK2-CT-2001-01316, and QLK2-CT-2002-01431.
The authors have no conflicting financial interests.