Principal arterial 542 663,028 10,325,220 9 6,406 148,973
Minor arterial 387 279,651 4,304,633 11 8,927 61,312
Collector 289 162,272 1,650,605 16 5,164 105,169
Rural 1,010 346,321 2,860,284 92 30,535 180,478
Not classified 0 0 0 0 0 0
Total 16,078 9,072,109 76,770,656 1,405 354,927 2,103,915
1 According to the Federal Highway Administration (FHWA), a bridge is classified as structurally deficient if the condition rating for the deck,
superstructure, substructure or culvert and retaining walls is rated 4 or below or if the bridge receives an appraisal rating of 2 or less for
structural condition or waterway adequacy. During inspections, the condition of a variety of bridge elements are rated on a scale of 0 (failed
condition) to 9 (excellent condition). A rating of 4 is considered “poor” condition and the individual element displays signs of advanced section
loss, deterioration, spalling or scour. 2 ARTBA analysis of FHWA data, includes all bridge construction related spending on projects approved by FHWA between 2003 and 2012.
3 This data is provided by bridge owners as part of the FHWA data and is required for any bridge eligible for the Highway Bridge Replacement
and Rehabilitation Program. However, for some states this amount is very low and likely not an accurate reflection of current costs.
transmitted in any form or by any means, electronic, mechanical, photocopying, recording, or otherwise, without prior written permission of
ARTBA.
Highlights from FHWA’s 2013 National Bridge Inventory Data:
• Of the 1,196 bridges in the state, 133 bridges, or 11% are classified as structurally deficient. This
means one or more of the key bridge elements, such as the deck, superstructure or
substructure, is considered to be in “poor” or worse condition.1
• There are 157 bridges, or 13% of all state bridges, classified as functionally obsolete. This means
the bridge does not meet design standards that are in line with current practice.
• Federal-aid investment in Alaska has supported $379.0 million in bridge construction spending
on 691 bridges between 2003 and 2012, according to FHWA data.2
• Since 2004, 158 new bridges have been constructed in the state and 60 bridges have undergone
major reconstruction.
• The state estimates that it would cost approximately $83.4 million to fix a total of 139 bridges in
the state.3
Bridge Inventory:
All Bridges Structurally deficient Bridges
Type of Bridge Total
Number
Area (sq.
meters)
Daily
Crossings
Total
Number
Area (sq.
meters)
Daily
Crossings
Rural Bridges
Interstate 147 141,808 787,548 18 16,726 53,421
Other principal arterial 105 55,499 131,464 7 4,798 10,195
Minor arterial 67 28,077 65,532 6 2,007 2,124
Major collector 233 121,090 121,159 18 7,787 8,639
Minor collector 67 19,045 20,625 12 3,445 3,037
Local 336 69,972 50,142 45 10,425 3,987
Urban Bridges
Interstate 41 33,920 981,175 0 0 0
Other freeway 0 0 0 0 0 0
Principal arterial 57 87,657 1,157,343 4 5,133 84,901
Minor arterial 49 72,770 386,898 5 10,424 46,615
Collector 44 23,991 94,469 5 5,683 5,883
Rural 50 15,124 25,505 13 6,504 6,751
Not classified 0 0 0 0 0 0
Total 1,196 668,953 3,821,860 133 72,932 225,553
1 According to the Federal Highway Administration (FHWA), a bridge is classified as structurally deficient if the condition rating for the deck,
superstructure, substructure or culvert and retaining walls is rated 4 or below or if the bridge receives an appraisal rating of 2 or less for
structural condition or waterway adequacy. During inspections, the condition of a variety of bridge elements are rated on a scale of 0 (failed
condition) to 9 (excellent condition). A rating of 4 is considered “poor” condition and the individual element displays signs of advanced section
loss, deterioration, spalling or scour. 2 ARTBA analysis of FHWA data, includes all bridge construction related spending on projects approved by FHWA between 2003 and 2012.
3 This data is provided by bridge owners as part of the FHWA data and is required for any bridge eligible for the Highway Bridge Replacement
and Rehabilitation Program. However, for some states this amount is very low and likely not an accurate reflection of current costs.
Other freeway 372 829,020 22,467,612 3 11,251 33,500
Principal arterial 766 792,549 17,857,278 6 20,031 137,086
Minor arterial 350 295,887 4,669,641 6 4,721 44,980
Collector 359 225,430 3,036,870 7 1,814 44,197
Rural 634 224,571 2,254,708 17 3,095 12,560
Not classified 0 0 0 0 0 0
Total 7,862 4,857,523 96,641,433 238 200,284 1,574,906
1 According to the Federal Highway Administration (FHWA), a bridge is classified as structurally deficient if the condition rating for the deck,
superstructure, substructure or culvert and retaining walls is rated 4 or below or if the bridge receives an appraisal rating of 2 or less for
structural condition or waterway adequacy. During inspections, the condition of a variety of bridge elements are rated on a scale of 0 (failed
condition) to 9 (excellent condition). A rating of 4 is considered “poor” condition and the individual element displays signs of advanced section
loss, deterioration, spalling or scour. 2 ARTBA analysis of FHWA data, includes all bridge construction related spending on projects approved by FHWA between 2003 and 2012.
3 This data is provided by bridge owners as part of the FHWA data and is required for any bridge eligible for the Highway Bridge Replacement
and Rehabilitation Program. However, for some states this amount is very low and likely not an accurate reflection of current costs.
Other freeway 163 292,631 2,243,066 8 6,162 87,505
Principal arterial 361 393,982 4,590,873 22 49,908 219,938
Minor arterial 388 221,369 2,290,141 11 15,107 41,324
Collector 155 56,305 358,995 1 95 400
Rural 461 103,432 498,254 21 4,125 13,691
Not classified 0 0 0 0 0 0
Total 12,748 6,181,639 42,894,051 880 353,472 1,740,900
1 According to the Federal Highway Administration (FHWA), a bridge is classified as structurally deficient if the condition rating for the deck,
superstructure, substructure or culvert and retaining walls is rated 4 or below or if the bridge receives an appraisal rating of 2 or less for
structural condition or waterway adequacy. During inspections, the condition of a variety of bridge elements are rated on a scale of 0 (failed
condition) to 9 (excellent condition). A rating of 4 is considered “poor” condition and the individual element displays signs of advanced section
loss, deterioration, spalling or scour. 2 ARTBA analysis of FHWA data, includes all bridge construction related spending on projects approved by FHWA between 2003 and 2012.
3 This data is provided by bridge owners as part of the FHWA data and is required for any bridge eligible for the Highway Bridge Replacement
and Rehabilitation Program. However, for some states this amount is very low and likely not an accurate reflection of current costs.
Total 24,955 28,400,000 655,791,987 2,769 3,979,173 58,300,000
1 According to the Federal Highway Administration (FHWA), a bridge is classified as structurally deficient if the condition rating for the deck,
superstructure, substructure or culvert and retaining walls is rated 4 or below or if the bridge receives an appraisal rating of 2 or less for
structural condition or waterway adequacy. During inspections, the condition of a variety of bridge elements are rated on a scale of 0 (failed
condition) to 9 (excellent condition). A rating of 4 is considered “poor” condition and the individual element displays signs of advanced section
loss, deterioration, spalling or scour. 2 ARTBA analysis of FHWA data, includes all bridge construction related spending on projects approved by FHWA between 2003 and 2012.
3 This data is provided by bridge owners as part of the FHWA data and is required for any bridge eligible for the Highway Bridge Replacement
and Rehabilitation Program. However, for some states this amount is very low and likely not an accurate reflection of current costs.
Other freeway 361 417,783 10,660,838 12 18,422 809,950
Principal arterial 526 613,603 10,680,908 33 35,691 674,563
Minor arterial 393 317,391 3,784,135 18 11,044 104,886
Collector 379 260,155 2,672,179 16 8,685 112,327
Rural 530 162,427 1,585,079 23 5,920 28,054
Not classified 0 0 0 0 0 0
Total 8,612 4,808,599 69,800,102 536 245,679 4,231,475
1 According to the Federal Highway Administration (FHWA), a bridge is classified as structurally deficient if the condition rating for the deck,
superstructure, substructure or culvert and retaining walls is rated 4 or below or if the bridge receives an appraisal rating of 2 or less for
structural condition or waterway adequacy. During inspections, the condition of a variety of bridge elements are rated on a scale of 0 (failed
condition) to 9 (excellent condition). A rating of 4 is considered “poor” condition and the individual element displays signs of advanced section
loss, deterioration, spalling or scour. 2 ARTBA analysis of FHWA data, includes all bridge construction related spending on projects approved by FHWA between 2003 and 2012.
3 This data is provided by bridge owners as part of the FHWA data and is required for any bridge eligible for the Highway Bridge Replacement
and Rehabilitation Program. However, for some states this amount is very low and likely not an accurate reflection of current costs.
Other freeway 545 580,590 15,421,075 30 93,262 868,600
Principal arterial 329 275,873 4,857,698 32 46,925 527,859
Minor arterial 465 297,703 4,647,951 56 39,750 495,619
Collector 440 219,812 2,120,355 50 17,114 228,674
Rural 517 192,741 1,090,037 76 27,563 212,780
Not classified 0 0 0 0 0 0
Total 4,218 3,291,651 78,021,151 413 648,674 6,249,770
1 According to the Federal Highway Administration (FHWA), a bridge is classified as structurally deficient if the condition rating for the deck,
superstructure, substructure or culvert and retaining walls is rated 4 or below or if the bridge receives an appraisal rating of 2 or less for
structural condition or waterway adequacy. During inspections, the condition of a variety of bridge elements are rated on a scale of 0 (failed
condition) to 9 (excellent condition). A rating of 4 is considered “poor” condition and the individual element displays signs of advanced section
loss, deterioration, spalling or scour. 2 ARTBA analysis of FHWA data, includes all bridge construction related spending on projects approved by FHWA between 2003 and 2012.
3 This data is provided by bridge owners as part of the FHWA data and is required for any bridge eligible for the Highway Bridge Replacement
and Rehabilitation Program. However, for some states this amount is very low and likely not an accurate reflection of current costs.
transmitted in any form or by any means, electronic, mechanical, photocopying, recording, or otherwise, without prior written permission of
ARTBA.
Highlights from FHWA’s 2013 National Bridge Inventory Data:
• Of the 864 bridges in the state, 56 bridges, or 6% are classified as structurally deficient. This
means one or more of the key bridge elements, such as the deck, superstructure or
substructure, is considered to be in “poor” or worse condition.1
• There are 121 bridges, or 14% of all state bridges, classified as functionally obsolete. This means
the bridge does not meet design standards that are in line with current practice.
• Federal-aid investment in Delaware has supported $340.9 million in bridge construction
spending on 298 bridges between 2003 and 2012, according to FHWA data.2
• Since 2004, 55 new bridges have been constructed in the state and 26 bridges have undergone
major reconstruction.
• The state estimates that it would cost approximately $651.8 million to fix a total of 340 bridges
in the state.3
Bridge Inventory:
All Bridges Structurally deficient Bridges
Type of Bridge Total
Number
Area (sq.
meters)
Daily
Crossings
Total
Number
Area (sq.
meters)
Daily
Crossings
Rural Bridges
Interstate 0 0 0 0 0 0
Other principal arterial 81 230,314 1,656,787 2 21,258 35,466
Minor arterial 21 11,490 187,809 2 159 12,503
Major collector 86 38,342 341,457 6 333 23,482
Minor collector 27 4,215 57,169 2 0 3,235
Local 196 22,602 128,029 20 124 12,306
Urban Bridges
Interstate 89 325,468 3,331,914 4 3,762 160,326
Other freeway 28 32,405 492,409 0 0 0
Principal arterial 118 169,213 2,837,874 7 29,655 184,529
Minor arterial 71 70,493 845,713 2 3,464 31,073
Collector 81 36,115 564,295 5 156 16,427
Rural 66 21,962 131,799 6 1,076 14,243
Not classified 0 0 0 0 0 0
Total 864 962,619 10,575,255 56 59,987 493,590
1 According to the Federal Highway Administration (FHWA), a bridge is classified as structurally deficient if the condition rating for the deck,
superstructure, substructure or culvert and retaining walls is rated 4 or below or if the bridge receives an appraisal rating of 2 or less for
structural condition or waterway adequacy. During inspections, the condition of a variety of bridge elements are rated on a scale of 0 (failed
condition) to 9 (excellent condition). A rating of 4 is considered “poor” condition and the individual element displays signs of advanced section
loss, deterioration, spalling or scour. 2 ARTBA analysis of FHWA data, includes all bridge construction related spending on projects approved by FHWA between 2003 and 2012.
3 This data is provided by bridge owners as part of the FHWA data and is required for any bridge eligible for the Highway Bridge Replacement
and Rehabilitation Program. However, for some states this amount is very low and likely not an accurate reflection of current costs.
transmitted in any form or by any means, electronic, mechanical, photocopying, recording, or otherwise, without prior written permission of
ARTBA.
Highlights from FHWA’s 2013 National Bridge Inventory Data:
• Of the 252 bridges in the state, 21 bridges, or 8% are classified as structurally deficient. This
means one or more of the key bridge elements, such as the deck, superstructure or
substructure, is considered to be in “poor” or worse condition.1
• There are 159 bridges, or 63% of all state bridges, classified as functionally obsolete. This means
the bridge does not meet design standards that are in line with current practice.
• Federal-aid investment in District of Columbia has supported $461.6 million in bridge
construction spending on 158 bridges between 2003 and 2012, according to FHWA data.2
• Since 2004, 19 new bridges have been constructed in the state and 33 bridges have undergone
major reconstruction.
• The state estimates that it would cost approximately $466.8 million to fix a total of 132 bridges
in the state.3
Bridge Inventory:
All Bridges Structurally deficient Bridges
Type of Bridge Total
Number
Area (sq.
meters)
Daily
Crossings
Total
Number
Area (sq.
meters)
Daily
Crossings
Rural Bridges
Interstate 0 0 0 0 0 0
Other principal arterial 0 0 0 0 0 0
Minor arterial 0 0 0 0 0 0
Major collector 0 0 0 0 0 0
Minor collector 1 270 2,000 0 0 0
Local 0 0 0 0 0 0
Urban Bridges
Interstate 68 195,481 3,846,600 5 4,072 157,300
Other freeway 31 73,730 998,050 4 27,343 156,150
Principal arterial 67 175,099 2,422,800 5 20,412 179,600
Minor arterial 25 46,473 360,100 2 1,149 17,900
Collector 15 23,520 150,800 1 200 8,600
Rural 45 48,968 471,241 4 25,131 76,883
Not classified 0 0 0 0 0 0
Total 252 563,541 8,251,591 21 78,307 596,433
1 According to the Federal Highway Administration (FHWA), a bridge is classified as structurally deficient if the condition rating for the deck,
superstructure, substructure or culvert and retaining walls is rated 4 or below or if the bridge receives an appraisal rating of 2 or less for
structural condition or waterway adequacy. During inspections, the condition of a variety of bridge elements are rated on a scale of 0 (failed
condition) to 9 (excellent condition). A rating of 4 is considered “poor” condition and the individual element displays signs of advanced section
loss, deterioration, spalling or scour. 2 ARTBA analysis of FHWA data, includes all bridge construction related spending on projects approved by FHWA between 2003 and 2012.
3 This data is provided by bridge owners as part of the FHWA data and is required for any bridge eligible for the Highway Bridge Replacement
and Rehabilitation Program. However, for some states this amount is very low and likely not an accurate reflection of current costs.
Other freeway 1,120 2,286,570 37,779,749 1 5,511 25,000
Principal arterial 1,226 2,877,700 30,800,557 6 115,972 159,277
Minor arterial 1,074 2,071,679 18,805,034 18 50,973 289,201
Collector 998 708,412 8,844,430 20 23,841 136,999
Rural 1,188 545,341 4,224,846 39 29,322 92,790
Not classified 0 0 0 0 0 0
Total 12,070 16,100,000 202,124,821 259 389,704 1,300,774
1 According to the Federal Highway Administration (FHWA), a bridge is classified as structurally deficient if the condition rating for the deck,
superstructure, substructure or culvert and retaining walls is rated 4 or below or if the bridge receives an appraisal rating of 2 or less for
structural condition or waterway adequacy. During inspections, the condition of a variety of bridge elements are rated on a scale of 0 (failed
condition) to 9 (excellent condition). A rating of 4 is considered “poor” condition and the individual element displays signs of advanced section
loss, deterioration, spalling or scour. 2 ARTBA analysis of FHWA data, includes all bridge construction related spending on projects approved by FHWA between 2003 and 2012.
3 This data is provided by bridge owners as part of the FHWA data and is required for any bridge eligible for the Highway Bridge Replacement
and Rehabilitation Program. However, for some states this amount is very low and likely not an accurate reflection of current costs.
Principal arterial 789 1,165,536 15,297,832 10 21,852 246,630
Minor arterial 1,228 1,088,321 15,285,236 46 33,441 387,027
Collector 602 364,984 4,301,895 16 8,216 84,439
Rural 1,361 726,658 6,848,206 68 12,150 105,649
Not classified 0 0 0 0 0 0
Total 14,769 9,172,250 143,920,963 835 293,644 2,052,506
1 According to the Federal Highway Administration (FHWA), a bridge is classified as structurally deficient if the condition rating for the deck,
superstructure, substructure or culvert and retaining walls is rated 4 or below or if the bridge receives an appraisal rating of 2 or less for
structural condition or waterway adequacy. During inspections, the condition of a variety of bridge elements are rated on a scale of 0 (failed
condition) to 9 (excellent condition). A rating of 4 is considered “poor” condition and the individual element displays signs of advanced section
loss, deterioration, spalling or scour. 2 ARTBA analysis of FHWA data, includes all bridge construction related spending on projects approved by FHWA between 2003 and 2012.
3 This data is provided by bridge owners as part of the FHWA data and is required for any bridge eligible for the Highway Bridge Replacement
and Rehabilitation Program. However, for some states this amount is very low and likely not an accurate reflection of current costs.
Principal arterial 164 100,641 4,685,748 19 10,376 628,200
Minor arterial 43 40,786 776,602 4 1,399 40,404
Collector 73 20,688 479,505 5 1,232 43,848
Rural 105 21,158 257,448 13 1,907 37,205
Not classified 0 0 0 0 0 0
Total 1,125 1,314,136 27,208,495 144 44,766 1,862,481
1 According to the Federal Highway Administration (FHWA), a bridge is classified as structurally deficient if the condition rating for the deck,
superstructure, substructure or culvert and retaining walls is rated 4 or below or if the bridge receives an appraisal rating of 2 or less for
structural condition or waterway adequacy. During inspections, the condition of a variety of bridge elements are rated on a scale of 0 (failed
condition) to 9 (excellent condition). A rating of 4 is considered “poor” condition and the individual element displays signs of advanced section
loss, deterioration, spalling or scour. 2 ARTBA analysis of FHWA data, includes all bridge construction related spending on projects approved by FHWA between 2003 and 2012.
3 This data is provided by bridge owners as part of the FHWA data and is required for any bridge eligible for the Highway Bridge Replacement
and Rehabilitation Program. However, for some states this amount is very low and likely not an accurate reflection of current costs.
transmitted in any form or by any means, electronic, mechanical, photocopying, recording, or otherwise, without prior written permission of
ARTBA.
Highlights from FHWA’s 2013 National Bridge Inventory Data:
• Of the 4,232 bridges in the state, 406 bridges, or 10% are classified as structurally deficient. This
means one or more of the key bridge elements, such as the deck, superstructure or
substructure, is considered to be in “poor” or worse condition.1
• There are 453 bridges, or 11% of all state bridges, classified as functionally obsolete. This means
the bridge does not meet design standards that are in line with current practice.
• Federal-aid investment in Idaho has supported $511.4 million in bridge construction spending
on 620 bridges between 2003 and 2012, according to FHWA data.2
• Since 2004, 332 new bridges have been constructed in the state and 66 bridges have undergone
major reconstruction.
• The state estimates that it would cost approximately $2.3 billion to fix a total of 1,489 bridges in
the state.3
Bridge Inventory:
All Bridges Structurally deficient Bridges
Type of Bridge Total
Number
Area (sq.
meters)
Daily
Crossings
Total
Number
Area (sq.
meters)
Daily
Crossings
Rural Bridges
Interstate 279 217,409 1,776,550 6 8,975 30,220
Other principal arterial 313 258,249 1,364,890 16 15,036 65,100
Minor arterial 232 121,310 454,320 12 9,920 28,800
Major collector 725 251,434 731,736 56 21,877 52,910
Minor collector 271 53,260 70,462 29 4,752 4,467
Local 1,757 249,125 250,962 251 32,109 28,157
Urban Bridges
Interstate 113 105,519 2,113,500 5 4,538 95,500
Other freeway 0 0 0 0 0 0
Principal arterial 192 253,074 2,835,130 6 12,500 130,800
Minor arterial 146 97,605 1,192,120 7 17,791 62,600
Collector 106 34,131 329,790 8 2,472 32,900
Rural 98 29,231 99,530 10 1,704 9,500
Not classified 0 0 0 0 0 0
Total 4,232 1,670,346 11,218,990 406 131,673 540,954
1 According to the Federal Highway Administration (FHWA), a bridge is classified as structurally deficient if the condition rating for the deck,
superstructure, substructure or culvert and retaining walls is rated 4 or below or if the bridge receives an appraisal rating of 2 or less for
structural condition or waterway adequacy. During inspections, the condition of a variety of bridge elements are rated on a scale of 0 (failed
condition) to 9 (excellent condition). A rating of 4 is considered “poor” condition and the individual element displays signs of advanced section
loss, deterioration, spalling or scour. 2 ARTBA analysis of FHWA data, includes all bridge construction related spending on projects approved by FHWA between 2003 and 2012.
3 This data is provided by bridge owners as part of the FHWA data and is required for any bridge eligible for the Highway Bridge Replacement
and Rehabilitation Program. However, for some states this amount is very low and likely not an accurate reflection of current costs.
Total 26,621 12,800,000 267,431,913 2,275 1,285,655 13,000,000
1 According to the Federal Highway Administration (FHWA), a bridge is classified as structurally deficient if the condition rating for the deck,
superstructure, substructure or culvert and retaining walls is rated 4 or below or if the bridge receives an appraisal rating of 2 or less for
structural condition or waterway adequacy. During inspections, the condition of a variety of bridge elements are rated on a scale of 0 (failed
condition) to 9 (excellent condition). A rating of 4 is considered “poor” condition and the individual element displays signs of advanced section
loss, deterioration, spalling or scour. 2 ARTBA analysis of FHWA data, includes all bridge construction related spending on projects approved by FHWA between 2003 and 2012.
3 This data is provided by bridge owners as part of the FHWA data and is required for any bridge eligible for the Highway Bridge Replacement
and Rehabilitation Program. However, for some states this amount is very low and likely not an accurate reflection of current costs.
Other freeway 256 364,658 4,075,515 18 53,754 410,853
Principal arterial 571 772,102 11,227,997 36 59,528 659,455
Minor arterial 755 575,460 7,901,711 79 64,134 797,298
Collector 574 257,111 3,231,293 52 23,655 294,047
Rural 831 198,377 1,360,280 118 21,306 174,846
Not classified 0 0 0 0 0 0
Total 18,953 7,710,036 93,536,347 1,944 688,358 6,977,075
1 According to the Federal Highway Administration (FHWA), a bridge is classified as structurally deficient if the condition rating for the deck,
superstructure, substructure or culvert and retaining walls is rated 4 or below or if the bridge receives an appraisal rating of 2 or less for
structural condition or waterway adequacy. During inspections, the condition of a variety of bridge elements are rated on a scale of 0 (failed
condition) to 9 (excellent condition). A rating of 4 is considered “poor” condition and the individual element displays signs of advanced section
loss, deterioration, spalling or scour. 2 ARTBA analysis of FHWA data, includes all bridge construction related spending on projects approved by FHWA between 2003 and 2012.
3 This data is provided by bridge owners as part of the FHWA data and is required for any bridge eligible for the Highway Bridge Replacement
and Rehabilitation Program. However, for some states this amount is very low and likely not an accurate reflection of current costs.
Principal arterial 573 1,003,443 5,304,295 9 24,456 106,610
Minor arterial 511 568,778 3,564,101 49 70,391 276,810
Collector 236 138,840 626,211 25 17,182 57,580
Rural 407 131,720 384,652 78 41,593 47,110
Not classified 0 0 0 0 0 0
Total 24,398 8,057,618 32,896,151 5,043 913,768 1,622,076
1 According to the Federal Highway Administration (FHWA), a bridge is classified as structurally deficient if the condition rating for the deck,
superstructure, substructure or culvert and retaining walls is rated 4 or below or if the bridge receives an appraisal rating of 2 or less for
structural condition or waterway adequacy. During inspections, the condition of a variety of bridge elements are rated on a scale of 0 (failed
condition) to 9 (excellent condition). A rating of 4 is considered “poor” condition and the individual element displays signs of advanced section
loss, deterioration, spalling or scour. 2 ARTBA analysis of FHWA data, includes all bridge construction related spending on projects approved by FHWA between 2003 and 2012.
3 This data is provided by bridge owners as part of the FHWA data and is required for any bridge eligible for the Highway Bridge Replacement
and Rehabilitation Program. However, for some states this amount is very low and likely not an accurate reflection of current costs.
Other freeway 432 547,091 6,507,623 2 15,696 28,825
Principal arterial 450 539,889 5,391,566 5 4,592 74,395
Minor arterial 493 440,236 4,016,779 21 22,624 135,347
Collector 342 175,306 1,119,593 13 1,722 38,811
Rural 397 86,962 381,380 40 6,359 22,644
Not classified 0 0 0 0 0 0
Total 25,171 8,141,442 44,900,885 2,554 385,935 875,202
1 According to the Federal Highway Administration (FHWA), a bridge is classified as structurally deficient if the condition rating for the deck,
superstructure, substructure or culvert and retaining walls is rated 4 or below or if the bridge receives an appraisal rating of 2 or less for
structural condition or waterway adequacy. During inspections, the condition of a variety of bridge elements are rated on a scale of 0 (failed
condition) to 9 (excellent condition). A rating of 4 is considered “poor” condition and the individual element displays signs of advanced section
loss, deterioration, spalling or scour. 2 ARTBA analysis of FHWA data, includes all bridge construction related spending on projects approved by FHWA between 2003 and 2012.
3 This data is provided by bridge owners as part of the FHWA data and is required for any bridge eligible for the Highway Bridge Replacement
and Rehabilitation Program. However, for some states this amount is very low and likely not an accurate reflection of current costs.
Principal arterial 218 367,596 3,762,590 5 7,830 57,420
Minor arterial 419 391,618 4,850,980 21 21,869 275,691
Collector 271 111,777 1,223,255 23 7,153 89,302
Rural 407 96,346 943,227 39 5,218 75,965
Not classified 0 0 0 0 0 0
Total 14,116 5,880,096 67,913,684 1,234 399,504 4,084,927
1 According to the Federal Highway Administration (FHWA), a bridge is classified as structurally deficient if the condition rating for the deck,
superstructure, substructure or culvert and retaining walls is rated 4 or below or if the bridge receives an appraisal rating of 2 or less for
structural condition or waterway adequacy. During inspections, the condition of a variety of bridge elements are rated on a scale of 0 (failed
condition) to 9 (excellent condition). A rating of 4 is considered “poor” condition and the individual element displays signs of advanced section
loss, deterioration, spalling or scour. 2 ARTBA analysis of FHWA data, includes all bridge construction related spending on projects approved by FHWA between 2003 and 2012.
3 This data is provided by bridge owners as part of the FHWA data and is required for any bridge eligible for the Highway Bridge Replacement
and Rehabilitation Program. However, for some states this amount is very low and likely not an accurate reflection of current costs.
Other freeway 157 1,040,322 3,304,990 26 391,137 312,680
Principal arterial 644 1,382,866 10,689,754 59 218,341 991,130
Minor arterial 436 413,558 4,334,907 46 44,497 455,683
Collector 317 274,913 1,836,972 53 31,877 220,218
Rural 885 572,428 4,185,472 98 62,856 330,436
Not classified 0 0 0 0 0 0
Total 13,050 16,000,000 75,702,939 1,827 1,533,036 4,617,801
1 According to the Federal Highway Administration (FHWA), a bridge is classified as structurally deficient if the condition rating for the deck,
superstructure, substructure or culvert and retaining walls is rated 4 or below or if the bridge receives an appraisal rating of 2 or less for
structural condition or waterway adequacy. During inspections, the condition of a variety of bridge elements are rated on a scale of 0 (failed
condition) to 9 (excellent condition). A rating of 4 is considered “poor” condition and the individual element displays signs of advanced section
loss, deterioration, spalling or scour. 2 ARTBA analysis of FHWA data, includes all bridge construction related spending on projects approved by FHWA between 2003 and 2012.
3 This data is provided by bridge owners as part of the FHWA data and is required for any bridge eligible for the Highway Bridge Replacement
and Rehabilitation Program. However, for some states this amount is very low and likely not an accurate reflection of current costs.
Other principal arterial 139 103,510 1,042,102 16 15,748 106,840
Minor arterial 185 98,884 977,810 24 14,396 109,926
Major collector 449 158,871 962,438 57 20,633 114,883
Minor collector 260 67,056 298,576 45 10,814 63,989
Local 736 124,921 338,103 150 15,827 38,165
Urban Bridges
Interstate 126 187,957 2,576,272 3 4,848 81,945
Other freeway 19 33,529 277,542 2 4,490 24,681
Principal arterial 56 88,788 787,961 7 5,929 97,932
Minor arterial 82 136,580 980,535 9 12,107 76,268
Collector 109 64,941 630,313 19 15,296 146,426
Rural 82 22,988 109,819 23 6,705 25,195
Not classified 0 0 0 0 0 0
Total 2,402 1,207,094 10,628,668 366 136,899 1,055,695
1 According to the Federal Highway Administration (FHWA), a bridge is classified as structurally deficient if the condition rating for the deck,
superstructure, substructure or culvert and retaining walls is rated 4 or below or if the bridge receives an appraisal rating of 2 or less for
structural condition or waterway adequacy. During inspections, the condition of a variety of bridge elements are rated on a scale of 0 (failed
condition) to 9 (excellent condition). A rating of 4 is considered “poor” condition and the individual element displays signs of advanced section
loss, deterioration, spalling or scour. 2 ARTBA analysis of FHWA data, includes all bridge construction related spending on projects approved by FHWA between 2003 and 2012.
3 This data is provided by bridge owners as part of the FHWA data and is required for any bridge eligible for the Highway Bridge Replacement
and Rehabilitation Program. However, for some states this amount is very low and likely not an accurate reflection of current costs.
Other freeway 418 797,918 20,065,816 8 7,029 366,268
Principal arterial 459 650,038 12,427,210 28 42,483 725,396
Minor arterial 324 296,635 4,611,032 16 13,521 174,382
Collector 299 177,290 2,108,524 18 3,088 133,051
Rural 696 334,812 5,707,716 61 35,643 432,483
Not classified 0 0 0 0 0 0
Total 5,291 5,083,217 119,669,035 333 185,200 4,559,812
1 According to the Federal Highway Administration (FHWA), a bridge is classified as structurally deficient if the condition rating for the deck,
superstructure, substructure or culvert and retaining walls is rated 4 or below or if the bridge receives an appraisal rating of 2 or less for
structural condition or waterway adequacy. During inspections, the condition of a variety of bridge elements are rated on a scale of 0 (failed
condition) to 9 (excellent condition). A rating of 4 is considered “poor” condition and the individual element displays signs of advanced section
loss, deterioration, spalling or scour. 2 ARTBA analysis of FHWA data, includes all bridge construction related spending on projects approved by FHWA between 2003 and 2012.
3 This data is provided by bridge owners as part of the FHWA data and is required for any bridge eligible for the Highway Bridge Replacement
and Rehabilitation Program. However, for some states this amount is very low and likely not an accurate reflection of current costs.
Other freeway 460 502,705 19,909,239 49 87,382 2,038,335
Principal arterial 680 779,007 16,995,886 100 165,993 2,616,822
Minor arterial 963 606,420 15,294,731 101 81,438 1,358,411
Collector 526 281,651 3,344,809 46 29,769 249,417
Rural 561 201,004 2,063,781 35 15,140 100,009
Not classified 0 0 0 0 0 0
Total 5,136 4,050,788 119,393,269 487 582,562 9,289,632
1 According to the Federal Highway Administration (FHWA), a bridge is classified as structurally deficient if the condition rating for the deck,
superstructure, substructure or culvert and retaining walls is rated 4 or below or if the bridge receives an appraisal rating of 2 or less for
structural condition or waterway adequacy. During inspections, the condition of a variety of bridge elements are rated on a scale of 0 (failed
condition) to 9 (excellent condition). A rating of 4 is considered “poor” condition and the individual element displays signs of advanced section
loss, deterioration, spalling or scour. 2 ARTBA analysis of FHWA data, includes all bridge construction related spending on projects approved by FHWA between 2003 and 2012.
3 This data is provided by bridge owners as part of the FHWA data and is required for any bridge eligible for the Highway Bridge Replacement
and Rehabilitation Program. However, for some states this amount is very low and likely not an accurate reflection of current costs.
Other freeway 315 332,302 7,954,389 16 17,370 256,736
Principal arterial 680 844,678 15,004,474 45 50,124 799,731
Minor arterial 809 747,099 9,880,261 94 64,919 1,133,645
Collector 470 298,362 3,687,442 40 21,354 215,314
Rural 572 313,075 2,999,596 55 19,769 195,505
Not classified 0 0 0 0 0 0
Total 11,022 6,274,311 91,447,938 1,298 542,496 6,139,992
1 According to the Federal Highway Administration (FHWA), a bridge is classified as structurally deficient if the condition rating for the deck,
superstructure, substructure or culvert and retaining walls is rated 4 or below or if the bridge receives an appraisal rating of 2 or less for
structural condition or waterway adequacy. During inspections, the condition of a variety of bridge elements are rated on a scale of 0 (failed
condition) to 9 (excellent condition). A rating of 4 is considered “poor” condition and the individual element displays signs of advanced section
loss, deterioration, spalling or scour. 2 ARTBA analysis of FHWA data, includes all bridge construction related spending on projects approved by FHWA between 2003 and 2012.
3 This data is provided by bridge owners as part of the FHWA data and is required for any bridge eligible for the Highway Bridge Replacement
and Rehabilitation Program. However, for some states this amount is very low and likely not an accurate reflection of current costs.
Other freeway 216 536,224 7,632,734 4 30,364 289,000
Principal arterial 317 551,491 5,207,287 13 38,130 182,424
Minor arterial 617 1,035,184 7,723,198 50 66,456 546,167
Collector 284 283,353 1,519,953 25 15,662 121,437
Rural 363 181,242 825,607 33 9,889 37,155
Not classified 0 0 0 0 0 0
Total 13,137 6,153,862 52,114,908 1,086 375,158 2,426,699
1 According to the Federal Highway Administration (FHWA), a bridge is classified as structurally deficient if the condition rating for the deck,
superstructure, substructure or culvert and retaining walls is rated 4 or below or if the bridge receives an appraisal rating of 2 or less for
structural condition or waterway adequacy. During inspections, the condition of a variety of bridge elements are rated on a scale of 0 (failed
condition) to 9 (excellent condition). A rating of 4 is considered “poor” condition and the individual element displays signs of advanced section
loss, deterioration, spalling or scour. 2 ARTBA analysis of FHWA data, includes all bridge construction related spending on projects approved by FHWA between 2003 and 2012.
3 This data is provided by bridge owners as part of the FHWA data and is required for any bridge eligible for the Highway Bridge Replacement
and Rehabilitation Program. However, for some states this amount is very low and likely not an accurate reflection of current costs.
transmitted in any form or by any means, electronic, mechanical, photocopying, recording, or otherwise, without prior written permission of
ARTBA.
Highlights from FHWA’s 2013 National Bridge Inventory Data:
• Of the 17,044 bridges in the state, 2,274 bridges, or 13% are classified as structurally deficient.
This means one or more of the key bridge elements, such as the deck, superstructure or
substructure, is considered to be in “poor” or worse condition.1
• There are 1,362 bridges, or 8% of all state bridges, classified as functionally obsolete. This
means the bridge does not meet design standards that are in line with current practice.
• Federal-aid investment in Mississippi has supported $1.4 billion in bridge construction spending
on 966 bridges between 2003 and 2012, according to FHWA data.2
• Since 2004, 1,926 new bridges have been constructed in the state and 98 bridges have
undergone major reconstruction.
• The state estimates that it would cost approximately $3.3 billion to fix a total of 7,328 bridges in
the state.3
Bridge Inventory:
All Bridges Structurally deficient Bridges
Type of Bridge Total
Number
Area (sq.
meters)
Daily
Crossings
Total
Number
Area (sq.
meters)
Daily
Crossings
Rural Bridges
Interstate 477 653,628 6,922,960 2 494 63,000
Other principal arterial 1,404 1,659,720 8,255,141 26 35,247 147,000
Minor arterial 1,368 888,705 4,476,616 59 33,474 153,330
Major collector 3,902 1,537,783 4,504,341 390 121,915 379,520
Minor collector 837 289,874 713,328 59 14,310 17,719
Local 7,383 1,633,905 1,525,924 1,633 223,604 164,973
Urban Bridges
Interstate 298 671,945 8,892,050 1 66,698 29,400
Other freeway 108 192,126 1,418,750 1 1,416 7,500
Principal arterial 381 907,093 5,160,444 12 6,889 111,200
Minor arterial 209 171,087 1,539,447 16 3,636 73,975
Collector 293 117,793 1,010,361 24 3,920 64,162
Rural 384 99,720 433,621 51 8,041 25,511
Not classified 0 0 0 0 0 0
Total 17,044 8,823,379 44,852,983 2,274 519,646 1,237,290
1 According to the Federal Highway Administration (FHWA), a bridge is classified as structurally deficient if the condition rating for the deck,
superstructure, substructure or culvert and retaining walls is rated 4 or below or if the bridge receives an appraisal rating of 2 or less for
structural condition or waterway adequacy. During inspections, the condition of a variety of bridge elements are rated on a scale of 0 (failed
condition) to 9 (excellent condition). A rating of 4 is considered “poor” condition and the individual element displays signs of advanced section
loss, deterioration, spalling or scour. 2 ARTBA analysis of FHWA data, includes all bridge construction related spending on projects approved by FHWA between 2003 and 2012.
3 This data is provided by bridge owners as part of the FHWA data and is required for any bridge eligible for the Highway Bridge Replacement
and Rehabilitation Program. However, for some states this amount is very low and likely not an accurate reflection of current costs.
Other freeway 1,075 1,491,047 17,744,943 42 63,161 545,328
Principal arterial 103 141,335 1,530,184 5 5,896 96,646
Minor arterial 699 659,895 5,852,975 52 62,737 431,279
Collector 641 362,315 2,713,003 55 25,518 228,200
Rural 1,073 313,491 2,408,211 158 30,361 283,486
Not classified 0 0 0 0 0 0
Total 24,350 10,300,000 84,269,894 3,357 1,010,269 5,156,503
1 According to the Federal Highway Administration (FHWA), a bridge is classified as structurally deficient if the condition rating for the deck,
superstructure, substructure or culvert and retaining walls is rated 4 or below or if the bridge receives an appraisal rating of 2 or less for
structural condition or waterway adequacy. During inspections, the condition of a variety of bridge elements are rated on a scale of 0 (failed
condition) to 9 (excellent condition). A rating of 4 is considered “poor” condition and the individual element displays signs of advanced section
loss, deterioration, spalling or scour. 2 ARTBA analysis of FHWA data, includes all bridge construction related spending on projects approved by FHWA between 2003 and 2012.
3 This data is provided by bridge owners as part of the FHWA data and is required for any bridge eligible for the Highway Bridge Replacement
and Rehabilitation Program. However, for some states this amount is very low and likely not an accurate reflection of current costs.
Other principal arterial 450 233,002 1,498,690 14 9,322 42,500
Minor arterial 552 236,809 625,247 21 13,239 18,612
Major collector 584 211,843 498,809 16 4,505 29,345
Minor collector 495 104,616 68,891 42 8,931 4,288
Local 2,038 342,299 183,428 243 35,192 23,635
Urban Bridges
Interstate 84 73,639 1,382,490 1 452 4,960
Other freeway 0 0 0 0 0 0
Principal arterial 56 118,682 1,070,680 3 5,568 63,220
Minor arterial 40 33,944 255,790 1 5,985 15,940
Collector 17 8,471 30,080 0 0 0
Rural 62 13,475 9,482 4 382 400
Not classified 0 0 0 0 0 0
Total 5,126 1,971,369 10,532,147 376 126,216 429,560
1 According to the Federal Highway Administration (FHWA), a bridge is classified as structurally deficient if the condition rating for the deck,
superstructure, substructure or culvert and retaining walls is rated 4 or below or if the bridge receives an appraisal rating of 2 or less for
structural condition or waterway adequacy. During inspections, the condition of a variety of bridge elements are rated on a scale of 0 (failed
condition) to 9 (excellent condition). A rating of 4 is considered “poor” condition and the individual element displays signs of advanced section
loss, deterioration, spalling or scour. 2 ARTBA analysis of FHWA data, includes all bridge construction related spending on projects approved by FHWA between 2003 and 2012.
3 This data is provided by bridge owners as part of the FHWA data and is required for any bridge eligible for the Highway Bridge Replacement
and Rehabilitation Program. However, for some states this amount is very low and likely not an accurate reflection of current costs.
transmitted in any form or by any means, electronic, mechanical, photocopying, recording, or otherwise, without prior written permission of
ARTBA.
Highlights from FHWA’s 2013 National Bridge Inventory Data:
• Of the 15,370 bridges in the state, 2,739 bridges, or 18% are classified as structurally deficient.
This means one or more of the key bridge elements, such as the deck, superstructure or
substructure, is considered to be in “poor” or worse condition.1
• There are 1,026 bridges, or 7% of all state bridges, classified as functionally obsolete. This
means the bridge does not meet design standards that are in line with current practice.
• Federal-aid investment in Nebraska has supported $550.9 million in bridge construction
spending on 706 bridges between 2003 and 2012, according to FHWA data.2
• Since 2004, 1,259 new bridges have been constructed in the state and 257 bridges have
undergone major reconstruction.
• The state estimates that it would cost approximately $3.7 billion to fix a total of 6,511 bridges in
the state.3
Bridge Inventory:
All Bridges Structurally deficient Bridges
Type of Bridge Total
Number
Area (sq.
meters)
Daily
Crossings
Total
Number
Area (sq.
meters)
Daily
Crossings
Rural Bridges
Interstate 213 183,353 2,552,517 2 2,794 43,806
Other principal arterial 880 443,412 3,486,761 41 31,199 172,055
Minor arterial 1,289 431,603 2,384,321 76 28,167 125,905
Major collector 2,353 616,212 1,500,106 208 48,210 95,368
Minor collector 1,223 191,122 163,932 183 19,168 14,463
Local 8,637 984,606 553,511 2,196 198,154 79,505
Urban Bridges
Interstate 119 305,681 4,223,753 2 4,124 23,128
Other freeway 52 121,841 1,192,656 0 0 0
Principal arterial 224 396,297 4,072,560 8 8,621 132,803
Minor arterial 142 146,335 1,463,075 7 14,431 66,105
Collector 90 52,667 493,215 5 2,854 17,205
Rural 148 37,297 168,368 11 2,093 2,816
Not classified 0 0 0 0 0 0
Total 15,370 3,910,425 22,254,775 2,739 359,815 773,159
1 According to the Federal Highway Administration (FHWA), a bridge is classified as structurally deficient if the condition rating for the deck,
superstructure, substructure or culvert and retaining walls is rated 4 or below or if the bridge receives an appraisal rating of 2 or less for
structural condition or waterway adequacy. During inspections, the condition of a variety of bridge elements are rated on a scale of 0 (failed
condition) to 9 (excellent condition). A rating of 4 is considered “poor” condition and the individual element displays signs of advanced section
loss, deterioration, spalling or scour. 2 ARTBA analysis of FHWA data, includes all bridge construction related spending on projects approved by FHWA between 2003 and 2012.
3 This data is provided by bridge owners as part of the FHWA data and is required for any bridge eligible for the Highway Bridge Replacement
and Rehabilitation Program. However, for some states this amount is very low and likely not an accurate reflection of current costs.
transmitted in any form or by any means, electronic, mechanical, photocopying, recording, or otherwise, without prior written permission of
ARTBA.
Highlights from FHWA’s 2013 National Bridge Inventory Data:
• Of the 1,853 bridges in the state, 36 bridges, or 2% are classified as structurally deficient. This
means one or more of the key bridge elements, such as the deck, superstructure or
substructure, is considered to be in “poor” or worse condition.1
• There are 217 bridges, or 12% of all state bridges, classified as functionally obsolete. This means
the bridge does not meet design standards that are in line with current practice.
• Federal-aid investment in Nevada has supported $586.2 million in bridge construction spending
on 233 bridges between 2003 and 2012, according to FHWA data.2
• Since 2004, 295 new bridges have been constructed in the state and 5 bridges have undergone
major reconstruction.
• The state estimates that it would cost approximately $73.0 billion to fix a total of 293 bridges in
the state.3
Bridge Inventory:
All Bridges Structurally deficient Bridges
Type of Bridge Total
Number
Area (sq.
meters)
Daily
Crossings
Total
Number
Area (sq.
meters)
Daily
Crossings
Rural Bridges
Interstate 318 219,761 2,523,279 6 3,713 26,803
Other principal arterial 110 47,678 780,444 0 0 0
Minor arterial 38 17,549 135,745 0 0 0
Major collector 110 33,746 278,263 4 1,000 920
Minor collector 63 20,104 120,947 4 526 4,049
Local 150 34,169 85,442 16 3,322 4,046
Urban Bridges
Interstate 215 468,988 12,623,877 0 0 0
Other freeway 89 132,747 3,565,584 0 0 0
Principal arterial 108 131,934 2,383,040 3 1,979 70,470
Minor arterial 179 178,884 3,402,194 3 3,324 37,000
Collector 211 190,813 1,704,607 0 0 0
Rural 262 81,960 865,259 0 0 0
Not classified 0 0 0 0 0 0
Total 1,853 1,558,332 28,468,681 36 13,863 143,288
1 According to the Federal Highway Administration (FHWA), a bridge is classified as structurally deficient if the condition rating for the deck,
superstructure, substructure or culvert and retaining walls is rated 4 or below or if the bridge receives an appraisal rating of 2 or less for
structural condition or waterway adequacy. During inspections, the condition of a variety of bridge elements are rated on a scale of 0 (failed
condition) to 9 (excellent condition). A rating of 4 is considered “poor” condition and the individual element displays signs of advanced section
loss, deterioration, spalling or scour. 2 ARTBA analysis of FHWA data, includes all bridge construction related spending on projects approved by FHWA between 2003 and 2012.
3 This data is provided by bridge owners as part of the FHWA data and is required for any bridge eligible for the Highway Bridge Replacement
and Rehabilitation Program. However, for some states this amount is very low and likely not an accurate reflection of current costs.
Principal arterial 114 131,835 1,822,812 10 5,103 124,301
Minor arterial 139 128,965 1,601,993 23 19,302 269,940
Collector 105 49,274 666,610 13 4,898 77,070
Rural 178 51,401 319,805 32 6,430 74,510
Not classified 43 4,980 8,600 12 802 2,400
Total 2,438 1,099,451 16,865,765 355 108,333 1,570,945
1 According to the Federal Highway Administration (FHWA), a bridge is classified as structurally deficient if the condition rating for the deck,
superstructure, substructure or culvert and retaining walls is rated 4 or below or if the bridge receives an appraisal rating of 2 or less for
structural condition or waterway adequacy. During inspections, the condition of a variety of bridge elements are rated on a scale of 0 (failed
condition) to 9 (excellent condition). A rating of 4 is considered “poor” condition and the individual element displays signs of advanced section
loss, deterioration, spalling or scour. 2 ARTBA analysis of FHWA data, includes all bridge construction related spending on projects approved by FHWA between 2003 and 2012.
3 This data is provided by bridge owners as part of the FHWA data and is required for any bridge eligible for the Highway Bridge Replacement
and Rehabilitation Program. However, for some states this amount is very low and likely not an accurate reflection of current costs.
Other freeway 775 1,109,920 41,225,513 35 182,948 2,687,049
Principal arterial 896 1,280,298 27,666,256 122 157,683 3,594,224
Minor arterial 1,156 925,546 14,895,755 130 91,788 1,725,312
Collector 651 290,717 4,440,172 75 27,680 458,598
Rural 961 342,989 3,269,979 64 9,952 118,038
Not classified 0 0 0 0 0 0
Total 6,566 6,669,022 154,175,425 624 690,065 10,900,000
1 According to the Federal Highway Administration (FHWA), a bridge is classified as structurally deficient if the condition rating for the deck,
superstructure, substructure or culvert and retaining walls is rated 4 or below or if the bridge receives an appraisal rating of 2 or less for
structural condition or waterway adequacy. During inspections, the condition of a variety of bridge elements are rated on a scale of 0 (failed
condition) to 9 (excellent condition). A rating of 4 is considered “poor” condition and the individual element displays signs of advanced section
loss, deterioration, spalling or scour. 2 ARTBA analysis of FHWA data, includes all bridge construction related spending on projects approved by FHWA between 2003 and 2012.
3 This data is provided by bridge owners as part of the FHWA data and is required for any bridge eligible for the Highway Bridge Replacement
and Rehabilitation Program. However, for some states this amount is very low and likely not an accurate reflection of current costs.
Principal arterial 296 292,117 5,965,260 13 9,392 142,792
Minor arterial 143 163,011 1,183,933 13 13,460 88,382
Collector 134 55,180 565,203 6 1,694 17,239
Rural 117 22,891 200,657 3 365 4,218
Not classified 0 0 0 0 0 0
Total 3,935 1,736,625 37,551,704 298 115,619 1,094,970
1 According to the Federal Highway Administration (FHWA), a bridge is classified as structurally deficient if the condition rating for the deck,
superstructure, substructure or culvert and retaining walls is rated 4 or below or if the bridge receives an appraisal rating of 2 or less for
structural condition or waterway adequacy. During inspections, the condition of a variety of bridge elements are rated on a scale of 0 (failed
condition) to 9 (excellent condition). A rating of 4 is considered “poor” condition and the individual element displays signs of advanced section
loss, deterioration, spalling or scour. 2 ARTBA analysis of FHWA data, includes all bridge construction related spending on projects approved by FHWA between 2003 and 2012.
3 This data is provided by bridge owners as part of the FHWA data and is required for any bridge eligible for the Highway Bridge Replacement
and Rehabilitation Program. However, for some states this amount is very low and likely not an accurate reflection of current costs.
Total 17,442 12,800,000 182,994,115 2,078 1,709,659 16,900,000
1 According to the Federal Highway Administration (FHWA), a bridge is classified as structurally deficient if the condition rating for the deck,
superstructure, substructure or culvert and retaining walls is rated 4 or below or if the bridge receives an appraisal rating of 2 or less for
structural condition or waterway adequacy. During inspections, the condition of a variety of bridge elements are rated on a scale of 0 (failed
condition) to 9 (excellent condition). A rating of 4 is considered “poor” condition and the individual element displays signs of advanced section
loss, deterioration, spalling or scour. 2 ARTBA analysis of FHWA data, includes all bridge construction related spending on projects approved by FHWA between 2003 and 2012.
3 This data is provided by bridge owners as part of the FHWA data and is required for any bridge eligible for the Highway Bridge Replacement
and Rehabilitation Program. However, for some states this amount is very low and likely not an accurate reflection of current costs.
Other freeway 488 654,006 11,869,697 46 63,821 1,368,950
Principal arterial 672 764,289 12,594,945 60 65,013 947,350
Minor arterial 716 572,845 8,390,805 60 44,295 573,750
Collector 422 263,769 3,122,665 49 23,892 250,940
Rural 1,383 507,669 6,254,261 132 40,751 458,134
Not classified 0 0 0 0 0 0
Total 18,168 8,967,236 113,299,262 2,308 1,027,798 8,244,816
1 According to the Federal Highway Administration (FHWA), a bridge is classified as structurally deficient if the condition rating for the deck,
superstructure, substructure or culvert and retaining walls is rated 4 or below or if the bridge receives an appraisal rating of 2 or less for
structural condition or waterway adequacy. During inspections, the condition of a variety of bridge elements are rated on a scale of 0 (failed
condition) to 9 (excellent condition). A rating of 4 is considered “poor” condition and the individual element displays signs of advanced section
loss, deterioration, spalling or scour. 2 ARTBA analysis of FHWA data, includes all bridge construction related spending on projects approved by FHWA between 2003 and 2012.
3 This data is provided by bridge owners as part of the FHWA data and is required for any bridge eligible for the Highway Bridge Replacement
and Rehabilitation Program. However, for some states this amount is very low and likely not an accurate reflection of current costs.
transmitted in any form or by any means, electronic, mechanical, photocopying, recording, or otherwise, without prior written permission of
ARTBA.
Highlights from FHWA’s 2013 National Bridge Inventory Data:
• Of the 4,439 bridges in the state, 726 bridges, or 16% are classified as structurally deficient. This
means one or more of the key bridge elements, such as the deck, superstructure or
substructure, is considered to be in “poor” or worse condition.1
• There are 240 bridges, or 5% of all state bridges, classified as functionally obsolete. This means
the bridge does not meet design standards that are in line with current practice.
• Federal-aid investment in North Dakota has supported $326.4 million in bridge construction
spending on 646 bridges between 2003 and 2012, according to FHWA data.2
• Since 2004, 259 new bridges have been constructed in the state and 94 bridges have undergone
major reconstruction.
• The state estimates that it would cost approximately $274.1 million to fix a total of 1,455
bridges in the state.3
Bridge Inventory:
All Bridges Structurally deficient Bridges
Type of Bridge Total
Number
Area (sq.
meters)
Daily
Crossings
Total
Number
Area (sq.
meters)
Daily
Crossings
Rural Bridges
Interstate 147 80,545 637,915 7 7,383 18,275
Other principal arterial 358 164,054 598,366 9 4,904 18,590
Minor arterial 247 94,571 239,385 7 1,813 10,240
Major collector 879 226,419 236,891 40 8,995 7,606
Minor collector 13 3,052 1,265 2 445 400
Local 2,542 331,619 210,279 653 63,735 16,635
Urban Bridges
Interstate 59 81,956 757,475 1 964 4,100
Other freeway 0 0 0 0 0 0
Principal arterial 82 156,667 1,269,330 1 773 13,780
Minor arterial 60 72,595 321,284 1 670 9,200
Collector 19 10,508 47,680 1 89 160
Rural 33 7,800 33,777 4 461 344
Not classified 0 0 0 0 0 0
Total 4,439 1,229,786 4,353,647 726 90,233 99,330
1 According to the Federal Highway Administration (FHWA), a bridge is classified as structurally deficient if the condition rating for the deck,
superstructure, substructure or culvert and retaining walls is rated 4 or below or if the bridge receives an appraisal rating of 2 or less for
structural condition or waterway adequacy. During inspections, the condition of a variety of bridge elements are rated on a scale of 0 (failed
condition) to 9 (excellent condition). A rating of 4 is considered “poor” condition and the individual element displays signs of advanced section
loss, deterioration, spalling or scour. 2 ARTBA analysis of FHWA data, includes all bridge construction related spending on projects approved by FHWA between 2003 and 2012.
3 This data is provided by bridge owners as part of the FHWA data and is required for any bridge eligible for the Highway Bridge Replacement
and Rehabilitation Program. However, for some states this amount is very low and likely not an accurate reflection of current costs.
Other freeway 776 1,131,059 17,260,730 17 66,685 360,611
Principal arterial 903 1,292,243 14,356,487 56 131,130 1,060,106
Minor arterial 1,083 1,091,671 11,840,836 84 106,287 1,323,374
Collector 994 665,496 6,866,748 85 52,183 567,470
Rural 1,380 589,091 4,300,807 168 61,888 268,502
Not classified 0 0 0 0 0 0
Total 27,015 13,400,000 175,140,809 2,242 857,323 8,011,112
1 According to the Federal Highway Administration (FHWA), a bridge is classified as structurally deficient if the condition rating for the deck,
superstructure, substructure or culvert and retaining walls is rated 4 or below or if the bridge receives an appraisal rating of 2 or less for
structural condition or waterway adequacy. During inspections, the condition of a variety of bridge elements are rated on a scale of 0 (failed
condition) to 9 (excellent condition). A rating of 4 is considered “poor” condition and the individual element displays signs of advanced section
loss, deterioration, spalling or scour. 2 ARTBA analysis of FHWA data, includes all bridge construction related spending on projects approved by FHWA between 2003 and 2012.
3 This data is provided by bridge owners as part of the FHWA data and is required for any bridge eligible for the Highway Bridge Replacement
and Rehabilitation Program. However, for some states this amount is very low and likely not an accurate reflection of current costs.
Other freeway 422 498,256 11,144,570 20 16,989 576,850
Principal arterial 541 468,713 6,212,751 50 41,559 567,294
Minor arterial 511 331,817 2,359,409 48 32,361 158,801
Collector 567 417,074 3,194,729 83 46,961 335,989
Rural 639 159,387 1,107,907 78 16,022 85,371
Not classified 0 0 0 0 0 0
Total 22,912 8,282,210 70,413,802 4,227 989,982 6,094,292
1 According to the Federal Highway Administration (FHWA), a bridge is classified as structurally deficient if the condition rating for the deck,
superstructure, substructure or culvert and retaining walls is rated 4 or below or if the bridge receives an appraisal rating of 2 or less for
structural condition or waterway adequacy. During inspections, the condition of a variety of bridge elements are rated on a scale of 0 (failed
condition) to 9 (excellent condition). A rating of 4 is considered “poor” condition and the individual element displays signs of advanced section
loss, deterioration, spalling or scour. 2 ARTBA analysis of FHWA data, includes all bridge construction related spending on projects approved by FHWA between 2003 and 2012.
3 This data is provided by bridge owners as part of the FHWA data and is required for any bridge eligible for the Highway Bridge Replacement
and Rehabilitation Program. However, for some states this amount is very low and likely not an accurate reflection of current costs.
Other freeway 71 148,283 3,018,133 4 20,072 129,261
Principal arterial 348 563,986 6,489,992 16 42,649 319,904
Minor arterial 418 456,588 5,551,997 21 36,459 190,726
Collector 352 190,637 1,838,961 17 10,781 67,874
Rural 191 76,183 496,667 16 6,096 9,092
Not classified 0 0 0 0 0 0
Total 7,656 4,886,278 44,286,310 431 260,818 1,569,646
1 According to the Federal Highway Administration (FHWA), a bridge is classified as structurally deficient if the condition rating for the deck,
superstructure, substructure or culvert and retaining walls is rated 4 or below or if the bridge receives an appraisal rating of 2 or less for
structural condition or waterway adequacy. During inspections, the condition of a variety of bridge elements are rated on a scale of 0 (failed
condition) to 9 (excellent condition). A rating of 4 is considered “poor” condition and the individual element displays signs of advanced section
loss, deterioration, spalling or scour. 2 ARTBA analysis of FHWA data, includes all bridge construction related spending on projects approved by FHWA between 2003 and 2012.
3 This data is provided by bridge owners as part of the FHWA data and is required for any bridge eligible for the Highway Bridge Replacement
and Rehabilitation Program. However, for some states this amount is very low and likely not an accurate reflection of current costs.
Total 22,660 12,500,000 130,020,971 5,218 1,691,520 17,400,000
1 According to the Federal Highway Administration (FHWA), a bridge is classified as structurally deficient if the condition rating for the deck,
superstructure, substructure or culvert and retaining walls is rated 4 or below or if the bridge receives an appraisal rating of 2 or less for
structural condition or waterway adequacy. During inspections, the condition of a variety of bridge elements are rated on a scale of 0 (failed
condition) to 9 (excellent condition). A rating of 4 is considered “poor” condition and the individual element displays signs of advanced section
loss, deterioration, spalling or scour. 2 ARTBA analysis of FHWA data, includes all bridge construction related spending on projects approved by FHWA between 2003 and 2012.
3 This data is provided by bridge owners as part of the FHWA data and is required for any bridge eligible for the Highway Bridge Replacement
and Rehabilitation Program. However, for some states this amount is very low and likely not an accurate reflection of current costs.
transmitted in any form or by any means, electronic, mechanical, photocopying, recording, or otherwise, without prior written permission of
ARTBA.
Highlights from FHWA’s 2013 National Bridge Inventory Data:
• Of the 766 bridges in the state, 167 bridges, or 22% are classified as structurally deficient. This
means one or more of the key bridge elements, such as the deck, superstructure or
substructure, is considered to be in “poor” or worse condition.1
• There are 266 bridges, or 35% of all state bridges, classified as functionally obsolete. This means
the bridge does not meet design standards that are in line with current practice.
• Federal-aid investment in Rhode Island has supported $1.1 billion in bridge construction
spending on 319 bridges between 2003 and 2012, according to FHWA data.2
• Since 2004, 49 new bridges have been constructed in the state and 56 bridges have undergone
major reconstruction.
• The state estimates that it would cost approximately $2.8 billion to fix a total of 719 bridges in
the state.3
Bridge Inventory:
All Bridges Structurally deficient Bridges
Type of Bridge Total
Number
Area (sq.
meters)
Daily
Crossings
Total
Number
Area (sq.
meters)
Daily
Crossings
Rural Bridges
Interstate 15 8,429 483,780 2 619 48,800
Other principal arterial 8 3,729 72,300 2 2,669 19,100
Minor arterial 7 2,477 31,628 0 0 0
Major collector 25 8,073 106,209 9 3,600 36,703
Minor collector 16 3,370 28,304 2 147 10,500
Local 30 4,253 24,441 10 781 3,261
Urban Bridges
Interstate 86 166,359 6,713,955 12 27,073 827,134
Other freeway 109 183,311 3,047,670 28 36,612 705,146
Principal arterial 139 211,305 2,405,894 29 47,163 456,597
Minor arterial 123 76,588 1,420,264 28 14,605 394,352
Collector 89 38,765 591,858 18 9,001 87,283
Rural 119 74,161 914,179 27 9,435 93,070
Not classified 0 0 0 0 0 0
Total 766 780,819 15,840,482 167 151,705 2,681,946
1 According to the Federal Highway Administration (FHWA), a bridge is classified as structurally deficient if the condition rating for the deck,
superstructure, substructure or culvert and retaining walls is rated 4 or below or if the bridge receives an appraisal rating of 2 or less for
structural condition or waterway adequacy. During inspections, the condition of a variety of bridge elements are rated on a scale of 0 (failed
condition) to 9 (excellent condition). A rating of 4 is considered “poor” condition and the individual element displays signs of advanced section
loss, deterioration, spalling or scour. 2 ARTBA analysis of FHWA data, includes all bridge construction related spending on projects approved by FHWA between 2003 and 2012.
3 This data is provided by bridge owners as part of the FHWA data and is required for any bridge eligible for the Highway Bridge Replacement
and Rehabilitation Program. However, for some states this amount is very low and likely not an accurate reflection of current costs.
Other freeway 77 281,025 1,320,000 6 7,681 139,500
Principal arterial 357 833,814 6,632,030 32 67,521 556,900
Minor arterial 445 531,868 4,832,682 45 43,974 449,750
Collector 532 254,312 2,337,138 60 20,750 239,535
Rural 550 140,783 582,146 67 12,388 46,987
Not classified 0 0 0 0 0 0
Total 9,275 6,592,414 44,613,204 1,048 517,912 3,103,695
1 According to the Federal Highway Administration (FHWA), a bridge is classified as structurally deficient if the condition rating for the deck,
superstructure, substructure or culvert and retaining walls is rated 4 or below or if the bridge receives an appraisal rating of 2 or less for
structural condition or waterway adequacy. During inspections, the condition of a variety of bridge elements are rated on a scale of 0 (failed
condition) to 9 (excellent condition). A rating of 4 is considered “poor” condition and the individual element displays signs of advanced section
loss, deterioration, spalling or scour. 2 ARTBA analysis of FHWA data, includes all bridge construction related spending on projects approved by FHWA between 2003 and 2012.
3 This data is provided by bridge owners as part of the FHWA data and is required for any bridge eligible for the Highway Bridge Replacement
and Rehabilitation Program. However, for some states this amount is very low and likely not an accurate reflection of current costs.
transmitted in any form or by any means, electronic, mechanical, photocopying, recording, or otherwise, without prior written permission of
ARTBA.
Highlights from FHWA’s 2013 National Bridge Inventory Data:
• Of the 5,875 bridges in the state, 1,210 bridges, or 21% are classified as structurally deficient.
This means one or more of the key bridge elements, such as the deck, superstructure or
substructure, is considered to be in “poor” or worse condition.1
• There are 249 bridges, or 4% of all state bridges, classified as functionally obsolete. This means
the bridge does not meet design standards that are in line with current practice.
• Federal-aid investment in South Dakota has supported $321.1 million in bridge construction
spending on 2,324 bridges between 2003 and 2012, according to FHWA data.2
• Since 2004, 495 new bridges have been constructed in the state and 35 bridges have undergone
major reconstruction.
• The state estimates that it would cost approximately $690.9 million to fix a total of 2,393
bridges in the state.3
Bridge Inventory:
All Bridges Structurally deficient Bridges
Type of Bridge Total
Number
Area (sq.
meters)
Daily
Crossings
Total
Number
Area (sq.
meters)
Daily
Crossings
Rural Bridges
Interstate 338 192,357 1,695,208 3 1,911 15,974
Other principal arterial 454 229,602 893,357 22 18,583 40,857
Minor arterial 522 207,622 584,790 20 14,511 24,168
Major collector 1,156 312,516 405,855 192 49,943 55,068
Minor collector 165 45,334 23,778 37 5,283 6,128
Local 2,846 375,086 212,769 902 92,433 60,089
Urban Bridges
Interstate 117 103,018 1,413,736 3 2,772 35,465
Other freeway 6 10,827 58,440 0 0 0
Principal arterial 69 77,303 770,503 3 3,388 40,470
Minor arterial 86 66,493 608,692 7 5,637 39,477
Collector 51 27,650 200,046 10 7,170 49,285
Rural 65 13,785 62,459 11 2,160 2,739
Not classified 0 0 0 0 0 0
Total 5,875 1,661,593 6,929,633 1,210 203,790 369,720
1 According to the Federal Highway Administration (FHWA), a bridge is classified as structurally deficient if the condition rating for the deck,
superstructure, substructure or culvert and retaining walls is rated 4 or below or if the bridge receives an appraisal rating of 2 or less for
structural condition or waterway adequacy. During inspections, the condition of a variety of bridge elements are rated on a scale of 0 (failed
condition) to 9 (excellent condition). A rating of 4 is considered “poor” condition and the individual element displays signs of advanced section
loss, deterioration, spalling or scour. 2 ARTBA analysis of FHWA data, includes all bridge construction related spending on projects approved by FHWA between 2003 and 2012.
3 This data is provided by bridge owners as part of the FHWA data and is required for any bridge eligible for the Highway Bridge Replacement
and Rehabilitation Program. However, for some states this amount is very low and likely not an accurate reflection of current costs.
Other freeway 317 554,531 10,491,195 7 10,267 383,160
Principal arterial 989 1,223,643 19,879,680 37 75,933 908,840
Minor arterial 883 712,922 9,572,578 43 43,584 455,470
Collector 436 177,741 1,913,075 22 9,338 105,240
Rural 967 262,927 1,810,893 56 15,851 79,995
Not classified 0 0 0 0 0 0
Total 20,058 9,460,965 149,111,871 1,157 504,607 4,871,101
1 According to the Federal Highway Administration (FHWA), a bridge is classified as structurally deficient if the condition rating for the deck,
superstructure, substructure or culvert and retaining walls is rated 4 or below or if the bridge receives an appraisal rating of 2 or less for
structural condition or waterway adequacy. During inspections, the condition of a variety of bridge elements are rated on a scale of 0 (failed
condition) to 9 (excellent condition). A rating of 4 is considered “poor” condition and the individual element displays signs of advanced section
loss, deterioration, spalling or scour. 2 ARTBA analysis of FHWA data, includes all bridge construction related spending on projects approved by FHWA between 2003 and 2012.
3 This data is provided by bridge owners as part of the FHWA data and is required for any bridge eligible for the Highway Bridge Replacement
and Rehabilitation Program. However, for some states this amount is very low and likely not an accurate reflection of current costs.
Total 52,561 44,700,000 518,529,054 1,283 722,046 2,762,042
1 According to the Federal Highway Administration (FHWA), a bridge is classified as structurally deficient if the condition rating for the deck,
superstructure, substructure or culvert and retaining walls is rated 4 or below or if the bridge receives an appraisal rating of 2 or less for
structural condition or waterway adequacy. During inspections, the condition of a variety of bridge elements are rated on a scale of 0 (failed
condition) to 9 (excellent condition). A rating of 4 is considered “poor” condition and the individual element displays signs of advanced section
loss, deterioration, spalling or scour. 2 ARTBA analysis of FHWA data, includes all bridge construction related spending on projects approved by FHWA between 2003 and 2012.
3 This data is provided by bridge owners as part of the FHWA data and is required for any bridge eligible for the Highway Bridge Replacement
and Rehabilitation Program. However, for some states this amount is very low and likely not an accurate reflection of current costs.
transmitted in any form or by any means, electronic, mechanical, photocopying, recording, or otherwise, without prior written permission of
ARTBA.
Highlights from FHWA’s 2013 National Bridge Inventory Data:
• Of the 2,974 bridges in the state, 117 bridges, or 4% are classified as structurally deficient. This
means one or more of the key bridge elements, such as the deck, superstructure or
substructure, is considered to be in “poor” or worse condition.1
• There are 320 bridges, or 11% of all state bridges, classified as functionally obsolete. This means
the bridge does not meet design standards that are in line with current practice.
• Federal-aid investment in Utah has supported $264.4 million in bridge construction spending on
464 bridges between 2003 and 2012, according to FHWA data.2
• Since 2004, 475 new bridges have been constructed in the state and 71 bridges have undergone
major reconstruction.
• The state estimates that it would cost approximately $19.9 million to fix a total of 68 bridges in
the state.3
Bridge Inventory:
All Bridges Structurally deficient Bridges
Type of Bridge Total
Number
Area (sq.
meters)
Daily
Crossings
Total
Number
Area (sq.
meters)
Daily
Crossings
Rural Bridges
Interstate 437 241,970 3,177,737 4 1,603 18,583
Other principal arterial 177 111,974 1,227,411 4 3,036 40,298
Minor arterial 172 55,061 327,040 2 653 2,879
Major collector 313 95,713 413,092 17 3,334 18,725
Minor collector 140 33,615 59,859 12 2,233 2,877
Local 566 114,476 164,222 47 4,994 6,386
Urban Bridges
Interstate 412 591,962 22,380,875 8 7,753 274,110
Other freeway 42 113,348 907,055 0 0 0
Principal arterial 162 171,248 3,114,309 4 3,573 55,956
Minor arterial 181 229,715 2,791,818 5 2,187 84,901
Collector 93 57,987 586,323 5 1,755 29,655
Rural 279 84,694 877,207 9 1,364 60,077
Not classified 0 0 0 0 0 0
Total 2,974 1,901,763 36,026,948 117 32,486 594,447
1 According to the Federal Highway Administration (FHWA), a bridge is classified as structurally deficient if the condition rating for the deck,
superstructure, substructure or culvert and retaining walls is rated 4 or below or if the bridge receives an appraisal rating of 2 or less for
structural condition or waterway adequacy. During inspections, the condition of a variety of bridge elements are rated on a scale of 0 (failed
condition) to 9 (excellent condition). A rating of 4 is considered “poor” condition and the individual element displays signs of advanced section
loss, deterioration, spalling or scour. 2 ARTBA analysis of FHWA data, includes all bridge construction related spending on projects approved by FHWA between 2003 and 2012.
3 This data is provided by bridge owners as part of the FHWA data and is required for any bridge eligible for the Highway Bridge Replacement
and Rehabilitation Program. However, for some states this amount is very low and likely not an accurate reflection of current costs.
transmitted in any form or by any means, electronic, mechanical, photocopying, recording, or otherwise, without prior written permission of
ARTBA.
Highlights from FHWA’s 2013 National Bridge Inventory Data:
• Of the 2,731 bridges in the state, 251 bridges, or 9% are classified as structurally deficient. This
means one or more of the key bridge elements, such as the deck, superstructure or
substructure, is considered to be in “poor” or worse condition.1
• There are 652 bridges, or 24% of all state bridges, classified as functionally obsolete. This means
the bridge does not meet design standards that are in line with current practice.
• Federal-aid investment in Vermont has supported $595.8 million in bridge construction
spending on 1,110 bridges between 2003 and 2012, according to FHWA data.2
• Since 2004, 141 new bridges have been constructed in the state and 147 bridges have
undergone major reconstruction.
• The state estimates that it would cost approximately $855.4 million to fix a total of 1,271
bridges in the state.3
Bridge Inventory:
All Bridges Structurally deficient Bridges
Type of Bridge Total
Number
Area (sq.
meters)
Daily
Crossings
Total
Number
Area (sq.
meters)
Daily
Crossings
Rural Bridges
Interstate 256 198,936 1,965,861 6 12,558 42,650
Other principal arterial 118 96,295 678,670 2 392 11,500
Minor arterial 256 89,877 947,345 24 8,753 75,360
Major collector 523 143,418 1,017,559 43 14,039 81,560
Minor collector 173 28,851 96,810 18 2,983 13,535
Local 1,180 142,616 289,990 147 16,806 34,461
Urban Bridges
Interstate 57 49,266 868,848 2 3,917 26,200
Other freeway 2 574 18,200 0 0 0
Principal arterial 56 50,121 539,190 2 1,274 29,300
Minor arterial 37 23,453 278,910 2 1,276 12,270
Collector 42 15,644 157,060 4 1,194 17,300
Rural 31 6,892 28,407 1 113 300
Not classified 0 0 0 0 0 0
Total 2,731 845,943 6,886,850 251 63,305 344,436
1 According to the Federal Highway Administration (FHWA), a bridge is classified as structurally deficient if the condition rating for the deck,
superstructure, substructure or culvert and retaining walls is rated 4 or below or if the bridge receives an appraisal rating of 2 or less for
structural condition or waterway adequacy. During inspections, the condition of a variety of bridge elements are rated on a scale of 0 (failed
condition) to 9 (excellent condition). A rating of 4 is considered “poor” condition and the individual element displays signs of advanced section
loss, deterioration, spalling or scour. 2 ARTBA analysis of FHWA data, includes all bridge construction related spending on projects approved by FHWA between 2003 and 2012.
3 This data is provided by bridge owners as part of the FHWA data and is required for any bridge eligible for the Highway Bridge Replacement
and Rehabilitation Program. However, for some states this amount is very low and likely not an accurate reflection of current costs.
Other freeway 435 758,097 9,322,050 4 6,768 109,958
Principal arterial 757 1,267,408 17,090,512 63 115,003 1,399,681
Minor arterial 779 775,411 11,053,920 45 47,772 587,470
Collector 514 303,332 3,179,055 39 16,772 198,272
Rural 859 325,921 3,090,409 61 13,869 159,143
Not classified 0 0 0 0 0 0
Total 13,765 9,377,546 121,201,974 1,186 533,410 6,569,203
1 According to the Federal Highway Administration (FHWA), a bridge is classified as structurally deficient if the condition rating for the deck,
superstructure, substructure or culvert and retaining walls is rated 4 or below or if the bridge receives an appraisal rating of 2 or less for
structural condition or waterway adequacy. During inspections, the condition of a variety of bridge elements are rated on a scale of 0 (failed
condition) to 9 (excellent condition). A rating of 4 is considered “poor” condition and the individual element displays signs of advanced section
loss, deterioration, spalling or scour. 2 ARTBA analysis of FHWA data, includes all bridge construction related spending on projects approved by FHWA between 2003 and 2012.
3 This data is provided by bridge owners as part of the FHWA data and is required for any bridge eligible for the Highway Bridge Replacement
and Rehabilitation Program. However, for some states this amount is very low and likely not an accurate reflection of current costs.
Other freeway 474 1,271,076 12,849,175 13 173,470 453,110
Principal arterial 445 815,418 8,163,360 36 90,866 655,019
Minor arterial 511 591,154 5,337,821 30 62,444 328,003
Collector 224 167,855 1,145,019 6 3,905 31,584
Rural 285 132,659 589,062 14 2,843 18,220
Not classified 0 0 0 0 0 0
Total 7,902 6,967,018 67,407,439 372 618,394 2,712,259
1 According to the Federal Highway Administration (FHWA), a bridge is classified as structurally deficient if the condition rating for the deck,
superstructure, substructure or culvert and retaining walls is rated 4 or below or if the bridge receives an appraisal rating of 2 or less for
structural condition or waterway adequacy. During inspections, the condition of a variety of bridge elements are rated on a scale of 0 (failed
condition) to 9 (excellent condition). A rating of 4 is considered “poor” condition and the individual element displays signs of advanced section
loss, deterioration, spalling or scour. 2 ARTBA analysis of FHWA data, includes all bridge construction related spending on projects approved by FHWA between 2003 and 2012.
3 This data is provided by bridge owners as part of the FHWA data and is required for any bridge eligible for the Highway Bridge Replacement
and Rehabilitation Program. However, for some states this amount is very low and likely not an accurate reflection of current costs.
Principal arterial 135 260,084 1,970,100 18 17,680 187,610
Minor arterial 200 216,433 1,749,436 37 20,267 328,300
Collector 125 71,722 528,668 16 10,972 81,210
Rural 272 90,921 333,390 62 16,649 65,880
Not classified 0 0 0 0 0 0
Total 7,125 3,699,838 23,892,389 944 291,965 2,304,407
1 According to the Federal Highway Administration (FHWA), a bridge is classified as structurally deficient if the condition rating for the deck,
superstructure, substructure or culvert and retaining walls is rated 4 or below or if the bridge receives an appraisal rating of 2 or less for
structural condition or waterway adequacy. During inspections, the condition of a variety of bridge elements are rated on a scale of 0 (failed
condition) to 9 (excellent condition). A rating of 4 is considered “poor” condition and the individual element displays signs of advanced section
loss, deterioration, spalling or scour. 2 ARTBA analysis of FHWA data, includes all bridge construction related spending on projects approved by FHWA between 2003 and 2012.
3 This data is provided by bridge owners as part of the FHWA data and is required for any bridge eligible for the Highway Bridge Replacement
and Rehabilitation Program. However, for some states this amount is very low and likely not an accurate reflection of current costs.
Other freeway 376 489,551 10,309,550 8 8,148 141,500
Principal arterial 716 907,602 11,833,900 23 25,603 276,981
Minor arterial 561 556,877 5,946,110 60 56,010 550,194
Collector 183 99,716 905,283 20 11,232 67,060
Rural 514 242,398 1,948,208 43 10,488 78,602
Not classified 0 0 0 0 0 0
Total 14,088 6,517,870 77,763,653 1,198 372,809 2,871,339
1 According to the Federal Highway Administration (FHWA), a bridge is classified as structurally deficient if the condition rating for the deck,
superstructure, substructure or culvert and retaining walls is rated 4 or below or if the bridge receives an appraisal rating of 2 or less for
structural condition or waterway adequacy. During inspections, the condition of a variety of bridge elements are rated on a scale of 0 (failed
condition) to 9 (excellent condition). A rating of 4 is considered “poor” condition and the individual element displays signs of advanced section
loss, deterioration, spalling or scour. 2 ARTBA analysis of FHWA data, includes all bridge construction related spending on projects approved by FHWA between 2003 and 2012.
3 This data is provided by bridge owners as part of the FHWA data and is required for any bridge eligible for the Highway Bridge Replacement
and Rehabilitation Program. However, for some states this amount is very low and likely not an accurate reflection of current costs.
Principal arterial 77 91,179 748,442 15 25,495 172,623
Minor arterial 41 36,600 229,103 10 9,787 63,135
Collector 48 28,211 143,336 8 3,370 20,397
Rural 45 13,651 49,613 9 2,336 3,360
Not classified 0 0 0 0 0 0
Total 3,099 1,250,112 7,173,575 443 207,990 1,024,959
1 According to the Federal Highway Administration (FHWA), a bridge is classified as structurally deficient if the condition rating for the deck,
superstructure, substructure or culvert and retaining walls is rated 4 or below or if the bridge receives an appraisal rating of 2 or less for
structural condition or waterway adequacy. During inspections, the condition of a variety of bridge elements are rated on a scale of 0 (failed
condition) to 9 (excellent condition). A rating of 4 is considered “poor” condition and the individual element displays signs of advanced section
loss, deterioration, spalling or scour. 2 ARTBA analysis of FHWA data, includes all bridge construction related spending on projects approved by FHWA between 2003 and 2012.
3 This data is provided by bridge owners as part of the FHWA data and is required for any bridge eligible for the Highway Bridge Replacement
and Rehabilitation Program. However, for some states this amount is very low and likely not an accurate reflection of current costs.


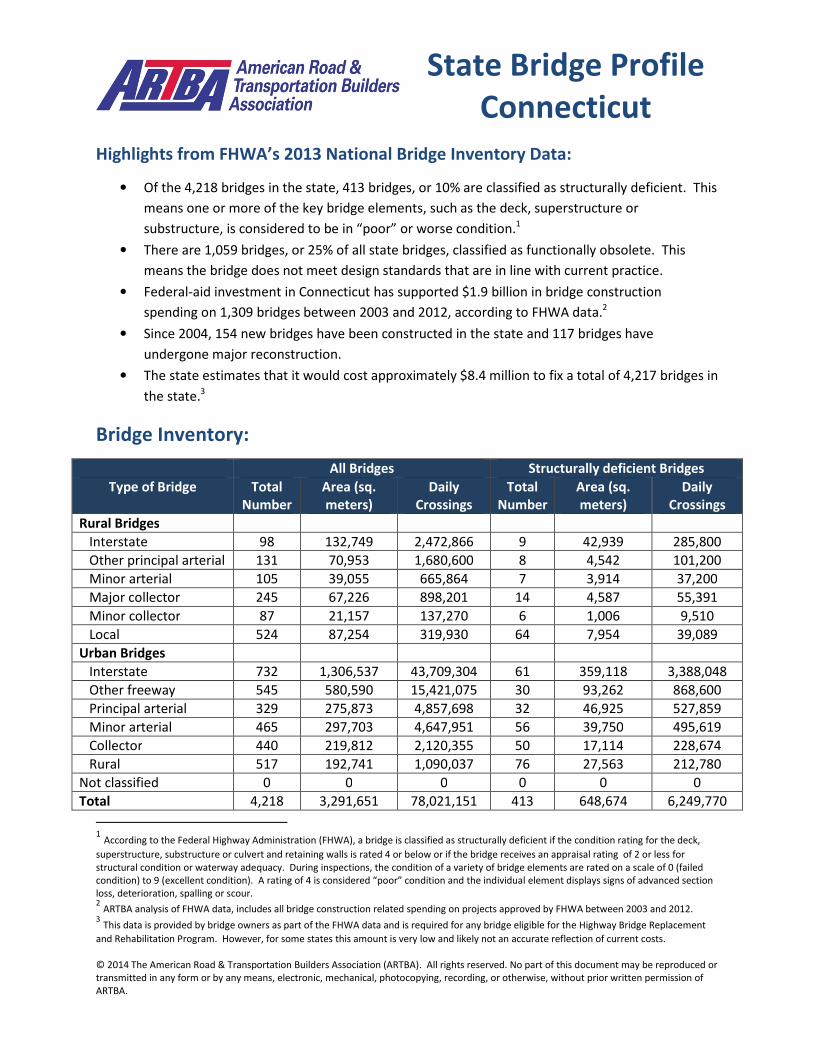


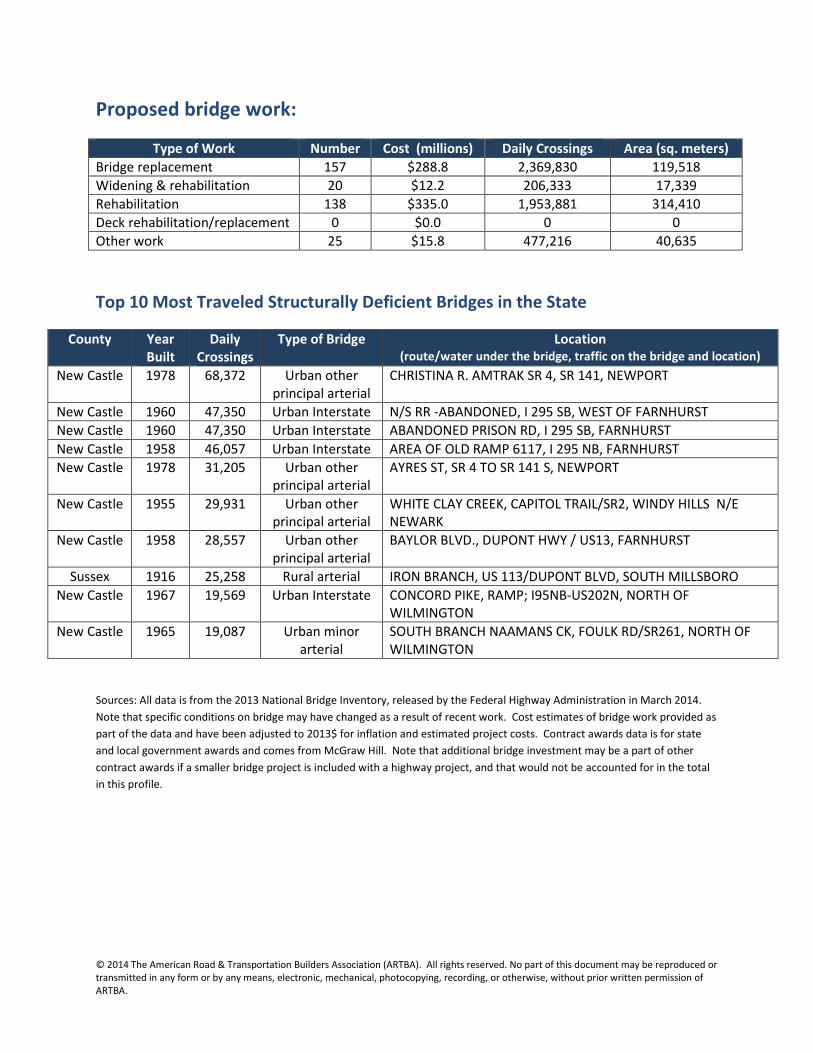
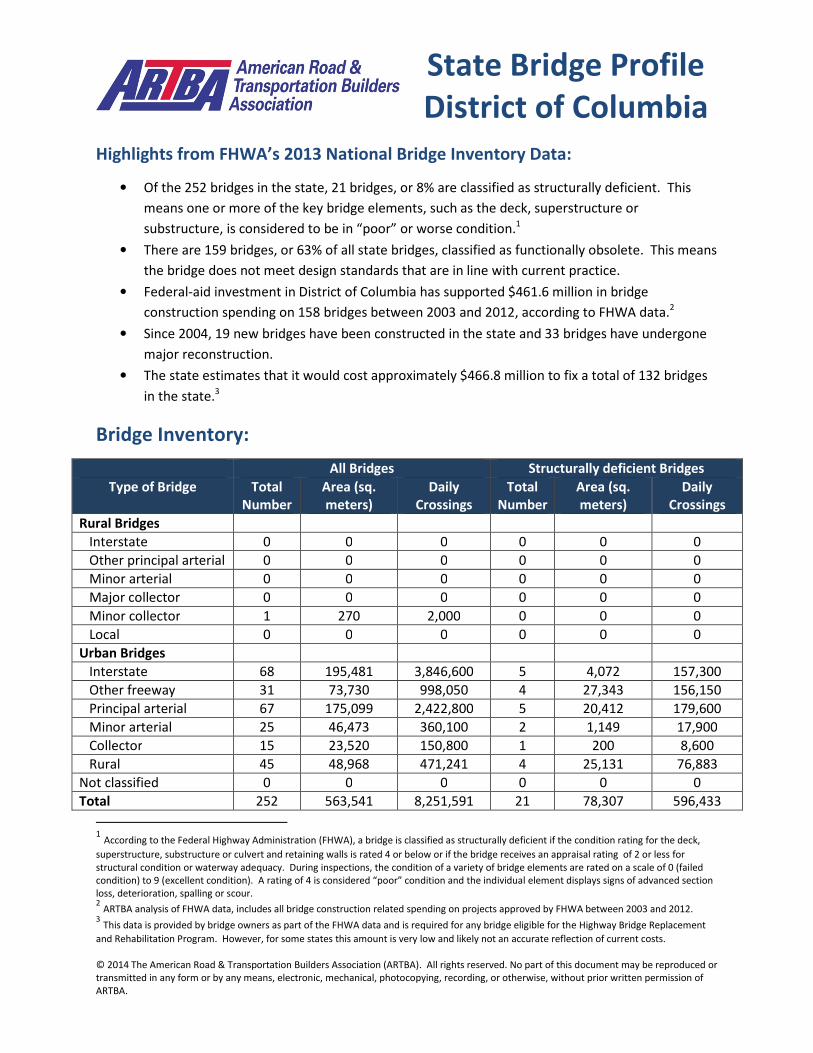


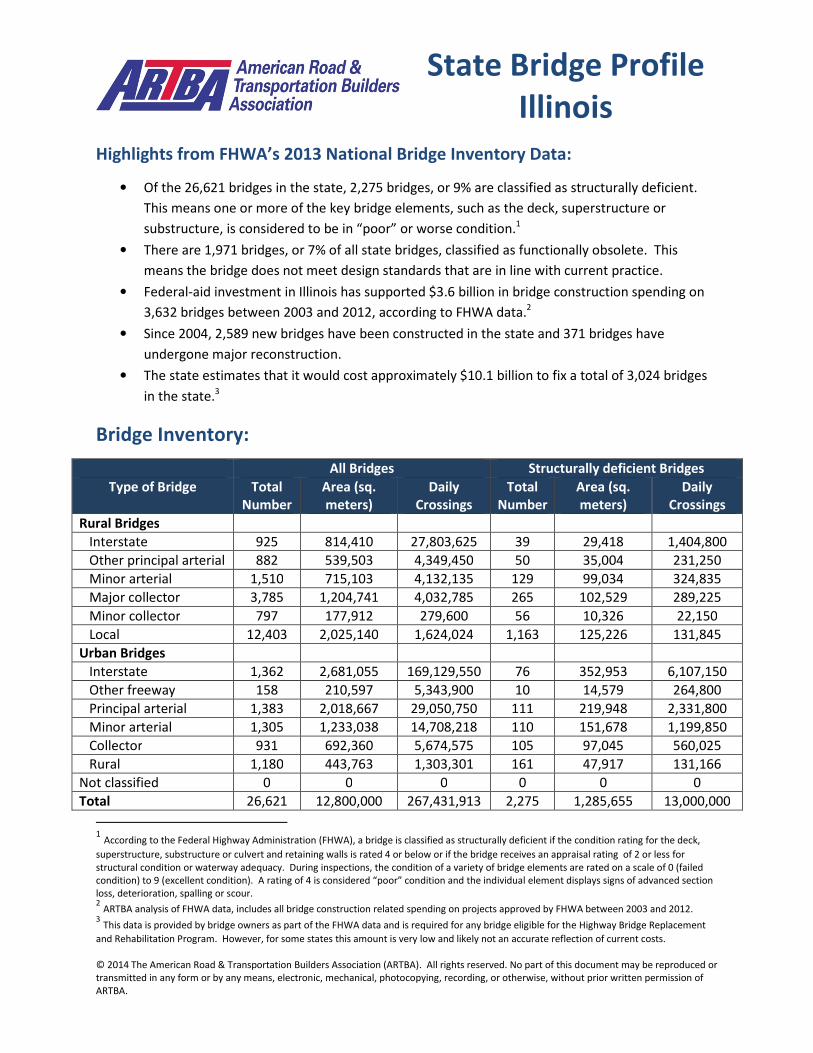


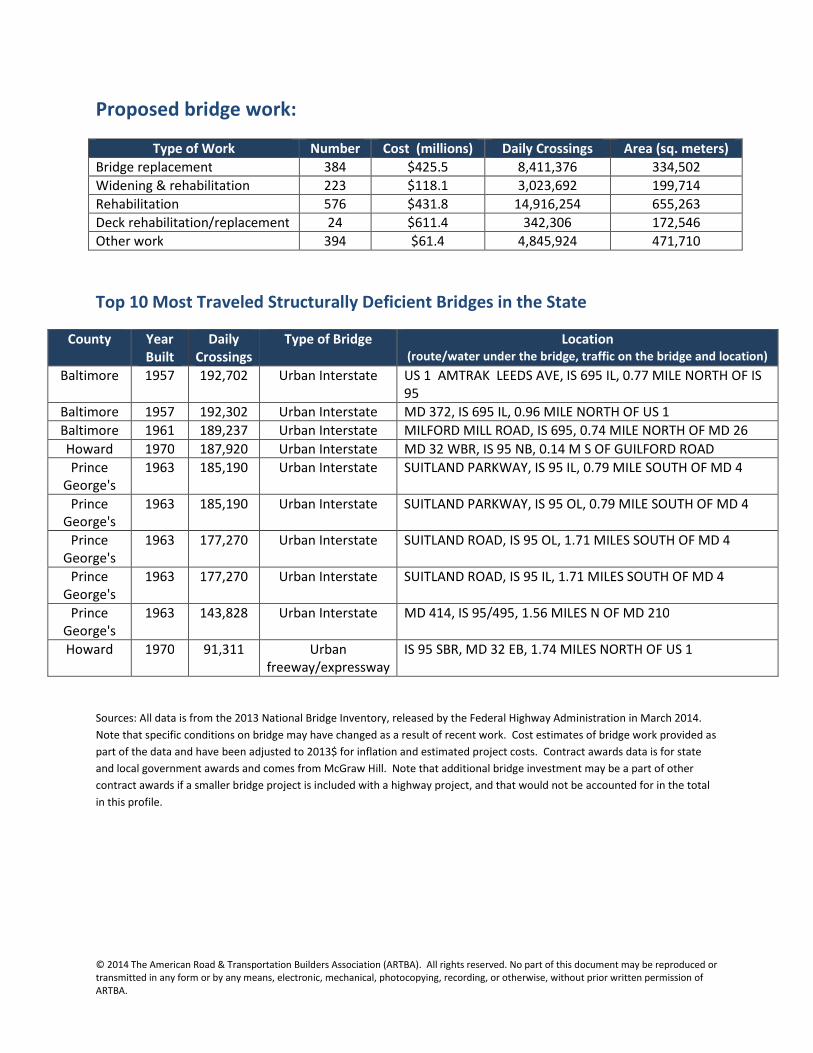


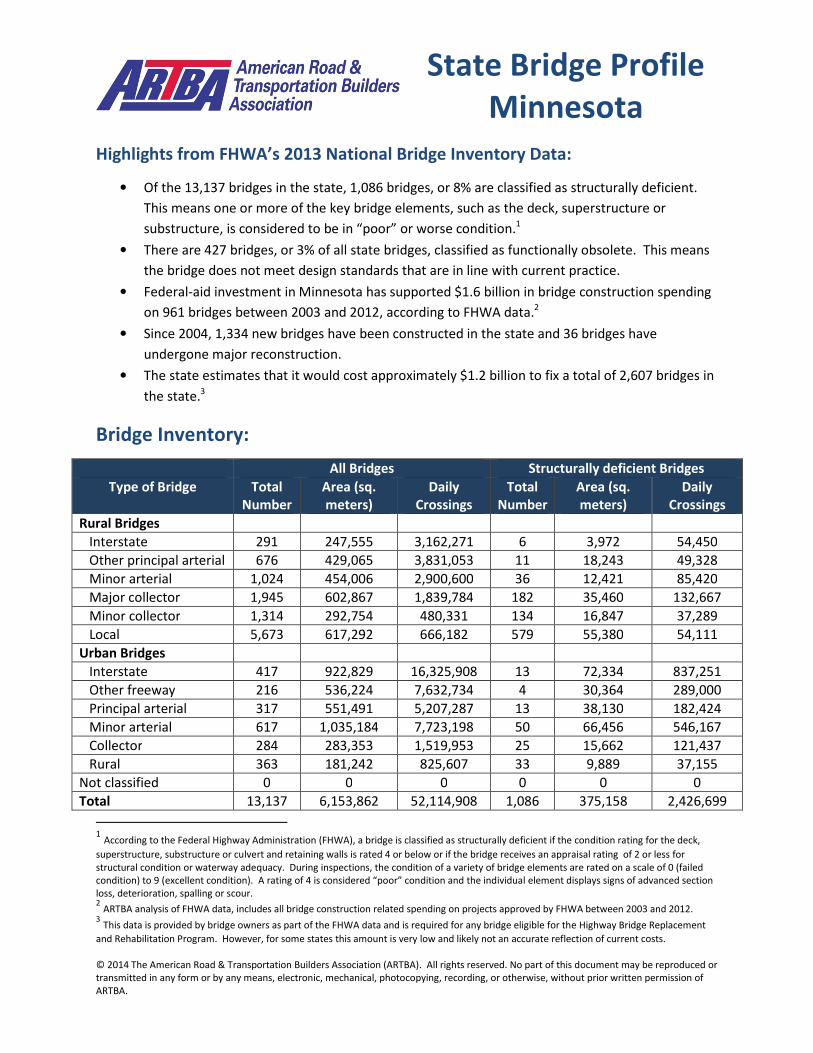


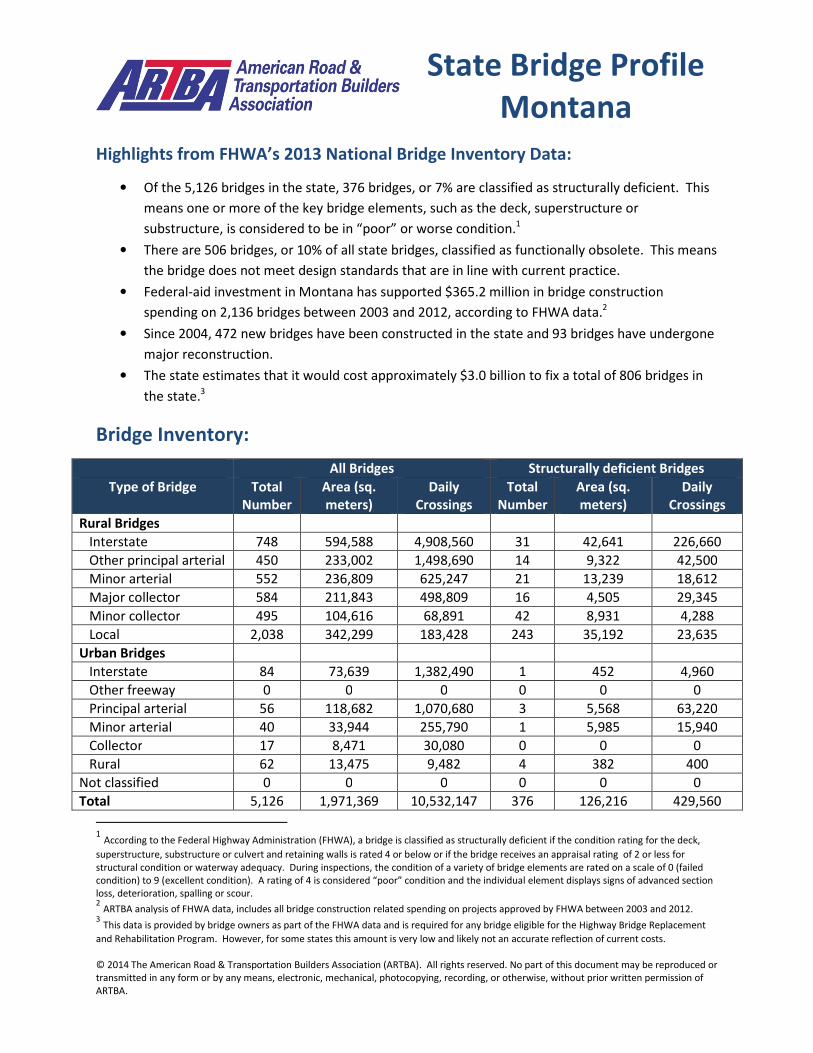
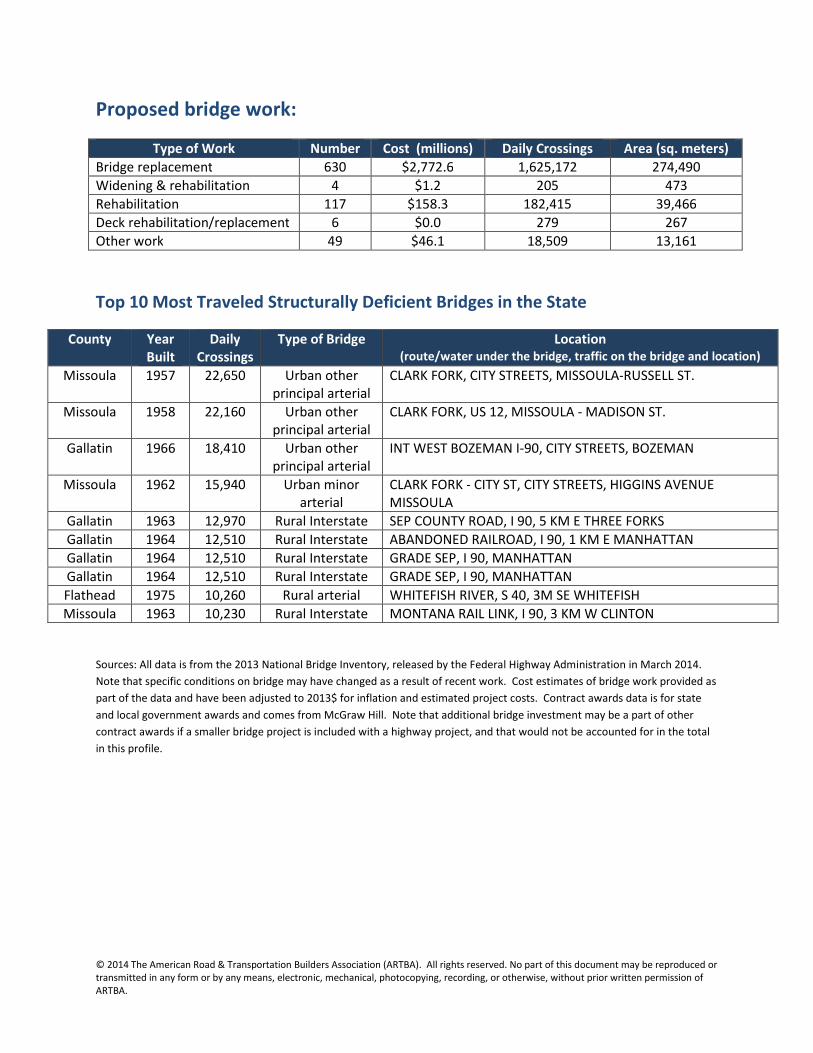


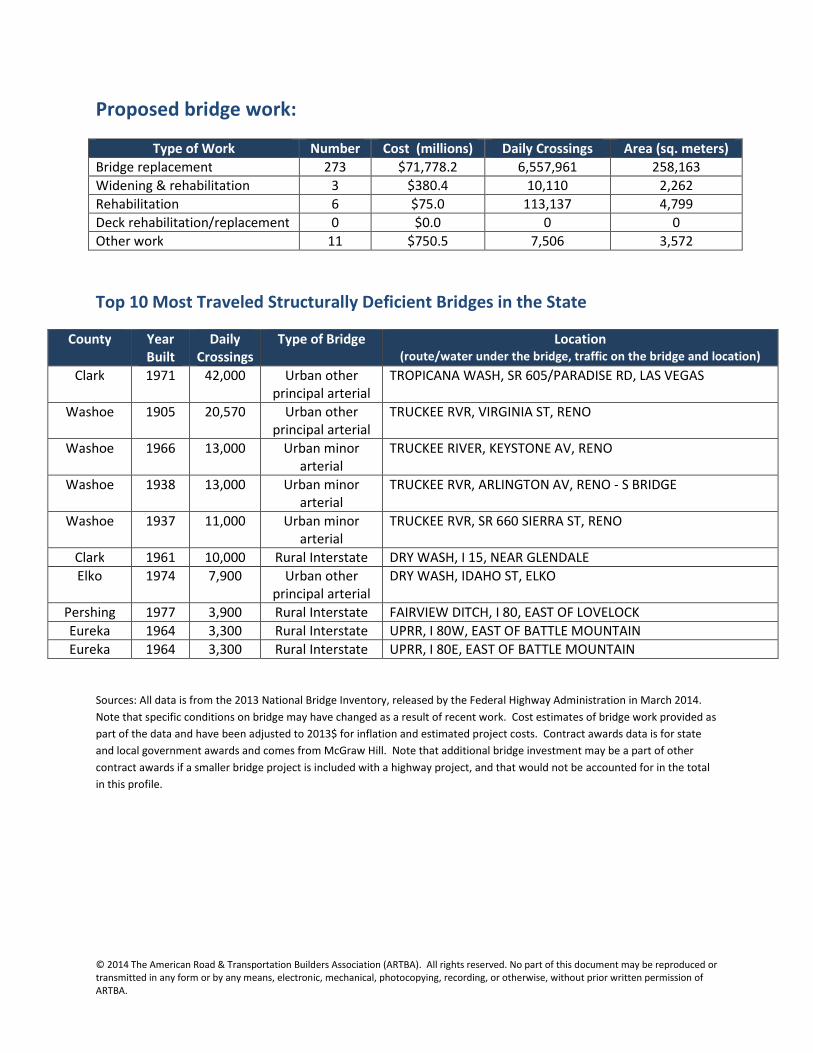


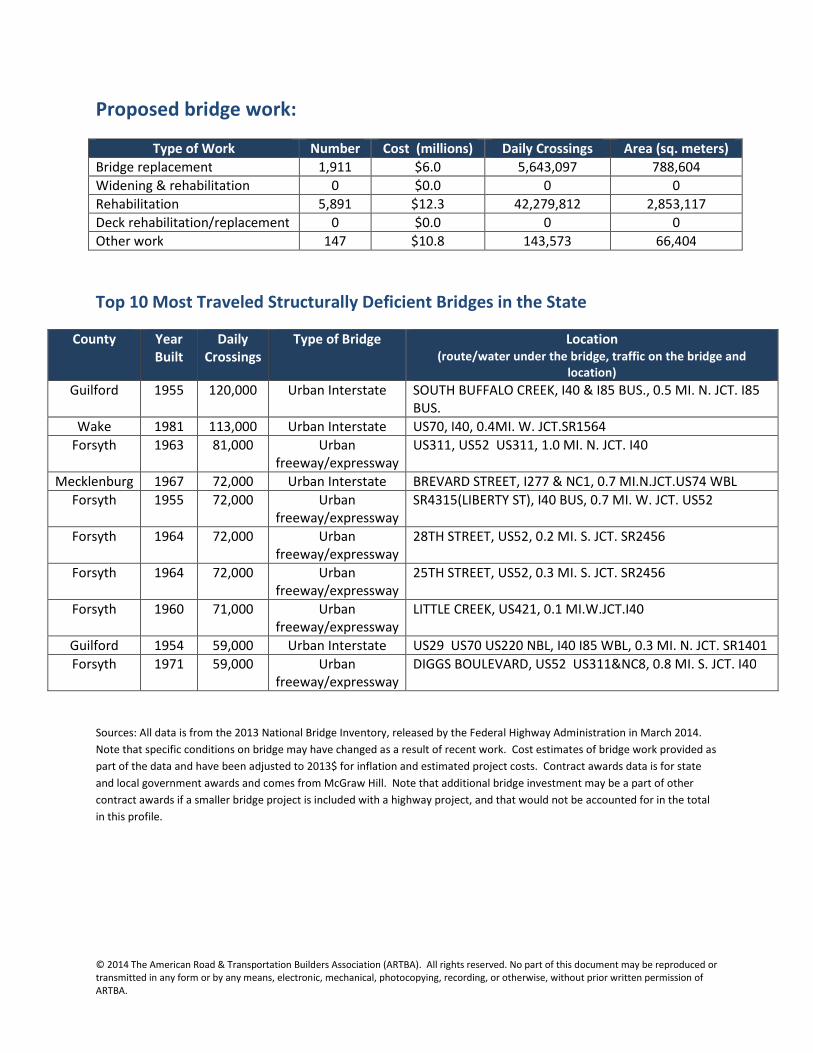


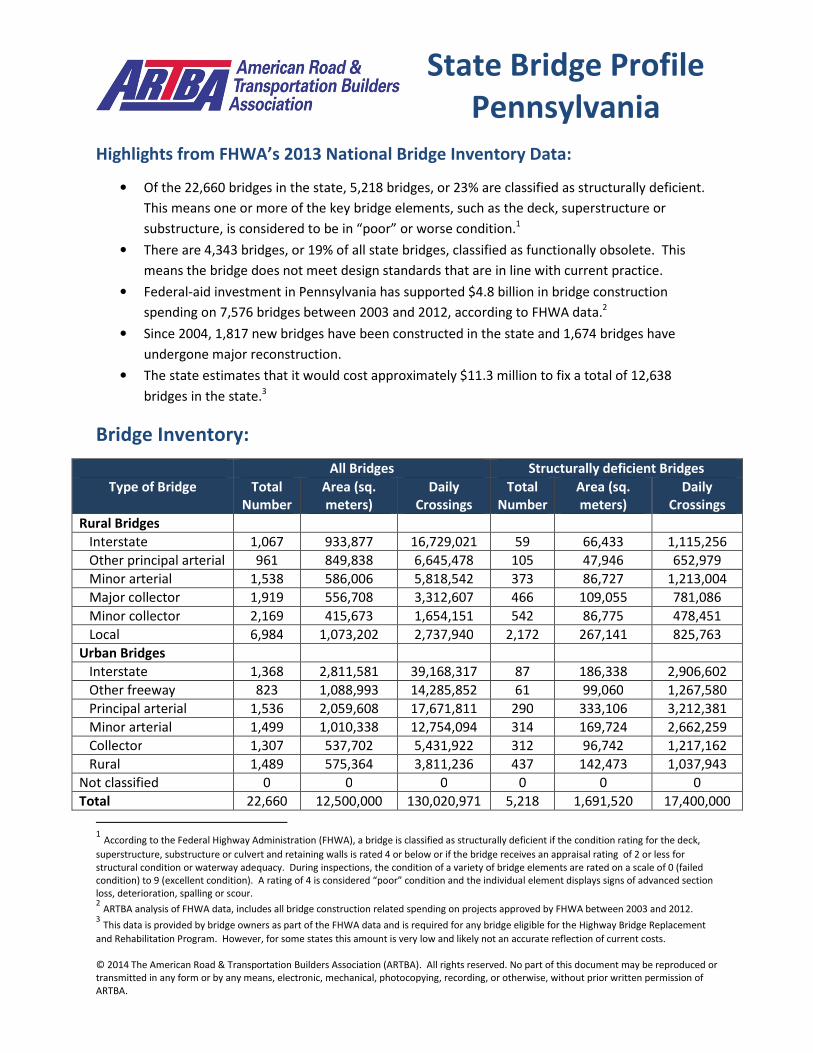


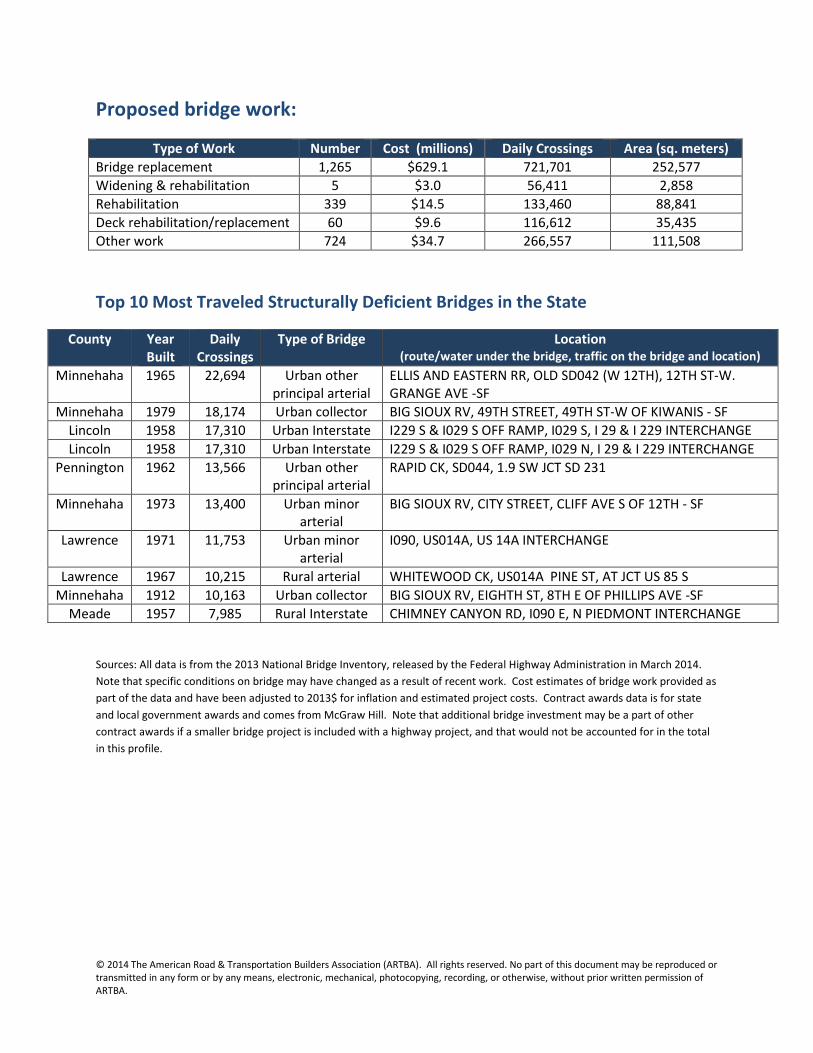


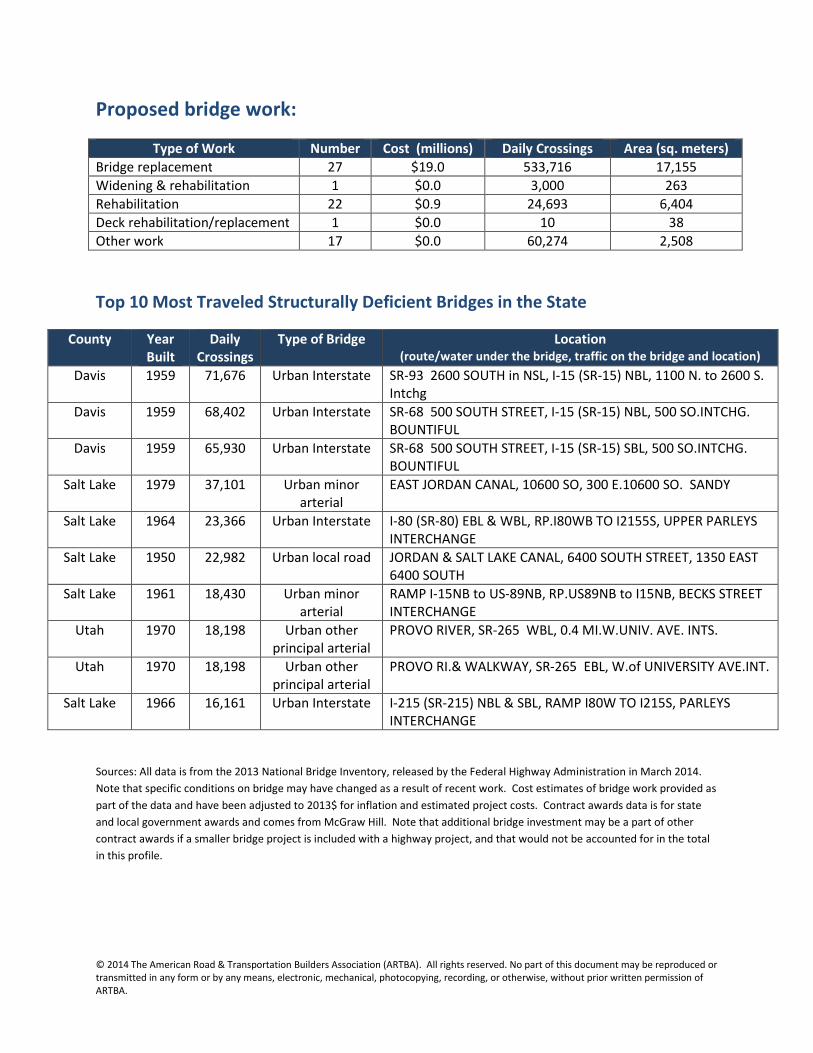
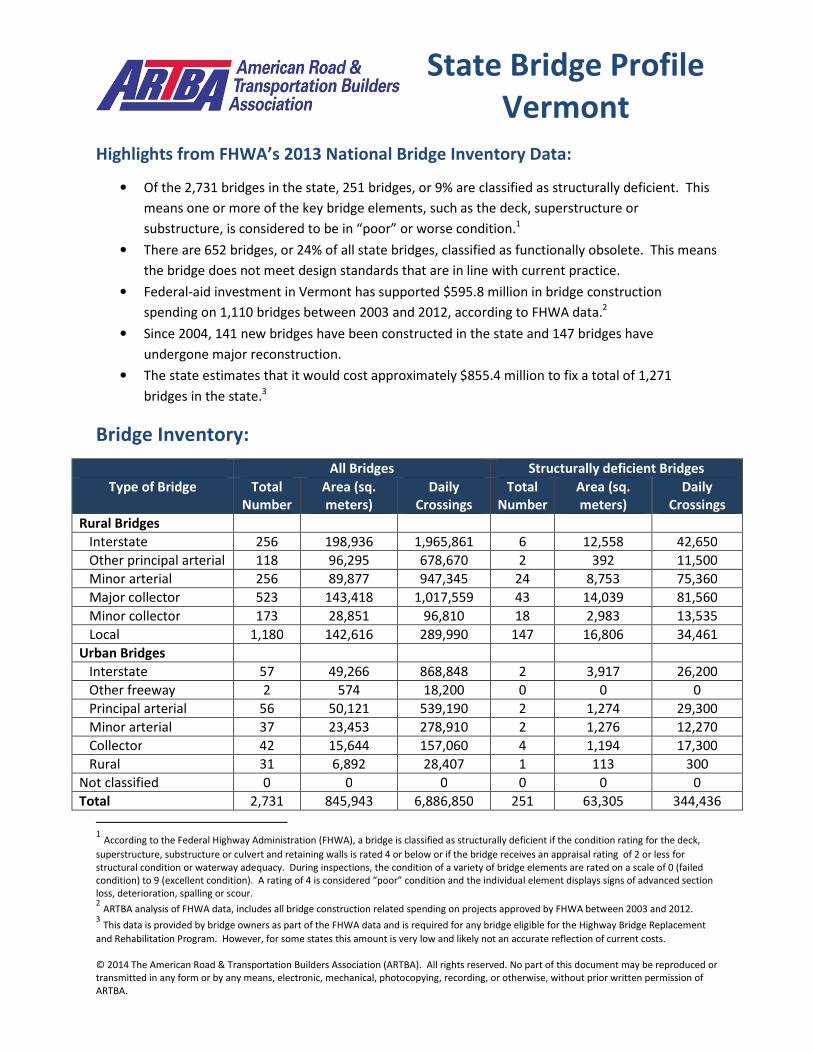

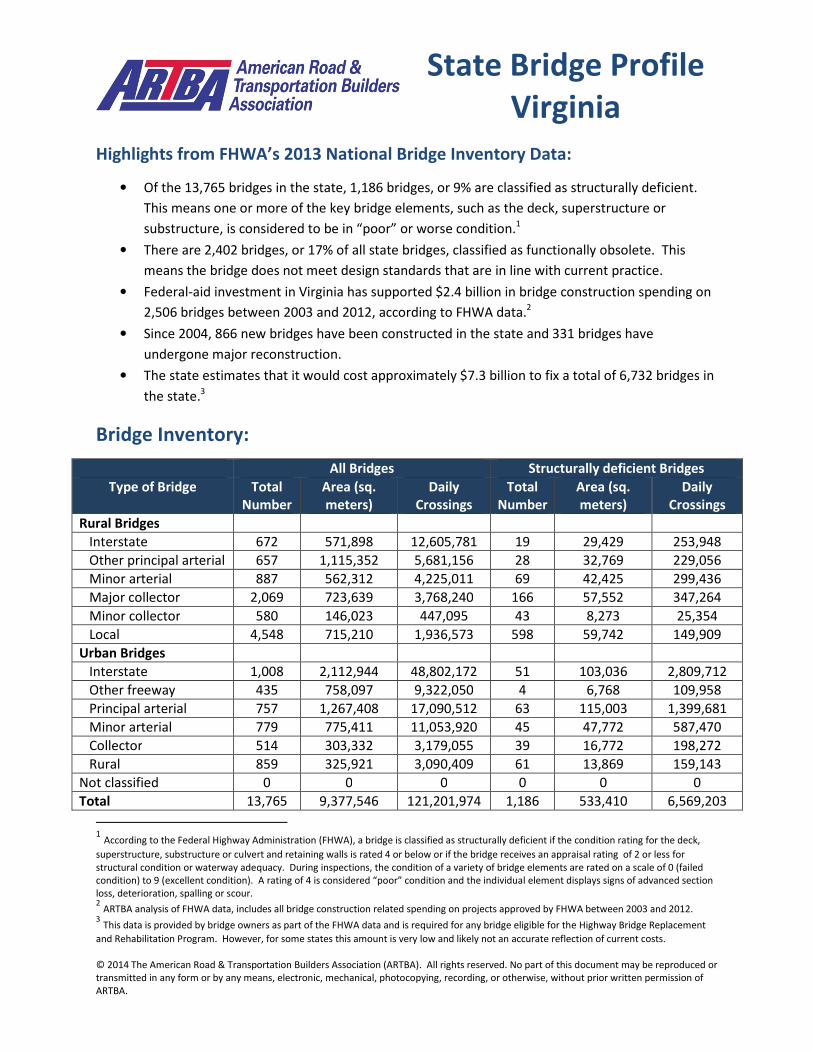

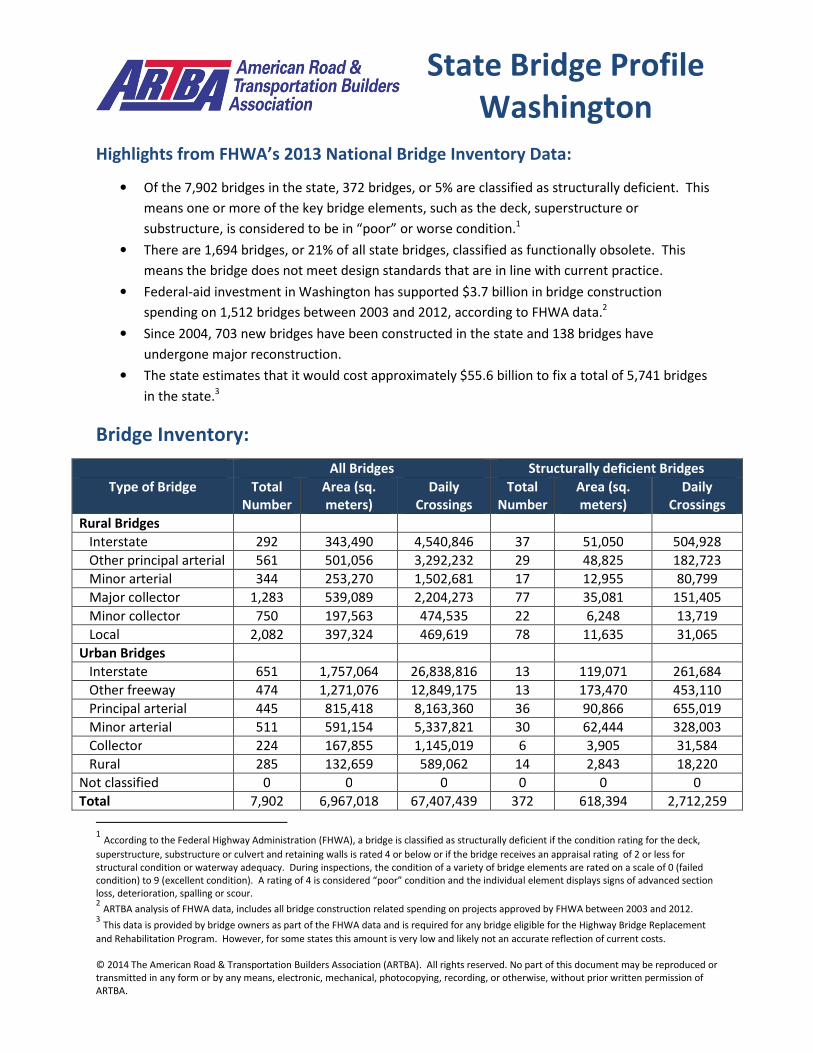


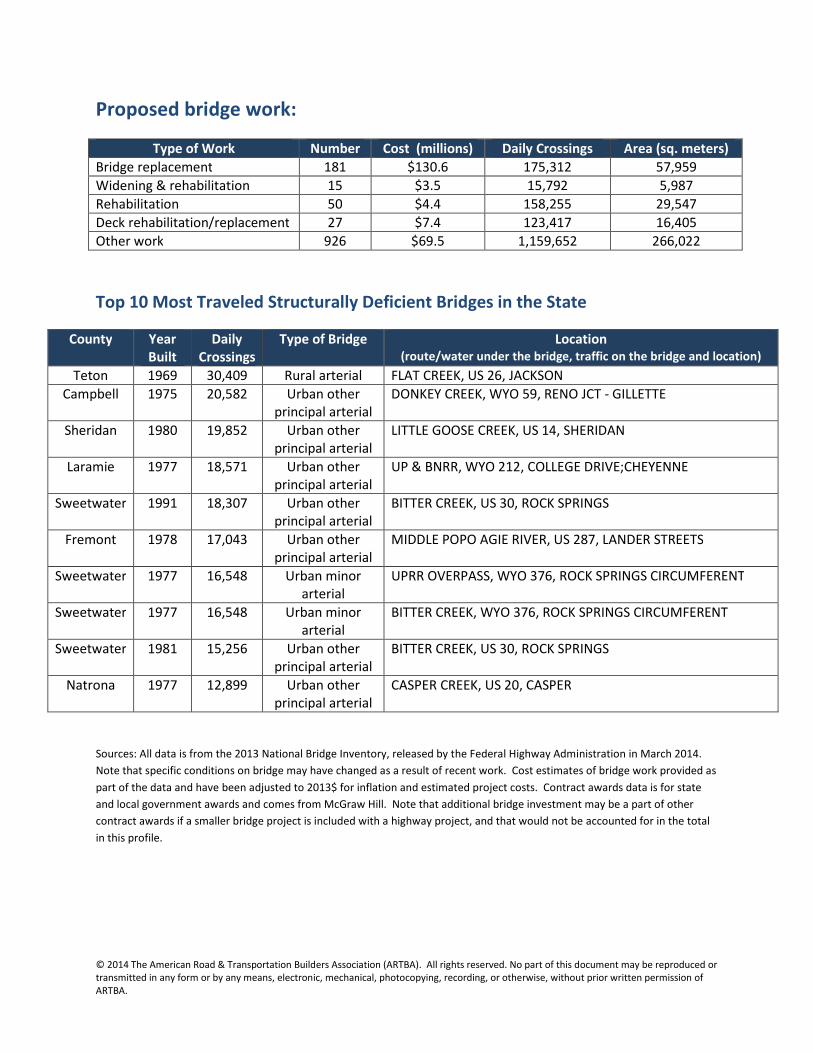


![[PPT]Building Bridges: Physics and the Arts - Weber State …physics.weber.edu/carroll/Bridges/aapt-wsu.ppt · Web viewBuilding Bridges: Physics and the Arts Brad Carroll WSU Outline](https://static.documents.pub/doc/80x56/5ae3a01e7f8b9a495c8d7887/pptbuilding-bridges-physics-and-the-arts-weber-state-viewbuilding-bridges.jpg)


