Article 12 National Summary Factsheet June 2020 Article 12 National Summary Factsheet – Luxembourg This factsheet provides statistics presenting the main results from the Member State Article 12 report from the reporting period 2013 – 2018 and, where relevant, a comparison with 2008 - 2012 data.
Transcript
Article 12 National Summary Factsheet June 2020
Article 12 National Summary Factsheet –
Luxembourg
This factsheet provides statistics presenting the main results from the Member State Article 12 report from the reporting period 2013 – 2018 and, where relevant, a comparison with 2008 - 2012 data.
Article 12 National Summary Factsheet October 2020
2
Contents
1 General information on Natura 2000 network ............................................................................................3
1.1 Natura 2000 network - number and area of SPAs ................................................................................3
1.2 Natura 2000 sites (SPAs) - Conservation measures and management plans .......................................3
1.3 Research and other work on bird populations .....................................................................................3
2 General information on bird species/populations reported .......................................................................4
2.1 Number of taxa/populations ................................................................................................................4
3 Breeding population and distribution trends ..............................................................................................5
3.1 Breeding population trends ..................................................................................................................5
3.2 Breeding distribution trends ................................................................................................................6
3.3 Breeding population trends for subsets of species/populations .........................................................7
3.4 Breeding distribution trends for subsets of species/populations ........................................................8
4 Information on winter population trends ................................................................................................ 10
4.1 Winter population trends for ‘key wintering species’ and other wintering Annex I and SPA trigger species . 10
4.2 Winter population trends for subsets of species/populations.......................................................... 11
5 Implementation of international species plans ........................................................................................ 13
5.1 Species with international species plans and with corresponding national plans adopted ............. 13
5.2 Effectiveness of Species Action Plans (SAPs) for globally threatened species .................................. 13
5.3 Effectiveness of Management Plans (MPs) for huntable species in non-Secure status ................... 13
6 Information on main pressures and threats ............................................................................................. 14
6.1 Frequency of main pressures and threats ......................................................................................... 14
6.2 Information on main pressures and threats ...................................................................................... 15
7 Natura 2000 coverage .............................................................................................................................. 16
7.1 Coverage of bird species by the Natura 2000 network ..................................................................... 16
7.2 Population trend within the Natura 2000 network in comparison to overall trends ....................... 16
1 Source of information ............................................................................................................................... 21
3 General Methodology ............................................................................................................................... 22
Article 12 National Summary Factsheet October 2020
3
1 General information on Natura 2000 network
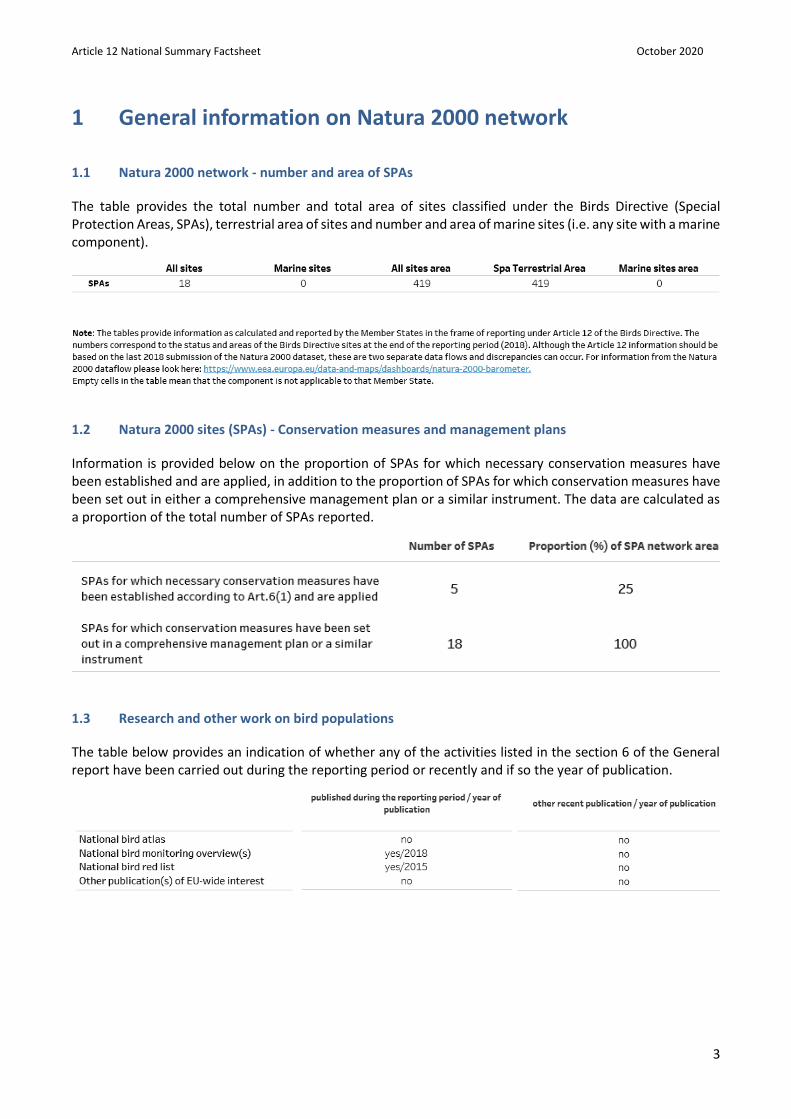
1.1 Natura 2000 network - number and area of SPAs
The table provides the total number and total area of sites classified under the Birds Directive (Special Protection Areas, SPAs), terrestrial area of sites and number and area of marine sites (i.e. any site with a marine component).
1.2 Natura 2000 sites (SPAs) - Conservation measures and management plans
Information is provided below on the proportion of SPAs for which necessary conservation measures have been established and are applied, in addition to the proportion of SPAs for which conservation measures have been set out in either a comprehensive management plan or a similar instrument. The data are calculated as a proportion of the total number of SPAs reported.
1.3 Research and other work on bird populations
The table below provides an indication of whether any of the activities listed in the section 6 of the General report have been carried out during the reporting period or recently and if so the year of publication.
Article 12 National Summary Factsheet October 2020
4
2 General information on bird species/populations reported
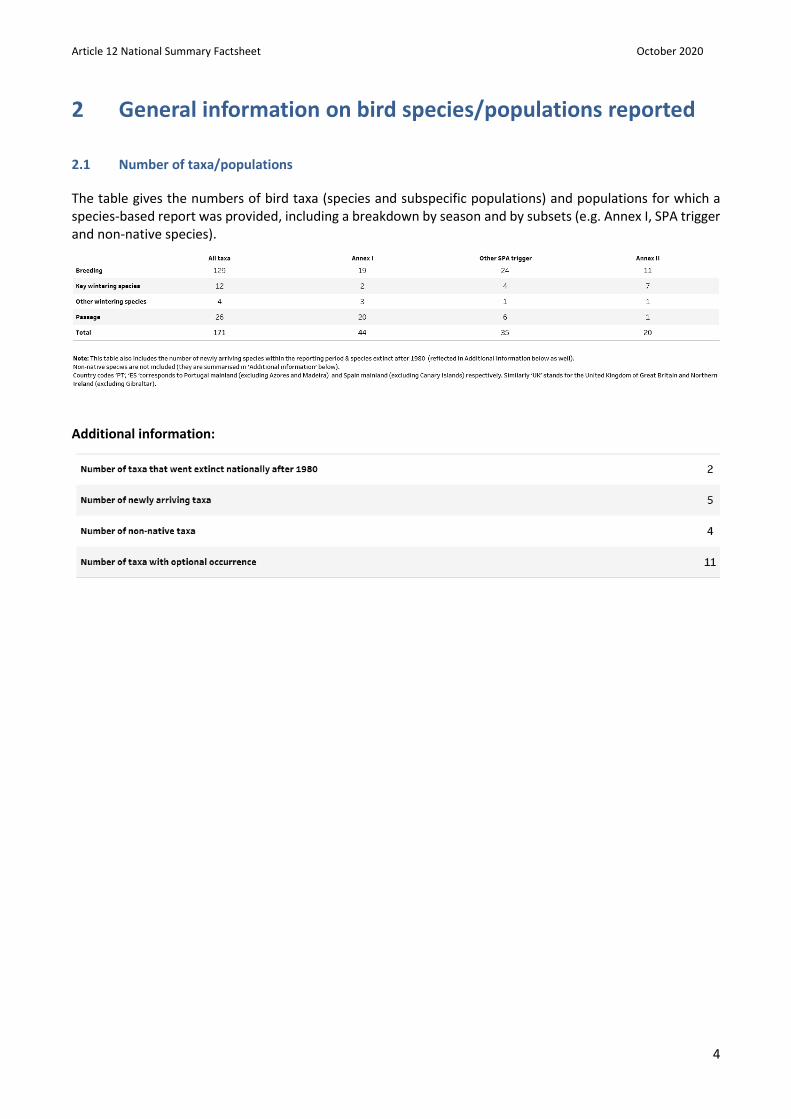
2.1 Number of taxa/populations
The table gives the numbers of bird taxa (species and subspecific populations) and populations for which a species-based report was provided, including a breakdown by season and by subsets (e.g. Annex I, SPA trigger and non-native species).
Additional information:
Article 12 National Summary Factsheet October 2020
5
3 Breeding population and distribution trends
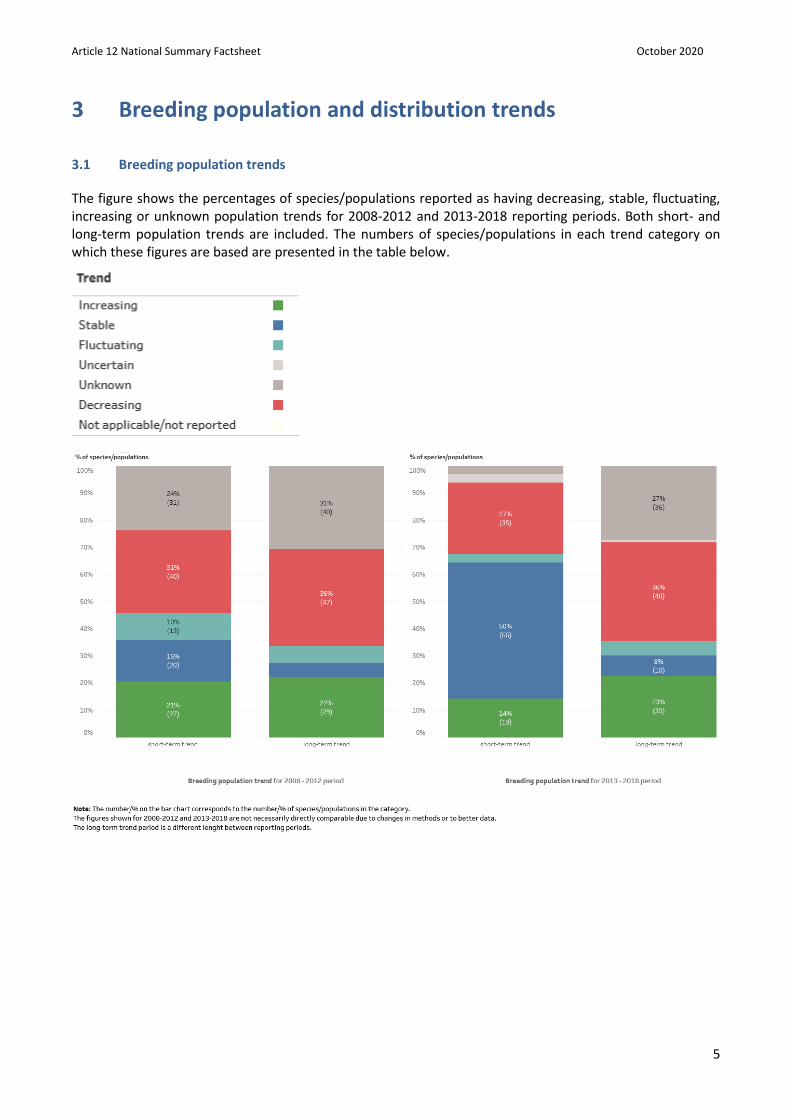
3.1 Breeding population trends
The figure shows the percentages of species/populations reported as having decreasing, stable, fluctuating, increasing or unknown population trends for 2008-2012 and 2013-2018 reporting periods. Both short- and long-term population trends are included. The numbers of species/populations in each trend category on which these figures are based are presented in the table below.
Article 12 National Summary Factsheet October 2020
6
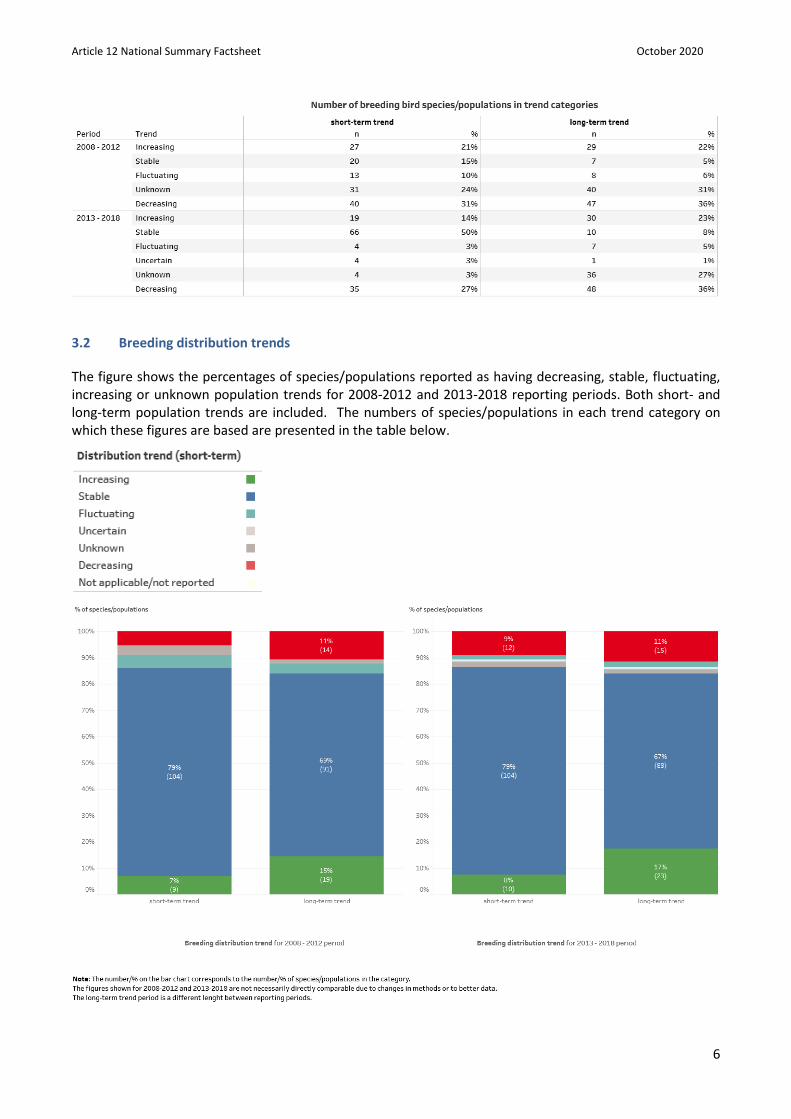
3.2 Breeding distribution trends
The figure shows the percentages of species/populations reported as having decreasing, stable, fluctuating, increasing or unknown population trends for 2008-2012 and 2013-2018 reporting periods. Both short- and long-term population trends are included. The numbers of species/populations in each trend category on which these figures are based are presented in the table below.
Article 12 National Summary Factsheet October 2020
7
3.3 Breeding population trends for subsets of species/populations
The figure shows the percentages of species/populations (all, Annex I, Annex II and non-Annex I or II) with decreasing, stable, fluctuating, increasing or unknown breeding population trend. The numbers of species/populations in each trend category on which these figures are based are presented in the table below.
Article 12 National Summary Factsheet October 2020
8
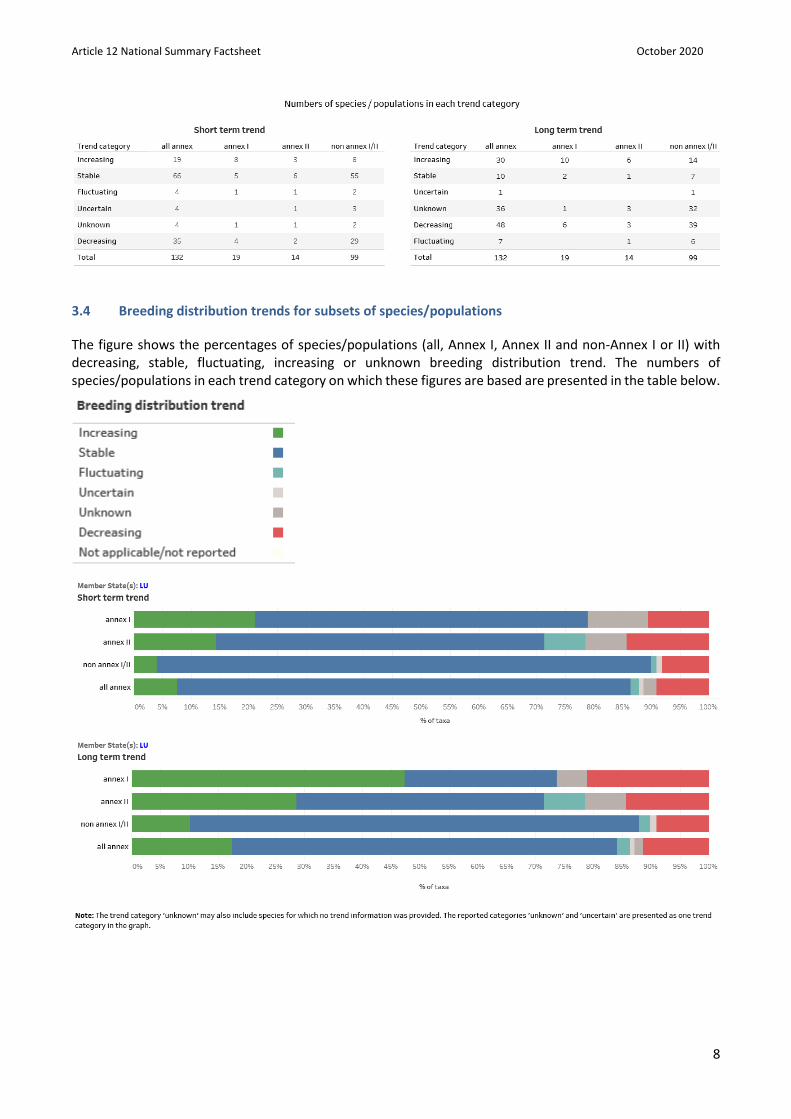
3.4 Breeding distribution trends for subsets of species/populations
The figure shows the percentages of species/populations (all, Annex I, Annex II and non-Annex I or II) with decreasing, stable, fluctuating, increasing or unknown breeding distribution trend. The numbers of species/populations in each trend category on which these figures are based are presented in the table below.
Article 12 National Summary Factsheet October 2020
9
Article 12 National Summary Factsheet October 2020
10
4 Information on winter population trends
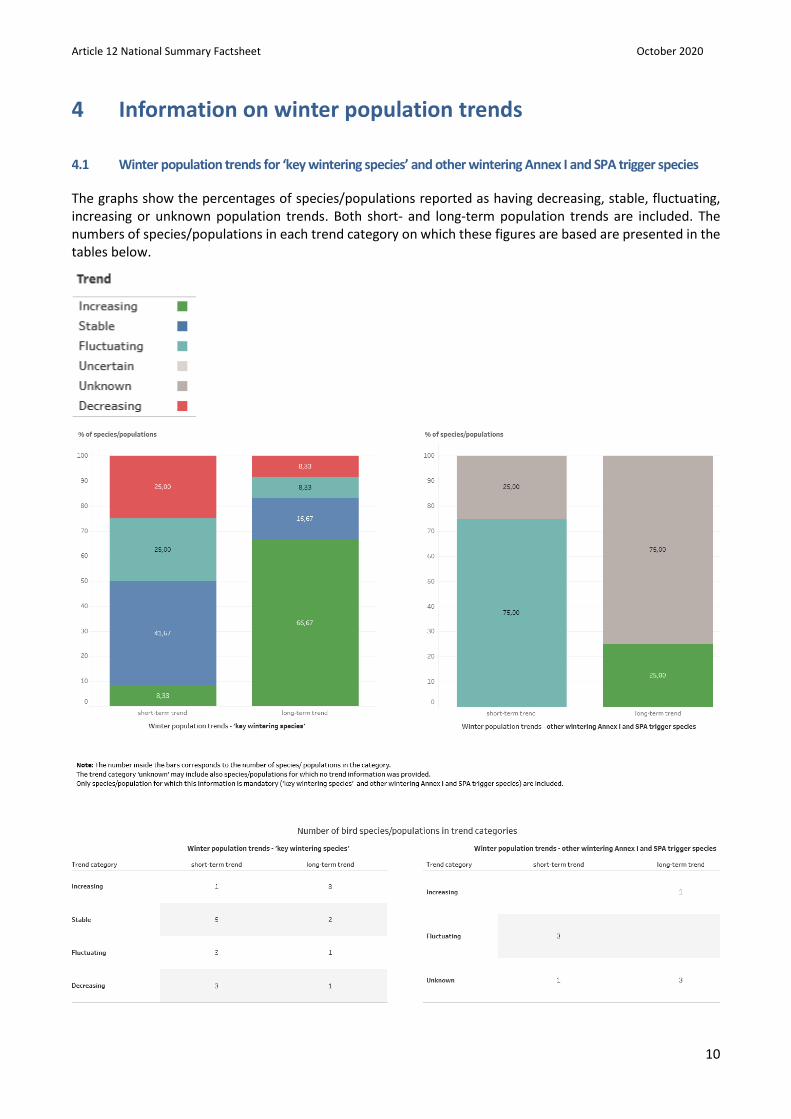
4.1 Winter population trends for ‘key wintering species’ and other wintering Annex I and SPA trigger species
The graphs show the percentages of species/populations reported as having decreasing, stable, fluctuating, increasing or unknown population trends. Both short- and long-term population trends are included. The numbers of species/populations in each trend category on which these figures are based are presented in the tables below.
Article 12 National Summary Factsheet October 2020
11
Treatment of ‘wintering species’ data:
‘Key wintering species’1
Species classified as ‘key wintering’ (see page 17 of the Article 12 guidelines https://circabc.europa.eu/d/a/workspace/SpacesStore/f308340d-afdc-405d-ad4f-431cde7ab876/Reporting%20guidelines%20Article%2012%20final%20May%202017.docx).
‘Other wintering Annex I and SPA trigger species’2
Other species that are reported for ‘winter’ season, Annex I species and species triggering the SPA classification excluding species that are also reported as ‘key wintering’ (as noted above).
Wintering species not covered by Annexes or only included in Annex II
Not included in the analysis above. This is a small group of bird species and not relevant to every Member State. These have been included in Section 2 ‘General information on bird species/populations reported’ (Additional information).
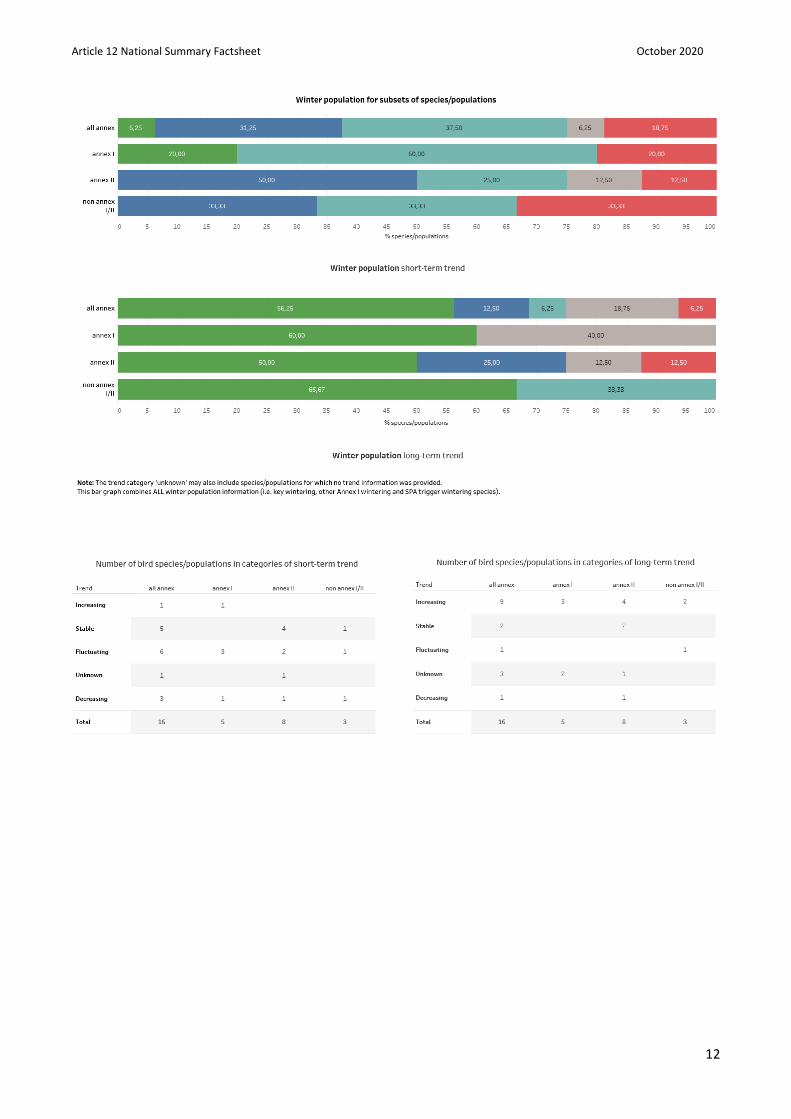
4.2 Winter population trends for subsets of species/populations
The graphs show the percentages of species/populations (all, Annex I, Annex II and non-Annex I or II) with decreasing, stable, fluctuating, increasing or unknown breeding distribution trend. The numbers of species/populations in each trend category on which these figures are based are presented in the tables below.
1 ‘Key wintering species’ as defined in the ‘Explanatory Notes and Guidelines’, covers migratory waterbirds and waders (shorebirds) – which are significantly more abundant in the EU during the winter and/or whose population size and trend are better monitored in winter. The list of ‘key wintering species’ for which a winter season report is expected is provided on the reference portal: http://biodiversity.eionet.europa.eu/activities/Reporting/Article_12/Reports_2019/Files_2019/wintering_birds.xls
2 In addition to ‘key wintering species’, the winter population size and trend data are also expected for any species listed on Annex I
of the Directive or listed as triggering SPA classifications in winter.
Article 12 National Summary Factsheet October 2020
12
Article 12 National Summary Factsheet October 2020
13
5 Implementation of international species plans
5.1 Species with international species plans and with corresponding national plans adopted
The table shows the number of species/populations with international plans (Species Action Plans (SAPs)), Management Plans (MPs) and Brief Management Statements (BMSs), and the number with national plans adopted.
5.2 Effectiveness of Species Action Plans (SAPs) for globally threatened species
The table shows the percentage and numbers of species/populations with Species Action Plans (SAPs) and Brief Management Statements (BMSs) for which the national status is moving towards the plan's aim/objective(s), remains unchanged or is further deteriorating away from the plan’s aim/objective(s).
5.3 Effectiveness of Management Plans (MPs) for huntable species in non-Secure status
The table shows the percentage and numbers of species/populations with Management Plans (MPs) for which the national status is improving, remains unchanged or is further deteriorating.
Article 12 National Summary Factsheet October 2020
14
6 Information on main pressures and threats
6.1 Frequency of main pressures and threats
The figures below show the percentage of the species/populations reported as being affected by one or more pressures/threats (high only) under the pressure categories A-N (Annex I species only). This information illustrates the relative importance of pressures (currently acting) and threats (expected in near future).
Note: Please see online dashboards for other annex information (link is provided in Appendix below).
Article 12 National Summary Factsheet October 2020
15
6.2 Information on main pressures and threats
How pressure & threat data are treated:
The bar charts show the frequency of reported pressures/threats (high & medium) under the pressure categories A-N. This information illustrates the relative importance of pressures (currently acting) and threats (expected in near future).
1. The pressures/threats reported are aggregated into broad pressures categories (e.g. ‘A – Agriculture’) and the frequency is calculated based on this aggregated data.
2. The frequency is based on numbers of reports (species/populations per season) under each broad pressure category, therefore species are not aggregated based on their species code or name and are treated as populations based on season (different pressures can be reported under different season for the same species).
3. The % frequency is calculated using a base number defined by the filter used in the dashboard (i.e. Member State, Annex, location reported, type). Changing these filters will change the base number of pressures or threats and therefore the % frequency. The base number is always a total number of aggregated pressures (as described in the step 1) within a selection corresponding to the filter(s) applied. The numbers used behind the % frequency in the bar chart can be observed in the table below it.
Article 12 National Summary Factsheet October 2020
16
7 Natura 2000 coverage
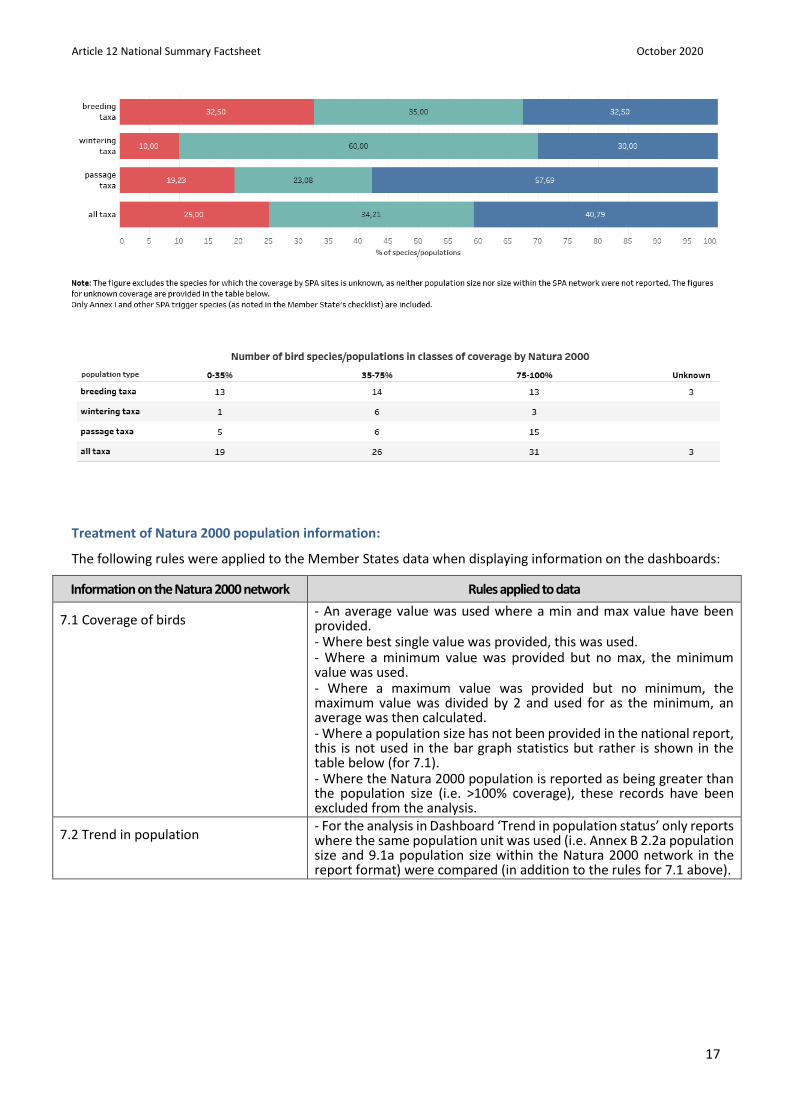
7.1 Coverage of bird species by the Natura 2000 network
The figures show the percentage of species/populations for breeding, wintering and passage seasons in three classes based on their coverage by Natura 2000 sites. The numbers of species/populations in three classes of coverage by Natura 2000 sites on which these figures are based are presented in the table below the figures.
7.2 Population trend within the Natura 2000 network in comparison to overall trends
The figures show the percentage of breeding and wintering species/populations with increasing, stable, unknown and decreasing population trend per classes based on coverage by Natura 2000 sites. The figures compare trends within the Natura 2000 network with overall trends in these coverage classes. The numbers of species/populations on which these figures are based are presented in the table below the figures.
Article 12 National Summary Factsheet October 2020
17
Treatment of Natura 2000 population information:
The following rules were applied to the Member States data when displaying information on the dashboards:
Information on the Natura 2000 network Rules applied to data
7.1 Coverage of birds - An average value was used where a min and max value have been provided. - Where best single value was provided, this was used. - Where a minimum value was provided but no max, the minimum value was used. - Where a maximum value was provided but no minimum, the maximum value was divided by 2 and used for as the minimum, an average was then calculated. - Where a population size has not been provided in the national report, this is not used in the bar graph statistics but rather is shown in the table below (for 7.1). - Where the Natura 2000 population is reported as being greater than the population size (i.e. >100% coverage), these records have been excluded from the analysis.
7.2 Trend in population - For the analysis in Dashboard ‘Trend in population status’ only reports where the same population unit was used (i.e. Annex B 2.2a population size and 9.1a population size within the Natura 2000 network in the report format) were compared (in addition to the rules for 7.1 above).
Article 12 National Summary Factsheet October 2020
18
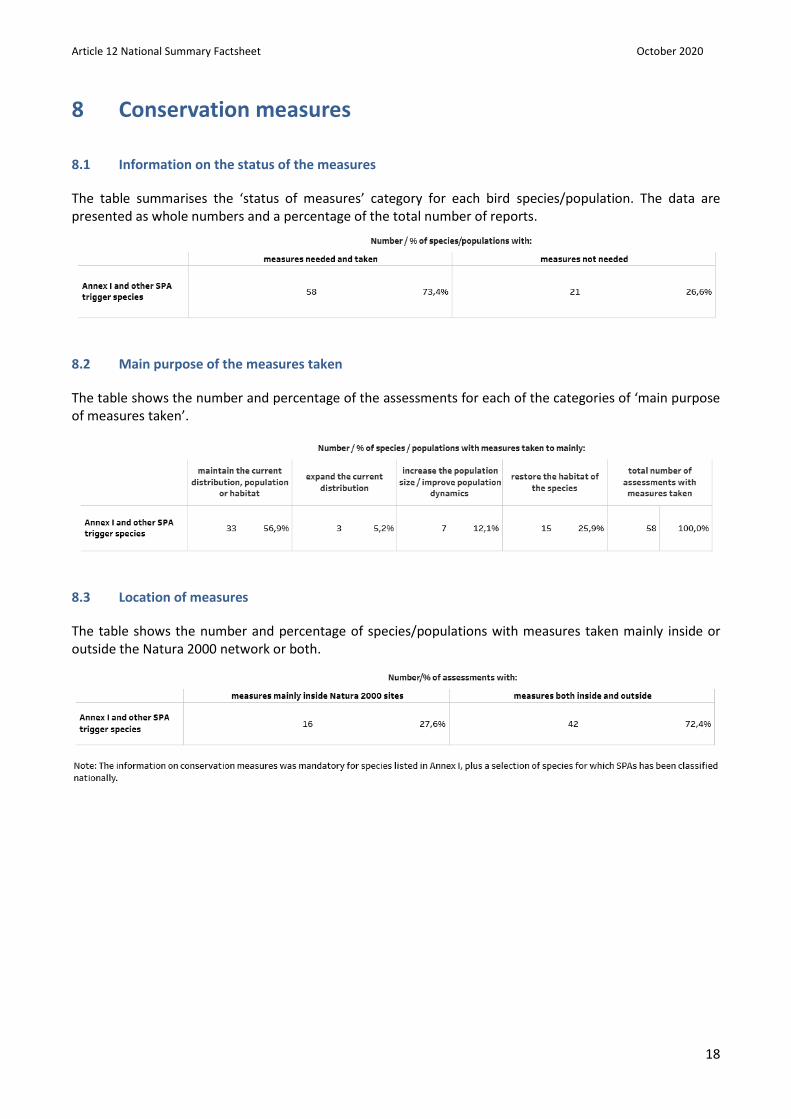
8 Conservation measures
8.1 Information on the status of the measures
The table summarises the ‘status of measures’ category for each bird species/population. The data are presented as whole numbers and a percentage of the total number of reports.
8.2 Main purpose of the measures taken
The table shows the number and percentage of the assessments for each of the categories of ‘main purpose of measures taken’.
8.3 Location of measures
The table shows the number and percentage of species/populations with measures taken mainly inside or outside the Natura 2000 network or both.
Article 12 National Summary Factsheet October 2020
19
8.4 Main conservation measures
The table shows the number and percentage of the species/populations with measures taken per measure category.
How conservation measures data are treated
Information on conservation measures was only mandatory for Annex I bird species and a selection of species for which SPAs have been classified nationally.
The values for ‘main purpose of the measures taken’ and ‘location of the measures’ only include bird species for which ‘status of the measures’ indicates that all necessary measures have been taken (‘measures needed and taken’).
List of conservation measures taken
The data were treated as follows:
1. The conservation measures reported are aggregated into broad categories (e.g. ‘CA- measures related to agricultural activities).
2. The frequency is based on numbers of reports (species/populations per season) under each broad measure category, therefore species are not aggregated based on their species code or name and are treated as populations based on season (different measures can be reported under different season for the same species).
3. The % frequency is calculated based on the total number of aggregated measures (as described in the step 1).
Article 12 National Summary Factsheet October 2020
20
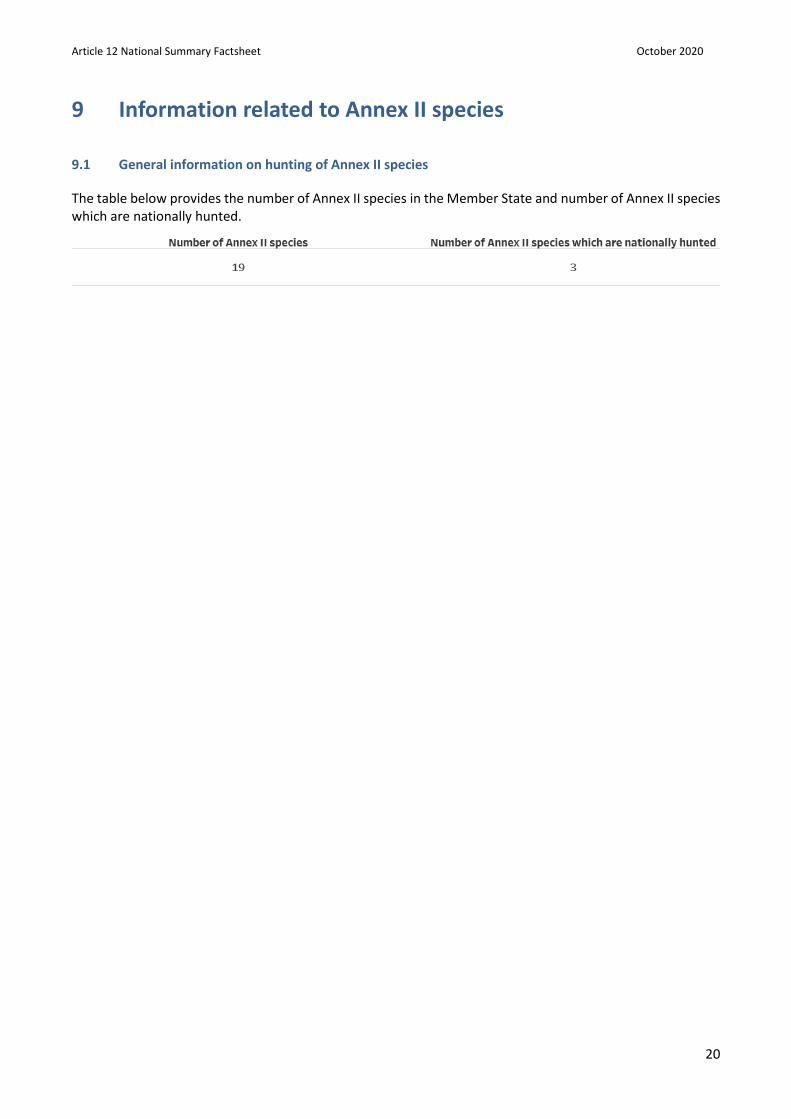
9 Information related to Annex II species
9.1 General information on hunting of Annex II species
The table below provides the number of Annex II species in the Member State and number of Annex II species which are nationally hunted.
Article 12 National Summary Factsheet October 2020
21
10 Data quality and completeness
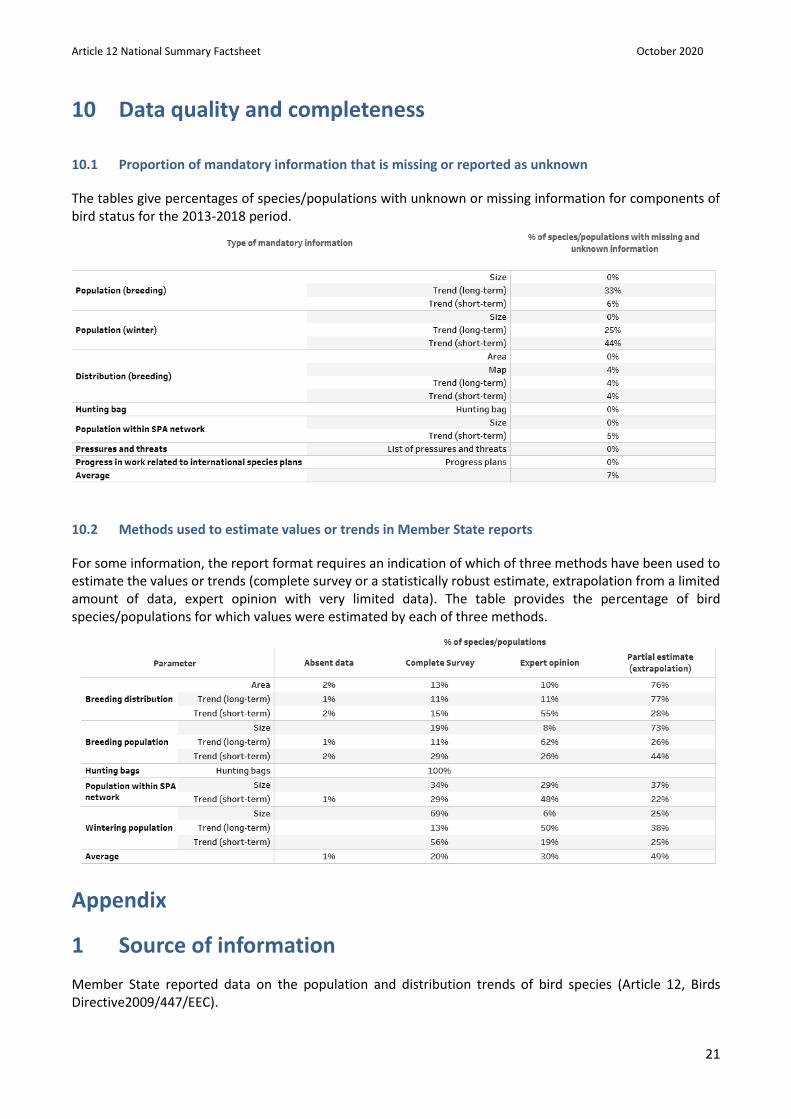
10.1 Proportion of mandatory information that is missing or reported as unknown
The tables give percentages of species/populations with unknown or missing information for components of bird status for the 2013-2018 period.
10.2 Methods used to estimate values or trends in Member State reports
For some information, the report format requires an indication of which of three methods have been used to estimate the values or trends (complete survey or a statistically robust estimate, extrapolation from a limited amount of data, expert opinion with very limited data). The table provides the percentage of bird species/populations for which values were estimated by each of three methods.
Appendix
1 Source of information
Member State reported data on the population and distribution trends of bird species (Article 12, Birds Directive2009/447/EEC).
Article 12 National Summary Factsheet October 2020
22
Member State reported data can be accessed here: http://cdr.eionet.europa.eu/ReportekEngine/searchdataflow?dataflow_uris=http%3A%2F%2Frod.eionet.europa.eu%2Fobligations%2F278&years%3Aint%3Aignore_empty=&partofyear=&reportingdate_start%3Adate%3Aignore_empty=2019%2F01%2F04&reportingdate_end%3Adate%3Aignore_empty=&country=&release_status=anystatus&sort_on=reportingdate&sort_order=reverse&batch_size=
2 Online dashboards
The online dashboards can be accessed here: https://www.eea.europa.eu/themes/biodiversity/state-of-nature-in-the-eu/article-12-national-summary-dashboards.
3 General Methodology
General methods for Article 12 National Summaries
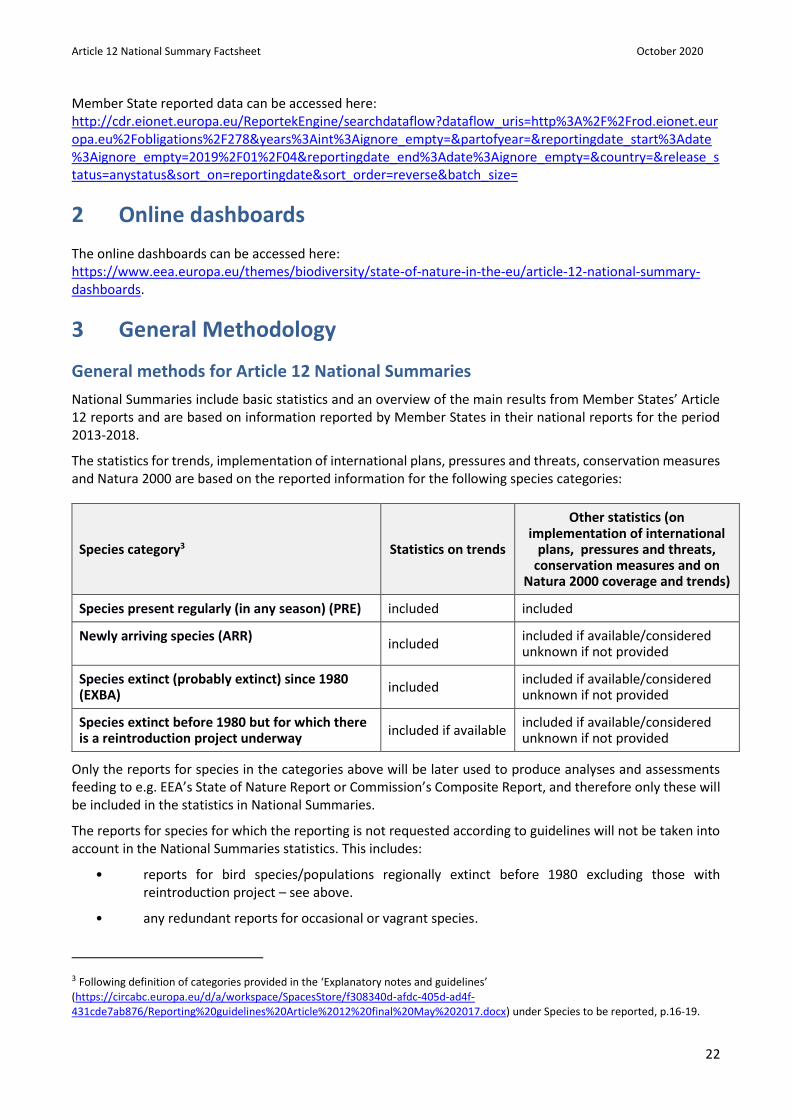
National Summaries include basic statistics and an overview of the main results from Member States’ Article 12 reports and are based on information reported by Member States in their national reports for the period 2013-2018.
The statistics for trends, implementation of international plans, pressures and threats, conservation measures and Natura 2000 are based on the reported information for the following species categories:
Species category3 Statistics on trends
Other statistics (on implementation of international
plans, pressures and threats, conservation measures and on
Natura 2000 coverage and trends)
Species present regularly (in any season) (PRE) included included
Newly arriving species (ARR) included
included if available/considered unknown if not provided
Species extinct (probably extinct) since 1980 (EXBA)
included included if available/considered unknown if not provided
Species extinct before 1980 but for which there is a reintroduction project underway
included if available included if available/considered unknown if not provided
Only the reports for species in the categories above will be later used to produce analyses and assessments feeding to e.g. EEA’s State of Nature Report or Commission’s Composite Report, and therefore only these will be included in the statistics in National Summaries.
The reports for species for which the reporting is not requested according to guidelines will not be taken into account in the National Summaries statistics. This includes:
• reports for bird species/populations regionally extinct before 1980 excluding those with reintroduction project – see above.
• any redundant reports for occasional or vagrant species.
3 Following definition of categories provided in the ‘Explanatory notes and guidelines’ (https://circabc.europa.eu/d/a/workspace/SpacesStore/f308340d-afdc-405d-ad4f-431cde7ab876/Reporting%20guidelines%20Article%2012%20final%20May%202017.docx) under Species to be reported, p.16-19.
Article 12 National Summary Factsheet October 2020
23
• reports for non-native bird species/populations (with an exception of three species included in Annex II of the Birds Directive).
• any other redundant reports e.g. provided for wintering bird species/populations for which the winter season report is not expected according to the guidelines.
According to the guidelines, certain sections of the bird species format should be provided only for some ‘groups’ of bird species/populations (e.g. winter population trends are expected for ‘key wintering species’, for Annex I wintering species and for other migratory wintering species triggering SPA classification). The statistics in the National Summaries only use the information from those reports for which a particular information is relevant (mandatory or recommended according to the guidelines) (e.g. potentially reported winter population trends for Annex II species, which are not SPA trigger or listed among ‘key wintering’ species are not taken into account).
Note on records included in the analysis
The dashboard on ‘General information on the bird species/populations reported’ represents all bird species reported by the Member States, regardless of Annex, non-Annex, native status or season. In this dashboard, the non-native species are separated from all other species reported. The intention of this dashboard is to give a broad overview of all species reported by the Member State.
From dashboards representing ’Breeding population and distribution trends’ onwards, only selected species are used for the analyses. An example of this is section 3 where only breeding bird species are shown.
Note on non-native species
In general, non-native species are not used in the dashboards representing ’Breeding population and distribution trends’ onwards. The only exceptions to this are the 4 non-native species listed in the Annex II, see below: