Page 1
Artic le Atmospheric Science
Aerosol oxalate and its implication to haze pollution in Shanghai,China
Yilun Jiang • Guoshun Zhuang • Qiongzhen Wang • Tingna Liu •
Kan Huang • Joshua S. Fu • Juan Li • Yanfen Lin • Rong Zhang •
Congrui Deng
Received: 17 March 2013 / Accepted: 29 August 2013 / Published online: 31 December 2013
� Science China Press and Springer-Verlag Berlin Heidelberg 2013
Abstract A total of 238 samples of PM2.5 and TSP were
analyzed to study the characteristics, sources, and forma-
tion pathways of aerosol oxalate in Shanghai in four sea-
sons of 2007. The concentrations of oxalate were
0.07–0.41 lg/m3 in PM2.5 and 0.10–0.48 lg/m3 in TSP,
respectively. Oxalate displayed a seasonal variation of
autumn [ summer [ winter [ spring in both PM2.5 and
TSP and was dominantly present in PM2.5 in all samples.
Correlation between oxalate and K? and high ratio of
oxalate/K? suggested that biomass burning was a second-
ary source of aerosol oxalate in Shanghai, in addition to
urban VOCs sources (vehicular and industrial emissions),
especially in autumn. Secondary formation accounted for
the majority of aerosol oxalate in Shanghai, which was
supported by the high correlation of oxalate with nss-
SO42-, K? and NO3
-, proceeding from different mecha-
nisms. Relatively high ambient RH together with high
cloud cover was found benefiting the secondary formation
of aerosol oxalate. The in-cloud process (aqueous-phase
oxidation) was proposed to be likely the major formation
pathway of aerosol oxalate in Shanghai, which was sup-
ported by the high correlation of oxalate with nss-SO42-
and K?, dominant residence of oxalate in droplet mode and
result of favorable meteorological condition analysis. High
correlation of oxalate and NO3- reflected the OH radical
involved oxidation chemistry of the two species in the
atmosphere and also suggested that gas-particle surface
reactions and the evaporation–condensation process were
both possible secondary formation pathways of aerosol
oxalate in coarser particle mode ([1.0 lm). As a major
water-soluble organic compound in aerosols, concentration
of oxalate showed a distinct negative correlation to the
atmospheric visibility, which implied that aerosol organic
compounds could play an important role in haze pollution
as well as in air quality in Shanghai.
Keywords Aerosol oxalate � Source apportionment �Formation pathway � Haze pollution � Visibility �Organic aerosol
1 Introduction
Oxalic acid, with oxalate, has attracted a great deal of
attention as the most abundant dicarboxylic acid in the
tropospheric aerosols [1–3]. As a major identified water-
soluble organic compound in aerosol, oxalate could affect
hygroscopic properties of aerosol particles [4, 5]. It can act
as cloud condensation nuclei (CCN) or reduce the surface
tension of particles to form CCN [6–8]; the refractive index
of aerosol particles can be influenced by the presence of
oxalate and further their radiative-forcing estimates. Oxa-
late may also play a role in solubility, photochemistry, and
bioavailability of transition metals in aerosols [9].
The sources and formation pathways of aerosol oxalate
are still under investigation. Oxalate can be emitted
directly from fossil fuel combustion, biomass burning, and
biogenic activity. However, many studies suggested the
existence of a global secondary source in addition to the
primary sources of the compound [10, 11]. A large fraction
Y. Jiang � G. Zhuang (&) � Q. Wang � T. Liu � K. Huang �J. Li � Y. Lin � R. Zhang � C. Deng
Center for Atmospheric Chemistry Study, Department of
Environmental Science and Engineering, Fudan University,
Shanghai 200433, China
e-mail: [email protected]
K. Huang � J. S. Fu
Department of Civil and Environmental Engineering,
The University of Tennessee, Knoxville, TN 37996, USA
123
Chin. Sci. Bull. (2014) 59(2):227–238 csb.scichina.com
DOI 10.1007/s11434-013-0009-4 www.springer.com/scp
Page 2
of aerosol oxalate is considered to be produced from rad-
ical involved chemical/photochemical oxidation of volatile
organic compounds (VOCs) like ethene, toluene, isoprene,
etc. [12, 13]. Based on some observations, the maximum
oxalate concentrations appeared in the droplet mode at
0.54–1.0 lm with MMAD (mass median aerodynamic
diameters) at 1.0 lm [14]. In-cloud process and oxidation
of gaseous precursors followed by condensation are the two
major suggested secondary formation pathways of aerosol
oxalate in the fine particle mode [15–18]. A close tracking
of oxalate and sulfate in the atmosphere has been observed
in some studies, which suggested a similar dominant for-
mation pathway of the two chemically distinct species [19,
20]. Martinelango et al. [21] discovered parallel formation
pathways of oxalate and nitrate in a coastal atmosphere.
Shanghai (31�130N, 121�280E) is located in the western
coast of the North Pacific Ocean, east front of the Yangtze
River Delta, China. It is one of the largest, urbanized and
motorized cities in China with a population of
*19,000,000. Shanghai has the marine monsoon subtrop-
ical climate with an annual average precipitation of
*1,100 mm (http://cdc.cma.gov.cn). Under the influence
of the monsoon system, 1 year in Shanghai is usually
divided into the hiemal half-year from November to April
with prevailing northwestly continental wind and the esti-
val half-year from May to October with prevailing south-
eastly wind from the North Pacific Ocean [22]. For the past
decade the air quality has been terribly degraded due to the
rapid motorization, and the heavy haze has been the fre-
quent weather pattern in Shanghai. Organic acids, includ-
ing oxalic acid, with the organic aerosol have been
considered as one of major components of haze. In this
paper we report the concentration levels, seasonal variation
and relative distribution of aerosol oxalate in PM2.5 and
TSP, as well as the possible sources and formation path-
ways of aerosol oxalate. The relationships between oxalate,
meteorological factors, and the regional haze pollution are
also discussed. This is the first time the sources and the
formation pathway of aerosol oxalate in Shanghai, the
eastern Asian megacity, were systematically investigated.
The role of organic aerosol in urban atmospheric haze
pollution was explored through this water-soluble organic
acid in aerosols.
2 Experimental
2.1 Sampling
Aerosol samples of PM2.5 and TSP were collected in four
seasons in 2007 in Shanghai. The sampling site was on the
roof (*15 m) of a building at Fudan University, located in
the urban area of Shanghai. Samples were collected on
Whatman� 41 polycarbonate filters (Whatman Inc.,
Maidstone, UK, diameter: 90 mm) by a medium-volume
sampler (Model: (TSP/PM10/PM2.5)-2, flow rate:
76.67 L min-1). Sampling was carried out approximately
in 24-h intervals. The sampling periods were chosen to
represent different seasons: (1) March 20–April 20, 2007:
spring; (2) July 23–August 19, 2007: summer; (3)
November 1–November 29, 2007: autumn; and (4)
December 24, 2007–January 26, 2008: winter. Polycar-
bonate filters were put in the sampler at the sampling site
for 24 h (without pumping) and used as the blanks. Four
blanks were collected in every season. Samples were
placed in polyethylene plastic bags with artificial parch-
ment lining bags right after sampling and reserved in a
refrigerator (–18 �C). All of those filters were weighed
before and after sampling with an analytical balance
(Sartorius 2004 MP, reading precision 10 lg) after stabi-
lizing under constant temperature (20 ± 1 �C) and
humidity (40 % ± 2 %). A total of 238 aerosol samples
were collected and used in this study. All the procedures
were strictly quality-controlled to avoid any possible con-
tamination of the samples.
Black carbon (BC) measurement was conducted before
a series of chemical analysis. The concentration of BC in
the aerosol samples was measured by a smoke stain
reflectometer (model 43D, Diffusion Systems Ltd., Lon-
don, UK). Five spots on each complete sample filter were
selected randomly and evenly as possible for the mea-
surement of BC contents which were calculated from
comparing the reflectance of the sample filter with that of a
clean filter [23].
2.2 Ion analysis and pH measurement
One-fourth of each aerosol sample filter and blank filter
was extracted ultrasonically by 10 mL water, which was
deionized to the resistivity of 18 MX cm-1. After passing
through the microporous membranes (mixed cellulose,
pore size, 0.45 lm; diameter, 25 mm), each filtrate was
stored at 4 �C in a clean tube for analysis. The concen-
trations of ten anions (F-, CH3COO-, HCOO-, MSA, Cl-,
NO2-, NO3
-, SO42-, C2O4
2-, PO43-) and five cations
(Na?, NH4?, K?, Mg2?, Ca2?) in the aqueous extracts
were determined by ion chromatography (IC, Dionex 3000,
USA). The gradient base eluent (76.2 mmol/L NaOH ?
H2O) was used for anion detection, while the weak acid
eluent (20 mmol/L MSA) for cation detection. The oxalate
concentrations of the blanks were below detection limit or
under 0.02 lg/m3 and had been deducted from the obser-
vation values. The recovery of ions was in the range of
80 %–120 % by adding standard reference material of each
ion component to the filtrates for ion chromatography
analysis. Reproducibility test showed that relative standard
228 Chin. Sci. Bull. (2014) 59(2):227–238
123
Page 3
deviation was less than 5 % by calculating from the results
of ion chromatography detections of one sample at differ-
ent times (under same analytical condition). The quality
assurance was routinely carried out by using Standard
Reference Materials produced by National Research Center
for Certified Reference Materials, China. A pH meter
(model: LIDA PHS-2C) combined with a glass electrode
was used for pH measurement of the filtrates for ion
chromatography analysis. The pH meter was calibrated
before measurement using standard buffer solutions with
pH values of 4.00 and 6.86. Detailed procedures were
given elsewhere [24].
2.3 Element analysis
Half of the sample and blank filter was digested at 170 �C
for 4 h in high-pressure Teflon digestion vessel with 3 mL
concentrated HNO3, 1 mL concentrated HCl, and 1 mL
concentrated HF. After cooling, the solutions were dried,
then by adding 0.1 mL concentrated HNO3 to them, they
were diluted to 10 mL with MilliQ water (resistivity of
18 MX cm-1). A total of 19 elements (Al, Fe, Mn, Mg, Ti,
Sc, Na, Sr, Ca, Co, Cr, Ni, Cu, Pb, Zn, Cd, V, S, and As)
were determined by inductively coupled plasma atomic
emission spectroscopy (ICP-AES, Model: ULTIMA, JO-
BIN–YVON Company, France). The detailed analytical
procedures were given elsewhere [25, 26]. Al was used as
the reference element of crustal source in this study.
2.4 Meteorological Conditions and Sampling Artifact
Meteorological data, including temperature, relative
humidity (RH), cloud cover, wind speed, visibility, and
atmospheric pressure were downloaded from http://www.
arl.noaa.gov and http://www.wunderground.com. The daily
average concentrations of ambient gaseous SO2 and NO2 in
Shanghai were obtained from http://www.semc.gov.cn.
The extent of the sampling artifact strongly depended
on the volatility of the compounds, the aerosol acidity, the
ambient temperature, and relative humidity [27, 28]. The
vapor pressure of oxalate is \20 mmHg at 20 �C which
reflects a low volatility of this compound. Low ambient
temperature, low aerosol acidity and high relative
humidity would make oxalate in the atmosphere more
associated with particles. The aerosols in Shanghai are
known to be acidic due to the high concentration of SO2
and NOx [29]. Results of our measurement also showed
that the pH of aerosol filtrates in Shanghai averaged at
3.96–5.41 (Table 1). However, the temperature of the
ambient atmosphere in Shanghai was moderate except in
summer and the average RH was above 65 % throughout
the year. Consequently, the oxalate detected in the aerosol
samples are expected to be able to represent the charac-
teristics of the majority of the atmospheric oxalate and its
measurement in this work is considered not affected by
sorption or desorption artifacts under the local condition
of Shanghai.
3 Results and discussion
3.1 Characteristics of aerosol oxalate in Shanghai
3.1.1 Concentration level, seasonal variation, and relative
distribution of oxalate in PM2.5 and TSP
Average concentrations of oxalate in Shanghai in both
PM2.5 and TSP are presented in Table 2. For comparison,
oxalate mass concentrations of some other sites over the
world are also listed in Table 2.
The oxalate concentrations in Shanghai in 2007 sam-
pling year were 0.07–0.41 lg/m3 in PM2.5 and 0.10–0.48
lg/m3 in TSP, respectively. The oxalate concentrations in
PM2.5 were a little lower than the value measured in
1999–2000 by Yao et al. [30]. Table 2 shows that the
concentrations of oxalate in Shanghai were lower than
those in Beijing and Hong Kong, but comparable to those
in Nanjing, Tokyo, Chiba, Tampa Bay, and LA. The higher
levels of oxalate in Beijing may be explained by its heavy
traffic emissions and winter heating system, while the high
relative humidity and thick cloud cover may be responsible
for the high values in Hong Kong.
Table 1 Average aerosol pH values, ambient relative humidity, temperature, SO2, and NO2 concentrations in the four sampling seasons in
Shanghai
pH Relative humidity (%) Temperature (�C) SO2 (mg/m3) NO2 (mg/m3)
PM2.5 TSP
Spring 3.96 (2.92–4.57) 4.35 (3.61–5.97) 66.0 (50–87) 15.5 (8–22) 0.070 (0.026–0.173) 0.060 (0.022–0.091)
Summer 5.25 (3.77–6.04) 6.22 (5.91–6.33) 71.4 (60–80) 30.8 (28–34) 0.056 (0.020–0.119) 0.042 (0.013–0.096)
Autumn 5.41 (4.00–5.99) 6.41 (6.16–6.65) 65.6 (53–83) 13.7 (8–18) 0.051 (0.022–0.096) 0.058 (0.023–0.103)
Winter 5.25 (3.81–6.06) 5.44 (4.24–6.33) 70.6 (44–90) 5.5 (0–12) 0.075 (0.011–0.203) 0.59 (0.014–0.130)
The ranges of all parameters in the brackets were based on daily average values
Chin. Sci. Bull. (2014) 59(2):227–238 229
123
Page 4
The seasonal variation of oxalate concentrations in
PM2.5 and TSP samples collected in 2007 is shown in
Table 3. The average concentrations of oxalate indicated a
seasonal variation of autumn [ summer [ winter [ spring
in both PM2.5 and TSP. Their contributions to the total
mass of the aerosols displayed in a slightly different order
as summer [ autumn [ spring [ winter. Since the pro-
duction of aerosol oxalate in the atmosphere is generally a
radical (mainly hydroxyl radical) related photo-oxidation
or chemical oxidation process [20, 21], the high concen-
trations of oxalate in summer and autumn can be attributed
to the generally high ambient temperature and more solar
radiation in these two seasons.
The relative distribution of oxalate and several selected
inorganic ions between PM2.5 and TSP in each season was
analyzed. As shown in Fig. 1, oxalate was mainly present
in the fine particle mode. The value of PM2.5/TSP of
oxalate concentration reached its peak in summer, up to
0.88. According to the data of our online PM2.5 and PM1
monitoring in the same sampling site, the ratios of mass
concentration of PM1 to that of PM2.5 averaged at 80 % in
2009 in Shanghai which suggested that aerosol oxalate
probably dominated in finer particles (\1.0 lm). This is
consistent with the results of previous studies, in which the
majority of aerosol oxalate was found appeared in the
accumulation mode (0.1–2.0 lm) with a MMAD around
1.0 lm, while small fraction of it distributed in the coarse
mode ([2.0 lm) and Aitken mode (\0.1 lm) [14, 21].
It could also be seen clearly in Fig. 1 that nss-sulfate
(non-sea salt sulfate), ammonium, and potassium reside
dominantly in PM2.5 rather than in TSP in all four seasons,
with an exception of nitrate. The ratios of PM2.5 to TSP of
nitrate concentration were near to 0.5 which may be
explained by the high volatility of nitric acid/nitrate and the
coastal environment of Shanghai. Gaseous nitric acid
(HNO3) and nitrate (NO3-) bound to aerosol particles
coexist in the atmosphere. Nitrate in the aerosols can exist
in the forms of NH4NO3, NaNO3, Ca(NO3)2, etc.,
depending on the category and concentration of gaseous
and aerosol species which nitric acid can obtain to combine
with. In the coastal area, the abundant atmospheric sea salt
aerosols can partition gas-phase nitric acid to particle- or
aqueous-phase NaNO3 [37]. Most of the newly formed
NaNO3 still reside in coarse particles of sea salt which
consequently decreased the PM2.5/TSP ratio of nitrate in
Shanghai. Martinelango et al. [21] indicated a high ratio of
PM10/PM2.5 of nitrate in a costal environment, while
studies carried out in Hong Kong also observed a dominant
coarse mode of nitrate [38]. More nitric acid would parti-
tion to gas-phase under hot and acidic ambient environ-
ment, which means more coarse mode nitrate could be
produced from the gas-phase through the sea salt conver-
sion. From our observation, the two lowest PM2.5/TSP
ratios of nitrate appeared in spring, the most acidic season,
and in summer, the season with the highest temperature,
lend more support to this viewpoint.
Table 2 Aerosol oxalate concentrations measured at different sampling sites around the world
Site Sampling period Size Concentration (lg/m3) References
Shanghai March 2007–January 2008 PM2.5 0.07–0.41 This work
Shanghai 1999–2000 PM2.5 0.50 [30]
Nanjing 2001 PM2.5 0.22–0.30 [31]
Hong Kong Winter 2000 PM2.5 0.35 ± 0.14 [32]
Tokyo 1989 PM2.5 0.27 ± 0.19 [1]
Beijing 2002–2003 PM2.5 0.35 ± 0.26 [33]
Shanghai March 2007–January 2008 TSP 0.10–0.48 This work
Tokyo February 1992 TSP 0.27 ± 0.19 [34]
Chiba April 1987–March 1993 TSP 0.38 [35]
Tampa Bay 2002 PM12.5 0.29 [21]
Los Angeles 1984 TSP 0.19 ± 0.78 [36]
Beijing 2002–2003 PM10 0.38 ± 0.32 [33]
Table 3 Seasonal variations of the oxalate concentrations (lg/m3)
and their contributions (%) to the total mass of the aerosols
Spring Summer Autumn Winter Dust day
April 2,
2007
PM2.5
Mean 0.14 0.20 0.31 0.15 0.26
Median 0.12 0.13 0.29 0.11
Contribution 0.59 0.80 0.77 0.13 0.21
TSP
Mean 0.19 0.27 0.37 0.25 0.67
Median 0.12 0.25 0.36 0.15
Contribution 0.19 0.49 0.38 0.10 0.09
Level of significance: 95 %
230 Chin. Sci. Bull. (2014) 59(2):227–238
123
Page 5
The probable dominant droplet mode oxalate and simi-
larity in size distribution between oxalate and the inorganic
ions also gave suggestion on the sources and formation
pathways of aerosol oxalate which would be discussed
further in the following sections.
3.1.2 Case study
Aerosol oxalate in a dust event. In an ever-recorded dust
day on April 2, 2007, sampling was segmented to five
periods (Table 4) to avoid possible overload of the filters
and to gain a more lucid profile of the dust event. The most
intensive input of the dust occurred in the morning time
(09:29–12:10) in which the mass concentration of TSP and
oxalate in TSP rushed to 1340.4 and 1.14 lg/m3, respec-
tively. At the same time, the PM2.5/TSP ratio of mass and
oxalate concentration decreased to 0.29 and 0.38, which
was nearly half of the values in normal days. The three-day
back trajectories exhibited the air mass movements at the
beginning of the dust day (Fig. 2a). The dust air mass
originated from west/northwest China, where is a major
source area of Asian dust, crossed the continent to the
coastal regions, over the Bohai Sea and the Yellow Sea and
finally arrived at Shanghai. The transport heights of the air
mass were at 2500–3500 m, which were typical of the high
altitude transport weather pattern of a dust event. The
aerosols arrived at Shanghai were mixed aerosols formed
by interactions between the dust particles, the anthropo-
genic pollutants entrained along the transport pathway and
at local areas, and the gaseous species and sea salts over the
seas. However, dust particles still took the bulk of the total
mass of the ambient aerosols on the dust day in Shanghai
(Table 4).
During the transport of the dust aerosols, atmospheric
oxalate and its precursors over the continent and the seas
could be entrained and reacted with the alkaline/neutral
components in the dust aerosols, which led to increase in
the absolute content of oxalate in the dust plume as well as
redistributions of atmospheric oxalate from gaseous phase
or fine particle mode to the predominant and more alkaline
coarse particle mode. This could explain the distinct
decrease of PM2.5/TSP ratio of oxalate concentration dur-
ing the dust episode compared to the value of spring
average.
Intensity of the dust lessened gradually along the time
which could be concluded from the aerosol mass concen-
trations in the five successive sampling periods. The mass
concentrations of both PM2.5 and TSP in the fifth period
(22:29 April 2–09:11 April 3) displayed an obvious
decline, suggesting the ending of this dust event. Air
masses observed largely came from north China instead
and the transport heights were obviously lower than those
at the beginning of the dust event (Fig. 2b). The cloud
cover, which was believed to be influenced by the Asian
brown cloud (ABC) arisen by the dust air mass to a great
extent in this case, also decreased from 104 to 66.7 PCT at
the ending. However, the PM2.5/TSP ratio of aerosol mass
and oxalate concentration changed differently to the con-
centrations themselves. They both reached the minimums
at the third period (15:19–19:42) of the sampling, in which
the ratios were 0.11 for mass concentration and 0.31 for
oxalate concentration, respectively. Then in the fourth and
fifth periods, the ratios kept rising back to the normal day
level. This was in accordance with the fact that dust aerosol
was mainly composed of coarse particles and the relative
concentration of the coarse particles measured in down-
wind area would decrease with the weakening of the dust
event. Less input of coarse mode particles meant that the
aerosol oxalate from local primary/secondary sources,
which was mainly resided in fine particle mode in Shang-
hai, began taking up the predominance.
3.2 Possible sources and formation pathways of aerosol
oxalate in Shanghai
3.2.1 Source identification by correlation analysis
To explore the possible sources and formation pathways,
oxalate together with some species, which could be the
indicator or the tracer of the various sources, was subjected
to correlation analysis. We selected Al as the indicator for
the crustal source, NO2- for vehicular emission, nss-SO4
2-
and NO3- for secondary formation through different
pathways, and K? for biomass burning. The correlation
coefficients between these source-indicating species and
oxalate in PM2.5 are listed in Table 5.
Aerosol oxalate exhibited a poor correlation with alu-
minum with a peak value in spring (r = 0.02–0.53,
Fig. 1 Distribution of aerosol oxalate and selected inorganic ions
between PM2.5 and TSP in four seasons of Shanghai
Chin. Sci. Bull. (2014) 59(2):227–238 231
123
Page 6
Table 5). This suggested the contribution from crust or soil
to the atmospheric oxalate mass in Shanghai was relatively
small. A moderate correlation coefficient of 0.53 between
oxalate and Al in spring could be brought by a larger
amount of dust/soil aerosol input from north/northwest
areas of China to the coastal region in this season. Emis-
sions of oxalate or its precursors from the metabolic pro-
cesses of various soil fungal species could be another
explanation for such a trend of correlation coefficients
between oxalate and Al along the seasons. Obviously
higher values were observed in spring (r = 0.53) and
summer (r = 0.36) than in autumn (r = 0.02) and winter
(r = 0.10), which was the inactive period of the metabolic
processes of plants (Table 5).
Previous researches suggested that combustion pro-
cesses were important sources of atmospheric HNO2 and
the most effective source of this type was the automobile
engine [33, 39]. The concentrations of nitrite (NO2-)
associated with the atmospheric aerosol are proportional to
HNO2 concentrations in the gas-phase according to the
Henry’s Law. Therefore, here we use aerosol NO2- as an
indicator for primary vehicular emissions. From the very
low correlation coefficients between oxalate and NO2- in
every season (r = 0.07–0.25), we concluded that the
vehicular emission made a very limited contribution to the
total amount of aerosol oxalate in Shanghai as a primary
source. Hence, the secondary formation in the atmosphere
should account for the majority of this compound.
A high correlation was found between oxalate and NO3-
(r = 0.49–0.90) in PM2.5, suggesting a similar source or
formation pathway between these two species. The atmo-
spheric precursors of NO3- and oxalate were NOx and
Table 4 Segmented aerosol and oxalate mass concentrations, PM2.5/TSP ratio, and the meteorological parameters on April 2, 2007
Time (UTC ? 0800) Mass concentration (lg/m3) Oxalate concentration (lg/m3) Ambient
temperature (�C)
Cloud
cover (PCT)PM2.5 TSP PM2.5/TSP PM2.5 TSP PM2.5/TSP
09:29–12:10 383.3 1340.4 0.29 0.43 1.14 0.38 11.9 104
12:14–15:14 223.8 1221.0 0.18 0.32 0.99 0.32 13.1 104
15:19–19:42 101.5 913.9 0.11 0.24 0.76 0.31 11.7 104
19:46–22:21 92.0 449.4 0.20 0.19 0.35 0.55 8.6 104
22:29–09:11 35.4 106.2 0.33 0.10 0.12 0.85 6.8 66.7
Spring averagea 47.9 95.6 0.50 0.14 0.19 0.74 15.5 47.7
a Based on daily average values in spring sampling campaign, the dust day not included
Fig. 2 The 72-h back trajectories of air masses at the beginning (a) and the ending (b) of the dust day in Shanghai
232 Chin. Sci. Bull. (2014) 59(2):227–238
123
Page 7
volatile organic matters (e.g., alkenes) respectively, a
characteristic source of which in urban city was vehicular
exhausts. The good correlation between aerosol NO3- and
oxalate provided evidence that vehicular emission was a
major secondary source for these two compounds in
Shanghai. Furthermore, the conversion of NO2 to NO3-,
which is activated by ozone or radicals like OH and the
formation of oxalate from alkenes which was also supposed
to be a radical involved oxidation process, could be parallel
and internally linked to each other through gaseous or
aqueous radicals. For oxalate resided in particle size range
larger than droplet mode ([1.0 lm), it could be produced
by surface reactions of gaseous oxalic acid or its precursors
with alkaline coarse particles or from the evaporation of
oxalate in smaller size range [11, 30]. These could be two
possible formation pathways for oxalate in higher fine
particle mode (1.0–2.5 lm). However, more nitric acid was
evaporated from fine particles and absorbed by alkaline
coarse particles compared to oxalic acid due to their dif-
ferent volatility. This provided a reasonable explanation for
the high correlation and distinct-size distribution between
these two compounds.
As a result of a number of the previous studies, the
formation of sulfate in the atmosphere through aqueous-
phase oxidation is well established. Some researchers
concluded from simulations that in-cloud process could
convert up to 80 % SO2 to sulfate in troposphere [40].
Recent studies evidenced that the secondary formation of
oxalate in the troposphere also requires the aqueous med-
ium, with glyoxylate as a key aqueous-phase precursor [12,
20]. In Shanghai, aerosol oxalate showed a strong corre-
lation with nss-sulfate in all four seasons (r = 0.60–0.95),
especially in summer (r = 0.95), suggesting a common
formation pathway between these two species. The simi-
larity in oxalate and sulfate’s distribution between PM2.5
and TSP also offered support to this hypothesis. As men-
tioned in the size distribution analysis and a number of
studies, aerosol oxalate and sulfate mainly resided in fine
particles and both probably represented a dominant droplet
particle mode (\1.0 lm). Based on plenty of previous
studies, aqueous-phase reactions were necessary to the
production of droplet mode sulfate as well as that of droplet
mode secondary aerosol organics to occur [16]. That is to
say, the cloud process was suggested to be the most pos-
sible common formation pathway of aerosol oxalate and
sulfate, considering the particle-size distribution.
Ammonium also showed an obvious positive correlation
with oxalate, with the correlation coefficients of 0.52–0.80.
One possible explanation of this phenomenon is that
ammonium in the atmosphere is mainly produced by the
reaction between gaseous NH3 and acidic sulfate particles
[41] and therefore its high correlation with oxalate might
be affected (or brought) by sulfate. On the other hand, it
could be explained by the presence of ammonium oxalate
in aerosols. Lefer and Talbot [42] suggested that ammo-
nium oxalate aerosol may be directly formed from the
gaseous ammonia and oxalic acid. Combined with the
result of size distribution analysis, the high correlation
between ammonium and oxalate indicated a possible form
of existence for aerosol oxalate rather than evidence for a
common source.
Since K? is an essential nutrient element for the growth
of plants, it has been used as an effective indicator for the
source of atmospheric particulates from biomass burning,
especially in the fine particle mode [14, 32, 43]. The size
distribution characteristics of K? observed in this work
also showed that K? dominantly resides in PM2.5 in every
season in urban Shanghai (*80 %). The results of corre-
lation analysis presented a moderate correlation between
oxalate and K? with a peak value in autumn (r = 0.65),
being consistent with the fact that the events of biomass
burning happened most frequently in this season. If an
oxalate/K? correlation suggested the contribution of bio-
mass burning to the aerosol oxalate concentrations, there is
a question needed to be addressed: is biomass burning just
a primary source or also a secondary source for aerosol
oxalate since biogenic VOCs could be released to the
atmosphere through the biomass burning activity? The
ratio of oxalate to K? (oxalate/K?) in this work averaged at
0.26 in autumn, which was apparently larger than the
reported values for the oxalate directly measured in bio-
mass burning plumes (0.03–0.1) [43]. On the other hand,
the high content of water-soluble compounds (inorganic
salts and water-soluble organic matters) in biomass burning
aerosols made the majority of them act as CCN [44, 45].
Hence, the high oxalate/K? ratio suggested a secondary
formation of oxalate from biomass burning emitted VOCs
and probably through an in-cloud pathway as well. This is
exactly the reason that VOCs precursors of oxalate had a
characteristic source from biomass burning in autumn that
could partially explain the observation of the highest oxa-
late concentration and the lowest correlation coefficient
between oxalate, nitrate, and sulfate in this season.
Table 5 The correlation coefficients between oxalate and several
source-indicating species in PM2.5 in Shanghai, 2007
Sample
numbers
Al NO2- NO3
- nss-
SO42-c
NH4? K?
Spring 34 0.53a 0.19 0.80a 0.85a 0.60a 0.53a
Summer 28 0.36b 0.21 0.90a 0.95a 0.80a 0.51a
Autumn 27 0.02 0.25b 0.49a 0.60a 0.52a 0.65a
Winter 31 0.10 0.07 0.60a 0.67a 0.59a 0.29b
a Correlation is significant at P \ 0.01 levelb Correlation is significant at P \ 0.05 levelc Non-sea salt sulfate
Chin. Sci. Bull. (2014) 59(2):227–238 233
123
Page 8
3.2.2 Linear relationship of oxalate with sulfate/nitrate
The relationships of aerosol oxalate with the two source-
indicating species, nss-SO42- and NO3
-, could give a hint
to the secondary formation pathways of aerosol oxalate. As
mentioned above, the oxidation of SO2 to SO42- in the
atmosphere mainly happens in the aqueous phase, where
the dissolved SO2 forms HSO3- and SO3
2- and then oxi-
dized by ozone or hydroperoxides at significant rates.
Meanwhile, aqueous-phase formation was regarded as
necessary for the production of droplet mode secondary
organic aerosol to occur [16], which was applicable to the
majority of aerosol oxalate in Shanghai based on previous
discussions. Differently, the oxidation of NO2 to nitric acid
in the atmosphere mostly occurs in the gaseous phase,
either oxidized by OH radical directly or by ozone through
two intermediates, NO3 radical and nitrogen pentoxide
[46]. Previous studies [12, 21, 47] suggested that atmo-
spheric oxalate is dominantly produced through aqueous
oxidation by OH radical with glyoxylic acid, the most
immediate precursor, which derived from either gaseous or
aqueous oxidation of various primary precursors, ethene,
acetylene, isoprene from biogenic source, etc. It was
noticed that OH radical was involved in secondary for-
mations of both NO3- and oxalate in the atmosphere. That
is to say, the productions of NO3- and oxalate would be
limited by the availability of OH radical. From this point of
view, the secondary formations of these two species were
internally related.
Looking at our data, summer and winter as representa-
tive seasons, the sulfate-oxalate and nitrate-oxalate corre-
lation coefficients were better in summer (0.95 and 0.90)
than in winter (0.67 and 0.60) (Table 5). Furthermore, the
slope values of sulfate-oxalate and nitrate-oxalate linear
regression curves were both lower in summer than in
winter (Fig. 3a, b). Seasonal characteristics of these three
compounds may explain the difference. As discussed
before, sulfate, nitrate, and oxalate in fine particles were
mainly secondarily formed in the atmosphere of Shanghai
and probably through related formation pathways. In
summer, local sources of the three compounds were pre-
dominant which made the correlations between them sig-
nificant. In winter, with the invading northwesterly from
the continent, sulfate, nitrate, and oxalate from sources out-
of-Shanghai would be brought to the local atmosphere and
hence decrease their correlations to each other. On the
other hand, ambient concentrations of SO2 and NO2 were
lifted in winter owing to the bad atmospheric diffusion in
this season (Table 1). Meanwhile, emission of VOCs was
lessened under the low temperature of winter. Conse-
quently, differences in concentrations of sulfate and nitrate
and that of aerosol oxalate (the slope values) were
widened.
3.2.3 Meteorological evidence for the formation pathway
of aerosol oxalate
Meteorological factors were taken into account for the
formation of aerosol oxalate in Shanghai. The variation of
temperature, relative humidity (RH), cloud cover, wind
speed (WS), and wind direction (WD) in the sampling
period were compared with that of the oxalate concentra-
tions. Based on the daily average observation values, no
significant quantitative correlation was found between
oxalate and any of these meteorological factors. However,
the oxalate concentration did increase under such weather
conditions: (1) clear days with clouds; (2) days with haze,
mist or fog; and (3) rain or shower or thunderstorm hap-
pening in the sampling days. Should the concentration level
of aerosol oxalate be simultaneously influenced by multiple
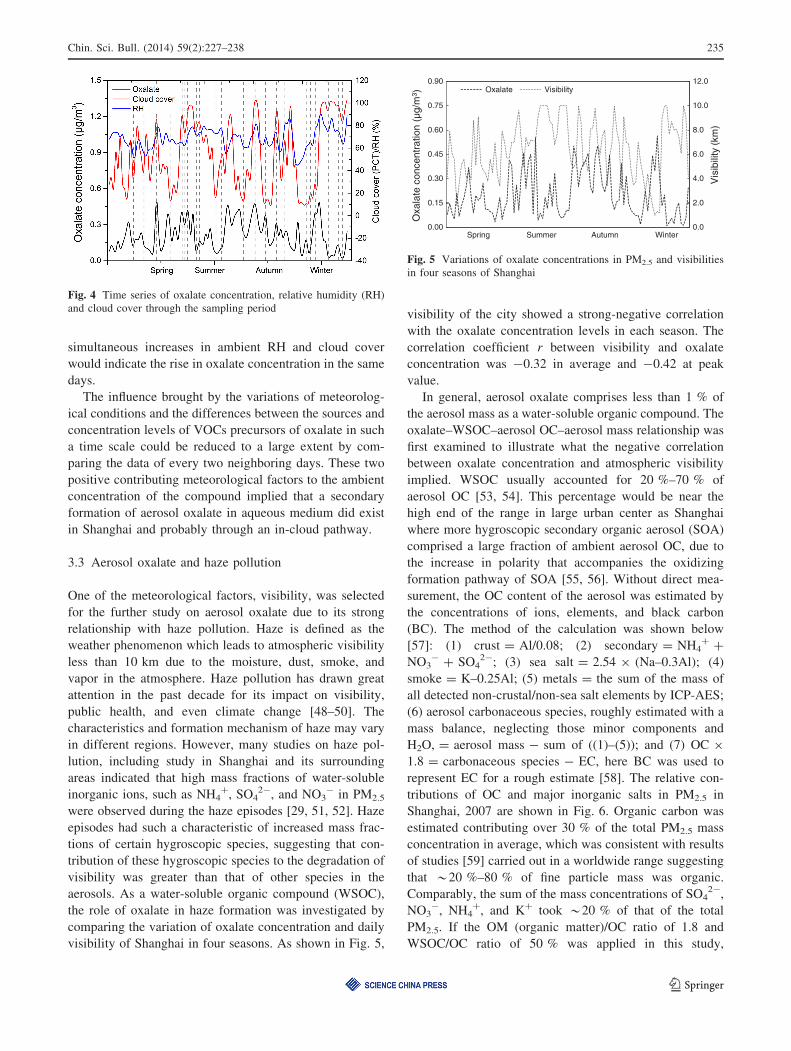
meteorological parameters? The time series of relative
humidity (RH), cloud cover and oxalate concentration
through the sampling period are shown in Fig. 4. It could
be concluded from the temporal trends that whenever both
the relative humidity and cloud cover declined compared to
the values in the preceding day, a decrease of oxalate
concentration was observed accordingly and vice versa
(see the dash lines in gray in Fig. 4). That is to say,
y = 38.389x - 1.0931
y = 19.628x + 3.3557
0.00
5.00
10.00
15.00
20.00
25.00
0.00 0.10 0.20 0.30 0.40 0.50 0.60
nss-
SO
42-(µ
g/m
3 )
Oxalate (µg/m3)
Summer
Winter
y = 14.884x - 0.2239
y = 23.047x + 2.212
0.00
5.00
10.00
15.00
20.00
25.00
0.00 0.10 0.20 0.30 0.40 0.50 0.60
NO
3-(µ
g/m
3 )
Oxalate (µg/m3)
Summer
Winter
(a)
(b)
Fig. 3 The linear regression curves of oxalate-nss-SO42- (a) and
oxalate-NO3- (b) in PM2.5 in summer and winter
234 Chin. Sci. Bull. (2014) 59(2):227–238
123
Page 9
simultaneous increases in ambient RH and cloud cover
would indicate the rise in oxalate concentration in the same
days.
The influence brought by the variations of meteorolog-
ical conditions and the differences between the sources and
concentration levels of VOCs precursors of oxalate in such
a time scale could be reduced to a large extent by com-
paring the data of every two neighboring days. These two
positive contributing meteorological factors to the ambient
concentration of the compound implied that a secondary
formation of aerosol oxalate in aqueous medium did exist
in Shanghai and probably through an in-cloud pathway.
3.3 Aerosol oxalate and haze pollution
One of the meteorological factors, visibility, was selected
for the further study on aerosol oxalate due to its strong
relationship with haze pollution. Haze is defined as the
weather phenomenon which leads to atmospheric visibility
less than 10 km due to the moisture, dust, smoke, and
vapor in the atmosphere. Haze pollution has drawn great
attention in the past decade for its impact on visibility,
public health, and even climate change [48–50]. The
characteristics and formation mechanism of haze may vary
in different regions. However, many studies on haze pol-
lution, including study in Shanghai and its surrounding
areas indicated that high mass fractions of water-soluble
inorganic ions, such as NH4?, SO4
2-, and NO3- in PM2.5
were observed during the haze episodes [29, 51, 52]. Haze
episodes had such a characteristic of increased mass frac-
tions of certain hygroscopic species, suggesting that con-
tribution of these hygroscopic species to the degradation of
visibility was greater than that of other species in the
aerosols. As a water-soluble organic compound (WSOC),
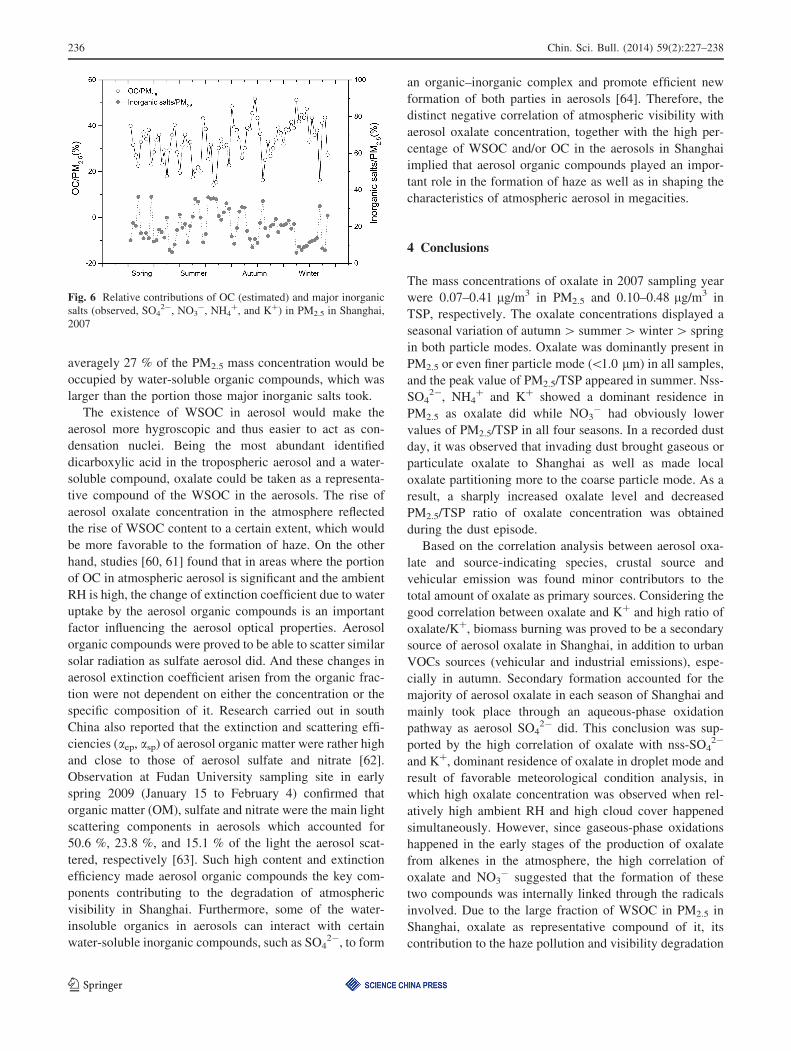
the role of oxalate in haze formation was investigated by
comparing the variation of oxalate concentration and daily
visibility of Shanghai in four seasons. As shown in Fig. 5,
visibility of the city showed a strong-negative correlation
with the oxalate concentration levels in each season. The
correlation coefficient r between visibility and oxalate
concentration was -0.32 in average and -0.42 at peak
value.
In general, aerosol oxalate comprises less than 1 % of
the aerosol mass as a water-soluble organic compound. The
oxalate–WSOC–aerosol OC–aerosol mass relationship was
first examined to illustrate what the negative correlation
between oxalate concentration and atmospheric visibility
implied. WSOC usually accounted for 20 %–70 % of
aerosol OC [53, 54]. This percentage would be near the
high end of the range in large urban center as Shanghai
where more hygroscopic secondary organic aerosol (SOA)
comprised a large fraction of ambient aerosol OC, due to
the increase in polarity that accompanies the oxidizing
formation pathway of SOA [55, 56]. Without direct mea-
surement, the OC content of the aerosol was estimated by
the concentrations of ions, elements, and black carbon
(BC). The method of the calculation was shown below
[57]: (1) crust = Al/0.08; (2) secondary = NH4? ?
NO3- ? SO4
2-; (3) sea salt = 2.54 9 (Na–0.3Al); (4)
smoke = K–0.25Al; (5) metals = the sum of the mass of
all detected non-crustal/non-sea salt elements by ICP-AES;
(6) aerosol carbonaceous species, roughly estimated with a
mass balance, neglecting those minor components and
H2O, = aerosol mass - sum of ((1)–(5)); and (7) OC 9
1.8 = carbonaceous species - EC, here BC was used to
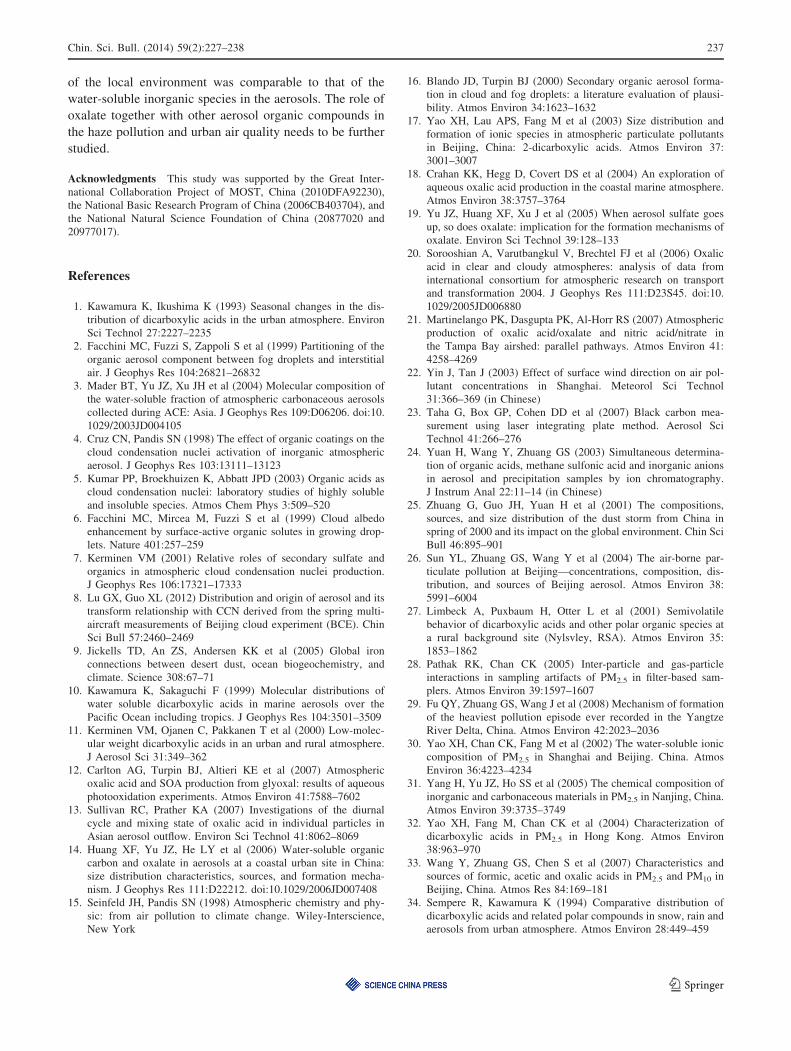
represent EC for a rough estimate [58]. The relative con-
tributions of OC and major inorganic salts in PM2.5 in
Shanghai, 2007 are shown in Fig. 6. Organic carbon was
estimated contributing over 30 % of the total PM2.5 mass
concentration in average, which was consistent with results
of studies [59] carried out in a worldwide range suggesting
that *20 %–80 % of fine particle mass was organic.
Comparably, the sum of the mass concentrations of SO42-,
NO3-, NH4
?, and K? took *20 % of that of the total
PM2.5. If the OM (organic matter)/OC ratio of 1.8 and
WSOC/OC ratio of 50 % was applied in this study,
Fig. 4 Time series of oxalate concentration, relative humidity (RH)
and cloud cover through the sampling period
0.0
2.0
4.0
6.0
8.0
10.0
12.0
0.00
0.15
0.30
0.45
0.60
0.75
0.90
Vis
ibili
ty (k
m)
Oxa
late
con
cent
ratio
n (µ
g/m
3 )
Spring Summer Autumn Winter
Oxalate Visibility
Fig. 5 Variations of oxalate concentrations in PM2.5 and visibilities
in four seasons of Shanghai
Chin. Sci. Bull. (2014) 59(2):227–238 235
123
Page 10
averagely 27 % of the PM2.5 mass concentration would be
occupied by water-soluble organic compounds, which was
larger than the portion those major inorganic salts took.
The existence of WSOC in aerosol would make the
aerosol more hygroscopic and thus easier to act as con-
densation nuclei. Being the most abundant identified
dicarboxylic acid in the tropospheric aerosol and a water-
soluble compound, oxalate could be taken as a representa-
tive compound of the WSOC in the aerosols. The rise of
aerosol oxalate concentration in the atmosphere reflected
the rise of WSOC content to a certain extent, which would
be more favorable to the formation of haze. On the other
hand, studies [60, 61] found that in areas where the portion
of OC in atmospheric aerosol is significant and the ambient
RH is high, the change of extinction coefficient due to water
uptake by the aerosol organic compounds is an important
factor influencing the aerosol optical properties. Aerosol
organic compounds were proved to be able to scatter similar
solar radiation as sulfate aerosol did. And these changes in
aerosol extinction coefficient arisen from the organic frac-
tion were not dependent on either the concentration or the
specific composition of it. Research carried out in south
China also reported that the extinction and scattering effi-
ciencies (aep, asp) of aerosol organic matter were rather high
and close to those of aerosol sulfate and nitrate [62].
Observation at Fudan University sampling site in early
spring 2009 (January 15 to February 4) confirmed that
organic matter (OM), sulfate and nitrate were the main light
scattering components in aerosols which accounted for
50.6 %, 23.8 %, and 15.1 % of the light the aerosol scat-
tered, respectively [63]. Such high content and extinction
efficiency made aerosol organic compounds the key com-
ponents contributing to the degradation of atmospheric
visibility in Shanghai. Furthermore, some of the water-
insoluble organics in aerosols can interact with certain
water-soluble inorganic compounds, such as SO42-, to form
an organic–inorganic complex and promote efficient new
formation of both parties in aerosols [64]. Therefore, the
distinct negative correlation of atmospheric visibility with
aerosol oxalate concentration, together with the high per-
centage of WSOC and/or OC in the aerosols in Shanghai
implied that aerosol organic compounds played an impor-
tant role in the formation of haze as well as in shaping the
characteristics of atmospheric aerosol in megacities.
4 Conclusions
The mass concentrations of oxalate in 2007 sampling year
were 0.07–0.41 lg/m3 in PM2.5 and 0.10–0.48 lg/m3 in
TSP, respectively. The oxalate concentrations displayed a
seasonal variation of autumn [ summer [ winter [ spring
in both particle modes. Oxalate was dominantly present in
PM2.5 or even finer particle mode (\1.0 lm) in all samples,
and the peak value of PM2.5/TSP appeared in summer. Nss-
SO42-, NH4
? and K? showed a dominant residence in
PM2.5 as oxalate did while NO3- had obviously lower
values of PM2.5/TSP in all four seasons. In a recorded dust
day, it was observed that invading dust brought gaseous or
particulate oxalate to Shanghai as well as made local
oxalate partitioning more to the coarse particle mode. As a
result, a sharply increased oxalate level and decreased
PM2.5/TSP ratio of oxalate concentration was obtained
during the dust episode.
Based on the correlation analysis between aerosol oxa-
late and source-indicating species, crustal source and
vehicular emission was found minor contributors to the
total amount of oxalate as primary sources. Considering the
good correlation between oxalate and K? and high ratio of
oxalate/K?, biomass burning was proved to be a secondary
source of aerosol oxalate in Shanghai, in addition to urban
VOCs sources (vehicular and industrial emissions), espe-
cially in autumn. Secondary formation accounted for the
majority of aerosol oxalate in each season of Shanghai and
mainly took place through an aqueous-phase oxidation
pathway as aerosol SO42- did. This conclusion was sup-
ported by the high correlation of oxalate with nss-SO42-
and K?, dominant residence of oxalate in droplet mode and
result of favorable meteorological condition analysis, in
which high oxalate concentration was observed when rel-
atively high ambient RH and high cloud cover happened
simultaneously. However, since gaseous-phase oxidations
happened in the early stages of the production of oxalate
from alkenes in the atmosphere, the high correlation of
oxalate and NO3- suggested that the formation of these
two compounds was internally linked through the radicals
involved. Due to the large fraction of WSOC in PM2.5 in
Shanghai, oxalate as representative compound of it, its
contribution to the haze pollution and visibility degradation
Fig. 6 Relative contributions of OC (estimated) and major inorganic
salts (observed, SO42-, NO3
-, NH4?, and K?) in PM2.5 in Shanghai,
2007
236 Chin. Sci. Bull. (2014) 59(2):227–238
123
Page 11
of the local environment was comparable to that of the
water-soluble inorganic species in the aerosols. The role of
oxalate together with other aerosol organic compounds in
the haze pollution and urban air quality needs to be further
studied.
Acknowledgments This study was supported by the Great Inter-
national Collaboration Project of MOST, China (2010DFA92230),
the National Basic Research Program of China (2006CB403704), and
the National Natural Science Foundation of China (20877020 and
20977017).
References
1. Kawamura K, Ikushima K (1993) Seasonal changes in the dis-
tribution of dicarboxylic acids in the urban atmosphere. Environ
Sci Technol 27:2227–2235
2. Facchini MC, Fuzzi S, Zappoli S et al (1999) Partitioning of the
organic aerosol component between fog droplets and interstitial
air. J Geophys Res 104:26821–26832
3. Mader BT, Yu JZ, Xu JH et al (2004) Molecular composition of
the water-soluble fraction of atmospheric carbonaceous aerosols
collected during ACE: Asia. J Geophys Res 109:D06206. doi:10.
1029/2003JD004105
4. Cruz CN, Pandis SN (1998) The effect of organic coatings on the
cloud condensation nuclei activation of inorganic atmospheric
aerosol. J Geophys Res 103:13111–13123
5. Kumar PP, Broekhuizen K, Abbatt JPD (2003) Organic acids as
cloud condensation nuclei: laboratory studies of highly soluble
and insoluble species. Atmos Chem Phys 3:509–520
6. Facchini MC, Mircea M, Fuzzi S et al (1999) Cloud albedo
enhancement by surface-active organic solutes in growing drop-
lets. Nature 401:257–259
7. Kerminen VM (2001) Relative roles of secondary sulfate and
organics in atmospheric cloud condensation nuclei production.
J Geophys Res 106:17321–17333
8. Lu GX, Guo XL (2012) Distribution and origin of aerosol and its
transform relationship with CCN derived from the spring multi-
aircraft measurements of Beijing cloud experiment (BCE). Chin
Sci Bull 57:2460–2469
9. Jickells TD, An ZS, Andersen KK et al (2005) Global iron
connections between desert dust, ocean biogeochemistry, and
climate. Science 308:67–71
10. Kawamura K, Sakaguchi F (1999) Molecular distributions of
water soluble dicarboxylic acids in marine aerosols over the
Pacific Ocean including tropics. J Geophys Res 104:3501–3509
11. Kerminen VM, Ojanen C, Pakkanen T et al (2000) Low-molec-
ular weight dicarboxylic acids in an urban and rural atmosphere.
J Aerosol Sci 31:349–362
12. Carlton AG, Turpin BJ, Altieri KE et al (2007) Atmospheric
oxalic acid and SOA production from glyoxal: results of aqueous
photooxidation experiments. Atmos Environ 41:7588–7602
13. Sullivan RC, Prather KA (2007) Investigations of the diurnal
cycle and mixing state of oxalic acid in individual particles in
Asian aerosol outflow. Environ Sci Technol 41:8062–8069
14. Huang XF, Yu JZ, He LY et al (2006) Water-soluble organic
carbon and oxalate in aerosols at a coastal urban site in China:
size distribution characteristics, sources, and formation mecha-
nism. J Geophys Res 111:D22212. doi:10.1029/2006JD007408
15. Seinfeld JH, Pandis SN (1998) Atmospheric chemistry and phy-
sic: from air pollution to climate change. Wiley-Interscience,
New York
16. Blando JD, Turpin BJ (2000) Secondary organic aerosol forma-
tion in cloud and fog droplets: a literature evaluation of plausi-
bility. Atmos Environ 34:1623–1632
17. Yao XH, Lau APS, Fang M et al (2003) Size distribution and
formation of ionic species in atmospheric particulate pollutants
in Beijing, China: 2-dicarboxylic acids. Atmos Environ 37:
3001–3007
18. Crahan KK, Hegg D, Covert DS et al (2004) An exploration of
aqueous oxalic acid production in the coastal marine atmosphere.
Atmos Environ 38:3757–3764
19. Yu JZ, Huang XF, Xu J et al (2005) When aerosol sulfate goes
up, so does oxalate: implication for the formation mechanisms of
oxalate. Environ Sci Technol 39:128–133
20. Sorooshian A, Varutbangkul V, Brechtel FJ et al (2006) Oxalic
acid in clear and cloudy atmospheres: analysis of data from
international consortium for atmospheric research on transport
and transformation 2004. J Geophys Res 111:D23S45. doi:10.
1029/2005JD006880
21. Martinelango PK, Dasgupta PK, Al-Horr RS (2007) Atmospheric
production of oxalic acid/oxalate and nitric acid/nitrate in
the Tampa Bay airshed: parallel pathways. Atmos Environ 41:
4258–4269
22. Yin J, Tan J (2003) Effect of surface wind direction on air pol-
lutant concentrations in Shanghai. Meteorol Sci Technol
31:366–369 (in Chinese)
23. Taha G, Box GP, Cohen DD et al (2007) Black carbon mea-
surement using laser integrating plate method. Aerosol Sci
Technol 41:266–276
24. Yuan H, Wang Y, Zhuang GS (2003) Simultaneous determina-
tion of organic acids, methane sulfonic acid and inorganic anions
in aerosol and precipitation samples by ion chromatography.
J Instrum Anal 22:11–14 (in Chinese)
25. Zhuang G, Guo JH, Yuan H et al (2001) The compositions,
sources, and size distribution of the dust storm from China in
spring of 2000 and its impact on the global environment. Chin Sci
Bull 46:895–901
26. Sun YL, Zhuang GS, Wang Y et al (2004) The air-borne par-
ticulate pollution at Beijing—concentrations, composition, dis-
tribution, and sources of Beijing aerosol. Atmos Environ 38:
5991–6004
27. Limbeck A, Puxbaum H, Otter L et al (2001) Semivolatile
behavior of dicarboxylic acids and other polar organic species at
a rural background site (Nylsvley, RSA). Atmos Environ 35:
1853–1862
28. Pathak RK, Chan CK (2005) Inter-particle and gas-particle
interactions in sampling artifacts of PM2.5 in filter-based sam-
plers. Atmos Environ 39:1597–1607
29. Fu QY, Zhuang GS, Wang J et al (2008) Mechanism of formation
of the heaviest pollution episode ever recorded in the Yangtze
River Delta, China. Atmos Environ 42:2023–2036
30. Yao XH, Chan CK, Fang M et al (2002) The water-soluble ionic
composition of PM2.5 in Shanghai and Beijing. China. Atmos
Environ 36:4223–4234
31. Yang H, Yu JZ, Ho SS et al (2005) The chemical composition of
inorganic and carbonaceous materials in PM2.5 in Nanjing, China.
Atmos Environ 39:3735–3749
32. Yao XH, Fang M, Chan CK et al (2004) Characterization of
dicarboxylic acids in PM2.5 in Hong Kong. Atmos Environ
38:963–970
33. Wang Y, Zhuang GS, Chen S et al (2007) Characteristics and
sources of formic, acetic and oxalic acids in PM2.5 and PM10 in
Beijing, China. Atmos Res 84:169–181
34. Sempere R, Kawamura K (1994) Comparative distribution of
dicarboxylic acids and related polar compounds in snow, rain and
aerosols from urban atmosphere. Atmos Environ 28:449–459
Chin. Sci. Bull. (2014) 59(2):227–238 237
123
Page 12
35. Uchiyama S (1996) The behavior of oxalic acid in atmospheric
aerosols. J Jpn Soc Atmos Environ 31:141–148
36. Kawamura K, Kaplan IR (1987) Motor exhaust emissions as a
primary source for dicarboxylic acids in Los Angeles ambient air.
Environ Sci Technol 21:105–110
37. Dasgupta PK, Campbell SW, Al-Horr RS et al (2007) Conversion
of sea salt aerosol to and the production of HCl: analysis of
temporal behavior of aerosol chloride/nitrate and gaseous HCl/
HNO3 concentrations with AIM. Atmos Environ 41:4242–4257
38. Zhuang H, Chan CK, Fang M et al (1999) Size distributions of
particulate sulfate, nitrate, and ammonium at a coastal site in
Hong Kong. Atmos Environ 33:843–853
39. Pitts JN Jr, Biermann HW, Winer AM et al (1984) Spectroscopic
identification and measurement of gaseous nitrous acid in dilute
auto exhaust. Atmos Environ 18:847–854
40. McHenry JN, Dennis RL (1994) The relative importance of
oxidation pathways and clouds to atmospheric ambient sulfate
production as predicted by the regional acid deposition model.
J Appl Meteorol Clim 33:890–905
41. Finlayson-Pitts BJ, Pitts JN Jr (1999) Chemistry of the upper and
lower atmosphere: theory, experiments, and applications. Aca-
demic Press, New York
42. Lefer BL, Talbot RW (2001) Summertime measurements of
aerosol nitrate and ammonium at northeastern U.S. site. J Geo-
phys Res 106:20365–20378
43. Yamasoe MA, Artaxo P, Miguel AH et al (2000) Chemical
composition of aerosol particles from direct emissions of vege-
tation fires in the Amazon Basin: water soluble species and trace
elements. Atmos Environ 34:1641–1653
44. Rogers CF, Hudson GJ, Zielinska B et al (1991) Global biomass
burning: atmospheric, climatic and biospheric implications. MIT
Press, Cambridge, MA
45. Novakov T, Corrigan CE (1996) Cloud condensation nucleus
activity of the organic component of biomass smoke particles.
Geophys Res Lett 23:2141–2144
46. Warneck P (1999) Chemistry of the natural atmosphere. Aca-
demic Press, London
47. Warneck P (2003) In-cloud chemistry opens pathway to the
formation of oxalic acid in the marine atmosphere. Atmos
Environ 37:2423–2427
48. Okada K, Ikegami M, Zaizen Y et al (2001) The mixture state of
individual aerosol particles in the 1997 Indonesian haze episode.
J Aerosol Sci 32:1269–1279
49. Chen LWA, Chow JC, Doddridge BG et al (2003) Analysis of a
summertime PM2.5 and haze episode in the mid-Atlantic region.
J Air Waste Manage Assoc 53:946–956
50. Yadav AK, Kumar K, Kasim A et al (2003) Visibility and inci-
dence of respiratory diseases during the 1998 haze episode in
Brunei Darussalam. Pure Appl Geophys 160:265–277
51. Sun YL, Zhuang GS, Tang AH et al (2006) Chemical charac-
teristics of PM2.5 and PM10 in haze-fog episodes in Beijing.
Environ Sci Technol 41:3148–3155
52. An JL, Li Y, Chen Y et al (2013) Enhancements of major aerosol
components due to additional HONO sources in the North China
Plain and implications for visibility and haze. Adv Atmos Sci
30:57–66
53. Decesari S, Facchini MC, Matta E et al (2001) Chemical features
and seasonal variation of water soluble organic compounds in the
Po valley fine aerosol. Atmos Environ 35:3691–3699
54. Decesari S, Fuzzi S, Facchini MC et al (2006) Characterization of
the organic composition of aerosols from Rondonia, Brazil,
during the LBA-SMOCC 2002 experiment and its representation
through model compounds. Atmos Chem Phys 6:375–402
55. Lim HJ, Turpin BJ (2002) Origins of primary and secondary
organic aerosol in Atlanta: results’ of time-resolved measure-
ments during the Atlanta supersite experiment. Environ Sci
Technol 36:4489–4496
56. Hennigan CJ, Bergin MH, Weber RJ (2008) Correlations between
water-soluble organic aerosol and water vapor: a synergistic
effect from biogenic emissions. Environ Sci Technol 42:
9079–9085
57. Wang Y, Zhuang GS, Tang AH et al (2007) The evolution of
chemical components of aerosols at five monitoring sites of China
during dust storms. Atmos Environ 41:1091–1106
58. Chow JC, Watson JG, Doraiswamy P et al (2009) Aerosol light
absorption, black carbon, and elemental carbon at the Fresno
Supersite, California. Atmos Res 93:874–887
59. Zhang Q, Jimenez J (2007) Ubiquity and dominance of oxy-
genated species in organic aerosols in anthropogenically-influ-
enced Northern Hemisphere midlatitudes. Geophys Res Lett
34:L13801. doi:10.1029/2007GL029979
60. Myhre CEL, Nielson CJ (2004) Optical properties in the UV and
visible spectral region of organic acids relevant to tropospheric
aerosols. Atmos Chem Phys 4:1759–1769
61. Garland RM, Ravishankara AR, Lovejoy ER et al (2007)
Parameterization for the relative humidity dependence of light
extinction: organic-ammonium sulfate aerosol. J Geophys Res
112:D19303. doi:10.1029/2006JD008179
62. Cheng Y, Wiedensohler A, Eichler H et al (2008) Aerosol optical
properties and related chemical apportionment at Xinken in Pearl
River Delta of China. Atmos Environ 42:6351–6372
63. Huang K (2010) The transformation of aerosol components
during the long-range transport of Asian dust and the formation
mechanism of haze in mega-city, China. Dissertation, Fudan
University (in Chinese)
64. Zhang RY, Suh I, Zhao J et al (2004) Atmospheric new particle
formation enhanced by organic acids. Science 304:1487–1490
238 Chin. Sci. Bull. (2014) 59(2):227–238
123