Optometry & Visual Performance 87 Volume 6 | Issue 2 | 2018, April Article Comparison of Backlit and Novel Automated ETDRS Visual Acuity Charts Paul A. Harris, OD, Southern College of Optometry, Memphis, Tennessee Laurel E. Roberts, Southern College of Optometry, Memphis, Tennessee Rachel Grant, OD, Southern College of Optometry, Memphis, Tennessee ABSTRACT Background: This study was conducted to compare two different methods and presentation systems of testing visual acuity to determine whether they are equivalent. Methods: We compared the results of taking visual acuity (VA) measures with the standard backlit Early Treatment of Diabetic Retinopathy Study (backlit ETDRS) and Automated ETDRS (A-ETDRS) VA charts (M&S Technologies, Inc., Niles, IL) on 111 healthy subjects with corrected visual acuity of 20/20 or better. Testing was done under four conditions— with spectacles, uncorrected, with +1.50 blur over spectacles, and with +3.00 blur over spectacles—to assess correlation of primary outcomes between charts across a wide range of acuity measures. Visual acuity measures were recorded in letter count, logMAR, and standard Snellen measures. Results: Correlations between the backlit ETDRS and the A-ETDRS chart types were 0.93 (uncorrected), 0.60 (with spectacles), 0.76 (+1.50 blur over spectacles), and 0.50 (+3.00 blur over spectacles), with all correlations statistically significant at p< 0.001. Conclusion: This study shows that traditional backlit ETDRS and A-ETDRS charts are functionally equivalent to each other under a variety of testing conditions, mimicking both clinical and research applications. Additional benefits of the automated system over the backlit charts include: the ability to calibrate the system precisely, faster testing and scoring times combined, and less chance for error to enter into the conversion of the raw data into logMAR, letter, or Snellen scores. For all of these reasons, Automated-ETDRS testing is preferred. Keywords: automated testing, backlit screen, digital screen display, Early Treatment of Diabetic Retinopathy Study, electronic vision chart, ETDRS, logMAR, optotype, Snellen, Visual acuity Background Visual acuity is one of the most important tools in determining visual function and has been established as the “gold standard” in prospective clinical trials, especially regarding eye disease and treatment. 1,2 The assessment of visual acuity with optotype charts is the most standardized test of visual function. These high-contrast printed charts include black optotypes, letters, or symbols on a white background and are externally illuminated. The charts allow a diverse patient population to be tested. Theoretically, visual acuity testing should give a precise, reproducible, and reliable result that represents the state of macular function. The testing further implies that any acuity changes are related to disease or treatment. However, visual acuity can be influenced and altered by external factors, including but not limited to exam room lighting, contrast, design of the chart, subject motivation, and scoring technique. 3,4
Article Comparison of Backlit and Novel Automated ETDRS Visual Acuity Charts
Paul A. Harris, OD, Southern College of Optometry, Memphis, Tennessee
Laurel E. Roberts, Southern College of Optometry, Memphis, Tennessee
Rachel Grant, OD, Southern College of Optometry, Memphis, Tennessee
ABSTRACT
Background: This study was conducted to compare two different methods and presentation systems of testing visual acuity to determine whether they are equivalent.
Methods: We compared the results of taking visual acuity (VA) measures with the standard backlit Early Treatment of Diabetic Retinopathy Study (backlit ETDRS) and Automated ETDRS (A-ETDRS) VA charts (M&S Technologies, Inc., Niles, IL) on 111 healthy subjects with corrected visual acuity of 20/20 or better. Testing was done under four conditions—with spectacles, uncorrected, with +1.50 blur over spectacles, and with +3.00 blur over spectacles—to assess correlation of primary outcomes between charts across a wide range of acuity measures. Visual acuity measures were recorded in letter count, logMAR, and standard Snellen measures.
Results: Correlations between the backlit ETDRS and the A-ETDRS chart types were 0.93 (uncorrected), 0.60 (with spectacles), 0.76 (+1.50 blur over spectacles), and 0.50 (+3.00 blur over spectacles), with all correlations statistically significant at p< 0.001.
Conclusion: This study shows that traditional backlit ETDRS and A-ETDRS charts are functionally equivalent to each other under a variety of testing conditions, mimicking both clinical and research applications. Additional benefits of the automated system over the backlit charts include: the ability to calibrate the system precisely, faster testing and scoring times combined, and less chance for error to enter into the conversion of the raw data into logMAR, letter, or Snellen scores. For all of these reasons, Automated-ETDRS testing is preferred.
Keywords: automated testing, backlit screen, digital screen display, Early Treatment of Diabetic Retinopathy Study, electronic vision chart, ETDRS, logMAR, optotype, Snellen, Visual acuity
BackgroundVisual acuity is one of the most important
tools in determining visual function and has been established as the “gold standard” in prospective clinical trials, especially regarding eye disease and treatment.1,2 The assessment of visual acuity with optotype charts is the most standardized test of visual function. These high-contrast printed charts include black optotypes, letters, or symbols on a white background and are externally illuminated.
The charts allow a diverse patient population to be tested. Theoretically, visual acuity testing should give a precise, reproducible, and reliable result that represents the state of macular function. The testing further implies that any acuity changes are related to disease or treatment. However, visual acuity can be influenced and altered by external factors, including but not limited to exam room lighting, contrast, design of the chart, subject motivation, and scoring technique.3,4
The Snellen eye chart is the most widely used method of visual acuity measurement in clinical practice, in part due to its ease of use and availability. Snellen’s original chart had a single large letter at the top, and with each successive row, the letters became more numerous and progressively smaller.5 The letters are not equal in their legibility; there is also unequal letter and line spacing.4,6,7 In addition, since its original conception, many variations in size, sequence, chart layout, and design of the optotypes were made; subsequently, there is no broadly accepted “standard” Snellen chart.5 Most commonly, visual acuity measurements are determined under high-contrast conditions, as previously mentioned. Over time, the required contrast level for the chart can be impacted by stains and fading, which may alter reflectivity. Room position and room illumination may also introduce variability.3
ETDRS StandardsThe Early Treatment of Diabetic Retinopathy
Study (ETDRS) chart is based on the previously designed Bailey-Lovie logMAR chart to establish a standardized measurement of visual acuity. The inclusion of administration and scoring protocols serves to improve the precision of visual acuity measurement in the range of poorer visual acuities.5 The ETDRS chart
has been recognized to be highly reliable for vision testing1 and has been considered one of the standard tools for measuring acuity in prospective clinical research for more than 30 years.1,8,9 Each Sloan letter on the ETDRS chart (ten in total) has approximately equal legibility or difficulty, and each line has the same overall difficulty.10 Each row contains five letters, with the spacing between each letter being equal to the width of one letter and the space between lines being equal in height to the letters of the next lower line.10 The letter size from row to row changes in equal logarithmic intervals.4,6 The chart itself is non-reflective, white, high-impact polystyrene with the black letters creating a contrast level of approximately 90%. The accompanying light box produces a standardized illumination of 120 cd/m2, which conforms to the ANSI specifications.3,11,12 All other light sources in the room should be turned off to reduce any potential glare sources.
Although considered the standard for clinical research, ETDRS and other logMAR charts are not widely used in clinical practice.16 As evidence of this, at Southern College of Optometry, the 90+ clinical testing lanes and the 50+ student practice lanes are equipped with computer-based chart systems, while there are only two ETDRS charts in place for compliance with specific FDA clinical protocols. This ratio is similar in most North American optometry schools. It is thought that the test format, including the length of test administration, unfamiliar scoring,
Figure 1. The backlit ETDRS chart with the A-ETDRS computer screen behind. The backlit chart starts at 20/200, while the A-ETDRS chart starts at 20/100. The sizes of the letters and spacing from 20/100 to 20/10 are exactly the same.
user of A-ETDRS. In many clinical studies, subjects spend a great deal of time, under many different conditions, reading the backlit ETDRS charts from top to bottom, over and over. Since there are only three different charts, which must be manually changed, there is a chance that subjects could begin to know some of the letter sequences in those charts. This could lead to an overestimation of their visual acuity, which is not related to the specific testing or experimental condition. Randomization of each “chart” in the A-ETDRS configuration would eliminate memorization from prior exposures, thus increasing the validity of the measure.
An additional benefit that would result from the aim being met is increased reliability in the calculation of the letter count, from which the logMAR and/or visual acuity measure is derived. The standard backlit ETDRS charts must be manually scored. This process is highly repetitive and adds time to the process of getting the letter count. The A-ETDRS system immediately provides the user with all of the scores needed, without the need for a separate recording system or the counting or calculation of any of the scores. This should save time and guarantee that the measures reported are indeed the measures obtained.
This study also addresses some of the issues raised in discussion of some early attempts to computerize the ETDRS testing process.17 Issues that have been raised include pixelation of the letters on the computer screen, where individual pixels are visible to the naked eye, and anti-aliasing.a These specifically affect the ability cleanly to present letters smaller than 20/20 on older computer monitors. Smaller screens limit the size of the largest letter that can be shown to a subject. Larger computer monitors with smaller pixels, packed much more closely together on the screen in both the vertical and horizontal dimensions (dot pitch), combine to allow for much larger letters than before, while being able to present letters down
and patients memorizing letter sequences, as well as the inherent difficulty in discussing logMAR acuity with patients, contribute to the practical limitations.9,14,15
The standard ETDRS chart is a large, floor-mounted, backlit device that takes up a significant amount of space and requires manual changes amongst the three provided plastic sheets (Figure 1).
The Automated ETDRS chart (A-ETDRS; M&S Technologies, Inc., Niles, IL),5 which is part of the Clinical Trial Suite offered by M&S, has the potential to make the test more portable, more difficult to memorize, easier to score, and it may speed up testing time (Figure 2).
Computerized Testing Technological advancements have improved
the incorporation of technology, such as computer-based displays, in all facets of health care, including electronic vision testing. Various forms of electronic and automated displays exist on the market and continue to gain popularity with patients and practitioners alike. The inevitable trend towards using more computer-based displays for the measurement of visual acuity has specific research advantages that come from computer control of visual displays for measuring visual acuity.5 Computer displays can provide selectable options, such as optotypes, spacing and crowding arrangements, contrast, and color. Research has shown that another advantage of a computerized acuity system is the ability to increase the test-retest repeatability through repetition and averaging of measurements.8,16 Furthermore, a computer-based acuity chart allows random order presentation and automated processing.8
Purpose This study was conducted to compare two
different methods and presentation systems of testing visual acuity to determine whether they are equivalent. Should that aim be met, then additional benefits would accrue to the
to wear their spectacle correction. This made the randomization of the uncorrected conditions on both the backlit and the A-ETDRS charts less time-consuming than if we had our subjects remove their contact lenses and then readapt to them for the next condition.
All testing was done binocularly in a room where the only illumination came from the two charts. Both displays were on all the time. Whenever a backlit chart was to be used for testing, one of the three charts was selected based on a randomization table. It should be noted that for each subject, four different measures were made on the backlit chart, but there are only three different charts. Each chart had an equal chance of being used at any time. Although it was time-consuming to change the charts manually, it was done to minimize any chance of a subject memorizing the charts, as well as to simulate formal research protocols. In the cases where the randomization table indicated that the same backlit chart was to be used again, the researcher went through the chart changing routine and simply put the prior chart back in position. This was to encourage the thought in the subjects that the charts were different each time.
When the backlit ETDRS charts were used, printed score sheets were available for each of the three charts. The appropriate score sheet was selected, and the subject was asked to read each letter distinctly from the top of the chart. Every letter was marked on the recording form as either correct or incorrect. The total number of letters correct was recorded, and a conversion chart was used to derive the logMAR and Snellen score for that condition.
The protocol used to measure visual acuity with these charts followed standard ETDRS research protocol, where for every measurement, letters were read at a speed of one per second, beginning at the top left of the chart and proceeding line by line, left to right, with an opportunity to correct an error only before the next letter was attempted. The
to 20/8 Snellen visual acuity levels. Aliasingb occurs in computer graphics when a screen cannot render as smooth a curve as intended and it appears on the screen as jagged. When viewed extremely closely, what is seen are small steps rather than smooth curves. Anti-aliasing software has been used to attempt to minimize these effects. The typical panel displays used now in these systems do not need anti-aliasing software because of the smaller dots, which are packed much more closely together. The M&S Technologies Smart System II used in this study has a 22-inch digital flat panel screen with a resolution of 1680 x 1050.
Lastly, the new control systems, which use a separate tablet with built-in scoring, should allow for faster data collection times.
Methods One hundred and eleven (N=111) second-
and third-year students from Southern College of Optometry (SCO), with corrected visual acuity of 20/20 or better binocularly, had their visual acuity taken eight separate times, with each of the conditions being randomized. Visual acuity was measured four different times on each of the two different types of charts. The four conditions for each chart included: with spectacles, without spectacles, with +1.50 spheres over spectacles, and with +3.00 spheres over spectacles. For each subject, randomization was across all 8 conditions, and all testing was done on the same day at a single sitting. The randomization table was generated by research randomizer.c All testing was done at 4 meters. The standard ETDRS protocol has the subject wearing a +0.25 DS lens to compensate for this distance. The +0.25 lens was not used in any of our 8 test conditions. We created the two pairs of spectacles for testing, one pair of +1.50 spheres and the other of +3.00 spheres, in frames large enough to allow them to be worn over the subjects’ own spectacles without difficulty. Those subjects who wore contact lenses were asked not to wear their contact lenses on the day of testing, but instead
procedures for encouraging letter recognition and the stopping rule are standardized. Training materials for Ophthalmic Clinical Trial Training and Certification are available from the Emmes Corporation.d The researchers did not anticipate any of the subjects triggering the standard protocol for the conditions when visual acuity was worse than 20/200. When this was encountered, the A-ETDRS program returned a standard value of 20/250 and a letter count of 34, and similar results were recorded with the backlit ETDRS chart. The portion of the standardized testing protocol used to change the working distance to one meter was not done.
The A-ETDRS uses an Android tablet with the M&S Technologies, Inc. custom control program, which synchronizes with the main Smart System through a Bluetooth connection. Each time the protocol is run, the chart provides a random sample of the 10 ETDRS letters, making memorization of the chart impossible. There are two phases of determining the endpoint
of visual acuity measures, range-finding and thresholding. During the range-finding phase, the subject finds the smallest line of letters that they believe they can read completely correctly and proceeds to read them aloud. The operator presses the button on the control software that corresponds to that line of letters. Figure 3 shows the screen from the tablet. The letters shown to the subject on the display screen are also displayed to the operator on the tablet.
Figure 4 shows the screen that the subject would see after the operator presses the number 20 on the tablet’s screen, indicating that the subject got all the letters correct on the 20/20 line but made a mistake on the 20/16 line. At this point, the program switches to the thresholding phase. Now the tablet asks the operator to specify how many letters the subject correctly reports on each subsequently smaller line and finally stops either when the subject is unable to get any letters correct on the next smaller line or no more smaller lines exist to be shown.
After the A-ETDRS testing is complete, the system saves the results and reports the test results to the main screen, which can be printed. A sample set of data includes the eye (Right, Left, or Both), test distance (4 meters in this protocol), spectacles (on or off), light level (photopic vs. mesopic), and the visual acuity results in three forms (letter score, visual acuity, and logMAR). The letter score is the total number of letters that the subject said correctly, which results in a standard Snellen equivalent and a logMAR score. For example, a letter score of 87 converts to a Snellen VA of 20/20 and a logMAR score of -0.04.
Test times were measured for all trials using a stopwatch function on the investigator’s smart phone. Timing started as soon as the A-ETDRS chart was presented and terminated when the program displayed the scores to the computer screen for recording. For the backlit chart, timing was started when the subject said the first letter and finished when they were no
Figure 3. Android tablet with control program showing the lines from 20/50 to 20/16 in the red background area. Pressing the “Up” or the “Down” buttons on the screen changes the display to different parts of the chart.
longer able to get any letters correct. Time to change the plastic test cards in the backlit box was not included in the timing, nor was the time to count and score the subject’s results.
Weber Contrast was calculated for each of the targets using measurements collected with the Konica-Minolta LS-110 luminance meter, which measures the amount of reflected or emitted light from an area of 0.33 of a degree. On the backlit box, the white area was 181 cd/m2, while the black was 1.35 cd/m2. This produced a Weber Contrast of 99.25%. On the M&S Technologies A-ETDRS screen, the white was 120 cd/m2, and the black was 0.72 cd/m2, which produced a Weber Contrast of 99.4%. The backlit box was not adjustable in luminance. The M&S system was at its calibrated light value of 120 cd/m2. Both are compliant with ANSI Z80.21-2010 (R2015) and ISO 8597:1994(E) standards.11,12
All subjects gave informed consent after a verbal and written explanation of the experiment, which was approved by the Southern College of Optometry Institutional Review Board in accordance with the Declaration of Helsinki.
Statistical AnalysisMeasurement of visual acuity with the ETDRS
charts yields two different scores. The first is a Letter Score, which is a count of the total number of letters correct from the largest letter until the subject stops getting letters correct.
There is also a calculated logMAR visual acuity level assigned to this value.
LogMAR scores for both Backlit ETDRS and A-ETDRS chart types were compared under each of four testing conditions (uncorrected, with spectacles, +1.50 blur over spectacles, and +3.00 blur over spectacles) using paired t-tests. Findings were also confirmed using non-parametric alternatives (Wilcoxon sign-rank tests), as well as a repeated measures analysis of variance (ANOVA), which yielded the same conclusions. Thus, for ease of presentation, the mean comparisons of each chart type at each testing condition are shown here. Bland-Altman plots were used to illustrate agreement between A-ETDRS and Backlit ETDRS chart types. Correlations between A-ETDRS and Backlit ETDRS chart types were examined using Pearson’s r.
Results Analyses were conducted using Stata/SE
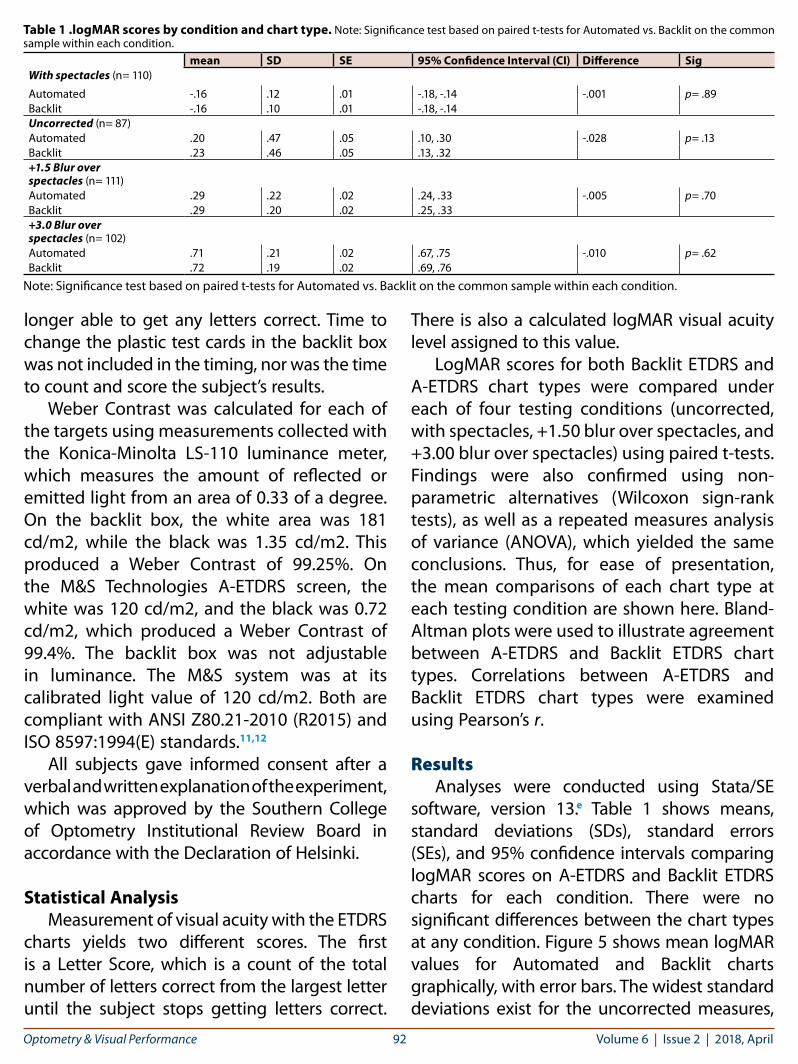
software, version 13.e Table 1 shows means, standard deviations (SDs), standard errors (SEs), and 95% confidence intervals comparing logMAR scores on A-ETDRS and Backlit ETDRS charts for each condition. There were no significant differences between the chart types at any condition. Figure 5 shows mean logMAR values for Automated and Backlit charts graphically, with error bars. The widest standard deviations exist for the uncorrected measures,
Table 1 .logMAR scores by condition and chart type. Note: Significance test based on paired t-tests for Automated vs. Backlit on the common sample within each condition.
mean SD SE 95% Confidence Interval (CI) Difference SigWith spectacles (n= 110)
Figure 5. Mean logMAR values for Automated and Backlit EDTRS charts
Figure 6. Bland-Altman plot for the “with spectacles” condition.
Figure 7. Bland-Altman plot for the “uncorrected” condition.
Figure 8. Bland-Altman plot for the “+1.50 blur over spectacles” condition.
Figure 9. Bland-Altman plot for the “+3.00 blur over spectacles” condition.
and here the visual acuities measured trended to be worse with the backlit ETDRS. However, the differences were neither statistically nor clinically significant. Figures 6 to 9 show Bland-Altman plots for each study condition, which plot the difference of the paired chart vs. their average. There were only very few cases where individual values fell outside the range of agreement.
Correlations between Automated and Backlit chart types were 0.93 (uncorrected), 0.60 (with spectacles), 0.76 (+1.50 blur over spectacles), and 0.50 (+3.00 blur over spectacles), with all correlations statistically significant at p< 0.001.
It was decided to eliminate any data points in the Bland-Altman plots when one or both logMAR values was greater than 1.0, because we had not anticipated that we would have significant numbers of these measures. Indeed, only 9 subjects in the +3.00 blur and 24 subjects
in the uncorrected conditions had one or more logMAR measures greater than 1.0. This accounted for the different number of subjects in each direct comparison. Figure 6 shows the Bland-Altman plot for the “with spectacles” condition. Three of the 110 subjects (2.73%) fell outside the 95% limits of agreement.
Figure 7 shows the Bland-Altman plot for the “uncorrected” condition. Three of the 87 subjects (3.45%) fell outside the 95% limits of agreement. The number of subjectsfor this condition was the smallest, because 24 of the subjects had either the A-ETDRS or the backlit ETDRS visual acuity worse that 1.0 logMAR and therefore were not included in the analysis.
Figure 8 shows the Bland-Altman plot for the “+1.50 blur over spectacles” condition. Four of the 111 subjects (3.6%) fell outside the 95% limits of agreement.
Figure 9 shows the Bland-Altman plot for the “+3.00 blur over spectacles” condition. Six of the 102 subjects (5.88%) fell outside the 95% limits of agreement. The N for this condition was reduced to 102 as nine subjects had either the A-ETDRS or the backlit ETDRS visual acuity worse than 1.0 logMAR.
The authors independently took the raw scores from the A-ETDRS testing and verified that the computer algorithm indeed yielded the correct Letter and logMAR Scores for each measurement for the first 20 subjects.
Timing data for all 444 trials on the A-ETDRS chart across all conditions averaged 21.24 seconds (SD 18.6 seconds), with a range from 3 to 180 seconds. The average time varied across the conditions, with the corrected measures averaging the fastest (24.88 seconds SD 9.9 seconds) The “+3.00 blur over spectacles” condition averaged 39.1 seconds (SD 25.7). Timing data for all 444 trials on the backlit ETDRS averaged 18.7 seconds (SD 11.9 seconds), with a range from 2 to 117 seconds. This was only the time to perform the test and did not include the time to score the results or to change the chart prior to starting each trial (Table 2).
Discussion The four different testing conditions for each
chart were chosen to represent both real-world conditions (uncorrected and with spectacles) as well as some research-based conditions (simulated 1.50 D and 3.00 D of uncorrected myopia). We did not anticipate any of our subjects triggering the standard protocol for the conditions when visual acuity was worse than 20/200. When this was encountered, the A-ETDRS program returned a standard value of 20/250 and a letter count of 34. As we reviewed the results, nine subjects in the “+3.00 blur over spectacles” and 24 subjects in the “uncorrected” group had visual acuities worse than 20/200, or logMAR greater than 1.0. In future studies, we will repeat measures in those conditions following the standard protocol, which is to reduce the working distance to one meter and repeat the testing. In that setup, the 20/200-sized letters at four meters are equivalent to 20/800 at one meter. This was not done. Measures where the visual acuity was greater than logMAR 1.0 were removed for analysis. This did not affect any measures in either the “spectacles” or the “+1.50 blur over spectacles” groups.
CalibrationIn formal research settings, having testing
instruments able to be calibrated is a must. Many individual systems are used for periods of years. Though the backlit ETDRS systems have been the gold standard for many years, there is no easy way to calibrate them, short of changing bulbs until the measured luminance levels are within standards. Luminance of the bulbs in the units varies, and the plastic sheets
are prone to yellowing over time, which reduces contrast. The A-ETDRS systems ship with a luminance measuring system, the use of which is integrated into the system. Periodically, as prompted by the software, the measuring system is suspended directly in front of the screen, and the system varies the illumination to reach the exact specified amount of 120 cd/m2. Both the bright and dark luminance measures are taken and adjusted to ensure proper calibration, within very tight tolerances. This is a major advantage of the A-ETDRS system over the backlit ETDRS targets.
Randomized lettersTwo major advantages accrue to those
using A-ETDRS over standard backlit charts. The scoring step is eliminated, from the hard copy made during the testing to however the results are being recorded. The first benefit is that errors are eliminated in the calculation of the score. Others have reported that in their experience, manual recording systems are prone to error.18 A second benefit is that about 30 seconds are saved, which is the typical time it takes to do the actual scoring.19
Time Saving from AutomationThe new A-ETDRS is faster to use than
standard ETDRS testing when scoring time on the standard ETDRS charts was added to the time needed to perform the test. The A-ETDRS system automatically scores the trial and shows all measures (letter score, Snellen visual acuity, and logMAR) immediately after the testing. All 444 A-ETDRS tests averaged 21.2 seconds (SD 18.6 seconds). Laidlaw et al. found an average time for standard EDTRS measures of 56 seconds with adult populations, and on average their computerized system was 7-10 seconds slower.18 Timing for each of the backlit ETDRS trials was recorded in our study, but these did not include the time spent scoring each of the results. We only recorded the raw data for each trial on the matching score sheet for that trial, but we did
not take the time to perform the letter count and corresponding conversion to logMAR while the subject was present. We neglected to record the time it took for scoring the data as we did it during downtime between subject sittings, and we did not add in the time to change the backlit ETDRS charts, which would affect this comparison even more. In a future study, the timing of the scoring and conversion to logMAR values as well as changing the charts should be done for each data point to be comparing like entities.
Conclusions The findings of this study show that the
traditional and automated ETDRS charts are functionally equivalent to each other under a variety of testing conditions, mimicking both clinical and research applications. Use of the A-ETDRS system by M&S Technologies is faster and less prone to recording errors or calculation errors, can be calibrated regularly, and is very easy. These findings set the stage for the adoption of the A-ETDRS chart by M&S Technologies in any clinical research study or clinical trial setting that calls for ETDRS testing.
AcknowledgmentsThank you to: Jan Gryczynski, PhD, Founding Partner COG Analytics, Potomac, MD, for his assistance with the statistics in this paper.
References1. Beck R, Moke P, Turpin A, et al. A computerized method of
visual acuity testing: Adaptation of the early treatment of diabetic retinopathy study testing protocol. Am J Ophthalmol 2003;135:194-205. http://bit.ly/2qH31bW
2. Ferris FL, Bailey I. Standardizing the measurement of visual acuity for clinical research studies: Guidelines from the Eye Care Technology Forum. Ophthalmology 1996;103:181-2. http://bit.ly/2HavdyP
3. Ehrmann K, Fedtke C, Radić A. Assessment of computer generated vision charts. Cont Lens Anterior Eye 2009;32:133-40. http://bit.ly/2qJJt6C
4. Williams MA, Moutray TN, Jackson AJ. Uniformity of visual acuity measures in published studies. Invest Ophthalmol Vis Sci 2008;49:4321-7. http://bit.ly/2qJCdb7
5. Bailey IL, Lovie-Kitchin JE. Visual acuity testing. From the laboratory to the clinic. Vision Res 2013;90:2-9. http://bit.ly/2HdOhMA
6. Rosser D, Laidlaw D, Murdoch IE. The development of a “reduced logMAR” visual acuity chart for use in routine clinical practice. Br J Ophthalmol 2001;85:432-6. http://bit.ly/2qHCqLO
7. Ferris FL 3rd, Sperduto RD. Standardized illumination for visual acuity testing in clinical research. Am J Ophthalmol 1982;94:97-8. https://go.nature.com/2qJD37J
8. Rosser D, Murdoch IE, Fitzke FW, Laidlaw DAH. Improving on ETDRS acuities: Design and results for a computerised thresholding device. Eye 2003;17:701-6. http://bit.ly/2H9qrSu
9. Ferris FL, Bailey I. Standardizing the measurement of visual acuity for clinical research studies: Guidelines from the Eye Care Technology Forum. Ophthalmology 1996;103(1):181-2. http://bit.ly/2qISQDM
10. Ferris FL 3rd, Kassoff A, Bresnick GH, et al. New visual acuity charts for clinical research. Am J Ophthalmol 1982;94:91-6. http://bit.ly/2H9RQn3
11. American National Standards Institute, Inc. American National Standards for Ophthalmics – Instruments – General-Purpose Clinical Visual Acuity Charts, ANSA Z80.21-2010 (R2015), The Vision Council, Alexandria, VA. http://bit.ly/2qEMfds
12. Technical Committee ISO/TC 172, Optics and optical instruments – Visual acuity testing – method of correlating optotypes, International Standard ISO 8597, International Organization of Standardization 1984, Genève, Switzerland. http://bit.ly/2qIwfXO
13. Kaiser PK. Prospective evaluation of visual acuity assessment: A comparison of Snellen versus ETDRS charts in clinical practice (An AOS Thesis). Trans Am Ophthalmol Soc 2009;107:311-24. http://bit.ly/2qMtYLw
14. Lovie-Kitchin JE. Validity and reliability of visual acuity measurements. Ophthalmic Physiol Opt 1998;8:363-70. http://bit.ly/2HbPFjb
15. Kuo HK, Kuo MT, Tiong IS, et al. Visual acuity as measured with Landolt C chart and Early Treatment of Diabetic Retinopathy Study (ETDRS) chart. Graefes Arch Clin Exp Ophthalmol 2011;249:601-5. http://bit.ly/2qKEjY7
16. Shah N, Laidlaw DAH, Shah SP, et al. Computerized repeating and averaging improve the test-retest variability of ETDRS visual acuity measurements: Implications for sensitivity and specificity. Invest Ophthalmol Vis Sci 2011;52:9397-402. http://bit.ly/2HehuHC
17. McClenaghan N, Kimura A, Stark LR. An evaluation of the M&S Technologies Smart System II for visual acuity measurement in Young Visually-Normal Adults. OVS 2007;84:3:218-23. http://bit.ly/2HehuHC
18. Laidlaw DAH, Tailor V, Shah N, Atamian S, Harcourt C. Validation of a computerised logMAR visual acuity measurement system (COMPlog): comparison with ETDRS and the electronic ETDRS testing algorithm in adults and amblyopic children. J Ophthalmol 2008;92:241-4. http://bit.ly/2qHDVJW
19. Bokinni Y, Shah N, Maquire O, Laidlaw DAH. Performance of a computerised visual acuity measurement device in subjects with age-related macular degeneration: Comparison with gold standard ETDRS chart measurements. Eye 2015;29:1085-91. http://bit.ly/2qIJic1
a. https://goo.gl/U3zCunb. https://goo.gl/tbzBN5c. https://www.randomizer.orgd. https://goo.gl/qaYrTue. https://www.stata.com
Correspondence regarding this article should be emailed to Paul A. Harris, OD, MS, at [email protected]. All statements are the author’s personal opinions and may not reflect the opinions of the representative organizations, ACBO or OEPF, Optometry & Visual Performance, or any institution or organization with which the author may be affiliated. Permission to use reprints of this article must be obtained from the editor. Copyright 2018 Optometric Extension Program Foundation. Online access is available at www.acbo.org.au, www.oepf.org, and www.ovpjournal.org.
Harris PA, Roberts LE, Grant R. Comparison of backlit and novel automated etdrs visual acuity charts. Optom Vis Perf 2018;6(2):87-96.