a Department of Environmental Health Sciences, Mailman School of Public Health, Columbia University, New York, NY 10032, USA b Department of Civil and Environmental Engineering, Massachusetts Institute of Technology, Cambridge, MA 02139, USA
a r t i c l e i n f o
Article history:
Received 30 April 2016
Revised 30 August 2016
Accepted 5 October 2016
Available online xxx
Keywords:
Malaria
Hysteresis
Initial conditions
Immunity
Environmental drivers
a b s t r a c t
Malaria transmission is a complex system and in many parts of the world is closely related to climate
conditions. However, studies on environmental determinants of malaria generally consider only concur-
rent climate conditions and ignore the historical or initial conditions of the system. Here, we demonstrate
the concept of hysteresis in malaria transmission, defined as non-uniqueness of the relationship between
malaria prevalence and concurrent climate conditions. We show the dependence of simulated malaria
transmission on initial prevalence and the initial level of human immunity in the population. Using re-
alistic time series of environmental variables, we quantify the effect of hysteresis in a modeled popula-
tion. In a set of numerical experiments using HYDREMATS, a field-tested mechanistic model of malaria
transmission, the simulated maximum malaria prevalence depends on both the initial prevalence and the
initial level of human immunity in the population. We found the effects of initial conditions to be of
comparable magnitude to the effects of interannual variability in environmental conditions in determin-
ing malaria prevalence. The memory associated with this hysteresis effect is longer in high transmission
settings than in low transmission settings. Our results show that effort s to simulate and forecast malaria
transmission must consider the exposure history of a location as well as the concurrent environmental
T.K. Yamana et al. / Advances in Water Resources 0 0 0 (2016) 1–7 3
ARTICLE IN PRESS
JID: ADWR [m5G; October 19, 2016;20:6 ]
Fig. 1. Schematic of HYDREMATS model.
Fig. 2. Annual rainfall for each of the four climate sequences used in Experiment 1. The x-axis indicates the year of observed rainfall data used to maufacture the synthetic
rainfall sequences.
t
s
2
m
➢ Scenario 2: Wet years followed by dry years in a descending
order followed by observed sequence in 2009–2012
➢ Scenario 3: Dry years followed by wet years in an ascending
order followed by observed sequence in 2009–2012
➢ Scenario 4: Alternating wet and dry years followed by observed
sequence in 2009–2012 m
Please cite this article as: T.K. Yamana et al., Hysteresis in simulation
http://dx.doi.org/10.1016/j.advwatres.2016.10.003
Differences in simulated 2009–2012 malaria transmission be-
ween the four scenarios would indicate the presence of hystere-
is in the system. The initial malaria prevalence was set to be
7% of the population, based on the Malaria Atlas Project esti-
ate for the study location. Each individual person’s initial im-
unity level was assumed to be proportional to his/her initial age
s of malaria transmission, Advances in Water Resources (2016),
T.K. Yamana et al. / Advances in Water Resources 0 0 0 (2016) 1–7 5
ARTICLE IN PRESS
JID: ADWR [m5G; October 19, 2016;20:6 ]
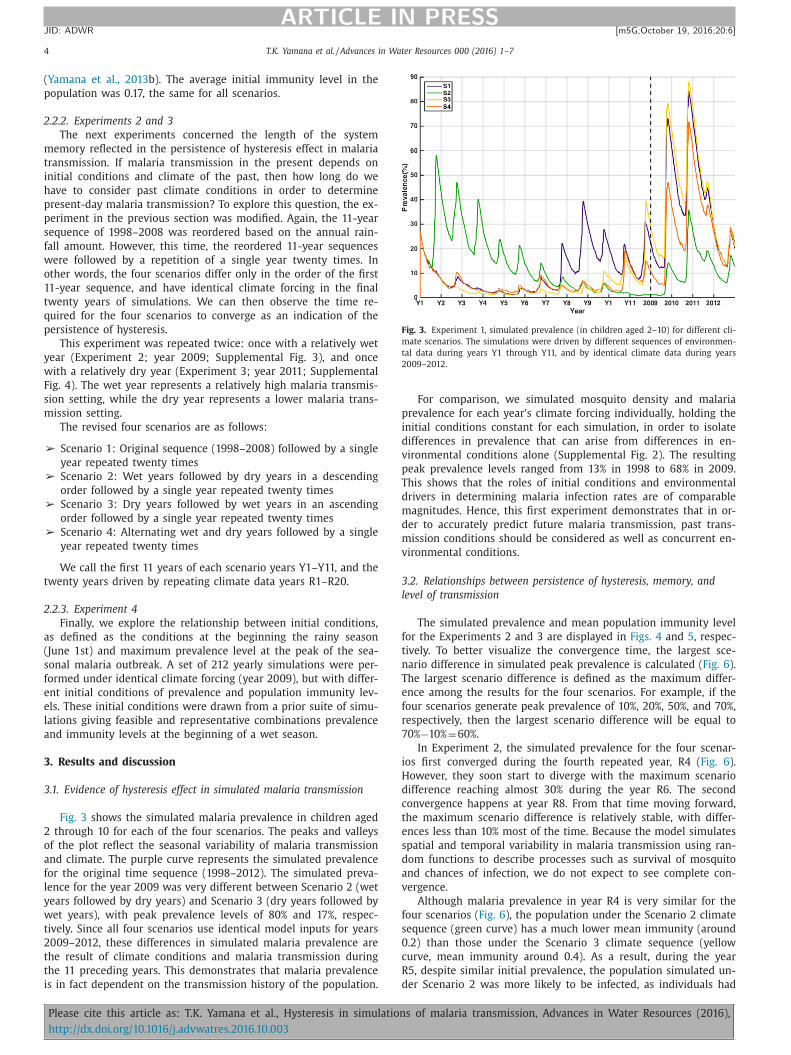
Fig. 4. Simulation results from Experiment 2 in high malaria transmission setting. The simulations were driven by different sequences of environmental data during years
1 through 11 (labeled Y1–Y11), and by identical climate data (observed data from 2009) during years 12 through 31 (labeled R1–R20). The upper panel shows simulated
malaria prevalence and the lower panel shows simulated mean immunity index.
Fig. 5. Maximum difference in simulated peak malaria prevalence between the four
scenarios in Experiment 2 (blue) and Experiment 3 (green). The simulations were
driven by different sequences of environmental data during years Y1–Y11, and by
identical climate data (observed data from 2009 for Experiment 2, 2011 for Exper-
iment 3) during years R1–R20. (For interpretation of the references to color in this
figure legend, the reader is referred to the web version of this article.)
l
e
r
t
c
t
t
t
2
c
c
y
c
t
i
t
3
l
s
i
p
t
t
t
t
b
t
r
i
i
t
i
i
f
3
i
t
i
ower levels of immunity. The memory of the conditions experi-
nced during the first 11 years lasted 8 years under year 2009’s
elatively wet climate forcing.
In Experiment 3 (repeating conditions for the year 2011 twenty
imes), immunity levels converge in year R3, and the prevalence
urves converge in year R4, implying that memory of the condi-
ions experienced during the first 11 years lasts only 4 years under
he relatively dry 2011’s climate forcing.
To compare the case of repeating climate conditions for 2011
wenty times with the case repeating the climate conditions for
009 twenty times, the annual maximum prevalence for the two
Please cite this article as: T.K. Yamana et al., Hysteresis in simulation
http://dx.doi.org/10.1016/j.advwatres.2016.10.003
ases are presented in Fig. 5 . The annual maximum prevalence
onverges in year R4 under 2011’s climate forcing, and converges in
ear R8 under 2009’s climate forcing. Therefore our results suggest,
onsistent with the findings of Laneri et al. (2015 ), that the persis-
ence of the hysteresis effect is stronger, and the system’s memory
s longer, in high malaria transmission settings than in low malaria
ransmission settings.
.3. Relationship between initial conditions and maximum prevalence
evel
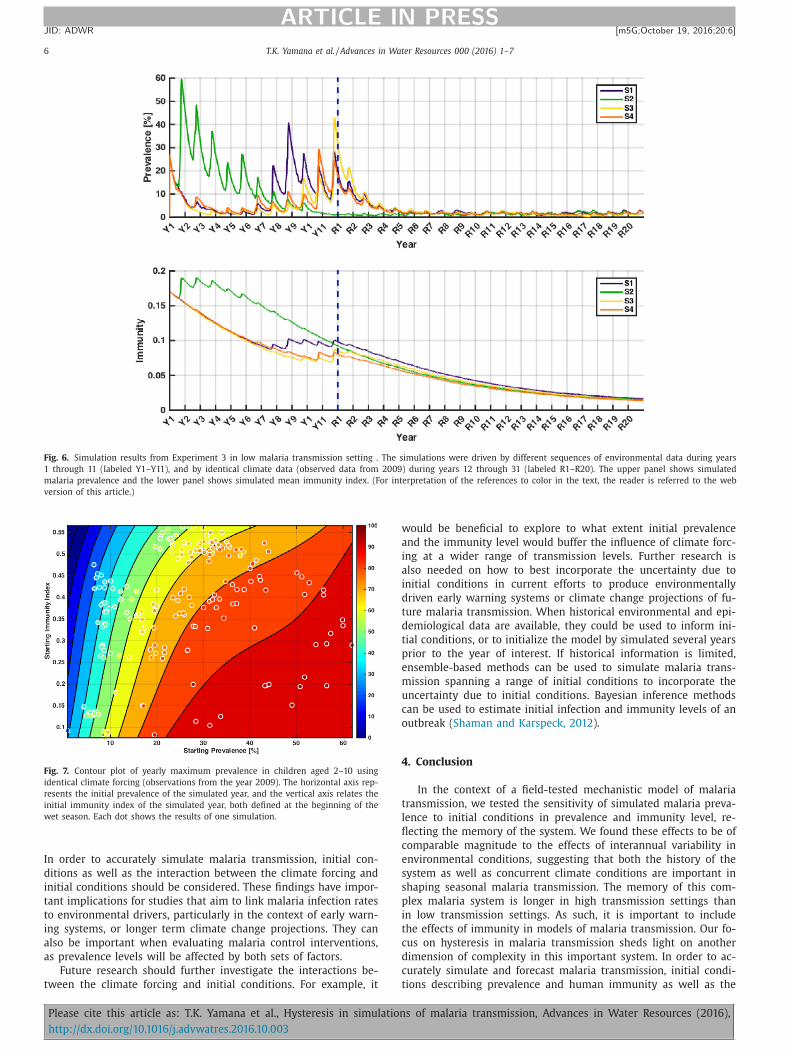
Fig. 7 displays the annual maximum prevalence level for 212
imulated years under the year 2009’s climate forcing. Each point
s a single simulated year with color representing the maximum
revalence during that year. The horizontal axis represents the ini-
ial prevalence of the simulated year, and the vertical axis relates
he initial immunity index of the simulated year, both defined at
he beginning of the wet season. A contour plot was created for
hese points using polynomial fitting up to the third degree. It can
e seen that the maximum prevalence depends on both the ini-
ial prevalence and the initial immunity. A high initial prevalence
esults in a higher maximum prevalence, while a high immunity
ndex results in a lower maximum prevalence. Therefore, the max-
mum prevalence is highest when the immunity level is low and
he initial prevalence is high.
The fact that the contour lines are neither straight nor parallel
ndicates that the maximum prevalence is not a simple function of
nitial prevalence and immunity index, but a complex non-linear
unction of initial prevalence and immunity index.
.4. Summary of results
Overall, our findings emphasize the importance of consider-
ng initial conditions in environmentally driven models of malaria
ransmission. These results demonstrate the importance of includ-
ng the effects of immunity in models of malaria transmission.
s of malaria transmission, Advances in Water Resources (2016),
6 T.K. Yamana et al. / Advances in Water Resources 0 0 0 (2016) 1–7
ARTICLE IN PRESS
JID: ADWR [m5G; October 19, 2016;20:6 ]
Fig. 6. Simulation results from Experiment 3 in low malaria transmission setting . The simulations were driven by different sequences of environmental data during years
1 through 11 (labeled Y1–Y11), and by identical climate data (observed data from 2009) during years 12 through 31 (labeled R1–R20). The upper panel shows simulated
malaria prevalence and the lower panel shows simulated mean immunity index. (For interpretation of the references to color in the text, the reader is referred to the web
version of this article.)
Fig. 7. Contour plot of yearly maximum prevalence in children aged 2–10 using
identical climate forcing (observations from the year 2009). The horizontal axis rep-
resents the initial prevalence of the simulated year, and the vertical axis relates the
initial immunity index of the simulated year, both defined at the beginning of the
wet season. Each dot shows the results of one simulation.
w
a
i
a
i
d
t
d
t
p
e
m
u
c
o
4
t
l
fl
c
e
s
s
p
i
t
c
d
c
t
In order to accurately simulate malaria transmission, initial con-
ditions as well as the interaction between the climate forcing and
initial conditions should be considered. These findings have impor-
tant implications for studies that aim to link malaria infection rates
to environmental drivers, particularly in the context of early warn-
ing systems, or longer term climate change projections. They can
also be important when evaluating malaria control interventions,
as prevalence levels will be affected by both sets of factors.
Future research should further investigate the interactions be-
tween the climate forcing and initial conditions. For example, it
Please cite this article as: T.K. Yamana et al., Hysteresis in simulation
http://dx.doi.org/10.1016/j.advwatres.2016.10.003
ould be beneficial to explore to what extent initial prevalence
nd the immunity level would buffer the influence of climate forc-
ng at a wider range of transmission levels. Further research is
lso needed on how to best incorporate the uncertainty due to
nitial conditions in current effort s to produce environmentally
riven early warning systems or climate change projections of fu-
ure malaria transmission. When historical environmental and epi-
emiological data are available, they could be used to inform ini-
ial conditions, or to initialize the model by simulated several years
rior to the year of interest. If historical information is limited,
nsemble-based methods can be used to simulate malaria trans-
ission spanning a range of initial conditions to incorporate the
ncertainty due to initial conditions. Bayesian inference methods
an be used to estimate initial infection and immunity levels of an
utbreak ( Shaman and Karspeck, 2012 ).
. Conclusion
In the context of a field-tested mechanistic model of malaria
ransmission, we tested the sensitivity of simulated malaria preva-
ence to initial conditions in prevalence and immunity level, re-
ecting the memory of the system. We found these effects to be of
omparable magnitude to the effects of interannual variability in
nvironmental conditions, suggesting that both the history of the
ystem as well as concurrent climate conditions are important in
haping seasonal malaria transmission. The memory of this com-
lex malaria system is longer in high transmission settings than
n low transmission settings. As such, it is important to include
he effects of immunity in models of malaria transmission. Our fo-
us on hysteresis in malaria transmission sheds light on another
imension of complexity in this important system. In order to ac-
urately simulate and forecast malaria transmission, initial condi-
ions describing prevalence and human immunity as well as the
s of malaria transmission, Advances in Water Resources (2016),
T.K. Yamana et al. / Advances in Water Resources 0 0 0 (2016) 1–7 7
ARTICLE IN PRESS
JID: ADWR [m5G; October 19, 2016;20:6 ]
i
m
A
g
S
f
0
R
B
B
B
B
B
C
C
D
E
G
G
G
K
K
L
L
L
N
R
S
S
T
T
T
V
W
Y
Y
Y
Y
Y
Z
nteraction between the climate forcing and these initial conditions
ust be considered.
cknowledgment
This work was funded by the U.S. National Science Foundation
rant EAR- 0946280 .
upplementary materials
Supplementary material associated with this article can be
ound, in the online version, at doi:10.1016/j.advwatres.2016.10.
03 .
eferences
abiker, H.A. , Abdel-Muhsin, A. , Ranford-Cartwright, L.C. , Satti, G. , Walliker, D. , 1998.
Characteristics of Plasmodium falciparum parasites that survive the lengthy dryseason in eastern Sudan where malaria transmission is markedly seasonal. Am.
J. Trop. Med. Hyg. 59 (4), 582–590 . omblies, A. , 2014. Agent-based modeling of malaria vectors: the importance of
spatial simulation. Parasites Vectors 7, 1–10 . omblies, A., Duchemin, J.B., Eltahir, E.A.B., 2008. Hydrology of malaria: model de-
velopment and application to a Sahelian village. Water Resour. Res. 4 4, W124 45.
http://dx.doi.org/10.1029/20 08WR0 06917 . omblies, A. , Duchemin, J.B. , Eltahir, E.A.B. , 2009. A mechanistic approach for accu-
rate simulation of village-scale malaria transmission. Malar. J. 8 (1), 223 . ousema, T. , et al. , 2012. Hitting hotspots: spatial targeting of malaria for control
and elimination. PLoS Med. 9 (1), e1001165 . hilds, D.Z. , Boots, M. , 2010. The interaction of seasonal forcing and immunity and
the resonance dynamics of malaria. J. R. Soc. Interface 7 (43), 309–319 . hitnis, N. , Hyman, J.M. , Cushing, J.M. , 2008. Determining important parameters in
the spread of malaria through the sensitivity analysis of a mathematical model.
Bull. Math. Biol. 70 (5), 1272–1296 . obson, A. , 2009. Climate variability, global change, immunity, and the dynamics of
infectious diseases. Ecology 90 (4), 920–927 . bi, K.L. , et al. , 2005. Climate suitability for stable malaria transmission in Zim-
babwe under different climate change scenarios. Clim. Change 73 (3), 375–393 . ambhir, M. , Michael, E. , 2008. Complex ecological dynamics and eradicability of
the vector borne macroparasitic disease, lymphatic filariasis. PLoS One 3 (8),
e2874 . ianotti, R.L. , Bomblies, A. , Eltahir, E.A.B. , 2009. Hydrologic modeling to screen po-
tential environmental management methods for malaria vector control in Niger.Water Resour. Res. 45 (8), W08438 .
riffin, J.T. , et al. , 2016. Potential for reduction of burden and local elimination ofmalaria by reducing Plasmodium falciparum malaria transmission: a mathemat-
ilian, A.H.D. , Langi, P. , Talisuna, A. , Kabagambe, G. , 1999. Rainfall pattern. El Niñoand malaria in Uganda. Trans. R. Soc. Trop. Med. Hyg. 93 (1), 22–23 .
Please cite this article as: T.K. Yamana et al., Hysteresis in simulation
http://dx.doi.org/10.1016/j.advwatres.2016.10.003
oelle, K. , Pascual, M. , 2004. Disentangling extrinsic from intrinsic factors in diseasedynamics: a nonlinear time series approach with an application to cholera. Am.
Nat. 163 (6), 901–913 . al, A.M.W. , 1998. Performance comparison of overland flow algorithms. J. Hydraul.
Eng. 124 (4), 342–349 . aneri, K. , et al. , 2015. Dynamical malaria models reveal how immunity buffers ef-
fect of climate variability. Proc. Nat. Acad. Sci. 112 (28), 8786–8791 . anghorne, J. , Ndungu, F.M. , Sponaas, A.M. , Marsh, K. , 2008. Immunity to malaria:
more questions than answers. Nature Immunol. 9 (7), 725–732 .
assir, E. , et al. , 2005. Impact of genetic complexity on longevity and gametocyto-genesis of Plasmodium falciparum during the dry and transmission-free season
of eastern Sudan. Int. J. Parasitology 35 (1), 49–55 . odó, X. , et al. , 2013. Climate change and infectious diseases: can we meet the
needs for better prediction? Clim. Change 118 (3-4), 625–640 . chwinning, S. , Sala, O.E. , Loik, M.E. , Ehleringer, J.R. , 2004. Thresholds, memory, and
seasonality: understanding pulse dynamics in arid/semi-arid ecosystems. Oe-
cologia 141 (2), 191–193 . haman, J. , Karspeck, A. , 2012. Forecasting seasonal outbreaks of influenza. Proc.
Nat. Acad. Sci. 109 (50), 20425–20430 . homson, M.C. , et al. , 2006. Malaria early warnings based on seasonal climate fore-
casts from multi-model ensembles. Nature 439 (7076), 576–579 . homson, M.C. , Mason, S.J. , Phindela, T. , Connor, S.J. , 2005. Use of rainfall and sea
surface temperature monitoring for malaria early warning in Botswana. Am. J.
under climate change scenarios: the potential redistribution of malaria vectorsin Africa. Malar. J. 9, 111 .
an Lieshout, M. , Kovats, R.S. , Livermore, M.T.J. , Martens, P. , 2004. Climate changeand malaria: analysis of the SRES climate and socio-economic scenarios. Global
Env. Change 14 (1), 87–99 .
ho (2001) Malaria Early Warning Systems: concepts, indicators and partners:A framework for field research in Africa. Malaria Early Warning Systems:
concepts, indicators and partners: A framework for field research in Africa.WHO/CDS/RBM/2001.32 .
amana, T.K. , et al. , 2013. Incorporating the effects of humidity in a mechanisticmodel of Anopheles gambiae mosquito population dynamics in the Sahel region
of Africa. Parasites Vectors 6, 235 .
amana, T.K. , Bomblies, A. , Eltahir, E.A.B. , 2016. Climate change unlikely to increasemalaria burden in West Africa. Nature Climate Change. Advance Online Publica-
environmental variability to village-scale malaria transmission using a simpleimmunity model. Parasites Vectors 6, 226 .
amana, T.K. , Eltahir, E.A. , 2010. Early warnings of the potential for malaria trans-
mission in rural Africa using the hydrology, entomology and malaria transmis-sion simulator (HYDREMATS). Malar. J. 9, 323 .
amana, T.K. , Eltahir, E.A.B. , 2013. Projected impacts of climate change on environ-mental suitability for malaria transmission in West Africa. Environ. Health Per-
spect. 121 (10), 1179–1186 . hou, G. , Minakawa, N. , Githeko, A.K. , Yan, G. , 2004. Association between climate
variability and malaria epidemics in the East African highlands. Proc. Nat. Acad.Sci. U.S.A. 101 (8), 2375 .
s of malaria transmission, Advances in Water Resources (2016),


![ARTICLE IN PRESS & Disney 2015.pdf · 2015-08-07 · X. Wang, S.M. Disney/European Journal of Operational Research 000 (2015) 1–11 3 ARTICLE IN PRESS JID: EOR [m5G;July 30, 2015;10:37]](https://static.documents.pub/doc/80x56/5e72a205f4430a12e053d1ac/article-in-press-disney-2015pdf-2015-08-07-x-wang-sm-disneyeuropean.jpg)

![ARTICLE IN PRESS - kerenfu.topfinal).pdf · ARTICLE IN PRESS JID: NEUCOM [m5G;September 22, 2017;13:7] Neurocomputing 000 (2017) 1–17 Contents lists available at ScienceDirect Neurocomputing](https://static.documents.pub/doc/80x56/5d0791a288c993ec3b8cb157/article-in-press-finalpdf-article-in-press-jid-neucom-m5gseptember-22.jpg)
![ARTICLE IN PRESS · 2 L. Minatti et al./Advances in Water Resources 000 (2015) 1–16 ARTICLE IN PRESS JID: ADWR [m5G;July 15, 2015;19:44] account ...Cited by: 6Publish Year: 2016Author:](https://static.documents.pub/doc/80x56/614904539241b00fbd67496b/article-in-press-2-l-minatti-et-aladvances-in-water-resources-000-2015-1a16.jpg)

![ARTICLE IN PRESS - unina.itwpage.unina.it/a.botta/pub/COMCOM_SDN.pdf · ARTICLE IN PRESS JID: COMCOM [m5G;December 13, 2016;10:5] 2.2. Available bandwidth Available bandwidth is an](https://static.documents.pub/doc/80x56/5e2be2544bfc473dba05daac/article-in-press-unina-article-in-press-jid-comcom-m5gdecember-13-2016105.jpg)

![Pattern Recognition Lettersscozzafava/pubs/biopen.pdf · 2 M. De Marsico et al. / Pattern Recognition Letters 000 (2018) 1–10 ARTICLE IN PRESS JID: PATREC [m5G;April 27, 2018;16:38]](https://static.documents.pub/doc/80x56/5e3daf5682c98c0bdb098f0e/pattern-recognition-scozzafavapubsbiopenpdf-2-m-de-marsico-et-al-pattern.jpg)
![ARTICLE IN PRESS - COnnecting REpositories · V. Bobkov et al. / Nuclear Materials and Energy 000 (2016) 1–5 3 ARTICLE IN PRESS JID: NME [m5G;November 30, 2016;8:47] δ Γ δ Γ](https://static.documents.pub/doc/80x56/5ecc2e9521ca32263b6902f2/article-in-press-connecting-repositories-v-bobkov-et-al-nuclear-materials.jpg)


![ARTICLE IN PRESS - COnnecting REpositories · 2 Y. Iwai et al. / Nuclear Materials and Energy 000 (2016) 1–6 ARTICLE IN PRESS JID: NME [m5G;September 6, 2016;11:16] Table 1 Characteristics](https://static.documents.pub/doc/80x56/5f67aa798ae48101065a1351/article-in-press-connecting-repositories-2-y-iwai-et-al-nuclear-materials.jpg)


![ARTICLE IN PRESS - perso.uclouvain.be · 2 H. Le Cadre et al. / European Journal of Operational Research 000 (2018) 1–23 ARTICLE IN PRESS JID: EOR [m5G;October 13, 2018;20:7] increasing](https://static.documents.pub/doc/80x56/5e1c8f527db00a407d5d5135/article-in-press-perso-2-h-le-cadre-et-al-european-journal-of-operational.jpg)
![ARTICLE IN PRESS - iranarze.iriranarze.ir/wp-content/uploads/2016/11/E900.pdfARTICLE IN PRESS JID: COMPNW [m5G;April 23, 2016;15:53] Computer Networks 000 (2016) 1–13 Contents lists](https://static.documents.pub/doc/80x56/5aad83de7f8b9a9c2e8e569d/article-in-press-in-press-jid-compnw-m5gapril-23-20161553-computer-networks.jpg)