Article (refereed) R.T. Clarke & J.F. Murphy. Effects of locally rare taxa on the precision and sensitivity of RIVPACS bioassessment of freshwaters Freshwater Biology 51(10) pp.1924-1940 Copyright 2006 Blackwell Publishing This version available at http://nora.nerc.ac.uk/1805/ NERC has developed NORA to enable users to access research outputs wholly or partially funded by NERC. Copyright and other rights for material on this site are retained by the authors and/or other rights owners. Users should read the terms and conditions of use of this material at http://nora.nerc.ac.uk/policies.html#access This document is the author’s final manuscript version of the journal article, incorporating any revisions agreed during the peer review process. Some differences between this and the publisher’s version remain. You are advised to consult the publisher’s version if you wish to cite from this article. http://pubs.acs.org/cgi-bin/article.cgi/esthag/2008/42/i15/pdf/es702819f.pdf Contact CEH NORA team at [email protected]
Transcript
Article (refereed) R.T. Clarke & J.F. Murphy. Effects of locally rare taxa on the precision and sensitivity of RIVPACS bioassessment of freshwaters Freshwater Biology 51(10) pp.1924-1940
Copyright 2006 Blackwell Publishing This version available at http://nora.nerc.ac.uk/1805/ NERC has developed NORA to enable users to access research outputs wholly or partially funded by NERC. Copyright and other rights for material on this site are retained by the authors and/or other rights owners. Users should read the terms and conditions of use of this material at http://nora.nerc.ac.uk/policies.html#access This document is the author’s final manuscript version of the journal article, incorporating any revisions agreed during the peer review process. Some differences between this and the publisher’s version remain. You are advised to consult the publisher’s version if you wish to cite from this article. http://pubs.acs.org/cgi-bin/article.cgi/esthag/2008/42/i15/pdf/es702819f.pdf
1. The overall aim in freshwater bioassessment is to use biological methods, metrics and forms of indices which are precise, in that they give repeatable results between replicate samples, but which are also sensitive to changes in environmental impacts and stresses. We investigated the effects of excluding taxa with site-specific RIVPACS-type model expected probabilities less than (or equal to) a threshold Pt (0.0, 0.1, 0.2,...,0.9) on the value, precision and power to detect biological effects of environmental stress using the observed to expected ratios (O/E) of biotic indices used to assess the ecological status of UK river sites.
2. Amongst the 614 high quality GB RIVPACS reference sites, excluding taxa with low expected probabilities of occurrence gave less total variation (i.e. lower SD) in the estimates O/E for number of taxa (O/ETAXA) and the Average Score Per Taxon (O/EASPT).
3. A separate analysis of a replicated sampling study of sites from a wide range of physical types and qualities found that sampling variances in O/E for reference condition sites decreased as more locally-rare taxa were excluded (but only up to Pt = 0.5 for O/EASPT). However, for moderately impacted and poor quality sites, estimates of both O/ETAXA and O/EASPT based on all (Pt = 0.0), or most taxa (i.e. Pt ≤ 0.3) had lower sampling variances and were more precise.
4. Within a very large independent set of test sites with a wide range of perceived levels of environmental stress, increasing the threshold Pt led to systematic differences in the estimates of both O/E. Compared to using all taxa, high thresholds ( ≥0.5) gave lower O/E values for very high quality sites with O/E>1 and higher values for moderate and poor quality sites (with the exception of O/EASPT for the most severely stressed sites).
5. Accuracy and statistical power to detect environmental stress (measured by the percentage of stressed sites with O/E below the lower 10-percentile value for reference sites) was very similar using O/ETAXA for Pt up to 0.7. Using O/EASPT, power to detect overall general stress decreased slower as Pt was increased; the rate of fall in power was slightly faster when restricted to sites subject to moderate or severe stress from organic inputs.
6. Taxa which are more sensitive to (organic) stresses (i.e. have high BMWP scores) tend to be naturally less widespread (i.e. amongst reference sites) and thus were found to have considerably lower average site-specific expected probabilities; this may explain why the use of higher thresholds Pt can exclude more such sensitive taxa and lead to under-estimation of the extent of impacts.
7. The standard UK RIVPACS sampling and sample processing procedures aim to identify all taxa with a sample. This may lead to a longer distribution tail of rarer (low probability) taxa than sampling methods based on a fixed count sub-sample and influence the practical effects of excluding rare taxa with low expected probabilities from bioassessments.
2
Introduction
Empirical predictive models were first applied to the bioassessment of freshwater quality by
researchers in the UK during the development of the River Invertebrate Prediction and
Classification System (RIVPACS) (Wright et al., 1984; Moss et al., 1987; Wright, 1995).
The RIVPACS approach is now well established in the UK (Wright et al., 2000), Australia
(Smith et al., 1999), Canada (Reynoldson et al., 2000), Sweden (Johnson, 2003) and the
Czech Republic (Zahrádková et al., 2000), and is currently being developed and evaluated for
other regions (Joy & Death, 2003; Ostermiller & Hawkins, 2004, Van Sickle et al., 2005).
There are a number of steps involved in developing a regional RIVPACS model (Clarke et
al., 2003, Bailey et al., 2004). First a comprehensive set of reference biological samples from
high quality, minimally disturbed sites is collected to represent the full range of physical
stream types present in the region, in terms of variation both between and within catchments.
The samples are collected and processed using standard protocols. Some form of cluster
analysis is then used to classify the samples into groups based on the similarity of their
recorded community composition. The relationships between the measured environmental
features and biological characteristics of the reference site groups are defined by multiple
discriminant analysis (MDA). The derived discriminant functions are used to estimate the
probability of membership to each classification group for any site based on its values for the
same environmental features. The probabilities of the test site belonging to each classification
group are combined with the proportional occurrence of each taxon amongst the reference
sites in each of the groups to calculate (as weighted averages) the expected probabilities of
capture for each taxon at the test site, if it was also of reference high quality and minimally
disturbed (Clarke et al., 2003). The observed fauna at the test site (collected using the same
standardised procedures) can then be compared with the expected fauna to derive a
bioassessment of the ecological status of the site.
Although this comparison of observed and expected fauna can be done in a variety of ways
(Clarke et al.,1996), most assessments around the world based on RIVPACS-type predictive
models (cited above) concentrate on the use of the ratio of the observed (O) to site-specific
expected (E) number of taxa at the site (denoted O/ETAXA). However, in the UK, national
river assessments by government environment agencies using macroinvertebrates are
currently based on both O/ETAXA and the ratio (denoted O/EASPT) of the observed to expected
values for the metric ASPT (Average Score Per Taxon) based on the BMWP (Biological
Monitoring Working Party) system for scoring families (1-10) by their perceived tolerance to
3
organic pollution (Armitage et al., 1983; Hemsley-Flint, 2000). The UK government agencies
are working towards involving more metrics intended to measure specific types of stress to
incorporate the best features of the multi-metric and multivariate predictive modelling
approaches.
While the process of RIVPACS model development and testing around the world usually
follows a similar generic path, individual models vary in some aspects e.g. field and
laboratory procedures, taxonomic resolution, statistical classification method, and whether to
exclude locally-rare taxa from the calculation of O/E values. Quantification of the variation
and errors associated with one or more of these aspects has been addressed for a number of
different regional models (Moss et al., 1999; Clarke, 2000; Hawkins et al., 2000; Cao et al.,
2002; Clarke et al., 2002; Ostermiller & Hawkins, 2004).
The main topic of this paper concerns whether or not it is best to exclude taxa with low
expected probabilities of occurrence at a site from its bioassessment. In particular, we
investigate the effect of only including taxa which have more than a certain threshold (Pt) of
expected probability of occurrence at a site on the estimation, sampling precision and power
to detect environmental stress of O/E ratio(s) across a range of types and qualities of site.
Historically, UK RIVPACS models have included all taxa (i.e. Pt =0) in assessments, in the
belief that the many locally rare taxa are likely to be the first to disappear as a site becomes
more stressed. While this assumption has yet to be rigorously tested, there is a suggestion that
excluding rare taxa can reduce the sensitivity of community-based assessments through its
differential effects on sites depending on their taxa richness and abundance patterns (Cao et
al., 1998). This view is contested by others workers who argued that excluding rare taxa leads
to reduced variance in model predictions and hence more confidence in the assessment of
quality at a site (Hawkins et al. 2000; Marchant, 2002).
Predictive models in the Australian River Assessment Scheme (AUSRIVAS) use Pt = 0.5,
based on the initially untested assumption that taxa with low probabilities of occurring at a
site do not contribute reliable information to the bioassessment of site condition (Smith et al.
1999; Simpson and Norris 2000). Based on a study of 234 references sites and 254 test sites
(potentially impaired by past logging), Hawkins et al. (2000) found that site assessments
based on using Pt = 0.0 were more variable than those based on Pt = 0.5 and concluded that
the inclusion of more taxonomic information from such locally-rare taxa would decrease
model sensitivity to deterioration in site condition. Marchant (2002) examined the effect of
4
varying Pt on the variability in O/E for number of genera between seven sites immediately
below large dams in Victoria, Australia. Because the sites were severely impacted with
average O/E of around 0.5, all sites were classed as impacted (i.e. O/E less than the lower 10
percentile value of 0.82 for reference sites) regardless of the threshold used, except for one
site when Pt =0.9, which he took as evidence to support the use of Pt =0.5 in AUSRIVAS.
However, his main analysis (see Figure 1 in Marchant (2002)) had shown that the variability
in O/E between the sites was least when all taxa were included (coefficient of variation(CV)
= 6.2% for Pt =0), or when Pt = 0.1 (CV=8.0%), and increased with the threshold used (CV =
17.8%, 18.3% and 39.4% for Pt =0.5, 0.7 and 0.9 respectively). This evidence actually
provides some support for using all taxa in site assessments. Moreover, Turak and Koop
(2003) examined multiple-year data from two sites in New South Wales, Australia and
concluded that including all taxa (i.e. with Pt = 0) in AUSRIVAS estimates of O/E enhances
the ability to detect differences in levels of disturbance compared to using the recommended
threshold Pt of 0.5. Johnson & Sandin (2001) investigated the effect of threshold (Pt) values
of 0.0, 0.1, 0.25 and 0.5 on the strength of the correlation between O and E values and the
standard deviation (SD) of O/E values for number of taxa with a set in reference sites in
Sweden predicted using the stream riffle RIVPACS models (SWEPACSRI). They suggested a
compromise threshold of 0.25.
Recently, Ostermiller & Hawkins (2004) concluded that it was difficult to determine what
optimal Pt value would give a precise predictive model, in terms of eliminating noise
associated with very rare taxa, and at the same time a sensitive model, in terms of
incorporating as much (biological response) information on the taxa-environment relationship
as possible. Cao et al. (2001, p149-150) give a clear summary of the problem in terms of the
two types of error in site bioassessments, namely (i) indicating a non-existing impact or over-
estimating an impact, and (ii) failing to detect an impact or under-estimating its size. They
conclude that the inclusion or exclusion of rare taxa appears to be mainly related to (ii) in that
if an assessment based on only abundant (or high probability) taxa does not detect an impact,
it may be because only the rarer species have been affected (or eliminated from the site).
In our view, although low probability taxa may individually contribute little, there are often
many of them, so collectively they may be very informative. The overall aim in any
bioassessment is to use biological methods, metrics and forms of indices which are precise, in
that they give repeatable results between replicate samples, but which are also sensitive to
changes in environmental impacts and stresses.
5
The choice of the optimal Pt has not been comprehensively investigated across a range of
sites with different levels of impairment. Recent studies on this issue have proved
inconclusive, in terms of their relevance to RIVPACS-type models for general use, as they
have generally investigated the effect of excluding rare taxa on limited datasets (Cao et al.,
1998; Marchant, 2002), or on sites drawn only from reference site datasets (Johnson, 2003) or
have only compared a very restricted number of Pt values (Hawkins et al., 2000; Ostermiller
& Hawkins, 2004). In their excellent study of the impact of various aspects of a sampling
methodology, Ostermiller & Hawkins (2004) found that the standard deviation (SD) in O/E
values for their reference sites was less for Pt =0.5 than for Pt =0.0 for all fixed sub-sample
sizes tested, from which they concluded that models based on the use of Pt =0.5 were more
precise. However, in the extreme if you base O/E values only on those taxa which are
(nearly) always found (Pt ≥ 0.9) at that type of reference site, then the observed and expected
number of taxa for the reference sites must be almost identical so that O/E values will hardly
vary about unity. Although sampling precision and repeatability for high quality sites is
obviously important to minimise the occurrence of type 1 errors, the detection and estimation
of the extent of impacts will depend on the (potentially different) sampling precision in O/E
ratios for poorer quality sites and the extent to which they differ from O/E values for
reference sites.
We assessed the effect of varying Pt on the values, precision and accuracy of RIVPACS
model estimates for both O/ETAXA and O/EASPT. In particular the effect of Pt on four factors
was assessed: (i) overall variation (SD) in O/E for RIVPACS reference sites, (ii) replicate
sampling SD in O/E across a wide range of qualities of site and (iii) systematic differences in
the value of O/E for sites from a range of water qualities and stream types, and most
importantly (iv) the resulting statistical power to detect biological impacts at independently
assessed environmentally stressed sites.
Methods
Relevant aspects of the UK RIVPACS reference sites, sampling and model development
methodology
In the UK, there is currently a single RIVPACS prediction and site assessment module for the
whole of mainland Great Britain (GB) based on 614 reference sites (Moss, 2000); although
separate modules have recently been developed for Northern Ireland and the Scottish islands.
6
All reference sites have been sampled using standard RIVPACS sampling and sample
processing procedures (Wright et al., 1984; Environment Agency, 1999). This involves a 3
minute active kick sample with a pond net plus a 1-min hand search for taxa likely to be
missed in the kick sample e.g. those adhered to large stones and bedrock. All habitats within
the site are sampled in proportion to their occurrence. In the laboratory, the entire sample is
carefully sorted through for macroinvertebrates, with the aim of identifying and recording all
of the taxa within the sample (but using where appropriate varying degrees of sub-sampling
(1/2, 1/4, 1/8 sample, etc) purely to estimate the abundance of very common taxa) (Wright,
2000). The procedure of sorting through the whole sample within the aim of finding all of the
taxa present is an important difference in the RIVPACS method compared to some other
methods which only identify a “random” sub-sample and/or a random fixed number of
individuals in a sample. This could have repercussions for the effect of excluding locally-rare
taxa from site assessments and is discussed further below.
Each reference site was sampled once in each of spring (March - May), summer (June -
August) and autumn (September - November). A single classification of the reference sites
into groups was derived for the GB module based on the best available biological information
for each site, namely the three seasons combined fauna based on presence-absence of species
and log abundance category of families. The MDA functions can then be used to derive both
site- and season-specific predictions of the fauna to be expected for any single season sample
or any combined season (e.g. spring+autumn, or spring+summer+autumn) sample, which can
then be compared with the corresponding observed sample fauna for the same season(s) from
any site.
Clarke et al. (1996) pointed out that the reference sites used in any RIVPACS-type model
will not all be of the same biological quality. In practice, they usually represent the top class
of sites, and are likely to be very variable in quality. The variation and distribution of the
sample O/E values for a set of reference sites is therefore due to both sampling variation and
methodological errors, but also due to real variation in their true quality - albeit unknown.
Therefore, some variation in O/E values amongst references sites is always to be expected.
BAMS study sites used to estimate sampling variation in O/E
The analysis of replicate sampling variation was based on the 16 sites used by Clarke et al.
(2002) to assess patterns of sampling variation in BMWP-based indices. These study sites
7
were selected from a listing of over 5000 sites sampled during the 1990 national river quality
survey (RQS) throughout England and Wales. Based on their environmental characteristics,
the study sites were selected from four site groups (Table 1a), chosen to encompass the four
major site divisions and site types within the RIVPACS II hierarchical classification (Wright,
1995). Next, within each of the four site groups, one study site was selected at random from
the list of RQS sites in each of the four quality grades (Table 1b), giving a total of 16 sites,
referred to as the BAMS (Biological Assessment Methods Study) sites,
Each BAMS site was sampled in each of the three RIVPACS seasons using the standard
RIVPACS sampling procedures. On each sampling occasion and at each site, three
macroinvertebrate samples were collected, the first and third were taken by an Institute of
Freshwater Ecology (now CEH) biologist and the second by a local Government environment
agency biologist. Care was taken to minimise the possibility of re-sampling the same
locations within the site in order to avoid progressive depletion of the fauna. At any given site,
the same biologists took the samples in each of the three seasons, but the personnel varied
between sites and regions. The macroinvertebrate samples were all sorted and identified by
experienced IFE/CEH biologists using the standardised RIVPACS protocols (Wright et al.,
1984; Environment Agency, 1999). Three people also made independent estimates of the
RIVPACS environmental predictor variables and hence expected fauna at each site - leading
to three independent estimates of O/E values.
GQA (General Quality Assessment) sites and their anthropogenic stresses
The third sets of sites involved in the analyses reported here (in addition to the 614
RIVPACS reference sites and the 16 BAMS sites) are 5752 sites from the Environment
Agency (EA)’s General Quality Assessment (GQA) national survey of river sites throughout
England and Wales in 1995 (Murphy & Davy-Bowker, 2005). Samples were taken in both
spring and autumn. The results of our analyses are presented for spring samples, but similar
results were obtained for autumn samples.
This large dataset was used to test for systematic dependence of O/E on the threshold
probability Pt. and, most importantly, to assess the effect of the choice of Pt on the statistical
power of the resulting O/Es to detect the biological impacts of anthropogenic stress operating
at the site. The severity of each of 12 major types of anthropogenic stress acting on each site
was recorded by local EA biologists from their detailed knowledge of sites and catchments in
8
their area (Table 2) (Murphy & Davy-Bowker, 2005). EA catchment management plans were
also consulted by biologists where more information was needed. We derived an overall
measure of stress intensity by dividing the sum (S) of the levels of the 12 stress types into
four classes (Table 2).
Calculating O/E for different threshold expected probabilities
If taxon i (species or family) occurs in rij of the nj reference sites in group j, then the
RIVPACS expected probability, pi, of finding a particular taxon i at a particular test site, if
the site is unstressed, is estimated from the proportion qij = rij/nj of reference sites in each
group j with taxon i present, weighted by the test site’s probabilities Gj of belonging to each
group j, namely (Clarke et al., 2003):
∑=j
ijji qGp
The expected number of taxa (ET) for a site is simply the sum of the site-specific expected
probabilities of the individual taxa, namely:
(1) ∑=i
iT pE
The observed value (OA) of ASPT for a site is calculated as the sum (OS) of the individual
BMWP scores (Bi) of the OT BMWP-scoring taxa present, divided by OT. Calculation of the
expected value, EA, of ASPT is more complex as it is a ratio of variables, but a very good
approximation (from Clarke et al., 1996) is given by:
23 /// TSTTSTTTSA EvEEvEEE −+= (2)
where = expected value of total BMWP score , ∑=i
iiS pBE
∑ −=i
iiTT ppv )1( and ∑ −=i
iiiST ppBv )1( .
(Note: Equation (2) is the same as equation (11) in Clarke et al. (1996) except that the last
term should be subtracted not added; the term is minor, the effect is negligible and
importantly, the correct formula has always been used in all versions of RIVPACS software
code).
2/ TST Ev
The O/E ratios for number of taxa and ASPT are then given by:
9
TTTAXA EOEO // = and (3) AAASPT EOEO // =
When the O/E ratios for a site are to be based on only those taxa with site-specific expected
probabilities of occurring {pi} greater than a threshold probability Pt, then only those taxa for
which pi > Pt are included in the calculation of both the observed (O) and expected (E) and
hence O/E values of each metric; in our case, ‘number of taxa’ and ASPT based on equations
(1)-(3). In our study, the effect of a wide range of threshold probabilities was assessed, using
Pt = 0.0, 0.1, 0.2, 0.3, 0.4, 0.5, 0.6, 0.7, 0.8, 0.9, where Pt = 0.0 is equivalent to including all
of the taxa in the calculation of O/E ratios and site assessments.
Results
Illustration of the potential effect of using different thresholds
To illustrate the effect of using different threshold probabilities on O/E values, a detailed
comparison of the observed and expected fauna was made for a replicate sample from one of
the moderately impacted BAMS sites (Table 3). In general, as more taxa are excluded so both
the observed and expected number of taxa can only decrease, but their ratio O/ETAXA can, in
theory, go up or down. In this example O/ETAXA increased as the threshold probability for
exclusion was increased from 0.0 to 0.9. This was also true for the two other replicate spring
samples from this site (Fig. 1).
Effect of threshold on distribution and SD of O/E values for RIVPACS reference sites
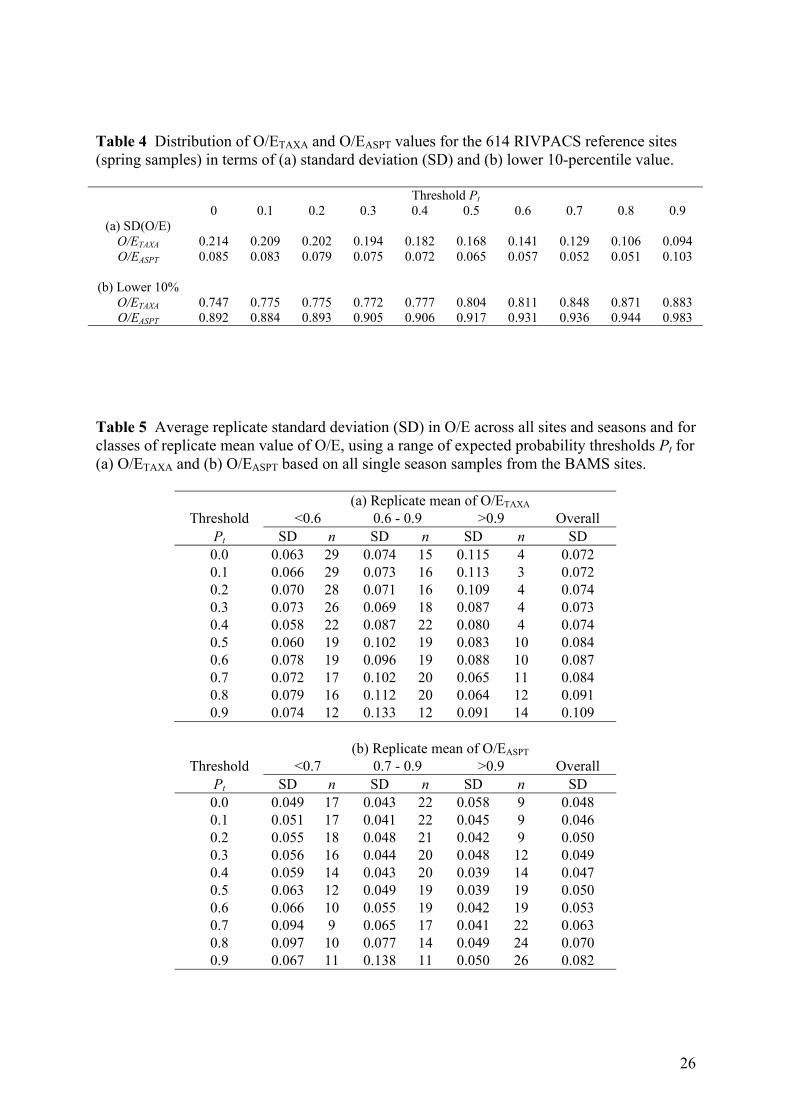
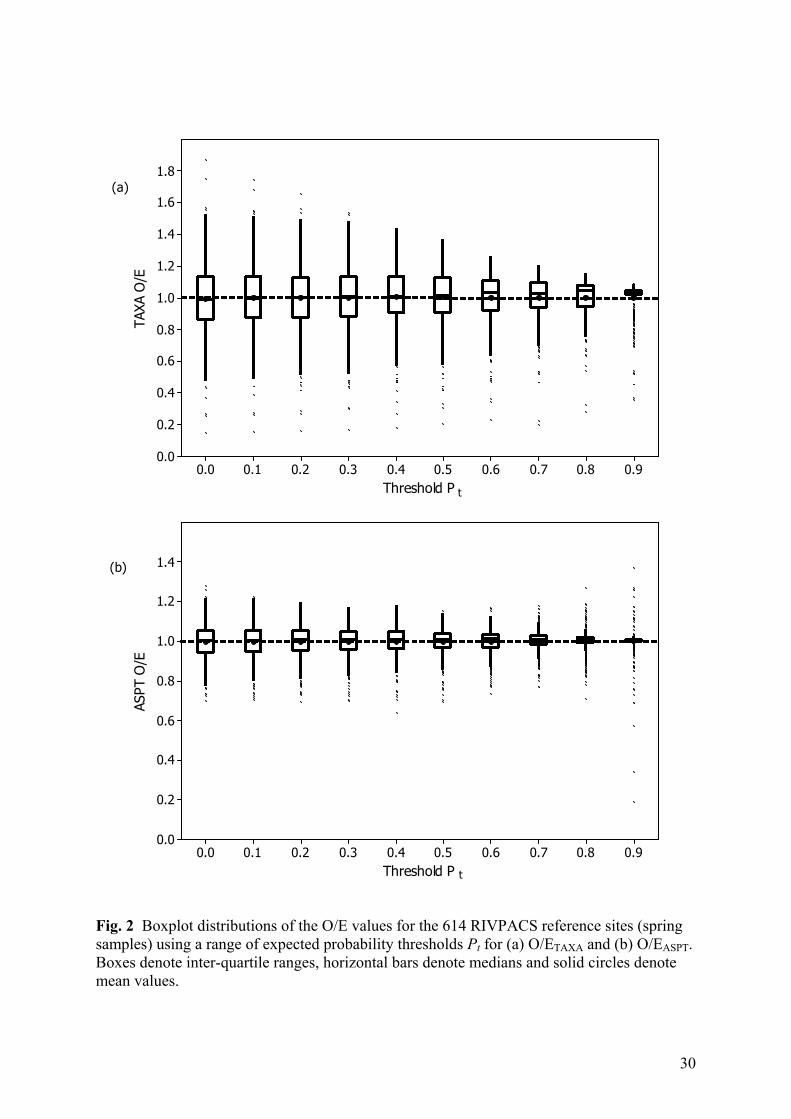
We assessed the effect of using each threshold probability on the distribution of O/E values
for the 614 RIVPACS reference sites for mainland Great Britain (Table 4, Fig. 2). Results are
shown for spring samples, but similar patterns were obtained with samples from other
seasons. The overall mean value of O/ETAXA was always around one, but the distribution
became less variable as the threshold was increased (Figure 2a). In particular, the standard
deviation (SD) started to decline considerably once the threshold Pt was above 0.2 or 0.3
(Table 4(a)). Hawkins et al. (2000) and Ostermiller & Hawkins (2004) also found smaller
overall SD in the O/E values of reference sites when based on a threshold probability of 0.5
compared to when including all taxa (Pt = 0.0). However, as seen in Figure 2a, the biggest
cause of the reduction in overall SD is that excluding taxa expected to be locally rarer reduces
the frequency and extent of high O/E values well above 1. In the extreme, with a threshold of
10
0.9, all of the observed taxa must have at least a 90% expected probability of occurring, so it
is mathematically impossible to get an O/ETAXA value greater than 1/0.9, namely 1.111. The
median (but not mean) value of O/ETAXA was slightly above unity for high values of Pt
(Figure 2(a)).
A similar pattern was observed for the distribution of O/E for ASPT for the same RIVPACS
reference sites (Fig. 2b). Again, the SD changed very little up to a threshold of 0.3, but
thereafter decreased (until Pt = 0.9) (Table 4(a)). However, unlike for O/ETAXA, at high
thresholds, there is increased likelihood of occasional very high or low values of O/EASPT,
because the ASPT metric is an average (score per taxon present) and its value can change
dramatically and erratically when dependent on the chance presence-absence of only a few
taxa.
Effect of threshold on sampling precision of O/E across a range of site qualities
The precision of O/E estimates based on different threshold probabilities Pt was assessed
using the BAMS sites data for which there were three replicated samples and three
independent estimates of O/E values for each of three sampling seasons across a wide range
of types and qualities of river sites in the UK.
In order to summarise the replicate sampling SD robustly for each expected probability
threshold Pt, the data were grouped into three quality classes according to the replicate mean
value of O/ETAXA (Fig. 3(a)). Using Pt =0, the sampling SD of O/ETAXA increased with site
quality (Table 5(a)); this is not unexpected as Clarke et al. (2002) found that replicate
sampling SD of the observed number of taxa in a sample increased with site taxa richness. In
contrast, when very high expected probability thresholds were used, sampling variability in
O/ETAXA was highest at intermediate site quality For the high quality class of sites with
replicate mean O/ETAXA greater than 0.9, the sampling SD decreased as Pt was increased, as
was found previously for reference sites. The only exception was for the extreme threshold Pt
= 0.9, but this was because the class lower limit for replicate mean O/E was sufficiently low
to encompass one of the mildly stressed sites for which O/E was more variable when based
on such a high threshold probability and thus only a few taxa. For intermediate quality mildly
stressed sites with replicate mean O/ETAXA in the range 0.6-0.9, the general pattern was
reversed - assessments involving all or most taxa had the lowest SD and greatest precision
(Fig. 3(a)). Using high thresholds leads to only relatively few taxa being involved, which may
11
or may not still be present (and counted), giving rise to more variable O/E values. At poor
quality sites with replicate mean O/ETAXA less than 0.6, all thresholds gave similar, relatively
low, sampling SD in the range 0.058-0.079 (Table 5(a)). One-way ANOVA was used to
estimate the overall average replicate sampling variance across all site and season
combination for each threshold. The overall average replicate SD was about the same (0.072-
0.074) for expected probability thresholds up to 0.4, but thereafter increased (“overall”
column in Table 5(a)).
In similar analyses for O/EASPT, sampling SD of O/EASPT for high quality sites was
marginally highest for Pt = 0.0 (Table 5(b), Fig 3(b)). However, at intermediate and poor
quality sites with replicate mean values of O/EASPT less than 0.9, assessments based on using
either all the taxa (Pt = 0.0), or an expected probability threshold of no more than 0.3, had the
lowest sampling SD (Fig. 3(b)). All thresholds (except Pt = 0.9) gave slightly higher sampling
SD once replicate mean O/EASPT dropped below 0.7, mainly because fewer taxa were
involved in determining the observed ASPT. Averaged over all sites and seasons, the overall
average sampling SD was about the same (0.046-0.050) for thresholds up to 0.5, but
thereafter increased (Table 5(b)).
Effect of threshold on value of O/E
To obtain a reasonably precise estimate of any systematic differences in average value of
O/E arsing from using different thresholds, the O/E values based on each threshold Pt were
calculated for all of the spring samples from the 5752 GQA sites. For each sample, the O/E
value based on Pt = 0.0 was subtracted from the O/E based on each non-zero threshold to
give the differences in O/E. The samples were then grouped into classes according to their
O/E based on Pt = 0.0. The median differences in O/E values for each threshold for each class
of site are given in Figure 4.
A threshold Pt of 0.1 gave negligible systematic difference in O/ETAXA for qualities of sites
except those with the very highest values when based on all taxa (Fig. 4(a)). When the value
of O/ETAXA based on all of the taxa was around unity (i.e. observed and expected number of
taxa agree), then the median difference in O/ETAXA value using any non-zero threshold was
relatively small, indicating that such O/ETAXA values were roughly equally likely to be higher
or lower than those based on all taxa (Fig. 4). However for poorer quality sites (i.e. those with
O/ETAXA values <0.9), the median difference was always positive and the difference
12
increased with the value of the threshold Pt, indicating that there was a systematic tendency
for the estimate of O/ETAXA for stressed sites to increase as more of the lowest probability
taxa were excluded from the site assessments (Fig. 4). For sites with values of O/E well
above unity when based on all taxa, the O/E estimates tended to be less when based solely on
the taxa with higher expected probabilities of occurrence at the sites(Fig. 4).
The pattern of systematic differences in O/EASPT resulting from increasing the threshold
probability were largely similar to those for O/ETAXA (Fig. 4). For both O/E indices, the
differences using any of the non-zero threshold probabilities was greatest for sites of
intermediate-poor quality. However, in contrast to O/ETAXA, values of O/EASPT for the very
poorest quality sites with O/EASPT less than 0.5 did not show any systematic change with
threshold Pt (Fig. 4(b)).
Overall, our analyses show a systematic tendency for O/E values for a site to become closer
to unity as the threshold of expected probability is increased. In other words, using higher
thresholds makes it more difficult (or even impossible) to obtain O/E values far above or,
more importantly, far below unity. We were concerned that these results might be an artefact
due to grouping the GQA sites on the basis of their O/E values calculated using all of the taxa
(i.e. Pt = 0.0). Therefore, the GQA sites were re-grouped into classes on the basis of their O/E
values calculated using a threshold of Pt = 0.5. For each sample, the O/E value based on Pt =
0.5 was subtracted from the O/E values based on each other threshold (including Pt = 0.0) to
give the differences in O/E. The patterns of median differences in O/E values for each
threshold for each class of site are shown in Fig. 5. Thresholds less than 0.5 (included Pt =
0.0) show a tendency to give lower values of O/ETAXA when the O/E for Pt = 0.5 is less than
unity and higher values when O/E for Pt = 0.5 is greater than unity. Also O/ETAXA values for
thresholds greater than 0.5 showed the same pattern as before, giving values of O/E closer to
unity than those based on a threshold of Pt = 0.5. For sites of intermediate quality (in the
sense of having O/EASPT values for Pt = 0.5 in the range 0.5 – 0.9), thresholds less than 0.5,
on average give lower values of O/EASPT, and vice versa. The median differences are less for
very poor quality sites (i.e. with O/EASPT < 0.5).
Together these results indicate that increasing the expected probability threshold Pt for taxa
to be involved in the calculation of O/E values leads to systematic changes in the estimates of
O/E. Most importantly, increasing the threshold Pt leads to a compression of the whole scale
of O/E towards unity, which may have repercussions for the ability to detect the impact of
stress.
13
Effect of threshold on statistical power to detect biological impacts of anthropogenic stress
We have shown that the variability in O/E for reference sites, the sampling variation of O/E
for impacted sites and the extent of changes from unity in O/E values are all affected by the
choice of the threshold expected probability Pt. However, it is the combination and interplay
of these factors which determines the statistical power to detect the biological effects of
environmental and anthropogenic stress. Using a higher threshold may lead to less reduction
in O/E for stressed sites, but providing the natural variability in O/E for high-quality
reference sites (based on the same Pt) is lower and the sampling variability for stressed sites
is not (much) greater, then using the higher threshold may provide greater statistical power to
detect departure from reference conditions. An O/E value of, for example, 0.7, does not have
the same interpretation in terms of extent of any biological impact for all values of Pt. We
assessed the statistical power to detect impacts using each threshold Pt using the large GQA
dataset for which we had independent assessments of the intensity of anthropogenic stresses
operating at each site (Table 2).
Clarke et al. (1996) suggested using some lower percentile of the distribution of O/E values
for the reference sites/samples as the lower limit of O/E for which any test site would be
classified as of “reference” quality class. Van Sickle et al. (2005) treated test sites as
impaired if their O/E values were outside the interval (mean ± 2 SD) determined from the
O/E for the reference samples. Ostermiller and Hawkins (2004) considered a test site as
significantly different from reference if its O/E value was outside the 10th to 90th percentiles
of reference site O/E values. We used the lower 10-percentile values of O/ETAXA and O/EASPT
for the RIVPACS GB reference sites to set the critical value for deciding whether test sites
should be classified as “stressed” (lower O/E) or “reference” (higher O/E). Using this type of
rule ensures that a known fixed percentage of the RIVPACS model reference sites/samples
would be incorrectly classified as “impaired” (i.e. the overall type 1 error equals 10%).
The GQA sites were classified into four stress intensity classes according to their score S
representing their overall loading of anthropogenic stresses (Table 2, Table 6). A GQA site
was classified as “impacted” if its O/E value based on a particular threshold Pt was less than
the critical O/E value for the reference sites based on the same Pt. Using O/ETAXA, the
statistical power to detect biological impacts among sites subject to “moderate” or “severe”
14
levels of overall stress was very similar for all thresholds up to 0.7; although the marginally
highest power occurred for Pt equal to 0.1 or 0.2 (Table 6).
When based on O/EASPT, the statistical power to detect the biological impacts of
“moderate” or “severe” levels of stress was marginally highest (72%) when all taxa were
involved in the calculation of O/EASPT, but only declined slowly with increasing threshold up
to Pt of 0.6, and was lowest for Pt ≥ 0.7 (Table 6). The percentage of “unstressed” GQA sites
incorrectly classified as being impacted (i.e. type 1 error) was similar for all values of the
threshold Pt for both O/E indices with the exception of higher mis-classification rates for
O/EASPT based on Pt = 0.9.
The ASPT metric was originally intended to provide a measure of the biological response of
freshwater macroinvertebrate communities to stress resulting from organic inputs (e.g. from
agriculture or effluent). Therefore, we also assessed the effect of varying Pt on the statistical
power to detect biological impacts using O/EASPT amongst the GQA classified according to
their perceived level of stress from organic inputs only (Table 6). The statistical power of
O/EASPT for each threshold Pt was higher when the analysis was restricted to detecting severe
levels of stress specifically from organic inputs (Table 6). Although still highest (79%) for Pt
= 0, statistical power of detecting severe organic input stress was similar (74-79%) for all
thresholds up to Pt = 0.5.
It was encouraging to find that the percentage of sites classified as impacted on the basis of
their O/E values increased with the perceived intensity of anthropogenic stress operating at a
site, as one would hope. In addition, the percentage of sites with no known significant overall
stress loading (i.e. “unstressed” sites) which were mis-classified as impacted on the basis of
their O/E values was only 11-20% for both metrics based on thresholds up to 0.7 (Table 6);
this is not enormously greater than the 10% type 1 error expected from reference
sites/samples.
Discussion
The aim of this study was to investigate the effects of excluding taxa with low site-specific
expected probabilities (based on RIVPACS-type models) on the precision and accuracy of
O/E ratios of biotic indices and on their statistical power to detect the biological impacts of
anthropogenic stresses in bioassessments of the ecological status of sites. In particular, we
have assessed the previously-unknown effects of changing probability threshold Pt on
15
bioassessments based on the use of the standard RIVPACS sampling and sample processing
procedures, as used by the government environment agencies (and CEH) throughout the UK
(Environment Agency, 1999). The conclusions can be summarised as follows:
(i) Excluding taxa with low expected probabilities of occurrence results in less
variation (i.e. lower SD) in the O/E estimates for reference sites;
(ii) Estimates of O/E based on all, or most taxa (i.e. using a low Pt) give the lowest
sampling variances at moderately impacted and poor quality sites;
(iii) Increasing the threshold probability Pt for excluded taxa causes systematic
compression of the realised O/E scale towards unity, in that O/E values >1 are on
average reduced, while O/E values <1 have a tendency to be higher and closer to
unity.
(iv) The combined effect of these factors was that statistical power to detect the overall
biological impacts of anthropogenic stresses based on O/ETAXA was similar for
thresholds Pt up to 0.7 (and marginally optimum at Pt of 0.1 or 0.2);
(v) When based on O/EASPT, power to detect impacts from both overall stress and
specifically organic impacts was similarly high for Pt ≤ 0.5 (and marginally
optimum using Pt = 0), although the power to detect effects of organics was greater
(74-79%).
Our results show that, at least for UK RIVPACS samples, the estimate of O/E ratio for
number of taxa at moderately impacted sites has a tendency to increase as an increasing
proportion of the least expected taxa are excluded from site assessments. Systematic changes
in O/E with Pt were also found by Hawkins et al. (2000), who concluded (p1466) that for
their non reference quality test sites “on average O/E50 overestimated O/E0 with the amount
of bias greatest at low O/E50 values” [O/E50 and O/E0 equate to Pt = 0.5 and Pt = 0.0]. As
sites become stressed so sensitive taxa will become less abundant and eventually disappear
from the site and samples. The taxa with the highest RIVPACS expected probabilities of
being found in a sample will generally also be the most abundant at the site (if unstressed).
Therefore, on average, the taxa with relatively low site-specific expected probabilities are
generally likely to disappear first from the site and our sample counts as environmental stress
increases. This may be why ignoring and excluding such taxa from the calculation of O/E
ratios by using a higher threshold Pt leads to values of O/ETAXA declining less from unity.
This may be true as a generality, but the rate of loss of individual taxa depends on the
16
tolerance to stress (or more specifically the actual type(s) of stress operating). Cao and
Hawkins (2005) used field data on reference and impacted test sites to derive stress tolerance
values (TV) for individual taxa which they then used to simulate “true” changes in the
abundances and occurrence of individual taxa with increasing levels of stress. They found
from repeated simulations of fixed count sub-samples, the true reduction in total taxa
richness at a site with stress was under-estimated; this was especially true for counts of 300 or
less individuals. Cao and Hawkins (2005) cleverly explained this by showing that the
evenness of the (simulated) abundances of taxa at a site increased with the level of stress, so
that a relative higher proportion of the taxa still present at a stressed site would be captured in
a fixed count sample. However, changes in evenness of taxa abundance with stress would not
have such an obvious impact on the observed sample taxa richness obtained by area- or time-
based sampling methods such as RIVPACS which aim to identify and include all of the taxa
in a sample. This is discussed further below.
It is less obvious why O/EASPT also tends to be higher at moderately stressed sites when
based on higher expected probability thresholds. One explanation could be that the families
most susceptible to organic pollution (with high BMWP scores) have, on average, much
lower expected probabilities of occurrence than more tolerant families with low scores.
Ignoring taxa with low expected probabilities would then tend to ignore the loss of these
sensitive families and lead to higher estimates of O/EASPT. To assess this, the BMWP families
were assigned to three classes (1-4, 5-7, 8-10) based on their BMWP score (1-10). Zero (i.e.
to three decimal places) expected probabilities were excluded from the subsequent analyses
because some families are naturally restricted to particular types of stream and hence
naturally excluded from a large proportion of the sites. In addition, only families with non-
zero expected probabilities are involved in the calculation of the expected ASPT for a site.
Including the large numbers of zero values would distort the frequency distributions. In the
first approach the average expected probability of occurrence ( ip ) of each individual family i
across the 5752 GQA sites was calculated and then the (boxplot) distributions of the ip for
families within each BMWP class were compared (Fig. 6). The median of the ip for high-
scoring (8-10) families was only 0.13, much lower than the median of 0.46 for the low-
scoring organic-stress-tolerant families (Incidentally, not excluding zero expected
probabilities leads to a lower median ip of 0.07 for the 8-10 scoring families and no change
(to 2 d.p.) in the median for 1-4 scoring families). A second approach was based on
17
comparing the frequency distribution within the same dataset of all non-zero expected
probabilities of occurrence for all families within each BMWP class. Within each class of
BMWP score, the percentages of all non-zero values of expected probability occurring in
each of four classes of expected probability (<0.2, 0.2-0.5, 0.5-0.8, >0.8) were calculated and
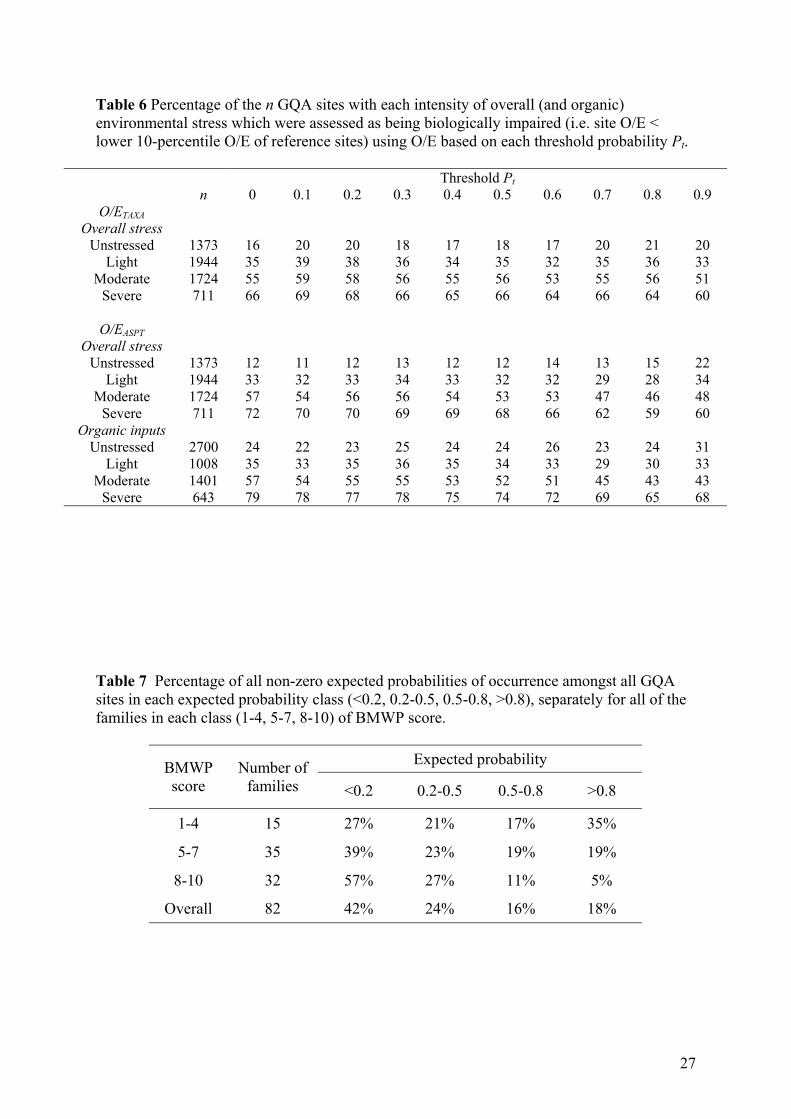
compared (Table 7). For pollution sensitive families (BMWP scoring 8-10), 57% of all non-
zero expected probabilities are less than 0.2, compared to only 27% for pollution tolerant
families (BMWP scoring 1-4). At the other extreme, only 5% of the expected probabilities for
pollution sensitive families were greater than 0.8, compared to 35% for the most tolerant
class of families (Table 7). Similar patterns in the expected probabilities were obtained when
the analysis was based on the RIVPACS reference sites.
It is clear that the families with high BMWP scores, considered to be the most sensitive to
organic stress, do tend to have far lower expected probabilities of occurrence than the
pollution tolerant families with lower BMWP scores. The effect of this naturally occurring
phenomenon is that site bioassessments involving O/EASPT which exclude all families with
low site-specific expected probabilities tend to ignore the loss of these sensitive families and
hence, give values of O/EASPT which deviate less from reference. This effect is greatest at
moderately stressed sites because, at very poor quality sites with O/EASPT less than 0.5, most
of the families still present and found must be low scoring families, which generally have
relative high expected probabilities and thus are much less affected by the exclusion of
families with low site-specific expected probabilities. Similar effects of excluding taxa with
low expected probabilities may occur in other O/E type indices based on other metrics
including those designed to measure specific types of stress.
One possible explanation for the difference between our conclusions and those of some
other studies (Hawkins et al., 2000; Ostermiller & Hawkins, 2004) on the perceived value of
excluding taxa with low site-specific expected probabilities could be the sampling method
and, perhaps more importantly, the sample processing procedures used. In the UK RIVPACS
standardised procedures (Environment Agency, 1999), a 3 minute active kick sample with a
pond net of all habitats in proportion to their estimated occurrence is supplemented by a 1-
min hand search for taxa likely to be missed in the kick sample; this will extend the sample
taxa list and generally add less abundant taxa. Then in the laboratory, the whole sample is
carefully sorted with the aim of finding all of the taxa in the sample. In contrast, most other
studies of the factors influencing bioassessment accuracy have been based on sampling
protocols which involve sub-sampling, identifying and counting a ‘random’ fixed number of
18
individuals from the field sample. The AUSRIVAS procedure involves taking a random sub-
sample and counting 200 individuals regardless of the total number of individuals in the field
sample (Simpson & Norris, 2000). In their study, Ostermiller and Hawkins (2004) used fixed
counts of random sub-samples of 50, 100, ... , 450 individuals. The abundance frequency
distributions of such random fixed count sub-samples are likely to have shorter tails (i.e.
include proportionally fewer rare taxa present in low numbers) than the distributions obtained
by searching through the whole sample to try to find all of the taxa present. One way to
assess this idea would be to compare sampling/processing protocols in terms of the relative
frequencies of rare taxa in the sample counts (akin to the study of Cao and Hawkins (2005)).
With RIVPACS-type models, the percentage of all (non-zero) expected probabilities which
are less than some small value could be calculated. For example, for the UK RIVPACS
sampling protocol, 42% of all non-zero (to 3 d.p.) RIVPACS expected probabilities of
occurrence are less than 0.2 (Table 7). We suggest that RIVPACS-type models based on
sampling methods involving random sub-sampling of a fixed number of individuals are likely
to contain a lower equivalent percentage of low expected probabilities because they tend to
include less of the locally-rare taxa. In an analysis of 7-20 yr surber sample surveys of
benthic macroinvertebrates from 10 sites, Resh et al. (2005) found that 17-33% of taxa were
‘rare’ in that they only incurred in one year at any particular site. The abundance frequency
distribution (and more obviously, taxa richness) for a site, the field sample from it and the
subsequent laboratory (sub-)count can be quite different – this could have implications for
metric calculation and biases in estimates of changes in O/E with stress.
This study has highlighted that the choice of expected probability threshold Pt influences both
the variability and effective scaling of O/E indices above and below unity. Therefore O/E
indices based on different thresholds need to be treated as separate indices with different
effective scales from the point of view of setting appropriate critical values of O/E as quality
or ecological status class boundaries. You need to compare like with like.
Finally, for UK RIVPACS, using a threshold expected probability Pt for exclusion of
between 0.0 and 0.2 appears to provide the best overall compromise solution and marginally
highest statistical power to detect impacts; although power was very similar for thresholds up
to 0.5. Moreover, our analyses provide no support for switching the standard assessment of
river sites based on the UK RIVPACS model and UK RIVPACS sampling procedures from
the current approach of basing O/E values on all of the taxa (i.e. Pt =0) to a system based on
only involving taxa with site-specific expected probabilities of 0.5 or more.
19
Acknowledgements
The 1995 General Quality Assessment (GQA) data was provided by the Environment Agency
of England and Wales. This research was funded by the UK Natural Environment Research
Council through its Centre for Ecology and Hydrology. We would like to thank the referees,
John Van Sickle and Yong Cao, who provided very insightful criticisms and comments which
helped improve our paper.
References
Armitage P.D., Moss D., Wright J.F. & Furse M.T. (1983) The performance of a new biological
water quality score system based on macroinvertebrates over a wide range of unpolluted
Wright J.F. (1995) Development and use of a system for predicting macroinvertebrates in
flowing water. Australian Journal of Ecology 20, 181-197.
Wright J.F., Moss D., Armitage P.D. & Furse M.T. (1984) A preliminary classification of
running water sites in Great Britain based on macro-invertebrate species and prediction of
community type using environmental data. Freshwater Biology 14, 221-256.
Wright J.F., Sutcliffe D.W & Furse M.T. (2000) Assessing the Biological Quality of Fresh
waters: RIVPACS and other Techniques. Freshwater Biological Association, Cumbria, UK.
Zahrádková S., Kokeš J., Hodovský J., Vojtíšková D., Scheibová D., Pořízková Y.,
Schenková J. & Helešic J. (2000) Prediction system PERLA. In: Limnologie na přelomu
tisíciletí. Sborník referátů XII. limnologické conference ( Ed Rulík M.), pp. 260-264.
Univerzita Palackého Olomouci, Czech Republic.
23
Table 1 Characteristics of the stratified random selection of BAMS sites in terms of (a) RIVPACS site group and (b) ecological quality grades as defined by the range of O/E values in the previous national river quality survey. (a)
Table 2 Twelve types of anthropogenic stress estimated at each of 5752 GQA sites and the derived measure of overall stress intensity for each site. The level (0-3) of each stress type was recorded for each site (0 = no stress, 1 = light, 2 = moderate, 3 = severe stress). Organic input Acidification Agricultural chemical inputs Reduced discharge Canalisation Riparian habitat modifications Sedimentation Urban run-off Industrial discharge and run-off Intensive arablisation Consolidated banks Excessive instream plant growth Overall stress intensity based on categories of the sum (S) of the levels of all stress types Unstressed S = 0 Light S = 1-2 Moderate S = 3-5 Severe S = >5
24
Table 3 Comparison of the observed and expected BMWP families for a replicate sample taken in spring from the BAMS site at Swarkestone on Cuttle Brook, together with the effect of using various thresholds probabilities Pt on O/ETAXA. BMWP families arranged in decreasing order of expected probability of capture (pi).
Table 4 Distribution of O/ETAXA and O/EASPT values for the 614 RIVPACS reference sites (spring samples) in terms of (a) standard deviation (SD) and (b) lower 10-percentile value.
Table 5 Average replicate standard deviation (SD) in O/E across all sites and seasons and for classes of replicate mean value of O/E, using a range of expected probability thresholds Pt for (a) O/ETAXA and (b) O/EASPT based on all single season samples from the BAMS sites.
Table 6 Percentage of the n GQA sites with each intensity of overall (and organic) environmental stress which were assessed as being biologically impaired (i.e. site O/E < lower 10-percentile O/E of reference sites) using O/E based on each threshold probability Pt.
Table 7 Percentage of all non-zero expected probabilities of occurrence amongst all GQA sites in each expected probability class (<0.2, 0.2-0.5, 0.5-0.8, >0.8), separately for all of the families in each class (1-4, 5-7, 8-10) of BMWP score.
Expected probability BMWP score
Number of families <0.2 0.2-0.5 0.5-0.8 >0.8
1-4 15 27% 21% 17% 35%
5-7 35 39% 23% 19% 19%
8-10 32 57% 27% 11% 5%
Overall 82 42% 24% 16% 18%
27
Figure legends Fig. 1 Illustration of the change in O/E for number of taxa in relation to the threshold expected probability Pt for three replicate spring samples (●, ▲and ■) from the BAMS site at Swarkestone on Cuttle Brook. Fig. 2 Boxplot distributions of the O/E values for the 614 RIVPACS reference sites (spring samples) using a range of expected probability thresholds Pt for (a) O/ETAXA and (b) O/EASPT. Boxes denote inter-quartile ranges, horizontal bars denote medians and solid circles denote mean values. Fig. 3 Average replicate standard deviation (SD) in O/E for classes of replicate mean value of O/E, using expected probability thresholds Pt of 0.0, 0.1, 0.3, 0.5, 0.7 and 0.9 for (a) O/ETAXA and (b) O/EASPT based on all single season samples from the BAMS sites. Fig. 4 Median difference in O/E (i.e. O/E using a threshold Pt minus O/E for Pt = 0.0) for classes of n GQA sites grouped by 0.1 intervals of their O/E value for Pt = 0.0. Thresholds Pt: 0.1 (*), 0.3 (○), 0.5 (●), 0.7 (■), 0.9 (▲) for (a) O/ETAXA and (b) O/EASPT based on spring samples from the GQA sites. Fig. 5 Median difference in O/E (i.e. O/E using a threshold Pt minus O/E for Pt = 0.5) for classes of n GQA sites grouped by 0.1 intervals of their O/E value for Pt = 0.5. Thresholds Pt: 0.0 (●), 0.1 (*), 0.3 (○), 0.7 (■), 0.9 (▲) for (a) O/ETAXA and (b) O/EASPT based on spring samples from the GQA sites. Fig. 6 Boxplots of the distribution of the average expected probability of occurrence for each BMWP family across all 5752 GQA sites, for families grouped by their BMWP score (1-4, 5-7, 8-10). Boxes denote inter-quartile ranges, horizontal bars denote medians (value indicated) and circles denote average expected probabilities for individual families.
28
Threshold P
O/E
0.90.80.70.60.50.40.30.20.10.0
1.0
0.9
0.8
0.7
0.6
0.5
0.4
0.3
t
Fig. 1 Illustration of the change in O/E for number of taxa in relation to the threshold expected probability Pt for three replicate spring samples (●, ▲and ■) from the BAMS site at Swarkestone on Cuttle Brook.
29
Threshold P
TAXA
O/E
0.90.80.70.60.50.40.30.20.10.0
1.8
1.6
1.4
1.2
1.0
0.8
0.6
0.4
0.2
0.0
t
(a)
Threshold P
ASPT
O/E
0.90.80.70.60.50.40.30.20.10.0
1.4
1.2
1.0
0.8
0.6
0.4
0.2
0.0
t
(b)
Fig. 2 Boxplot distributions of the O/E values for the 614 RIVPACS reference sites (spring samples) using a range of expected probability thresholds Pt for (a) O/ETAXA and (b) O/EASPT. Boxes denote inter-quartile ranges, horizontal bars denote medians and solid circles denote mean values.
30
Replicate mean TAXA O/E
Repl
icat
e SD
of
TAXA
O/E
>0.90.6-0.9<0.6
0.14
0.12
0.10
0.08
0.06
0.04
0.02
0.00
(a)
0.0 0.3 0.70.1 0.5 0.9
Replicate mean ASPT O/E
Repl
icat
e SD
of
ASPT
O/E
>0.90.7-0.9<0.7
0.14
0.12
0.10
0.08
0.06
0.04
0.02
0.00
(b)
0.0 0.3 0.70.1 0.5 0.9
Fig. 3 Average replicate standard deviation (SD) in O/E for classes of replicate mean value of O/E, using expected probability thresholds Pt of 0.0, 0.1, 0.3, 0.5, 0.7 and 0.9 for (a) O/ETAXA and (b) O/EASPT based on all single season samples from the BAMS sites.
Fig. 4 Median difference in O/E (i.e. O/E using a threshold Pt minus O/E for Pt = 0.0) for classes of n GQA sites grouped by 0.1 intervals of their O/E value for Pt = 0.0. Thresholds Pt: 0.1 (*), 0.3 (○), 0.5 (●), 0.7 (■), 0.9 (▲) for (a) O/ETAXA and (b) O/EASPT based on spring samples from the GQA sites.
Fig. 5 Median difference in O/E (i.e. O/E using a threshold Pt minus O/E for Pt = 0.5) for classes of n GQA sites grouped by 0.1 intervals of their O/E value for Pt = 0.5. Thresholds Pt: 0.0 (●), 0.1 (*), 0.3 (○), 0.7 (■), 0.9 (▲) for (a) O/ETAXA and (b) O/EASPT based on spring samples from the GQA sites.
33
BMWP score for family
Aver
age
expe
cted
pro
babi
lity
for
fam
ily
8-105-71-4
1.0
0.8
0.6
0.4
0.2
0.0
0.46
0.27
0.13
Fig. 6 Boxplots of the distribution of the average expected probability of occurrence for each BMWP family across all 5752 GQA sites, for families grouped by their BMWP score (1-4, 5-7, 8-10). Boxes denote inter-quartile ranges, horizontal bars denote medians (value indicated) and circles denote average expected probabilities for individual families.


![…MODEL ROLE STRESSOR… [R.T. HAMDANI, S.NG]](https://static.documents.pub/doc/80x56/6157d301ce5a9d02d46f7dcb/model-role-stressor-rt-hamdani-sng.jpg)


