Artificial Gravity for Human Exploration Missions B. KENT JOOSTEN Exploration Analysis and Integration Office NATIONAL AERONAUTICS AND SPACE ADMINISTRATION LYNDON B. JOHNSON SPACE CENTER 2101 NASA Road 1, Houston, TX 77058-3696 Mail Code: EX13 Voice: (281) 483-4645 FAX: (281) 244-7478 kent . joosten @ jsc . nasa . gov NEXT Status Report July 16, 2002
Transcript
Artificial Gravity for HumanExploration Missions
B. KENT JOOSTENExploration Analysis and Integration OfficeNATIONAL AERONAUTICS AND SPACE ADMINISTRATIONLYNDON B. JOHNSON SPACE CENTER2101 NASA Road 1, Houston, TX 77058-3696Mail Code: EX13 Voice: (281) 483-4645 FAX: (281) [email protected]
– Identify positive or negative system and missionimpacts related to AG requirement
• Constraints:– Artificial-gravity levels and rotational parameters
as agreed to by NASA NEXT team March 2002• Approach:
– Choose “archetype” mission to drive out systemperformance requirements
– Make spacecraft systems selections with greatestAG synergy
Rationale for Artificial-G
• Continuing serious concerns regardinghuman physiological effects of long-duration microgravity exposure– Loss of bone mineral density– Skeletal muscle atrophy– Orthostatic hypertension
• Current countermeasures deemedineffective (in particular w.r.t. bonemineral density loss)
AG Constraints
• Nominal design = 1.0 g– Essentially no data on efficacy of hypo-g as countermeasure– Acquiring this data would likely be difficult, time-consuming, and
expensive• Rotation levels ! 4 rpm
– Acceptable crew adaptation times based on rotating room studies• Implies rotation radius of " 56 meters
Artificial Gravity Map
0
50
100
150
200
1.0 2.0 3.0 4.0 5.0
Angular Rate (rpm)
Rot
atio
n R
adiu
s (m
)
0.2
0.4
0.6
0.8
1.0
Design Goal
Mission Archetype
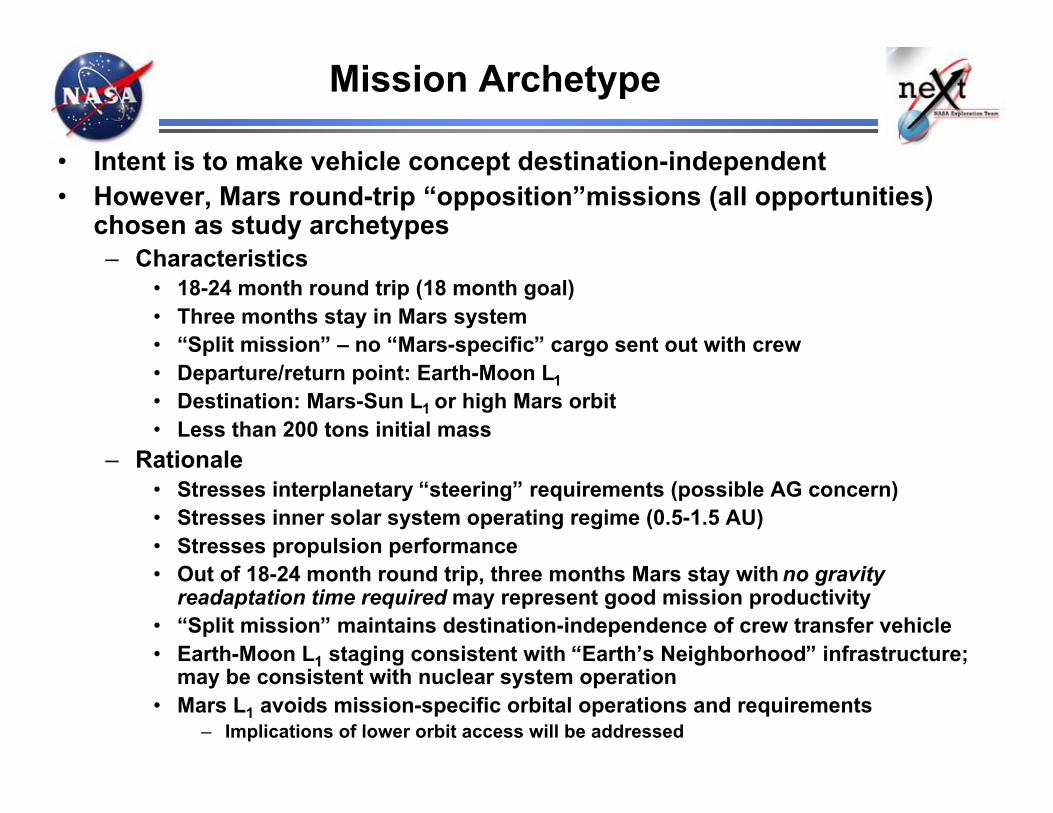
• Intent is to make vehicle concept destination-independent• However, Mars round-trip “opposition”missions (all opportunities)
chosen as study archetypes– Characteristics
• 18-24 month round trip (18 month goal)• Three months stay in Mars system• “Split mission” – no “Mars-specific” cargo sent out with crew• Departure/return point: Earth-Moon L1• Destination: Mars-Sun L1 or high Mars orbit• Less than 200 tons initial mass
– Rationale• Stresses interplanetary “steering” requirements (possible AG concern)• Stresses inner solar system operating regime (0.5-1.5 AU)• Stresses propulsion performance• Out of 18-24 month round trip, three months Mars stay with no gravity
readaptation time required may represent good mission productivity• “Split mission” maintains destination-independence of crew transfer vehicle• Earth-Moon L1 staging consistent with “Earth’s Neighborhood” infrastructure;
may be consistent with nuclear system operation• Mars L1 avoids mission-specific orbital operations and requirements
– Implications of lower orbit access will be addressed
Technology/Systems Selections
• Nuclear Electric Propulsion - NEP and artificial gravity may begood match in vehicle design (NEXT Groundrule)– Constant low-thrust
• Allows thrusting while under spin (low forces, torques)– No spin-down, burn, spin-up sequences
• Long booms, trusses, etc. required for AG moment arms can serve asreactor “1/r2” crew radiation shielding
• Reactor, power conversion systems = good “counterweight”• ECLSS – Regenerable water, oxygen
– Mission times consistent with AG require closed systems– Lower mass system choices possible if high power availability
assumed (consistent with NEP)• Other system choices were assessed as to influence of 1-g
operation
Other Assumptions
• Technology Horizon ~ 2015– Avoid conclusions regarding AG feasibility being
influenced by questionably optimistic technologyassumptions
– Implications for NEP (validated by MSFC)• Isp: 4000 – 6000 sec• Power: 5 – 12 MWe• Specific Power (#): 4 – 8 kg/kWe
• Reusability " 3 missions– AG vehicle configurations may require substantial on-
orbit assembly/outfitting• High overhead if required for every flight
– Nuclear systems will represent substantial investment– Consistent with high energy density potential of nuclear
systems
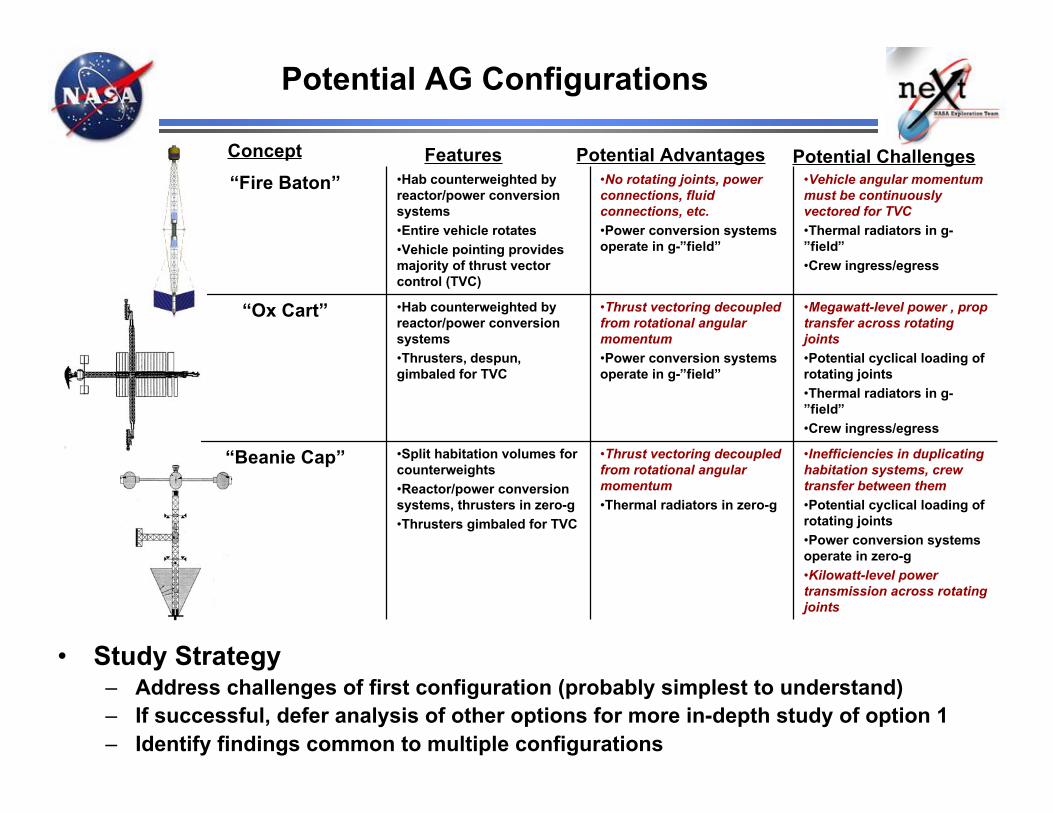
Potential AG Configurations
•Inefficiencies in duplicatinghabitation systems, crewtransfer between them•Potential cyclical loading ofrotating joints•Power conversion systemsoperate in zero-g•Kilowatt-level powertransmission across rotatingjoints
•Thrust vectoring decoupledfrom rotational angularmomentum•Thermal radiators in zero-g
•Split habitation volumes forcounterweights•Reactor/power conversionsystems, thrusters in zero-g•Thrusters gimbaled for TVC
“Beanie Cap”
•Megawatt-level power , proptransfer across rotatingjoints•Potential cyclical loading ofrotating joints•Thermal radiators in g-”field”•Crew ingress/egress
•Thrust vectoring decoupledfrom rotational angularmomentum•Power conversion systemsoperate in g-”field”
•Hab counterweighted byreactor/power conversionsystems•Thrusters, despun,gimbaled for TVC
“Ox Cart”
•Vehicle angular momentummust be continuouslyvectored for TVC•Thermal radiators in g-”field”•Crew ingress/egress
•No rotating joints, powerconnections, fluidconnections, etc.•Power conversion systemsoperate in g-”field”
“Fire Baton”Concept Features Potential Advantages Potential Challenges
• Study Strategy– Address challenges of first configuration (probably simplest to understand)– If successful, defer analysis of other options for more in-depth study of option 1– Identify findings common to multiple configurations
• Approach– Look at performance in representative good opportunities (2018)
and poor opportunities (2012 or 2026)– Systematically vary key parameters to gauge general performance
• Isp• Power and !• Flight time
– Plot initial mass as a function of these parameters• Three different groups supporting the trajectory analysis
activity:– JSC/EG using the RAPTOR tool, based on calculus of variations
with a genetic algorithm to find a reasonable initial point– GRC using the VARITOP tool, based on calculation of variations– SAIC/Chicago using CHEBYTOP tool, based on Chebyshev
polynomial approximations• Results being compared to understand both trajectory
characteristics and any biases introduced by toolcharacteristics.
Initial Mass Performance(as a function of total flight time)
Typi
cal C
onju
nctio
n C
lass
Rou
nd T
rip w
ith 1
8 M
onth
Sta
y
Typi
cal O
ppos
ition
Cla
ss R
ound
Trip
with
1 M
onth
Stay
Desired Performance Range
Example Trajectories
2026 Opportunity
710 Day Round Trip Case
(Unfavorable Opportunity)
Perihelion = 0.416 A.U.
-2.0
-2.0
-1.0
-1.0
Earth Departure
1.0
2.0
Mars Arrival
1.0 2.0
Mars Departure
Earth Arrival
2018 Opportunity
660 Day Round Trip Case
(Favorable Opportunity)
Perihelion = 0.426 A.U.
-2.0
-2.0
-1.0
-1.0
Earth Departure
1.0
2.0
Mars Arrival
1.0 2.0
Mars Departure
Earth Arrival
For both cases: 6MW at 6 kg/kW, 5000 sec Isp, 90 MT dry mass
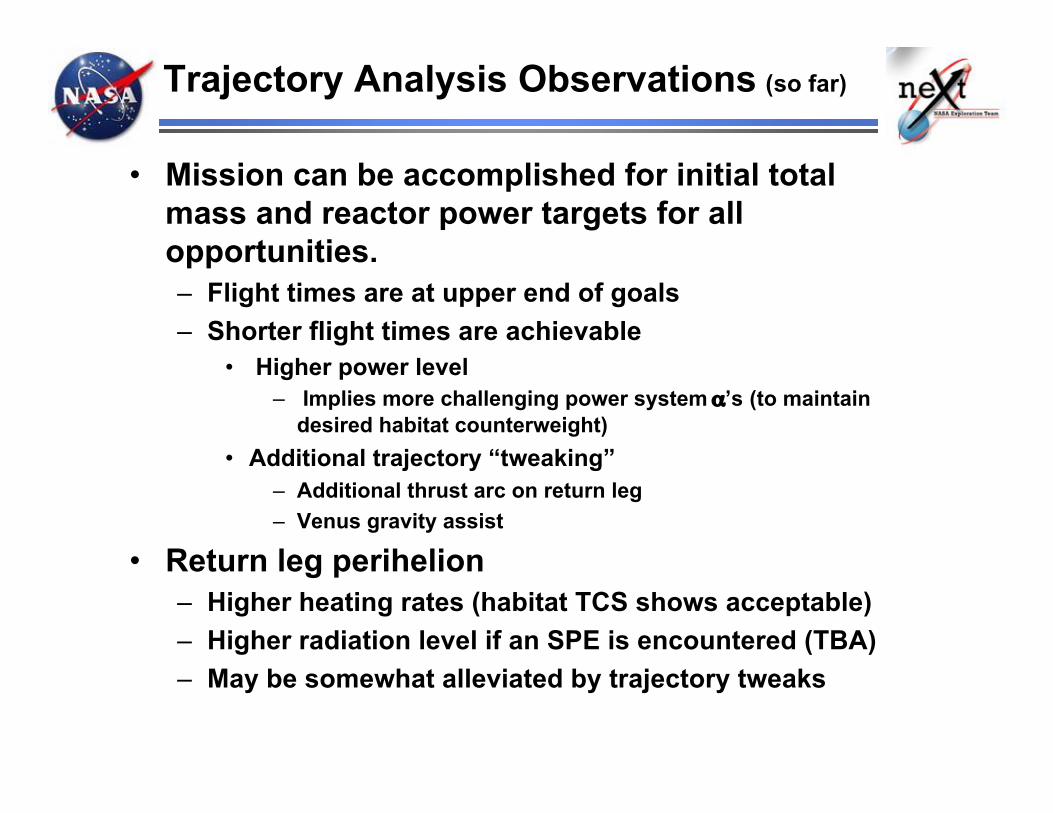
Trajectory Analysis Observations (so far)
• Mission can be accomplished for initial totalmass and reactor power targets for allopportunities.– Flight times are at upper end of goals– Shorter flight times are achievable
• Higher power level– Implies more challenging power system !’s (to maintain
– Additional thrust arc on return leg– Venus gravity assist
• Return leg perihelion– Higher heating rates (habitat TCS shows acceptable)– Higher radiation level if an SPE is encountered (TBA)– May be somewhat alleviated by trajectory tweaks
Ratios of Moments of Inertiadetermine spin stabilityabout corresponding axes
Unstable
Unstable
Ixx/Izz
Ixx/Iyy
ConditionallyStable
(Minor Axis Spinner)
Stable(Major Axis Spinner)
1
1
Note: x – spin axis
MoreStable
MoreManeuverable
MoreManeuverable
MoreStable
Vehicle Spinup Performance
1
10
100
1000
1 10 100 1000
Spinup Thrust Level, N
Sp
inu
p T
Ime, h
rs
1
10
100
1000
Arc
jet In
pu
t Po
we
r, kW
e
Spinup TIme ArcJet @ Isp=800 ArcJet @ Isp=1000
Spinup / Spindown
• Vehicle spinup/spindownrequirements not difficult tomeet– Large moment arm for RCS– Trade between thrust level and
thruster on-time• Arcjet RCS may have role to
play if:– Robust vehicle power available– Propellant reduction a priority– Improvement in arcjet thruster
throughput– Extended (days) spinup time
OK• Flywheel momentum storage
probably not a player– Momentum storage = 1 m dia.,
55,000 kg flywheel at 60,000rpm
222800 (Arcjet)
1801000 (Advanced Arcjet)
400450 (LOX/LH2)
580310 (MMH/N2O4)
Prop mass forspinup (or down), kg
Thruster Isp, sec
Total moment = 2*Thrust*Moment armMoment arm = 50 mVehicle Ixx =2.1x10⁸ kg-m2
ESEX-typeArcjet
STS VernierRCS
-1.5 -1 -0.5 0 0.5 1
-1
-0.5
0
0.5
1
1.5
X (AU)
2026 Opportunity – 710 day Total Mission
Y (A
U)
Steering Requirements
• Steering requirements seem to fall into two classes– Very slow rates during majority of trajectory (interplanetary cruise)– Moderate rates during Earth departure/arrival and mid-course
• Different steering strategies may be pursued for these classes• Higher rates not anticipated unless mission requirements change
(descent to lower Earth/Mars orbits)
2 x 180°
180°
580°
2 x 90°-180°
Maximum TurnRequired
2°/dayHeliocentric
2°/dayMars-Sun L1Arrival/Departure
~10 °/dayMid-CourseThrust Reversal
13°/dayEarth-Moon L1Departure/Arrival
MaximumRequiredTurning Rate
Mission Phase
Gyroscopic Precession
• Precession (steering)accomplished by torquingat right angles to desiredrotation direction
• Constant torque producesconstant steering rate
pI
Fr
P
2:rateTurn =!
• Two methods of torquingrotating vehicle underexamination– Differential thrusting
during appropriaterotation arcs
– Control Moment Gyrotorquing of spacecraftby commanding gimbalrates
Differential thrustingduring proper portionof rotation producespitching moment –causes gyroscopicprecession in yaw
x
y
z
PitchingMoment
PrecessionalYaw Rate
VehicleRotation
Thrustingarcs
Directionof MainThrust
y
z
PitchingMoment
PrecessionalYaw Rate
Roll
Cyclic torquing of CMGcauses pitching moment onvehicle – causesgyroscopic precession inyaw
xGimbalrotationrate
CMG
Steering Trades
• If steering with RCS,thrusting would occurin +x direction only
– Augments mainpropulsion
– Thrusters could beutilized at either orboth ends of vehicle
• If steering with mainpropulsion, thruster(s)would be differentiallythrottled at appropriatetime during rotation
CMGsNot yetaddressed
Propulsive
RCS
MainPropulsion
AsymmetricSymmetricCentral
SymmetricTerminal
AsymmetricCG
AsymmetricCounter
Variable Power
Variable MassFlow Rate
Chemical
ArcjetVehicleSteering
x
y
z
PitchingMoment
ResultingPrecessionalYaw Rate
VehicleRotation
Thrustingarc
Directionof MainThrust
Steering with RCS Steering with main(s)
x
y
z
PitchingMoment
ResultingPrecessionalYaw Rate
VehicleRotation
DifferentialThrusting arc
Directionof MainThrust
RCS Precessional Steering• Propellant Quantities
– Effectiveness of RCS steering can be estimated byintegrating precession eq.
– Prop quantities relatively high for chemical systems– could total 10-15 tons if all turning done withprecessional RCS (assuming 4x360°)
– Quantities can increase up to 35% if rotationalthrusting arcs are long (inefficient momentgeneration)
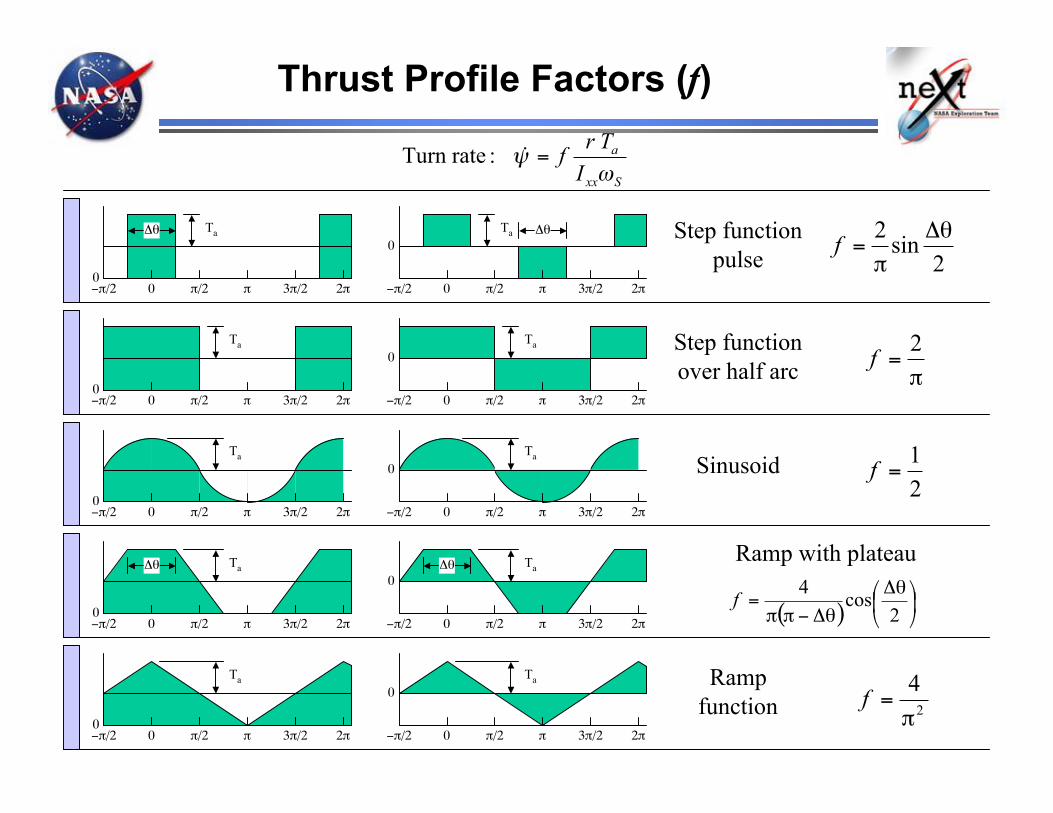
• Thrust Levels– Thrust levels required for vehicle turning computed
from precession eq.– “Thrust Profile Factor” used to account for thrust
pulse characteristics (f)• Arcjets may be applicable
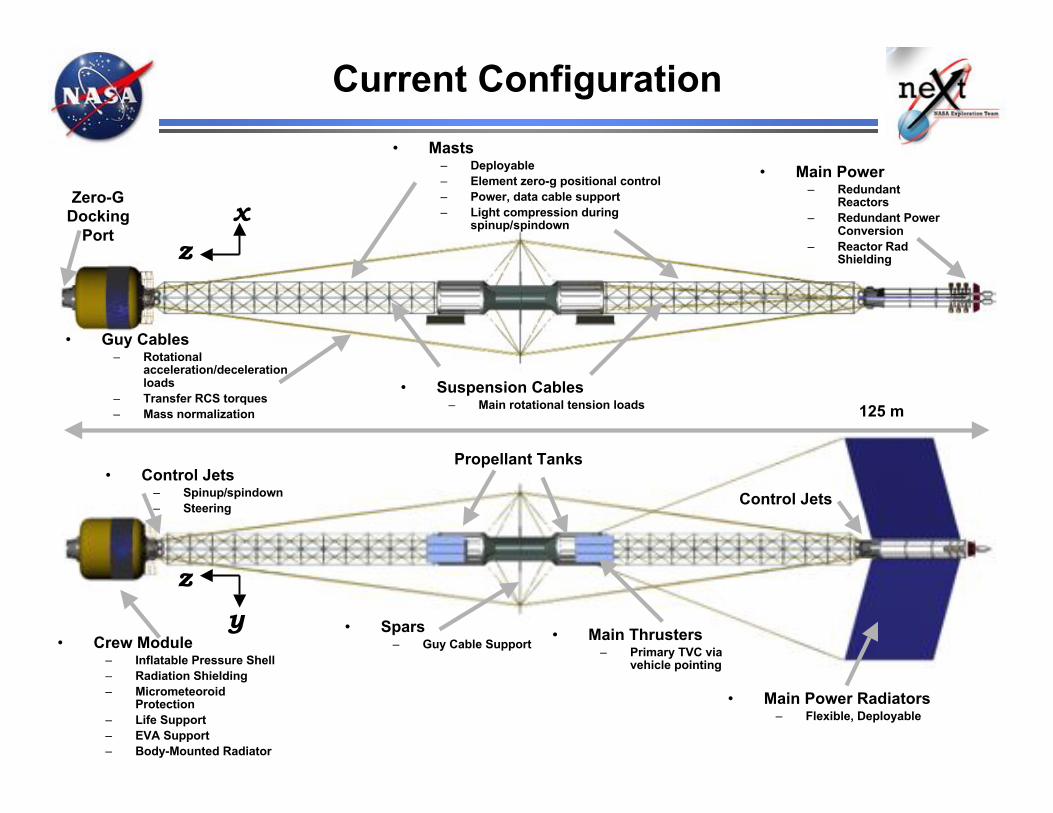
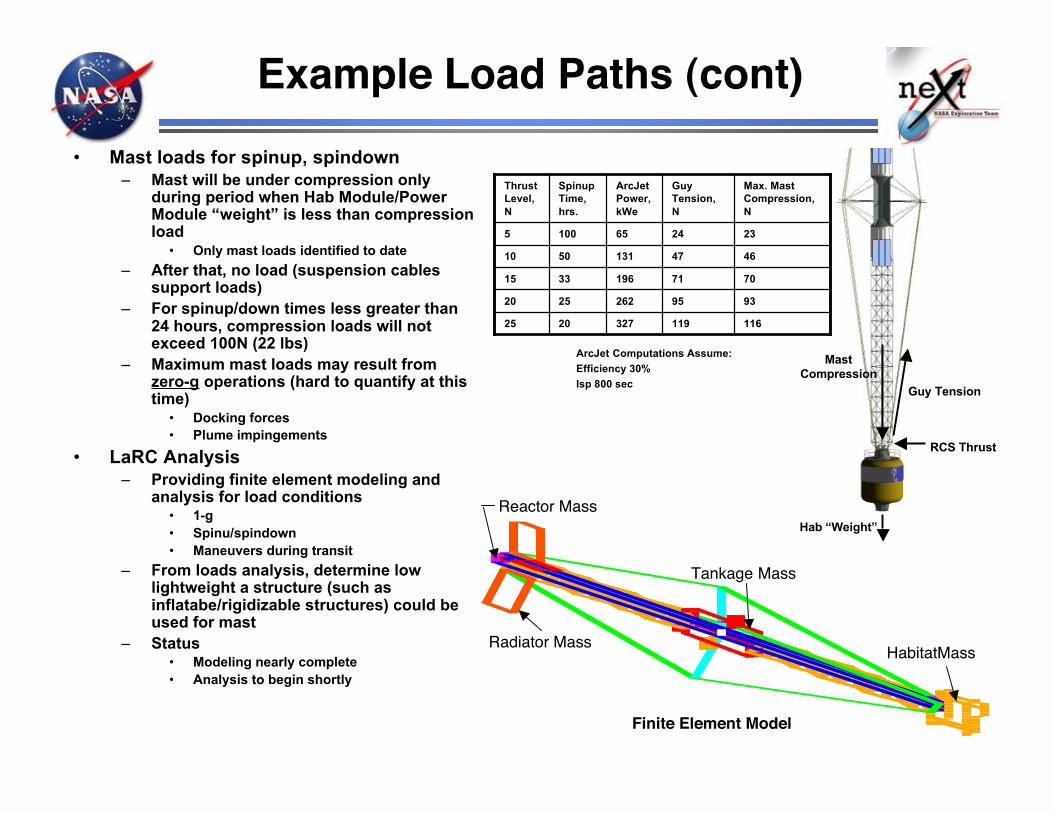
• Extended structure required for 1-g / 4 rpmoperation– Lightweight (performance)– Stiff/Strong (“rigid body” transfer of
forces/moments)– Deployable (practical assembly)
• “Suspension-Compression” Structureused for “Existence Proof”– Allows material optimization for specific load
paths (mass minimization)
“Suspension-Compression” Structure
• Suspension Components– Suspension Cables
• Counterweight mass support during spin– Guy cables
• Moment transfer from RCS– Spinup/spindown– Steering during spin
• Mass balancing– “Liquid Crystal Polymer” (LCP) fibers selected for concept vehicle
• Properties used for analysis - Celanese Vectran"
• Excellent tensile properties (Specific Tensile Strength >15x steel)• Much higher resistance to abrasion, fatigue, UV and radiation than Aramids (i.e. Kevlar"), much lower
creep than UHWPE’s (i.e. Spectra")• Compression Components
– Masts• Positional control of elements (despun) TBD• Compression during initial spinup• Support for power cabling• Minor axis torques TBD
– Spars• Guy cable support
– “Ultra High Modulus Graphite” selected for concept vehicle• Properties used for analysis – BP Amoco Thornel" Carbon Fiber P-650/42 and P-120 Carbon Fiber/Epoxy• P-120 allows extreme stiffness (Specific Stiffness >9x steel, Al)• P-650/42 provides very large compressive strength (1720 Mpa Yield)• Negligible thermal expansion
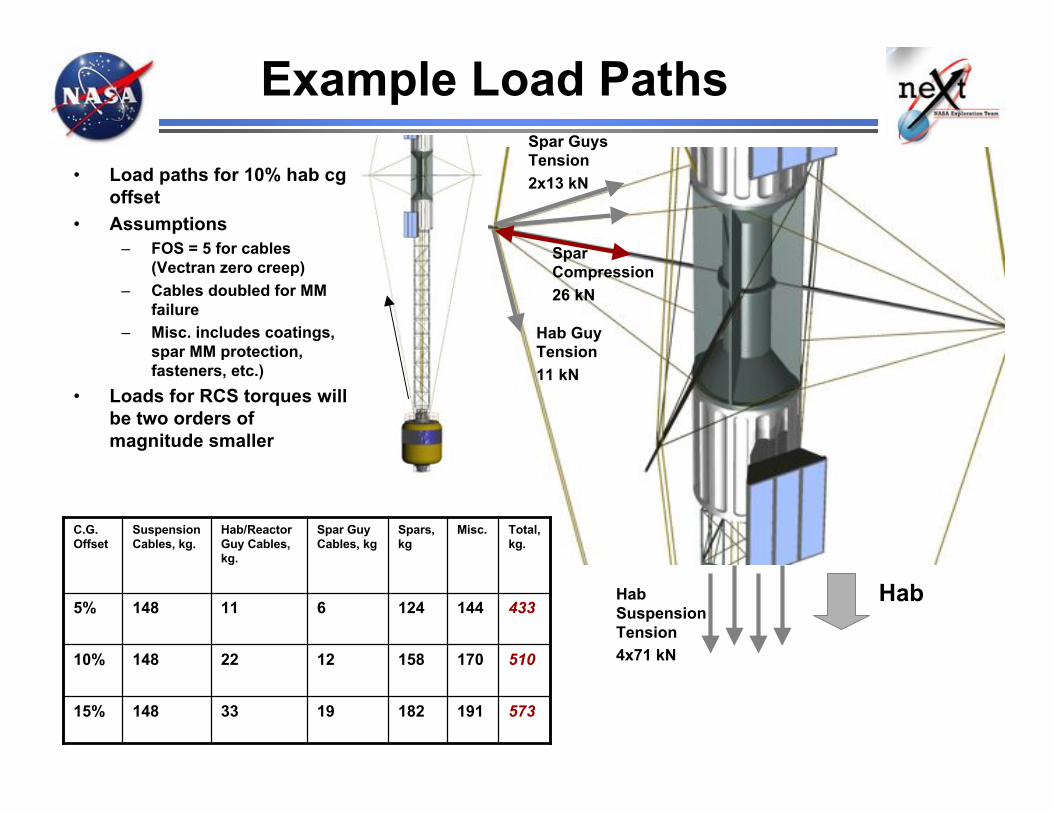
Center of Gravity Control• CG offsets in hab and power modules can cause stability concerns• Several cg control modes possible
– Active ballasting/mass trim• Disadvantage: ballast & mechanism mass
– Active control of suspension/guy cable tension• Advantages:
– Shares load paths with RCS– Low mass augmentation for increased loads
• Example – 10% (0.4 m) hab xy-cg misalignment (should be extreme case)– 0.4 m cg shift within suspension cable envelope in current design (cables @ 1.3
m)– Causes vehicle nutation (“coning”) of ~3°– Equalizing suspension cable tension will allow hab rotation & cg alignment –
but results in floor tilt (4° for 10% x-cg)– Hab guy cables can be utilized for cg alignment while maintaining level
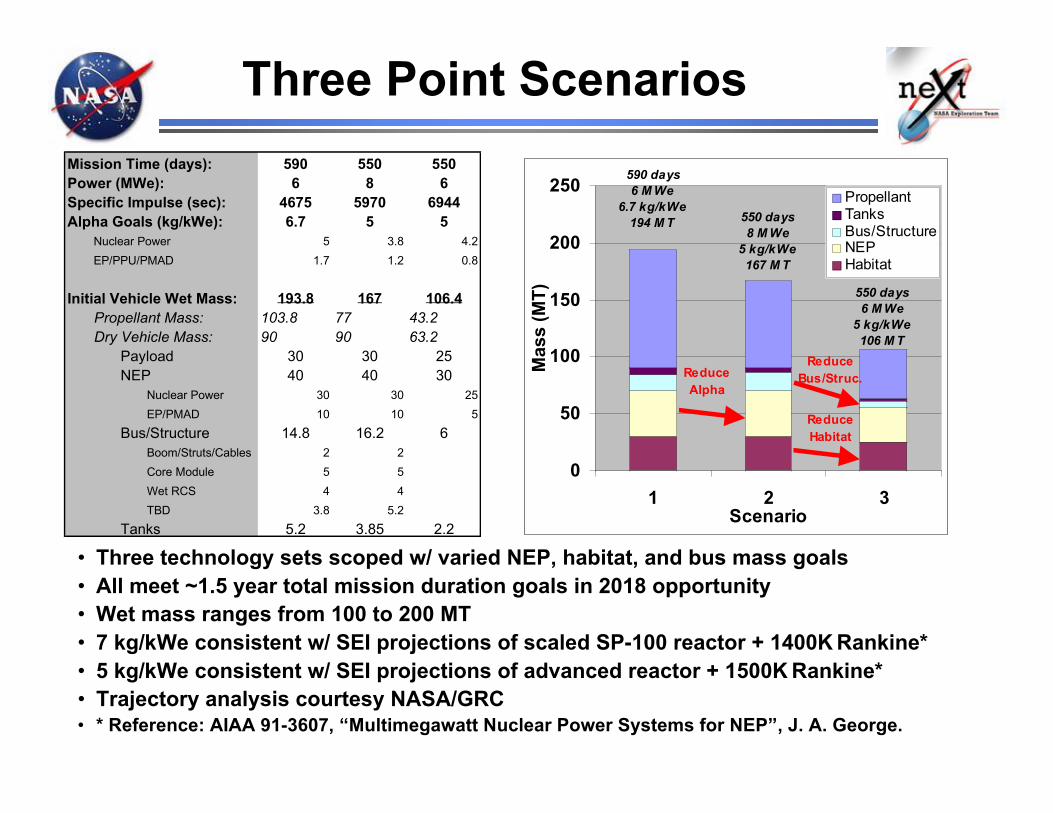
• Three technology sets scoped w/ varied NEP, habitat, and bus mass goals• All meet ~1.5 year total mission duration goals in 2018 opportunity• Wet mass ranges from 100 to 200 MT• 7 kg/kWe consistent w/ SEI projections of scaled SP-100 reactor + 1400K Rankine*• 5 kg/kWe consistent w/ SEI projections of advanced reactor + 1500K Rankine*• Trajectory analysis courtesy NASA/GRC• * Reference: AIAA 91-3607, “Multimegawatt Nuclear Power Systems for NEP”, J. A. George.
Mission Time (days): 590 550 550
Power (MWe): 6 8 6
Specific Impulse (sec): 4675 5970 6944
Alpha Goals (kg/kWe): 6.7 5 5
Nuclear Power 5 3.8 4.2
EP/PPU/PMAD 1.7 1.2 0.8
Initial Vehicle Wet Mass: 193.8 167 106.4
Propellant Mass: 103.8 77 43.2
Dry Vehicle Mass: 90 90 63.2
Payload 30 30 25
NEP 40 40 30
Nuclear Power 30 30 25
EP/PMAD 10 10 5
Bus/Structure 14.8 16.2 6
Boom/Struts/Cables 2 2
Core Module 5 5
Wet RCS 4 4
TBD 3.8 5.2
Tanks 5.2 3.85 2.2
0
50
100
150
200
250
1 2 3Scenario
Mass (
MT
)
PropellantTanksBus/StructureNEPHabitat
590 days
6 M We
6.7 kg/kWe
194 M T
550 days
6 M We
5 kg/kWe
106 M T
550 days
8 M We
5 kg/kWe
167 M T
Reduce
Alpha
Reduce
Bus/Struc.
Reduce
Habitat
Power Module Concept
Reactor12 MWt
Reactor12 MWt
Power Conv.1.0 MWe
Power Conv.1.0 MWe
Power Conv.1.0 MWe
Power Conv.1.0 MWe
Power Conv.1.0 MWe
Power Conv.1.0 MWe
Thruster1.0 MWe
Thruster1.0 MWe
Thruster1.0 MWe
Thruster1.0 MWe
Thruster1.0 MWe
Thruster1.0 MWe
Cro
ss S
trap
ped
PMA
D
Shared Radiator
• Rankine Conversion assumed due to:- Lowest mass @ MWe powers- Lowest radiator area- Lowest reactor temperature- Though adds complexities of 2-phase fluid
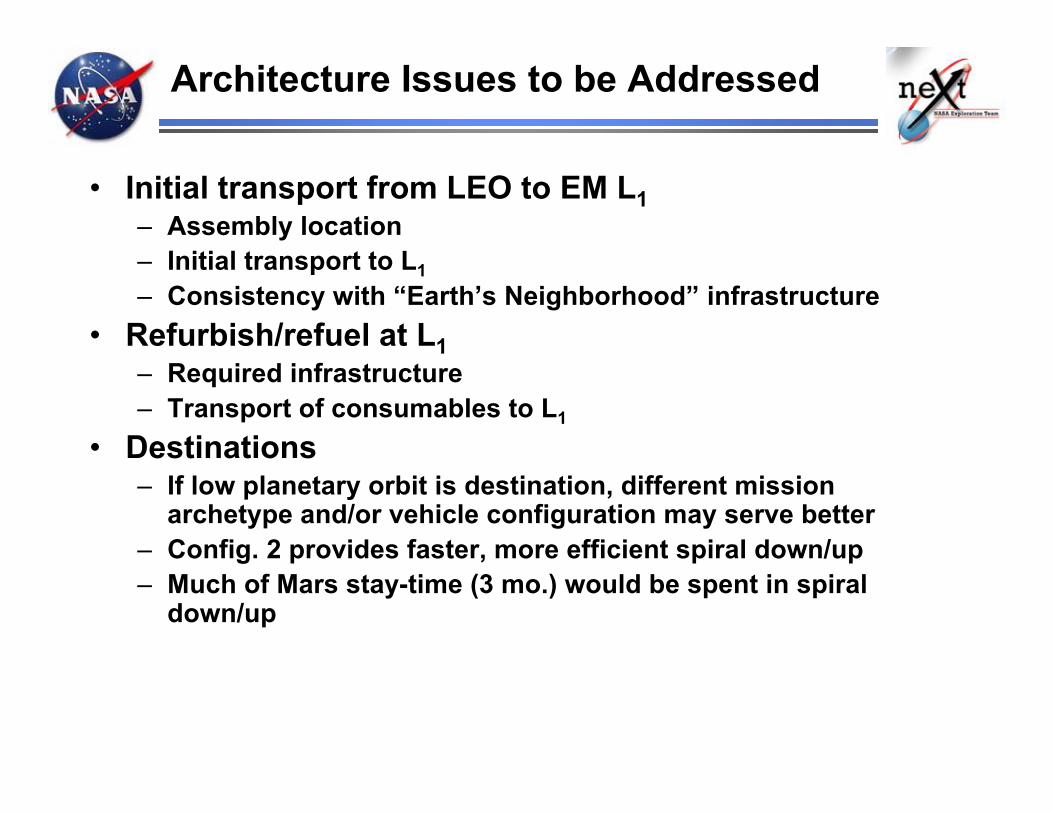
• Initial transport from LEO to EM L1– Assembly location– Initial transport to L1– Consistency with “Earth’s Neighborhood” infrastructure
• Refurbish/refuel at L1– Required infrastructure– Transport of consumables to L1
• Destinations– If low planetary orbit is destination, different mission
archetype and/or vehicle configuration may serve better– Config. 2 provides faster, more efficient spiral down/up– Much of Mars stay-time (3 mo.) would be spent in spiral
down/up
Conclusions Drawn (so far)
• Archetype mission requirements met– Transit time reduction, perihelion increase may be possible
• Additional thrust arcs• Increased power levels, more aggressive specific power technology• Venus gravity assist
• Major challenge unique to Config. 1 addressed– Steering strategies identified consistent with archetype mission
requirements– Propellant requirements not excessive– Small effects of mass imbalances – control strategies identified
• AG may provide significant advantage for system test &certification– Long-duration zero-g testing not required
• Environmental control and life support• Power conversion
Conclusions Drawn (so far)• Config. 1 mass penalties associated with AG appear minimal
– Separation distances associated with nuclear system used advantageously(validates choice of NEP)
– No massive despun joints, interfaces, etc. (hub ingress/egress TBD)– Good convergence between power system mass as habitat counterweight and
propulsive performance utilizing reasonable specific power and thrusterperformance
– Tension/compression structures appear to be very mass efficient• Boom design and mass TBD
Turbo-Alternator• Refractory Turbine• High Voltage, Freq. Alternator
Potassium StateSuperheated vapor
1500 K1.0 Mpa (150 psi)
2.5 kg/s
Liquid/vapor mixture1050 K
0.1 Mpa (15 psi)
Liquid1000 K
0.1 Mpa (15 psi)
Liquid1000 K
1.0 Mpa (150 psi)
Loop C
Observations from past NEP Systems Studies
• Technology selections not as critical at low powers (10’s kWe), but hasdramatic impact at high powers (MWe’s)
• Cycle operating temperatures single most important driver to both:- System performance (mass, alpha, radiator area)- Degree of technical difficulty (fuels, materials, etc.)
• Fast Spectrum / Liquid Metal Cooled Reactors (LMR) typically smaller &lighter than Gas Cooled Reactors (GCR)
• Brayton & Rankine best suited power conversion at multi-megawatts• Brayton:
- Simple, single phase fluid- Low rejection temperatures ! large, more massive radiators
• Rankine:- Adds complexities of 2-phase fluid management, liq. metal handling & thaw- High rejection temperatures ! smaller, lighter radiators & system mass
• Rankine systems lighter for same reactor temperature• For stated mass (“alpha”) objective, Rankine can be used to “buy
down” temperature in reactor fuels, materials, and overall cycle
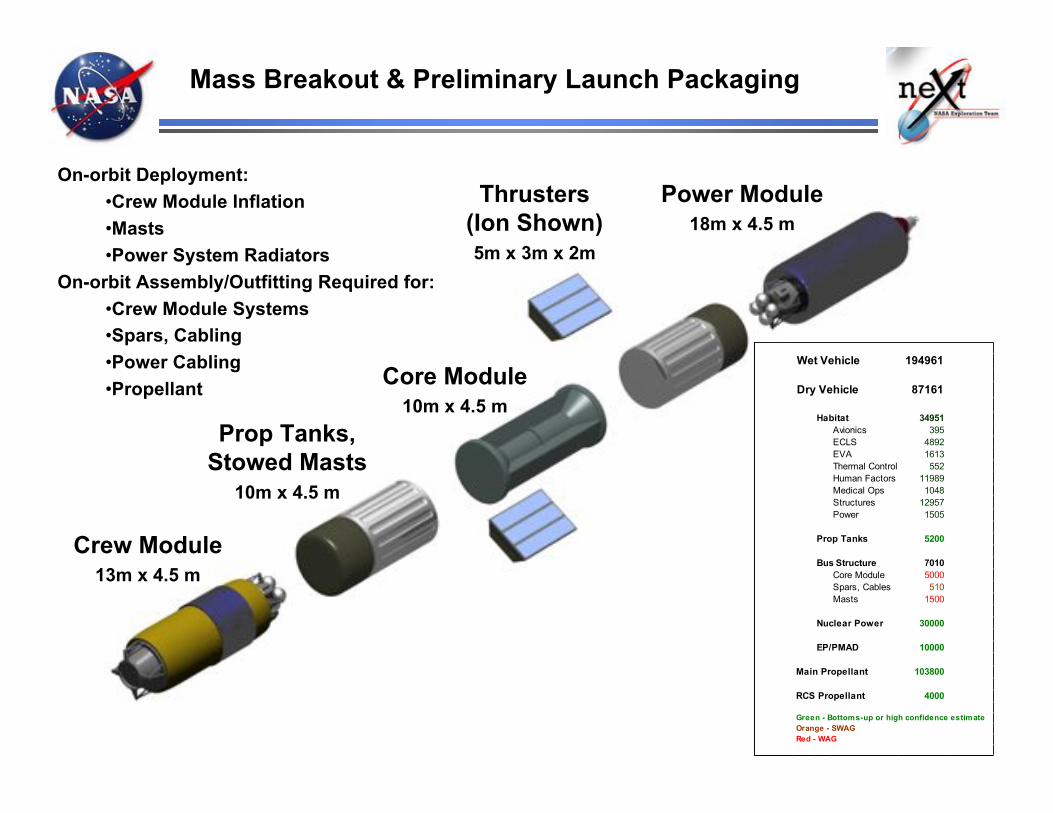
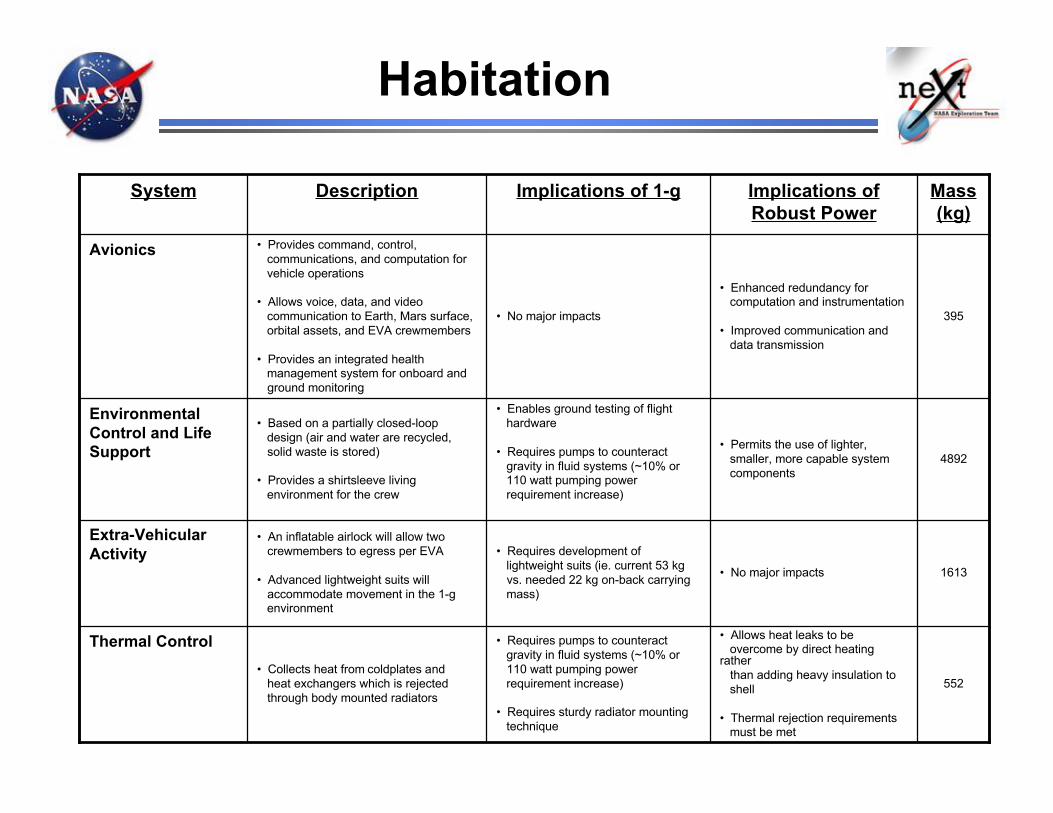
Habitation
552
1613
4892
395
Mass(kg)
• No major impacts
• Requires development of lightweight suits (ie. current 53 kg vs. needed 22 kg on-back carrying mass)
• An inflatable airlock will allow two crewmembers to egress per EVA
• Advanced lightweight suits will accommodate movement in the 1-g environment
Extra-VehicularActivity
• Allows heat leaks to be overcome by direct heatingrather than adding heavy insulation to shell
• Thermal rejection requirements must be met
• Requires pumps to counteract gravity in fluid systems (~10% or 110 watt pumping power requirement increase)
• Requires sturdy radiator mounting technique
• Collects heat from coldplates and heat exchangers which is rejected through body mounted radiators
Thermal Control
• Permits the use of lighter, smaller, more capable system components
• Enables ground testing of flight hardware
• Requires pumps to counteract gravity in fluid systems (~10% or 110 watt pumping power requirement increase)
• Based on a partially closed-loop design (air and water are recycled, solid waste is stored)
• Provides a shirtsleeve living environment for the crew
EnvironmentalControl and LifeSupport
• Enhanced redundancy for computation and instrumentation
• Improved communication and data transmission
• No major impacts
• Provides command, control, communications, and computation for vehicle operations
• Allows voice, data, and video communication to Earth, Mars surface, orbital assets, and EVA crewmembers
• Provides an integrated health management system for onboard and ground monitoring
Avionics
Implications ofRobust Power
Implications of 1-gDescriptionSystem
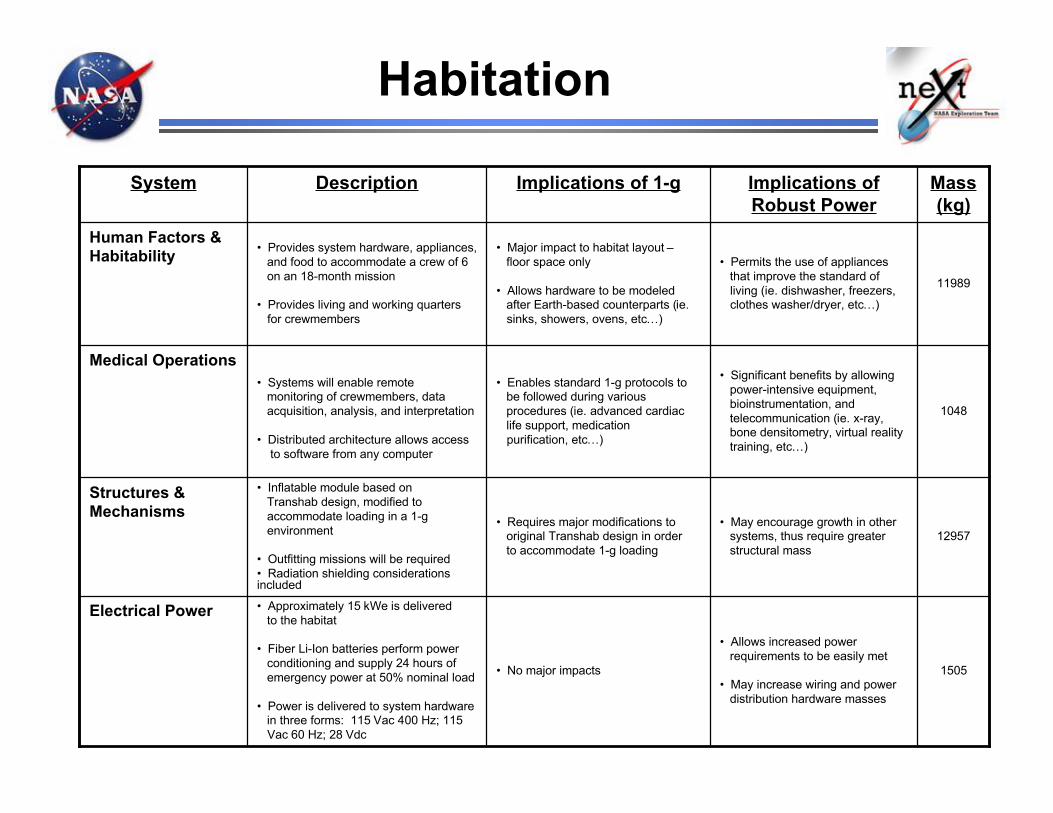
Habitation
1505
12957
1048
11989
Mass(kg)
• May encourage growth in other systems, thus require greater structural mass
• Requires major modifications to original Transhab design in order to accommodate 1-g loading
• Inflatable module based on Transhab design, modified to accommodate loading in a 1-g environment
• Outfitting missions will be required• Radiation shielding considerationsincluded
Structures &Mechanisms
• Significant benefits by allowing power-intensive equipment, bioinstrumentation, and telecommunication (ie. x-ray, bone densitometry, virtual reality training, etc…)
• Enables standard 1-g protocols to be followed during various procedures (ie. advanced cardiac life support, medication purification, etc…)
• Systems will enable remote monitoring of crewmembers, data acquisition, analysis, and interpretation
• Distributed architecture allows access to software from any computer
Medical Operations
• Permits the use of appliances that improve the standard of living (ie. dishwasher, freezers, clothes washer/dryer, etc…)
• Major impact to habitat layout – floor space only
• Allows hardware to be modeled after Earth-based counterparts (ie. sinks, showers, ovens, etc…)
• Provides system hardware, appliances, and food to accommodate a crew of 6 on an 18-month mission
• Provides living and working quarters for crewmembers
Human Factors &Habitability
• Allows increased power requirements to be easily met
• May increase wiring and power distribution hardware masses
• No major impacts
• Approximately 15 kWe is delivered to the habitat
• Fiber Li-Ion batteries perform power conditioning and supply 24 hours of emergency power at 50% nominal load
• Power is delivered to system hardware in three forms: 115 Vac 400 Hz; 115 Vac 60 Hz; 28 Vdc