THE ARTIFICIAL PRODUCTION OF CARBON DIOXIDE 223 551,510.4: 551.521.3: 551.524.j.C THE ARTIFICIAL PRODUCTION OF CARBON DIOXIDE AND ITS INFLUENCE ON TEMPERATURE By G. S. CALLENDAR (Steam technologist to the British Electrical and Allied Industries Research Association.) (Communicated by Dr. G. M. B. DOBSON, F.R.S.) [Manuscript received May 19, 1937-read February 16, 1938.1 SUMMARY By fuel combustion man has added about 150,000 million tons of carbon dioxide to the air during the past half century. The author estimates from the best available data that approximately three quarters of this has remained in the atmosphere. The radiation absorption coefficients of carbon dioxide and water vapour are used to show the effect of carbon dioxide on “ sky radia- tion.” From this the increase in mean temperature, due to the artificial production of carbon dioxide, is estimated to be at the rate of 0.003OC. per year at the present time. The temperature observations at zoo meteorological stations are used to show that world temperatures have actually increased at an average rate of o.ooj°C. per year during the past half century. Few of those familiar with the natural heat exchanges of the atmosphere, which go into the making of our climates and weather, would be prepared to admit that the activities of man could have any influence upon phenomena of so vast a scale. In the following paper I hope to show that such influence is not only possible, but is actually occurring at the present time. It is well known that the gas carbon dioxide has certain strong absorption bands in the infra-red region of the spectrum, and when this fact was discovered some 70 years ago it soon led to specula- tion on the effect which changes in the amount of the gas in the air could have on the temperature of the earth’s surface. In view of the much larger quantities and absorbing power of atmospheric water vapour it was concluded that the effect of carbon dioxide was probably negligible, although certain experts, notably Svante Arrhenius and T. C. Chamberlin, dissented from this view. Of recent years much new knowledge has been accumulated which has a direct bearing upon this problem, and it is now possible to make a reasonable estimate of the effect of carbon dioxide on temperatures, and also of the rate at which the gas accumulates in the atmosphere. Amongst important factors in such calculations may be mentioned the temperature-pressure-alkalinity-C02 relation for sea water, determined by C. J. Fox (1909), the vapour pressure- atmospheric radiation relation, observed by A. Angstrom (1918) and others, the absorption spectrum of atmospheric water vapour, observed by Fowle (I~IS), and a full knowledge of the thermal structure of the atmosphere.
Transcript
THE ARTIFICIAL PRODUCTION OF CARBON DIOXIDE 223
551,510.4: 551.521.3: 551.524.j.C
T H E ARTIFICIAL PRODUCTION OF CARBON DIOXIDE AND ITS INFLUENCE O N TEMPERATURE
By G. S. CALLENDAR (Steam technologist to the British Electrical and Allied Industries
Research Association.) (Communicated by Dr. G. M. B. DOBSON, F.R.S.) [Manuscript received May 19, 1937-read February 16, 1938.1
SUMMARY By fuel combustion man has added about 150,000 million tons
of carbon dioxide to the air during the past half century. The author estimates from the best available data that approximately three quarters of this has remained in the atmosphere.
The radiation absorption coefficients of carbon dioxide and water vapour are used to show the effect of carbon dioxide on “ sky radia- tion.” From this the increase in mean temperature, due to the artificial production of carbon dioxide, is estimated to be at the rate of 0.003OC. per year a t the present time.
The temperature observations a t zoo meteorological stations are used to show that world temperatures have actually increased at an average rate of o.ooj°C. per year during the past half century.
Few of those familiar with the natural heat exchanges of the atmosphere, which g o into the making of our climates and weather, would be prepared to admit that the activities of man could have any influence upon phenomena of so vast a scale.
In the following paper I hope to show that such influence is not only possible, but is actually occurring a t the present time.
It is well known that the gas carbon dioxide has certain strong absorption bands in the infra-red region of the spectrum, and when this fact was discovered some 70 years ago it soon led to specula- tion on the effect which changes in the amount of the gas in the air could have on the temperature of the earth’s surface. In view of the much larger quantities and absorbing power of atmospheric water vapour it was concluded that the effect of carbon dioxide was probably negligible, although certain experts, notably Svante Arrhenius and T. C. Chamberlin, dissented from this view.
Of recent years much new knowledge has been accumulated which has a direct bearing upon this problem, and it is now possible to make a reasonable estimate of the effect of carbon dioxide on temperatures, and also of the rate a t which the g a s accumulates in the atmosphere. Amongst important factors in such calculations may be mentioned the temperature-pressure-alkalinity-C02 relation for sea water, determined by C. J . Fox (1909), the vapour pressure- atmospheric radiation relation, observed by A. Angstrom (1918) and others, the absorption spectrum of atmospheric water vapour, observed by Fowle (I~IS), and a full knowledge of the thermal structure of the atmosphere.
2‘24 THIC ARTIFICIAL PRODUCTION OF CARBOX DIOXIDE
This new knowledge h a s been used in arr iving a t the conclusions s ta ted in this paper, but for obvious reasons only those par t s having a meteorological character will be referred to here.
r .
I . I 11E RATE 0 1 4 ACU1;MUL.ITION OF ATMOSPHICHIC CARBON 1)IOXIDE
I have examined 21 very accurate set of observations (Brown and Esconibe, 1905), taken about the year 1900, on the amount of carbon dioxide in the f ree air, in relation t o the weather m a p s of t h e period. F r o m them I concluded tha t the amount of carbon dioxide in the free air of t h e Nor th Atlantic region, a t t h e beginiiing of this century, w a s 2.74fo’oj par t s in 10,ooo by volume of dry air.
A grea t many factors which influence the carbon cycle in na ture have been examined in order t o determine the quant i ta t ive relation between the natural movements of this gas and the amounts produced by the combustion of fossil fuel. Such factors included the organic deposit nf carbon in swamps, etc., the a v r r a g e rate of fixation of the g a s by the carbonisation of allcalies f rom igneous rocks, and so on. The general conclusion from a somewhat lengthy investigation on the natural movements of carhon tlioxide w a s tha t there is no g e o l o ~ i c n l evidence to sliow that the nct offtake of t h e gas is more than a small fraction o f the quantity produced from fuel. ( T h e artificial production a t present is about -1,500 million tons per year.)
T h e eKect o f solution of the g a s by the sea water was n e s t considered, because the sea ac ts as a g i a n t regulator of carbon dioxide and holds some sixty times as much as the atmosphere. T h e rate a t nliich the sea water could correct an escess of atmospheric carbon dioxide clepends mainly upon t h e fresh volume of water exposccl t o t h e a i r each y w r , because cquilibrium with the atmospheric gascs is only established t o a dcpth of about z c n m . dur ing such ii period.
‘The vertical circ.ul;ition of the oceans is not well understood, b u t several factors p i n t to a n equilibrium time, in which the whole w a voliime is exposed t o the atmosphere, of between two and five thousand years. Cs ing Fox’s solution coefficients for sea water of knonrn to ta l alkalinity and average surface temperature , it is possible t o calculate the change in atmospheric CO, pressure over a given
TABLE I.--Tire EFFECT OF THE m n F r r r A T . P H o D u c T r o N OF CARBON DIOXIDE
Annual net addition of CO, to thc air=4,300 million tons. Total pressure from CO, = 0.000271 atmospheres in the year 1900.
Sea surface a t 15OC. and total alkalinity = 40 mg. of negative hydroxyl ions per litre; it is this quantity which is maintained nrutrcil by the disqolved CO,. P (CO?) stands for the prcssure of CO, in the air at normnl~barometric pressure.
UPON ITS PRESSURE IN THE ATMOSPIIERE.
zoo0 2100 2200 P (CO,) in atrnos./l0,000
Sea equilibrium lime. yran
2000 j000
From 1900 to 1936 the increase should be close to 6 par cent.
THE ARTIFICIAL PRODUCTION OF CARBON DIOXIDE 225
period, when the rate of addition of the gas is known and the equilibrium time for the sea water is assumed. A few such figures a re given in Table I , and it will be seen that when periods of a few centuries are considered the sea equilibrium time is less important.
Since calculating the figures in Table I , I have seen a report of a great number of observations on atmospheric C 0 2 , taken recently in the eastern U.S.A. ‘The mean of 1,156 “ free air ” readings taken in the years 1930 to 1936 was 3’10 parts in 10,000 by volume. For the measurements a t Kew in 1838 to I ~ I the mean of 9 2 free air values was 2-92, including a number of rather high values effected by local combustion, etc. ; and assuming that a similar proportion of the American readings are affected in the same way, the difference is equal to an increase of 6 per cent. Such close agreement with the calculated increase is, of course, partly accidental.
2. 1SI:K.I-RED ABSORPTION I<Y CARBON DIOSIDE ‘\ND WATER V.\POUR
‘The loss uf heat from the earth’s surface and atmosphere is nearly all carried upon wave lengths greater than 411, the maximum intensity being a t about rap.
There have been a great many careful and accurate measure- ments o f the absorption and radiation by various gases in this part of the spectrum, but owing to the very great difficulties attending thew observations most of the earlier values were highly conflicting. However, considerable accuracy has now been attained, and from ;L number of considerations, which cannot be detailed, the values observed by Rubens and Aschkinass (1898), of Germany, a re used here fo r the absorption by carbon dioxide on the longer wave lengths.
For Lyater vapour I have made many comparisons between the rncnsurements of F. E. Fowle ( I ~ I S ) , who observed the absorption b y atmospheric water vapour, and those of Rubens and of Hettner ( I ~ I S ) , who used steam at I atmos. pressure for their measure- ments. These comparisons fully support the conclusion arrived at by Fon.le, that the absorption by water vapour as it occurs in the air is less than half as great as that found for steam under laboratory conditions. Perhaps the most powerful support for this conclusion comes from a comparison between the observed and calculated atmospheric radiation, which shows that, for dry and cold air con- ditions, the absorption exponents found for steam lead to much too high a value for atmospheric radiation.
To return to the absorption by carbon dioxide, the three primary bands given by this gas are a t 2.4 to 3’0 put 4 to 4‘6 p, and 13 to 16 p, the latter being much the most important for atmospheric conditions because very little low temperature radiation is carried on the small bands.
The relation between absorption and quantity of gas is usually expressed as
\vhere .-l,l is the absorption by I units of gas in the path of radiation of wave length A, k being the absorption exponent for the gas at
A , , = r - e - k l . . (1 )
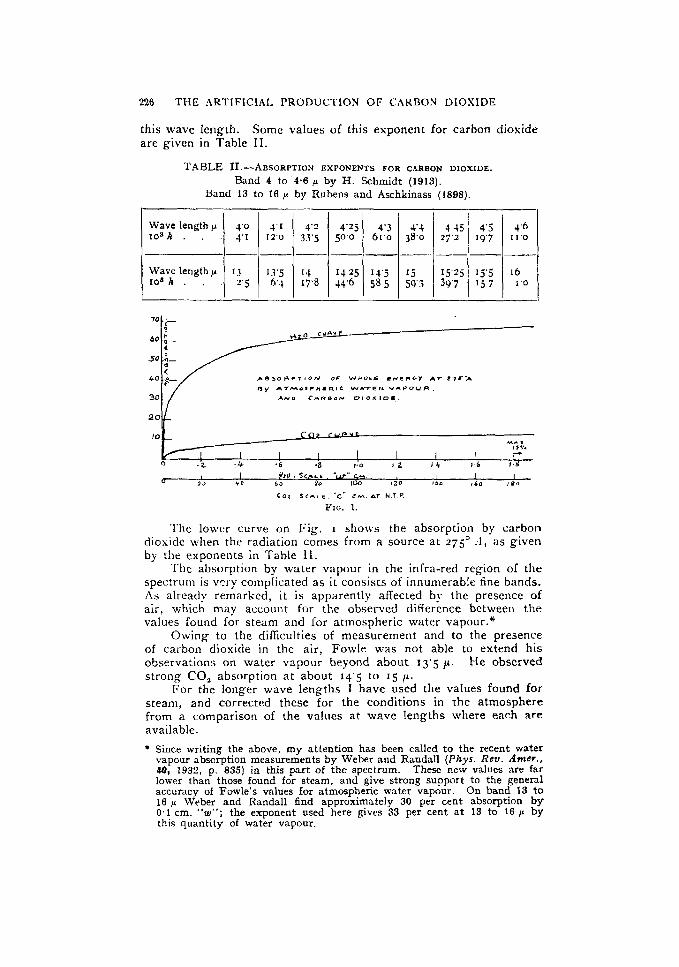
Wave length p J O
1 0 3 k . , j I
Wavelengthp 1.1 I O ~ R . , 2.5
1 I A 0 S L A L , 6 . -ur- c ,.. I I I 0 2 6 40 0 0 80 IW 120 I40 !40 191)
C O I S ~ - . L E -c" CM nr N T P .
FIG. 1.
Thc 1oivc.r curve on I;ig. I 5hows the absorption by carbon dioxide when the radiation comes from a source a t 27j0 .4, as given by the exponents in Table 11.
The absorption by water vapour in the infra-red region of the spectrum is very complicated a s it consists of innumerable fine bands. As already remarked, it is apparently affected by the presence of air, which may account tor the observed difference between t h e values found for steam and lor atmospheric water vapour."
Owing to the difficulties of measurement and to the presence of carbon dioxide in the air, Fowle was not able to extend his observations on water vapour beyond about 13'5 p. He observed strong C 0 2 absorption a t about 14.5 to 15 p.
For the longer wave lengths I have used the values found for steam, and correctrd these for the conditions in the atmosphere from a comparison of the values at wave lengths where each a re available. * Since writing the above, my attention has been called to the recent water
vapour absorption measurements by Weber and Randall (Phys. Rev . Amer.. 46, 1932, p. 835) in this part of the spectrum. These new values are far lower than those found for steam, and give strong support to the general accuracy of Fowle's values for atmospheric water vapour. On band 13 to 16 p Weber and Randall find approximately 30 per cent absorption by 0.1 cm. "w"; the exponent used here gives 33 per cent at 13 to 16 p by this quantity of water vapour.
- 4 I 4.2 4 z j 4'3 44 $5 4.6
12'0 33'5 500 61'0 38'0 '2;:'i 19'7 11'0
___-__ -______-__ 13.5 14 1125 115 15 15.25 I j ' j 16 6 4 17'8 14.6 58.5 5 9 3 397 l j 7 I 0
T H E ARTIFICIr\L PRODUCTION OF CARBON DIOXIDE 227
The absorption/quantity relation for atmospheric water vapour, which is shown by Fowle's experiments, can be written :-
where . 4 ~ is the absorption on band h by a quantity of water vapour which would give w cm. of liquid water when condensed on' a surface of equal area. The values obtained from this expression, ( 2 ) , fit Fowle's observations remarkably well over a wide range of water vapour.
For the important band 13 to 1 6 p Rubens and Aschkinass found t h a t steam equivalent to 0.045 w cm. gave 3 j per cent absorp- tion (Hettner 38 per cent) for the whole band; this amount of steam is equivalent to 0.1 zu cm. of atmospheric water vapour, from a careful comparison over the band 1 1 to 13.5 p where each are available, hence the mean exponent K in expression ( 2 ) becomes 1.0 for band 13 to 16 p.
Table I11 shows the approximate percentage of radiation energy o n various wave bands for a range of temperature to cover surface conditions. The water vapour exponents a re also shown for the same bands. W i t h the aid of expression ( 2 ) and these figures the absorption of any quantity of water vapour may be calculated in terms of the whole energy a t these temperatures. The value of K for wave lengths greater than 16 p has been adjusted to suit the observed values of atmospheric radiation for different quantities of water vapour Many of these comparisons have been made and show that the absorption/quantity relation, deduced from Fowle's measurements, leads to excellent agreement with the observed variation of atmospheric radiation with water vapour pressure.
Ah= I - e - K A w'4 . * ( 2 )
TABLE III.-ABSORPTION EXPONENTS FOR WATER VAPOUR, AND THE PERCENTAGE OF ENERGY ON THE WAVE BANDS.
-------
0
K . . . 1 .1 2 .1 1'9 6.2 2 2 0'20 1'0
I'emp. abs. . Percen tnge of energy on band 250 275 O X 0.6 1.8 3.2 4. j 29'2 r q 9 300 0'2 1'1 2.8 4'4 5'7 31.7 I q j
I
3. S K Y RADIATION
The downward radiation from the sky, excluding the direct and scattered short wave radiation from the sun, is usually called the " sky radiation." Valuable papers on this subject have been published by A. Angstrom (1918), W. H. Dines (1g27), Simpson (I~zS), Brunt (193z), and others, and it is not proposed to refer to it a t any length here.
For normal conditions near the earth's surface, with a clear sky the downward radiation varies between three and four fifths 0.f that from the surface, the proportion being greatest when the air is warm and carries much water vapour.
228 THE ARTIFICIAI, PRODUCTION OF CARBON I>IOXIDli
The method used to calculate the sky radiation from the absorption coeficients of watcr vapour and carbon dioxide is simple but laborious. I t consists of dividing the nir into horizontal layers of known mean temperature, water vapour, and carbon diosidc content, and summing the absorbing power of these 1 a p - s 011 the different wave bands, in conjunction with the spectrum distribution of energy at the surface temperature. In this way the perpendicular component of sky radiation is obtained.
X long series of observations by W. H. Dines show that the effective radiation from thc hemisphere of the sky, when free trom clouds, to a horizontal surface bears a very constant relation to the perpendicular component (" zenith " sky radiation) ; i t is 7 pcr cent greater for low level conditions in England.
'Table IV shows the zenith sky radiation, as calculated from the absorption coefficients of water vapour and carbon dioxide. for a variety of air conditions. The efective sky radiation to a hori- zontal surface would be j. pcr cent grcater, for tempcratc and tropicnl conditions, than thc zenith values in Table IV. For arctic con- ditions it would bc about .; per cent p r a t e r .
For norrnal conditions about t h rw fourths of the zenith sky radiation comes from the lowest 40" m. of air, but when the air is vcry cold and dry a much greater depth takes part in this radiation.
plateau top
Season Sumincr Any
Loca!ion
Altitude, km. 3 5
Surface, "abs. 2 jo" 257'
F . . . 8" 7 O
Sr. % . 40 48
Skytemp., "abs. 200' 2 14
P (EInOJ . . 0'5 1'0
SZ. cal/C:ln;/d,z! 186 24h0
s[:& Temperate Tropical
Equinor Equinox 1 Ally -- -_ 0 0 0
2 j;" 2830 296"
68 514
2x9. - 3/
1 '0 7 .i I j.0 6" j -6-6-7 ' .+-&6-7' 5 2 :::
2 7 4 O * - - o
267.
THE ARTIFICIAL PRODUCTION OF CARBON DIOXIDE 229
Altitude of air layer. km.
P (C0,)htmos. 0'0001 . 0.0003 (normal) 00006 .
In the case of mixed gases the absorption for the mixture is equal to the difference between the sum and product of their respective absorptions :-
This relation is true if the respective absorptions are symmetrical in relation to the energy distribution over the wave band to which they refer.
The observed sky radiation results from the infra-red absorption by variable amounts of water vapour and from 3 parts in 10,000
of carbon dioxide, which are normally present in the air. For tem- perate conditions a t vapour pressure 7.5 mm. Hg. I calculate that 95 per cent of the radiation comes from the water vapour ; for arctic conditions the carbon dioxide may supply as much a s 1 5 per cent of the total.
For the purpose required here i t is necessary to consider the effect of a change in the amount of carbon dioxide, firstly upon sky radiation, and secondly the effect of changes in the latter upon temperatures.
CVhen radiation takes place from a thick layer of gas, the average depth within that layer from which the radiation comes will depend upon the density of the gas. Thus if the density of the atmospheric carbon dioxide is altered it will alter the altitude from wfiich the sky radiation of this gas originates. An increase of carbon dioxide will lower the mean radiation focus, and because the temperature is higher near the surface the radiation is increased, without allowing for any increased absorption by a greater total thickness of t h e gas.
The change of sky radiation with carbon dioxide depends largely upon this change in the altitude of the radiation focus, because the present quantity in the atmosphere (equal to a layer of z m. a t N.T.P.) can absorb nearly the maximum of which this gas is capable. The latter assumption depends upon the exponents used, but it is probable that great thicknesses of carbon dioxide would absorb o n other wave lengths besides those of the primary bands.
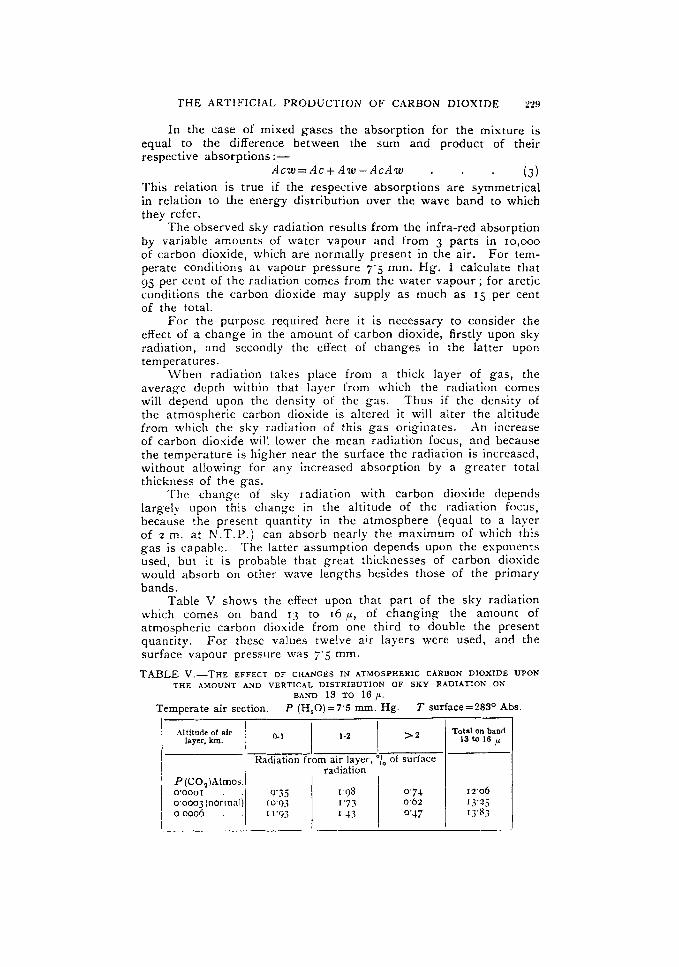
Table V shows the effect upon that part of the sky radiation which comes o n band 13 t o 16 p, of changing the amount of atmospheric carbon dioxide from one third to double the present quantity. For these values twelve air layers were used, and the surface vapour pressure was 7.5 mm.
ACW = AC + Aw - AcAw . . ( 3 )
TABLE V.-THE EFFECT O F CHANGES IN ATMOSPHERIC CARBON DIOXIDE UPON THE AMOUNT AND VERTICAL DISTRIBUTlON OF SKY RADIATION ON
BAND 13 TO 16p. Temperate air section. P (H,O)=7'5 mm. Hg. T s ~ r f a c e = 2 8 3 ~ Abs.
Radiation from air layer, "1. of surface radiation
9'33 I .98 0.74 I O ' C ) ~ 1.73 0'62 I 1'9.3 I 4 3 0'47
Total on band 13 to 16 u
230 THE ARTIFICIAL PRODUCTION OF CARBON DIOXIDE
From the figures in Table V it will be seen that a n increase of carbon dioxide causes the radiation to be concentrated from the lowest air layers, whilst the amount from the cold upper layers is still further screened off, the net effect being a small increase in the total sky radiation. For these values the equivalent thickness of carbon dioxide in the lowest kilometre is changed from 10 to sj cm. "c," and these are quantities for which the exponents of Rubens and Aschkinass should be reliable.
j. THE R~:LATION BETWEEN SKY RADIATION AND TEMPER.\TURE
I f the whole surface of the earth is considered as a unit upon which a certain amount of heat falls each day, it is obvious that the mean temperature will depend upon the rate at which this heat can escape by radiation, because n o other type of heat exchange is possible. For simplicity the reflection loss from clouds and ice surfaces is assumed to be a constant factor.
The radiation loss from the surface and clouds depends upon the fourth power of the absolute temperature and is proportional to the difference between the surface and sky radiation:-
where : H = u . T'. (I-S) . . (4)
H = radiation heat loss from surface. cr = radiation constant. 10-' x 1.18 cal/cm*/d;iy. T = temperature of surface, Abs. S = sky radiation, a s proportion of that from the surface.
Suppose that the sky radiation is changed from S , to S, whilst
T 2 = T , " [ ( r - S , ) / ( 1 -S,,] . . (5) From this relation it will be seen that the change of tempera-
ture for a given change of sky radiation increases rapidly as the latter approaches that from the surface, it being always assumed that the heat supply and loss are constant.
On the earth the supply of water vapour is unlimited over the greater part of the surface, and the actual mean temperature results from a balance reached between the solar " constant " and the properties of water and air. Thus a change of water vapour, sky radiation and tempcrature is corrected by a change of cloudiness and atmospheric circulation, the former increasing the reflection loss and thus reducing the effective sun heat.
There is also a further loss owing to the scattering of solar energy by the water molecule.
Small changes of atmospheric carbon dioxide do not affect the amount of sun heat which reaches the surface, because the C 0 2 absorption bands lie well outside the wave lengths, 0.23 to 1 . j p , on which nearly all the sun energy is carried. Consequently a change of sky radiation due to this gas can have its full effect upon low level temperatures, provided it does not increase the tem- perature differences on which the atmospheric circulation depends.
An increase of temperature due to s k y radiation will be different from that caused by an increase of sun hea t ; the latter would tend to increase the temperature differences and atmospheric
H remains constant. Then :-
THK AR'lIFICIAI- PRODUClION OF CARBON DIOXIDE 231
circulation, and the ultimate rise of temperature should not be in proportion to the change of sun heat.
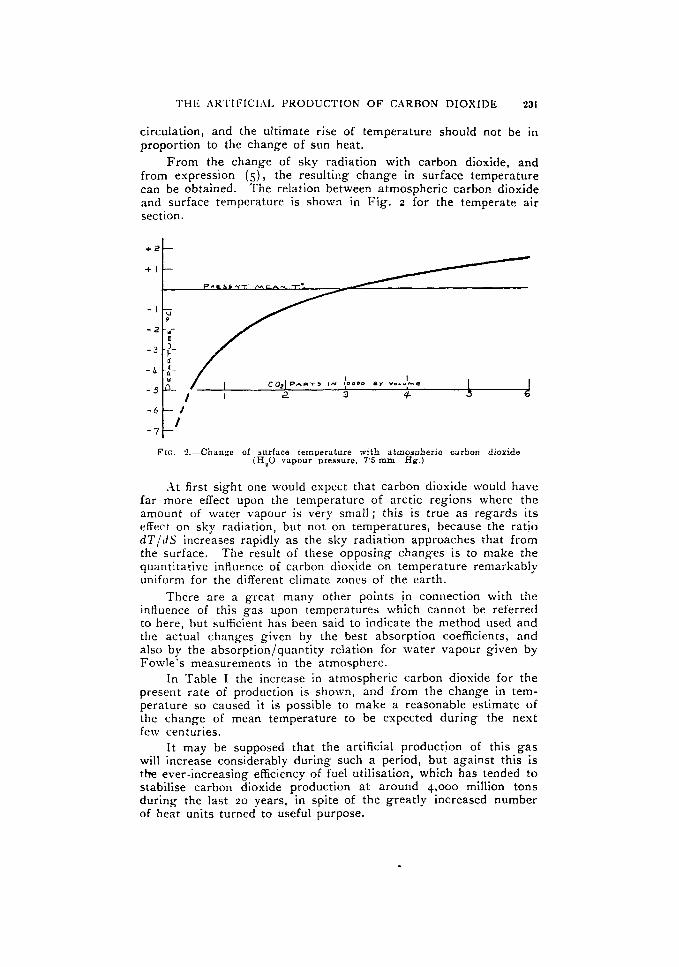
From the change of sky radiation with carbon dioxide, and from expression ( 5 ) , the resuIting change in surface temperature can be obtained. The relation between atmospheric carbon dioxide and surface temperature is shown in Fig. z for the temperate air section.
+ i
+ I
- I
- 2
- 3
- 4
-5
- 6
-7
FIG. 2 -Change of surfsce temperature wlth atmosuheric carbon dioxlde (H,O vapour pressure. 7'5 mm Hg.)
. i t first sight one would expect that carbon dioxide would have far more effect upon the temperature of arctic regions where the amount of water vapour is very small; this is true as regards its effect on sky radiation, but not on temperatures, because the ratio d T / d S increases rapidly as the sky radiation approaches that from the surface. The result of these opposing changes is to make the quantitative influence of carbon dioxide on temperature remarkably uniform for the different climate zones of the earth.
There are a great many other points in connection with the influence of this gas upon temperatures which cannot be referred to here, but sufficient h a s been said to indicate the method used and the actual changes given by the best absorption coefficients, and also by the absorption/quantity relation for water vapour given by Fowle's measurements in the atmosphere.
In 'Table I the increase in atmospheric carbon dioxide for the present rate of production is shown, and from the change in tem- perature so caused it is possible to make a reasonable estimate of the change of mean temperature to be expected during the nes t few centuries.
It may be supposed that the artificial production of this gas will increase considerably during such a period, but against this is the ever-increasing efficiency of fuel utilisation, which has tended to stabilise carbon dioxide production at around 4,000 million tons during the last 20 years, in spite of the greatly increased number of heat units turned to useful purpose.
332 T H E :\RTIFICI)\L PRODUCTION O F CIIRBON I>IOXIUE
Period 1910-1930
Mean PICO,) , . . 2.82
climate zones, . , f 5
Mean AT. "C. . . . +0,07" Pular displacement 0 1
TABLE VI.--TNCREASE OF MEAN TEMPERATURE FROM THE ARTIFICIAL
Annual excess of CO, to the sir = 4,300 million tons. P (CO,) is expressed in units of a ten-thousandth of an atmosphere. AT = increase from mean temperature of 19th century. Sea water equilibrium time 2,000 years.
PHODUCTION O F CARBON DIOXIDE.
20th century
2'92 +or6"
36
22nd century
'The last line in Table V1, showing the polar displacement of climate zenes, is for a horizontnl gradient of 1°C. for each 2" of latitude between equator and poles. 'This is an average figure for tempcrate latitudes.
The estimate of the effect of carbon dioxide on temperatures made by S. Arrhenius (1903) about +I years ago gave changes about twice a s large as those shown i n 'Table VI, but he had taken the maxirnum energy absorption by this gas as 30 per cent, whereas the Rubens and Aschkinaas exponents give a maximum of only 1 5 per cent.
6. THE OBSERVED TEMPERATURE VARIATIONS O N T H E EARTH
Coming now to the actual temperatures which have been observed near the earth's surface during the recent past, these measurements have provided an almost overwhelming mass of statistical detail, including many millions of accurate and standardized readings of temperature. The period to which these standardized observations refer is generally not more than 65 years and often less. I t is a matter ot opinion whether such a period is srificiently extended to show a definite trend in world temperatures.
I have relied principally on that valuable Smithsonian publica- tion, " World Weather Records," to obtain the temperature readings summarized here. I n all I have examined about two hundred records, but a small proportion of these are found to be defective when their period ternpcrature departures are compared with those of neighbouring stations ; also in certain cases the records a re unreliable, owing to changes of conditions which are detailed in the above publication.
Out of 18 records going back more than a century I found only two which could be classed as continuous throughout ; these are at the Radcliffe Observatory (1330)~ Oxford, and a t Copenhagen. There are two or three others which comparisons show must be very reliable, and amongst these perhaps the best are those from Edinburgh (Mossman, ~ g o z ) , and from New York City.
Fig. 3 shows the combined departures from the mean 1901-p, a t Edinburgh, Oxford, and Copenhagen, as twenty-year " moving average departures "; the lower curve for New York State is based principally upon the New York City record, but other long records
THE ARTIFICIAL PRODUCTION OF CARBON DIOXIDE 233
from Albany and New Haven have also been used to check the New York readings. There is a very marked agreement between the west Europe curve and that of New York State, almost through- out the period, although the principal temperature anomalies seem to occur a few years earlier in the eastern States than in west Europe.
In order to represent the temperature anomalies of great regions of the earth’s surface I have grouped a number of stations together, and then weighted each group according to the area represented by its stations. In this way the curves for the different zones of the earth, shown in Fig. 4, were obtained.
2 0 -jEnqL C N C I I N G
FIG. 3.-The most reliable lone period temperature records. Twenty-year moving departures from the mean. 1901-1930.
F I G . 4.-Tsmperature variations of the zones and of the earth. Ten-year moving departures from the mean. 1901-1930. O C .
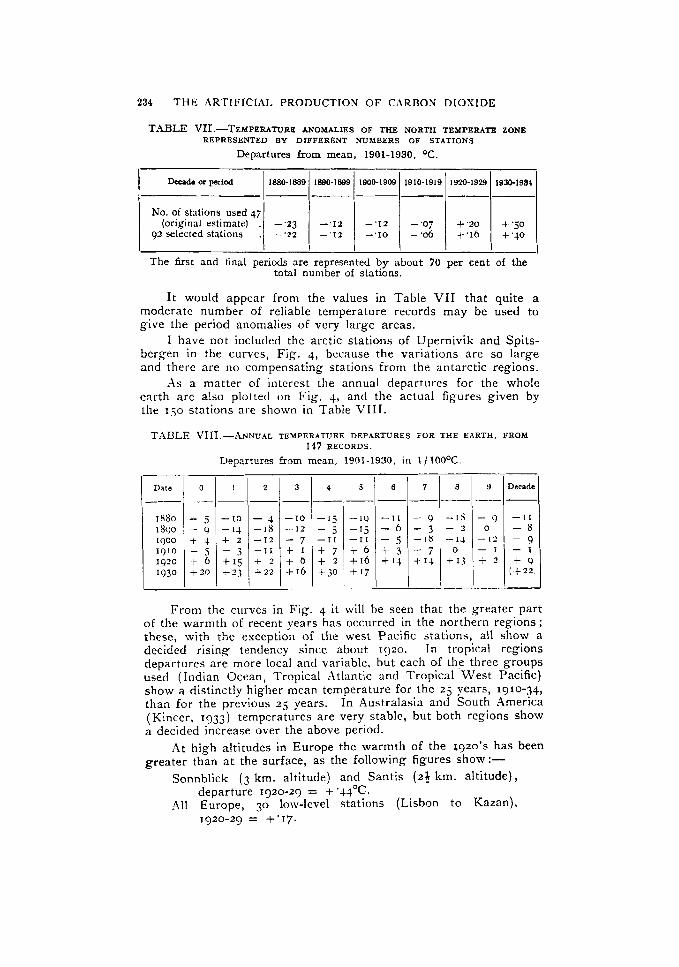
I have made more than one estimate of the temperature anomalies of the north temperate zone, and the figures in Table VII compare the result of an earlier estimate with the final values obtained from nearly twice as many stations after a more careful elimination of all doubtful records. A different grouping of the stations was also used in the two cases shown.
234 T H E ARTIFICIAL PRODUCTION OF CARDON DIOXIDE
Decade or period 1880-1889
NO. of stations used 47 (original estimate) . --23
--'Iz -.IZ - 07 f . 2 0 t .so --'12 --'lo -.06 +.16 +.40
Date
IN80 18qo 1()00 1910 1920 I930
- 9
- 1 2 - 1
-17-1- -'I1 - 1 1
- 9
( + 2 2 ,
- 1
- j - 9 T - )
- 5 t 6 + 2 0
-10 - 4 -10 -14 -18 - I 2 C Z - 1 2 - 7 - 3 -11 + I + 1 5 + ? + 6 t r 3 + ? 2 +16
-[j - j - 1 1
t 7 + 2 +jO
1 I I I
-1c )
- 1 j - 1 1 + 6 +16 4-17
- 1 1 - 6 - 5 + 3 f ' 4
From the curves in Fig. 4 it will be seen that the greater part of the warmth of recent years has occurred in the northern regions ; these, with the exception of the west Pacific stations, all show a decided rising tendency since about 1920. In tropical regions departures are more local and variable. but each of the three groups used (Indian Ocean, Tropical Atlantic and Tropical Wes t Pacific) show a distinctly higher mean temperature for the zj years, 1910-,34, than for the previous 25 years. In Australasia and South America (Kincer, 1933) tempcratures arc very stable, but both regions show a decided increase over the above period.
At high altitudes in Europe the warmth of the ~ 9 2 0 ' s has been greater than at the surface, as the following figures show:-
Sonnblick ( 3 km. altitude) and Santis (24 km. altitude),
I t .is we11 known that temperatures, especially the night minimum, are a little higher near the centre of a large town than they are in the surrounding country districts ; if, therefore, a. large number of buildings have accumulated in the vicinity of a station during the period under consideration, the departures at that station would be influenced thereby and a rising trend would be expected.
To examine this point I have divided the observations into three classes, as follows :-
( i ) First class exposures, small ocean islands or exposed land regions without a material accumulation of buildings.
( i i ) Small towns which have not materially increased in size. (iii) Large towns, most of which have increased considerably
during the last half century. As this is a matter which i s open to controversy it is necessary
to give examples of the stations used in each class.
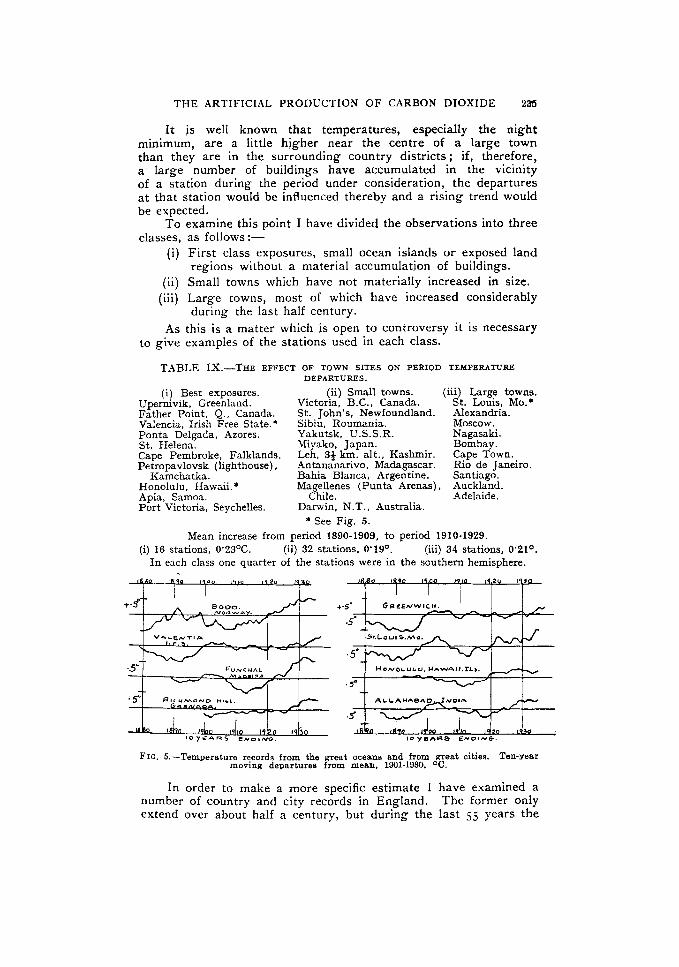
TABLE IX.-THE EFFECT OF TOWN SITES ON PERIOD TEMPERATURE
(i) Best exposures. (ii) Small towns. (iii) Large towns. Upernivik, Greenland. Victoria, B.C., Canada. St. Louis, Mo.* Father Point, Q., Canada. St. John's, Newfoundland. Alexandria. Valencia, Irish Free State. * Sibiu, Roumania. Moscow. Ponta Delgada, Azores. Yakutsk. U.S.S.R. Nagasaki. St. Helena. Miyako, Japan. Bombay. Cape Pembroke, Falklands. Leh, 3+ km. alt., Kashmir. Cape Town. Petropavlovsk (lighthouse), Antananarivo, Madagascar. Rio de Janeiro.
Mean increase from period 1890-1909, to period 1910-1929. (ii) 32 stations, 0'19O.
In each class one quarter of the stations were in the southern hemisphere. (i) 16 stations, 0'23'C. (iii) 34 stations, 0'21O.
i'
F I G . 5.-Temperature rFcords from the great oceans eod from great cities. Ten-sear moving departures from mean. 1901-1930. O C .
In order to make a more specific estimate I have examined a number of country and city records in England. The former only extend over about half a century, but during the last 5 j years the
236 T H E ARTIFICII \ I . PRODUCTION OF CARBON 1)IOSII)I.:
so-year moving average at the country stations of Stonyhurst College, Worksop, and Rothamsted Farm has risen slightly ( O . I O F . )
more than that given by the precise measurements a t Greenwich and Oxford Observatories. This shows that no secular increase of temperature, due to " city influence," has occurred a t these city stations, in spite of the great increase of population in the immediate neighbourhood during the period under consideration.
In Fig. 5 records from some of the best " ocean " stations a re shown, together with those from the grea t cities of London and St. Louis.
Very few reliable records show a fall of temperature over the last half century, except those of the China Sea, and perhaps also the Bay of Bengal.
To return to the world temperature curve, Fig. 4, the dotted line shows the displacement of the mean due to increasing atmospheric carbon dioxide, and it is evident that present tempera- tures, particularly in the northern hemisphere, are running above the calculated values. The course of world temperatures during the next twenty years should afford valuable evidence as to the accuracy of the calculated effect of atmospheric carbon dioxide.
A s regards the long period temperature variations represented by the Ice Ages of the geologically recent past, I have made many calculations to see if the natural movements of carbon dioxide could be rapid enough to account for the great changes of the amount in the atmosphere which would be necessary to give glacial periods with a duration of about 30,000 years. I find it almost impossible to account for movements of the gas of the required order because of the almost inexhaustible supply from the oceans, when its pressure in the air becomes low enough to give a fall of 5 to 8OC. in mean temperatures (see Fig. 2). Of course, i f the effect of carbon dioxide on temperatures was considerably greater than supposed, glacial periods might well be accounted for in this way.
In conclusion it may be said that the combustion of fossil fuel, whether it be peat from the surface or oil from 10,000 feet below, is likely to prove beneficial to mankind in several ways, besides the provision of heat and power. For instance the above mentioned small increases of mean temperature would be important at the northern margin of cultivation, and the growth of favourably situated plants is directly proportional to the carbon dioxide pressure (Brown and Escombe, 1905): In any case the return of the deadly glaciers should be delayed indefinitely.
As regards the reserves of fuel these would be sufficient to give at least ten times as much carbon dioxide as there is in the air a t present.
. REFERENCES Angstrom, A. 1918 Smithson. Misc. Col l . , 65 , No. 3. Arrhenius, Svante 1903 Kosmischs Physik, 2. Brown, H., and
Escombe, F. 1906 Proc. Roy. SOC. . B, 76. Brunt, D. 1932 Quart. J .R . M e t . SOG.. 68. Carpenter. T. M. 1937 /. Amer. Chem. Soc.. 69. Dines, W. H. 1927 Mem. R . M e t . Soc. . I, No. 11.
T H E ARTIFICII\I.
Fox, C. J. B. 1909
Fowle, F. E. Hettner, A. Kincer, J. B. Mossman, R. C. Radcliffe Obser-
vatory Rubens, H., and
Aschkinass, R. Schmidt, H.
1927 n nd
1918 1918 1933 1902
1930
I898 1913 1934
Simpson, G. C. 1928
PRODUCTION OF CARBON DIOXIDE 237
International Council for the Investigation of the
Ann. Phys. Chem.. 64. Ann. Phys., Leipzig, 42 . “ World weather records.” Smithson. Misc.
Coll,. 19 and 90. Mem. R . Met. SOC., 3, No. 21.
Sea. Publications de Circonstance. No. 44.
DISCUSSION.
Sir GEORGE SIMPSON expressed his admiration of the amount of work which hlr. Callendar had put into this paper. It was excellent work. I t was difficult to criticise it, but he would like to mention a few points which hlr. Callendar might wish to reconsider. In the first place he thought i t was not sufficiently realised by non-meteorologists who came for the first time to help the Society in its study, that it \vas impossible to solve the problem of the temperature distribution i n the atmosphere by working out the radiation. The atmosphere was not in a state of radiative equilibrium, and it also received heat by transfer from one part to another. In the second place, one had to remember that the tem- perature distribution in the atmosphere was determined almost entirely by the movement of the air up and down. This forced the atmosphere into a temperature distribution which was quite out of balance with the radiation. One could not, therefore, calculate the etTect of changing any one factor in the atmosphere, and he felt that the actual numerical results which Mr. Callendar had obtained could not be used to give a definite indication of the order of magnitude of the effect. Thirdly, he thought Mr. Callendar should give a little more information as to how he had calculated the results shown in Fig. 2 . These contained the crucial point of the paper, but the paper did not explain how they were obtained. In Table 5 Mr. Callendar had given the effect of doubling the CO, in one band, 13 to 16p, which included nearly the whole of the ene;gy connected with the C 0 2 . The increase of temperature obtained by calculation from these results, however, was not the same for a similar increase in CO, as that shown in Fig. 2 . This sort of discrepancy should be cleared up. Lastly he thought that the rise in CO, content and temperature during the last 50 years, niust be taken as rather a coincidence. The magnitude of it was even larger than Mr. Callendar had calculated, and he thought the rise in temperature was probably only one phase of one of the peculiar variations which all meteorological elements experienced.
Dr. F. J. W. WHIPPLE expressed the hope that the author would give the Society a n account of his investigation of the natural movements of carbon dioxide. I t was not clear how the calculations regarding the gradual diffusion of C 0 2 into the sea were carried out. The calculations embodied in Table IV depended on the assumption of high lapse rates of temperature everywhere. The inversions of temperature at night and throughout the winter in the polar regions were ignored. As an inversion implied a reversal of the new flow of radiation in the critical waveband,
238 T H E ARTIFICIAL PRODUCTION O F CARBON DIOXIDE
it seemed necessary to make additional calculations to allow for the vary- ing circumstances. Other processes besides radiation are involved in the exchange of normal energy between ground and atmosphere, but it may be justifiable to ignore these other proccsses in an investigation of the effect of variations in the amount of CO,.
Prof. D. BRUNT referred to the diagrams shouirig the gradual rise of temperature during the last 30 years, and said that this change in the mean temperature was no more striking than the changes which appear to have occurred in the latter half of the eightecnth century, and whose reality does not appear to be a matter of defective instruments. The long series of pressure observations made in Paris showed clearly that there had heen great changes in the mean path of depressions corning from the :\tlantic. Prof. Brunt agreed with the view of Sir George Simpson that the effect of an increase in the absorbing power of the atmosphere ~vould not be a simple change of temperature, bu t would modify the general circulation, and so yield a very complicated series of changes in conditions. He was not quite clear how the temperature changes had been evaluated. H e appreciated, however, that Mr. Callendar had put a tremendous amount of work into his most interesting paper.
Dr. C . E. P. BROOKS said that he had no doubt that there had been a real cliniatic change during the past thirty or forty years. T,his was sho\vn not only by the rise of temperature a t land stations, but also by the clccrease in the amount of ice in arctic and probably also in antarctic regions and by the rise of sea temperatures. This rise of temperature could honcvcr he explained, qualitatively i f not quantitatively, by changes in the atiiiospheric circulation, arid in those regions where a change in the circulation aould be expected to cause a fall of temperature, there had actually been a fall; moreover the rise of temperature \vas about ten times as great in the arctic regions as i n middle or low latitudes, and he cliil not think that a change in the amount of carbon dioxide could cause such a differential effect. The possibility certainly merited dis- cussion, however, and he welconied the paper as a valuable contribution to the problem of climatic changes.
Mr. I,. M. G. DINES asked Mr. Callendar whether he was satisfied that the change in the temperature of the air which he had found was significant, and that it was not merely a casual variation.
Mr. J . H. COSTE congratulated Mr. Callendar on his courage and perseverance. He would like to raise snme practical issues. Firstly, was the C 0 2 in the air really increasing? I t used to be given as -04%~ then as methods of chemical analysis improved it went don-n to .03%, and he thought it u.as very doubtful whether the differences which Mr. Callendar made use of were real. The methods of determining C 0 2 thirty or forty years ago were not sufficiently accurate for making such a comparison. A. Krogh calculated that fur a constant difference in ten- sion of I / I O ~ atmosphere between the air and the ocean, the latter being less rich, the annual invasion of C 0 2 would be equal to 3.; x 108 metric tons, which was about the annual contribution of CO, to the atmosphere by the burning of fuel; to this absorption by the ocean must be added the effects of vegetation, by photosynthesis. Thermometers thirty years ago were not instruments of very high precision and one mould hesitate to consider variations of fractions of a degree based on observations made ni th such thermometers.
THE AKTIFICIAL PRODUCTION OF CARBON DIOXIDE 239
in replying, &Ir. c;. S. CALLENDAR said he realized the extreme corn- plexity of the temperature control a t any particular region of the earth’s
and also that radiative equilibrium was not actually established, but i f any substance is added to the atmosphere which delays the transfer of low temperature radiation, without interfering with the arrival or dis- tribution of the heat supply, some rise of temperature appears to be inevitable in those parts which are furthest from outer space.
:Is stated in the paper the variation of temperature with CO, (Fig. 2), rvas obtained from the values of sky radiation, calculated for different amounts of this gas, substituted in espression ( 5 ) at S,, S,. If the ctzuttges of S shown in Table V are used for expression (j), it will be found that the temperature changes lie on the curve of Fig. 2 when the total sky radiation is 7 / 1 0 of the surface radiation. The sky radiation is calculated as a proportion of that from the surface, hence, a t constant heat supply, a change of sky “ temperature ” involves an equilibrium change of surface temperature as in expression ( 5 ) .
I t was found that even the minimum numerical explanation of the method used for calculating sky radiation would occupy several pages, and as a number of similar methods have been published from time to time, it was decided to use the available space for matter of more direct interest.
In reply to Dr. Whipple, the author regretted that space did not permit an account of the natural movements of CO,; he had actually lvritten an account of these, but it was just eight times as long as the present paper.
For the calculation of the diffusion of CO, into the sea the effective depth was considered to be zoo m. a t any one time.
The effect of CO, on temperatures has been calculated for a variety of lapse rates, including large inversions. In the latter case the effect on the surface temperature is small, but the protection for the warm middle layers remains.
I n reply to Prof. Brunt, the author stated that the warm periods about r;8o, 1797 and 1827, appeared to be of the nature of short warm intervals of up to ro years, with some very cold years intervening, whereas recent conditions indicated a more gradual and sustained rise of tem- perature; this was perhaps best shown by a 40-year moving average.
I n reply to Dr. Brooks, the author agreed that the recent rise in arctic temperatures was far too large to be attributed to change of CO, ; he thought that the latter might act as a promotor to start a series of imminent changes in the northern ice conditions. On account of their large rise he had not included the arctic stations in the world temperature curve (Fig. 4).
In reply to Mr. Dines, the author said he thought the change of air appeared too widespread to be a casual change due to local
variations of pressure. I n reply to Mr. Coste, the author said that the early series of co,
measurements he had used were probably very accurate; he had only observed on days when strong and steady west winds were
The actual CO, added in the last 40 years was equal to an increase of 8%; the observed and calculated values agreed in giving an effective increase of about 6%.
a t Kew.
340 T H E I\RTIFICI.\I, PRODUCTION O F Cr\RBON DIOXIDE
The author is not aware of the solution coefficients for sea water used by A. Krogh to give the stated figure which appears to be far too high. I t must be remembered that less than ~/rooo of the sea volume would be replaced a t the surface in one year, and the annual increase of CO, pressure i n the air is less than I / I O ~ atmosphere. About 98% of the GO, used by vegetation appears to be returned by decay oxidation and respiration.
The author thought that very accurate temperatures were taken last century; i f there was any doubt on this point the introduction to the long period tables from the Radcliffe Observatory (Met. Obs., Vol. 55, 1930), should set this at rest.
j j I . 5 1 1
The effect of vertical motion on the “ geostrophic departure ” of
In section 7 of our paper “ The importance u f vertical motion in the development of tropical revolvinK storms,” published in the lournal of January, 1938, a general proposition is enunciated, which reads as follows :
“ If vertical motion occurs in the atmosphere in a region of hori- mnta1 tcmperature gradient, then ascending motion gives a component of wind from warm to cold, and descending motion a component front cold to n arm. ”
We are indebted to Prof. Brunt for pointing out that the brief argumcnt given in the paper does not stress a t all adequately the type of air motion to which the proposition is intended to apply, and that it certainly does not apply to the case of a convection current rising by instability through an environment. By not realising this natural applica- tion of the proposition, we failed fully to appreciate Prof. Brunt’s con- tribution to the discussion of the paper, and in order to avoid further rni~~indcrstandiiig we should like to amend the statement to read :
“ I f there is general vertical motion in a region where the winds are quasi-geostrophic, then the departure of the wind velocity from the geostrophic value has a component directed along the horizontal gradient of temperature, from warm to cold with ascending motion, and from cold to warm with descending motion.”
The proposition is believed to have an important bearing on general meteorological developments, whcre gradual ascending motion, as, for example, in a frontal zone, is associated with convcrgence or divergence, and with departures of the wind velocity from the geostrophic value. Although the departures are generally small compared with the geostrophic velocities (so that the whole motion may be described as qllasi-geostrophic) they are of fundamental dynamical significance.
A further paper will shortly be presented, i n which the mathematical alld physical basis of the proposition will receive a more adequate


![Challenge3 Plant Zero CO2 Emission Challenge · Low CO2 production technologies Daily Kaizen activities [Simplification and streamlining] ・thorough shortening of production process](https://static.documents.pub/doc/80x56/5b98a2db09d3f22f0a8c545f/challenge3-plant-zero-co2-emission-challenge-low-co2-production-technologies.jpg)


