PROCEEDINGS INDONESIAN PETROLEUM ASSOCIATION Sixteenth Annual Convention, October 1987
ARUN CORE ANALYSIS: SPECIAL PROCEDURES FOR VUGGY CARBONATES
Eve S. Sprunt *
ABSTRACT
Vuggy carbonates, such as the reef facies of the Arun limestone, require modification of standard core analy- sis procedures. The best procedures for vuggy carbonates may nqt be the methods of choice for other types of rocks. When large, well-connected vugs are present, virtually any material can and does enter the pore spaces. Core analy- sis problems arise because whole drilling mud enters the pore spaces during coring. Jacketing materials and mercury also enter the pore spaces. For example, whole drilling mud has invaded the Arun limestone so deeply that, in some cases, vugs in the center of 3.5-inch diameter cores are filled with mud solids. Standard core cleaning techni- ques are designed to remove hydrocarbons and brine from the core, but not solids. Mud invasion and efficiency of cleaning techniques can be monitored with X-ray CAT scanning. Bulk volume of these core samples cannot be de- termined with normal procedures because mercury enters large vugs. Bulk volume should, therefore, be determined by direct measurement of the sample dimension with cali- pers instead of techniques that require immersion. To cal- culate porosity, pore volume can be obtained from the dif- ference between the bulk volume and grain volume. To measure pore compressibility, change in pore volume with pressure must be determined. Measured changes in pore volume are erroneously large, however, due to jacket intru- sion, and may be misinterpreted as sample crushing. New techniques have consequently been developed at Mobil to measure pore compressibility. Capillary pressure measu- rements on vuggy core samples are also difficult. Mercury injection measurements on full-diameter samples are pre- ferred. All core analysis procedures should be carefully evaluated before application to vuggy formation. Many assumptions fail when vugs are present.
INTRODUCTION
Standard core analysis techniques do not work well with vuggy carbonates. Problems have been encountered in obtaining high-accuracy core analysis on vuggy portions of the Arun gas condensate field in northern Sumatra, Indo- nesia. The Arun reservoir is extremely heterogenous. Some
_-__________- *) Mobil Research and Development Corporation, Dallas-USA.
facies present no unusual core analysis problems. At the other extreme are vuggy facies which cause severe difficulty. The problems increase with the size and number of the vugs. This paper describes the nature of the problems encountered and special procedures used for the vuggy carbonate rocks.
For engineering purposes, the Arun limestone was divid- ed into lagoonal and reef facies. Near-reef facies were lumped with the reef facies for core analysis purposes. The lagoonal sediments are typically fine-grained rocks with virtually all of the porosity in the form of microporosity. Such samples are very well-suited to conventional core analysis techniques. The lagoonal sediments may contain moldic porosity, which are often small pores in the ordei of a few millimeters in diameter. Moldic porosity can cause some problems in core analysis. Major difficulties occur in vuggy cores which are usually from the reef facies. For core analysis purposes, vugs include any large pores that create core analysis problems. Examples of such porosity are solution enlarged fractures (channel porosity) or large growth-framework pores in certain types of corals. There is a wide spectrum of vug sizes.
Full-core analysis is usually recommended for vuggy. heterogeneous carbonates. The problems that are high. lighted here are caused by intrusion of almost any materid into large, well-connected porosity. During the drilling process large amounts of whole mud can contaminate vuggy core. Mercury enters large vugs during displacement measurements, and jacketing material intrudes into pore spaces with pressure.
Mud solids contamination is a serious problem foi several reasons. The mud solids occupy pore volume that in the reservoir is occupied by reservoir fluids. Also, the mud solids reduce permeability. In a fomiation that i: naturally free of clay minerals, water binding by clay minerals in the mud solids can distort measurements suck as capillary pressure and relative permeability.
Mercury intrusion at very low pressures means that standard porosity measurement techniques cannot be used. Also, special precautions must be taken in mercuq injection tests because of mercury injection that occur: during the filling of the test chamber before the test starts.
Intrusion of jacketing material into pore spaces witl-
pressure creates problems in many core analysis measure- ments. Vuggy surface porosity is not measured in pore volume measurements of sleeved samples. Intrusion of jackets with pressure means that measurements dependent on knowing pore Volume or cha-ge in pore volume are inaccurate. Such measurements include pore compressibi- lity.
WHOLE DRILLING MUD INVASION
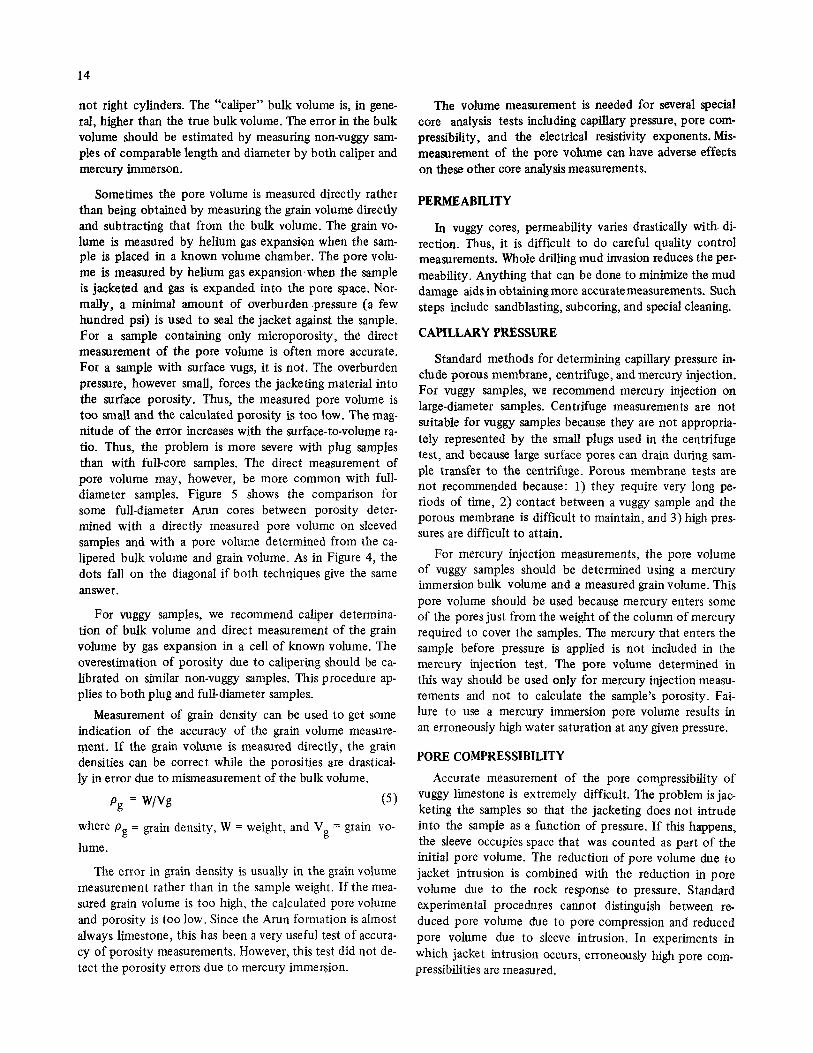
Drilling mud is designed to build a cake on the surface of the well bore. If large, well-connected vugs are present, whole' drilling mud will enter the rock. Invasion of core samples occurs ahead of the drill bit. How far the drilling mud solids will enter the core samples and rock surrounding the well bore depends on the pore network. The Arun reef facies are severely invaded with whole mud solids. Examination of the cores taken in the Arun field shows that whole mud invasion has affected the vuggy facies of all the cores. Whole mud invasion has occurred with both water- and oil based muds. Figure 1 shows dried mud solids near the center of a 3.5-inch core. Intermingled with the mud solids are limestone shards that may be limestone cut- tings.
Mud invasion appears in two basic modes. One mode is invasion of the microporosity adjacent to the outside of the core. Invasion of the microporosity can occur in many types of rock including the lagoonal facies of the Arun limestone. Such invasion can cause a skin of reduced permeability. The adverse effects of the skin can be mini- mized by sandblasting the cores. Sandblasting of full- diameter cores is a standard core analysis procedure. The more serious problem is mud invasion of the larger pores to the center of the cores.
X-ray CAT scanning enables us to view both types of mud invasion nondestructively. X-ray CAT scanning is based on difference in density. The barium sulfate weighting agent in the drilling mud is much denser than normal rock-forming minerals. As such, the drilling mud shows up as high density anomalies. Figure 2A shows a sample that had invasion of the core to the center and invasion of a solutionenlarged fracture at the top of the core. A one-inch plug sample was taken from the core piece. Figure 2B shows a digital X-ray of that core when the two pieces are placed back together. The plug hole is visible. This image is equivalent to a conventional X-ray of the core where all the information is projected onto a single plane. Figure 2C shows an X-ray CAT scan through the core at the dotted line in Figure 2B. The approximately one-third slabbing cut can be seen across the core. The drilling mud appears as the white areas, macroporosity as dark gray areas, and limestone as medium gray. The microporosity is smaller than the resolution of the CAT scanner. The mud solids contamination is not uniformly distributed; the lower right quadrant is badly affected
and the lower left mud-free. Mud solids enter the best- connected porosity.
The mud can be seen by eye when the core is cut. HOW - ever, the non uniform distribution of the mud means that the degree of contamination of a core cannot be determin- ed from its ends. X-ray CAT scanning allows non-destruc- tive screening of cores and plugs for mud solids contami- nation. The scanner can also be used to monitor the effec- tiveness of various core cleaning techniques.
One of the problems with mud solids contamination is that the composition of the mud solids is not well known. The precise composition of the whole drilling mud at any moment during drilling and coring is not well known either. The principal components of mud solids are barite, rock cuttings, clay minerals, and organic mud additives. Once
the invasion problem is identified, samples of returned mud can be saved during coring for later reference.
CORE CLEANING Core cleaning techniques involving hot or cold solvent
extraction are designed to remove liquid, organic, or salt contaminants from cores. Barite is chosen as a weighting agent in drilling mud because, among other reasons, it is non reactive with other mud chemicals. Thus, the rock will dissolve before the barite. A physical, rather than a chemical, process is required to remove the barite from the core. The clay component of the drilling mud may be removed from the cores with caustic solutions if no silica minerals are naturally present. Since clay minerals bind water, removing the clay component of the drilling mud, even if the barite is not removed, may improve the accu- racy of saturation-dependent core analysis measurements.
A wide assortment of core cleaning techniques were tried with varying success. COz/toluene extraction did not remove the solids. Solvent flooding did not remove a signi- ficant amount of mud solids from the interior of core samples. Ultrasonic cleaning loosened some of the near- surface mud, but not even all of that was removed. Water jet cleaning (as with a Water Pik) did a very good job of cleaning the pear-surface, but did not clean the interior of the rock. No method was found for removing all mud solids from the core.
Figure 3A shows a CAT scan of a 3.5-inch diameter core that has been cleaned with COZ /toluene extraction, sandblasting, solvent flooding, and a Water Pik. The surface and near-surface macropores are now free of solids. How- ever, large amounts of mud solids (white areas) remain in the larger pores. Use of the CAT scanner to monitor core cleaning can be seen in comparison between Figures 3A and 3B. The CAT scan image in Figure 3B, was taken follow- ing a caustic/pressure treatment. Chunks of mud solid were mobilized but not removed from the core. These chunks can be seen in the tubular vug near the top of the core.
13
The Arun limestone is virtually free of naturally-occur- ing clay minerals. Some horizons are dolomitized, but these are quite limited. To try to quantify the extent of the mud invasion, samples of the limestone were dissolved in acid. The idea was that the weight of the acid-insoluble residue would be proportional to the mud solids contami- nation. The heterogeneity in the mud solids distribution required rather large sample sizes to represent the core appropriately. Thus, large quantities of acid were needed. Accuracy was lost due to the large volume of acid and water used in washing the acid-insoluble residues. Also, several of the impurities commonly associated with barite are saluble in hydrochloric acid. Examples of such acid- soluble impurities are siderite, hematite, magnetite, mag- nesite, gypsum, and witherite. The elemental composition of the acid-insoluble residue was determined with an X-ray fluorescence technique, which indicated that the main constituent was barium. Good qualitative agreement was obtained between the weight percent acid-insoluble residue and the amount of mud solids observed with the CAT scanner.
CORE CONDITION
For hetergeneous formations full-diameter, routine core analysis is standardly recommended. Special core analysis is most often performed on plug samples, even for hetero- geneous formations. The same reasons that indicate full- diameter analysis for routine core analysis apply to special core analysis. Also, many special core analysis tests are more accurate if the test sample has as large a pore volume as possible.
An exception to the full-diameter core analysis recom- mendation is made if the core is badly broken. In that case, it may be impossible to represent the entire core properly with full-diameter samples for routine analysis. If this is true, foot-by-foot plug analysis may give a more meaningful representation of the core than full-diameter, routine core analysis with many feet not represented. We encountered this situation with one of the Arun cores.
If the core has sustained severe whole mud invasion, the full-core analysis may not be representative. Care must be taken to remove the damaged skin by sandblasting or sub- coring. The full cores will better sample the large vugs than plug samples, but they will, in general, be more severely invaded. The plugs from badly invaded core are not free from drilling mud solids contamination.
POROSITY
and the measured or calculated pore volume. Porosity is calculated from the measured bulk volume
9 = v P b /v = (vb - vg!Ivb 9 (1)
where 9 = porosity; V = pore volume; v b = bulk volume; P and V = grain volume. g
Measurement of bulk volume using mercury requires the assumption that the mercury is displaced by the rock and does not enter it. The assumptian fails for core sam- ples with large pore throats, such as vuggy carbonates. The radius (R) of the pore throat that allows mercury to enter depends on the depth (P) the pore is below the surface of the mercury.
R = (20 cos qlw, (2)
where u = the surface tension of the mercury; 8 = the contact angle (assume to be 140'); and K = a unit con- version constant (1.33 x so,
R (microns) = 561/P (cm Hg). (3)
The severity of the mercury immersion problem depends on the pore size and the pore throat distribution within the sample. If a 3-inch-long plug is barely submerged in mercury vertically, mercury will enter a 78-micron radius pore. If a 1-inch diameter plug is submerged horizontally, mercury can enter a 221-micron radius pore. Vugs do not have to be big enough to admit a human finger for the problem to be significant. The American Petroleum Insti- tute Recommended Practice for Core Analysis Procedures warns against immersing vuggy or high perme- ability samples in mercury.
If the grain volume, rather than the pore volume, is measured directly, the porosity is underestimated when the bulk volume is undermeasured. If the bulk volume is undermeasured by an amount E due to mercury immer- sion, the porosity is:
9 = ([vb ' 1 - vg)/(vb ' & )Y (4)
where E = error in bulk volume and v b = bulk volume measured by immersion in mercury.
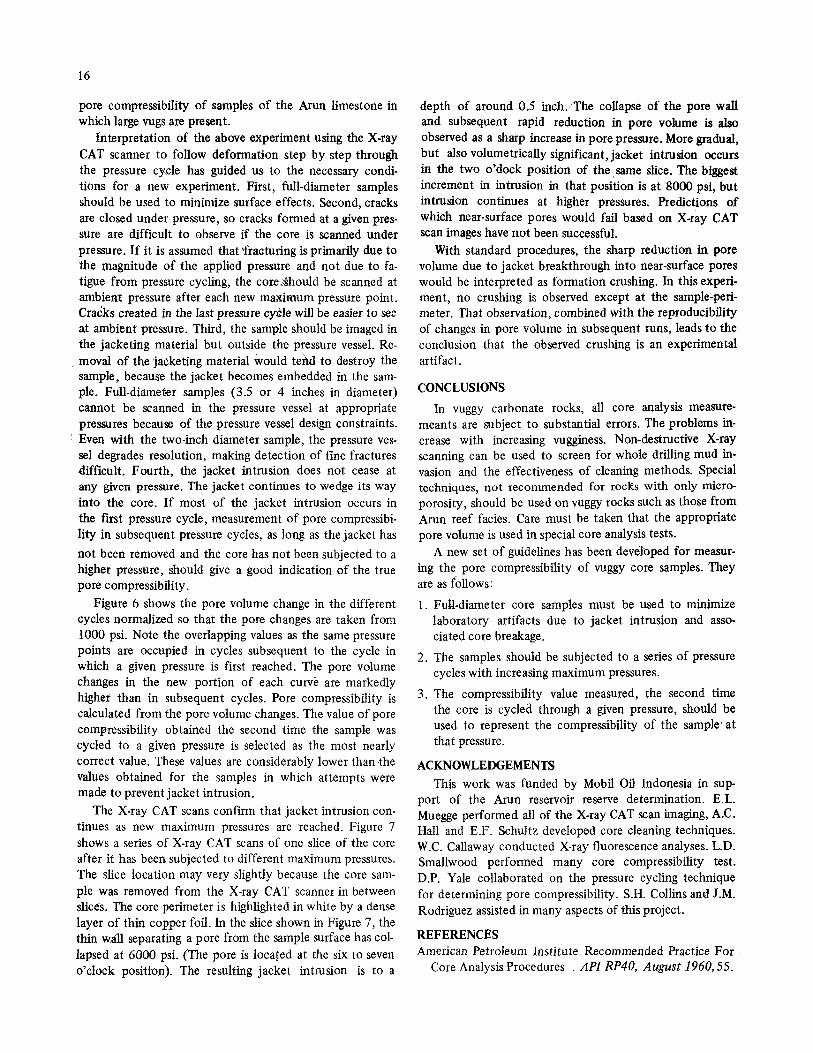
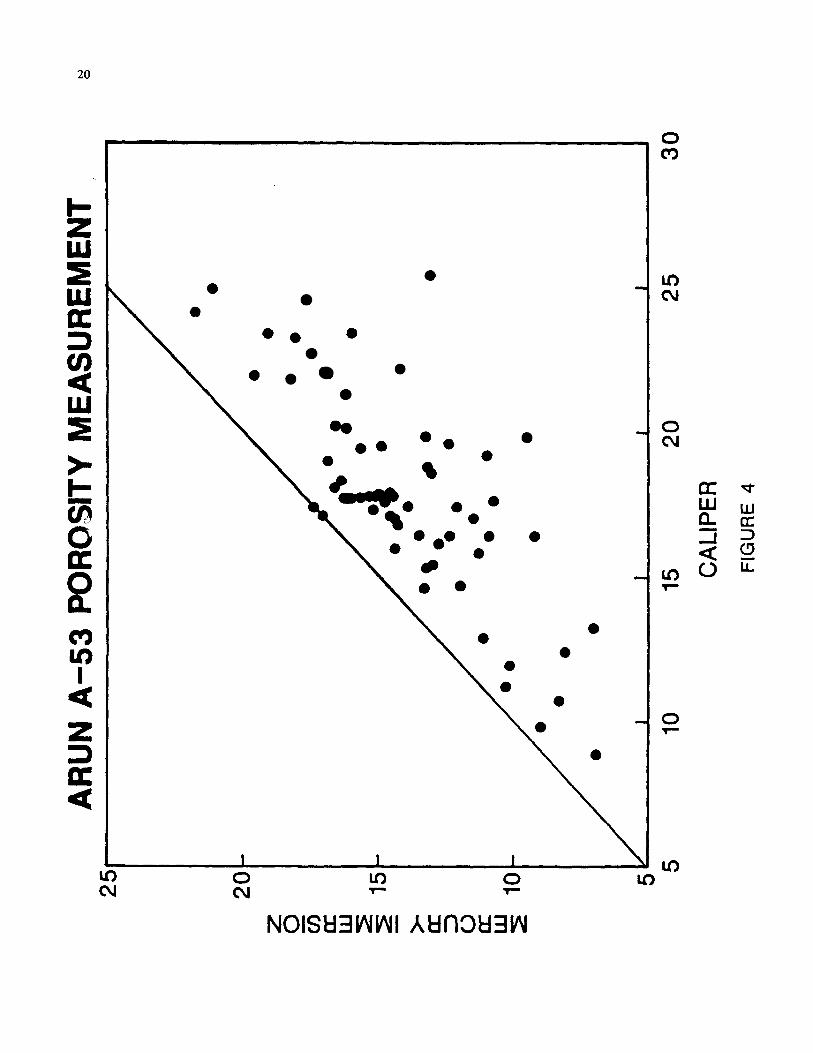
For vuggy carbonates, the error in bulk volume measu- rement can result in large porosity errors. Figure 4 shows comparison, for one-inch diameter Arun plugs, between the porosity measured by a caliper method and that measur- ed by mercury immersion. The dots would fall on the diagonal if both methods gave the same answer. This good fortune hippened for only two samples of Arun core.
Full cores are usually not immersed in mercury, but rather water. If a supposedlyliquid-saturated core is immers- ed in water, the displacement should give the bulk volume. However, the surface vugs of saturated cores drain almost instantaneously. Thus, when a partially drained full core is immersed in water, the bulk volume is underestimated because the water re-enters the vugs.
For vuggy rocks, the preferred method of determining bulk volume is by direct measurement of the length and diameter with calipers. For non-vuggy samples this is not the preferred method, because core samples are usually
14
not right cylinders. The “caliper” bulk volume is, in gene- ral, higher than the true bulk volume. The error in the bulk volume should be estimated by measuring non-vuggy sam- ples of comparable length and diameter by both caliper and mercury immerson.
Sometimes the pore volume is measured directly rather than being obtained by measuring the grain volume directly and subtracting that from the bulk volume. The grain vo- lume is measured by helium gas expansion when the sam- ple is placed in a known volume chamber. The pore volu- me is measured by helium gas expansion.when the sample is jacketed and gas is expanded into the pore space. Nor- mally, a minimal amount of overburden.pressure (a few hundred psi) is used to seal the jacket against the sample. For a sample containing only microporosity, the direct measurement of the pore volume is often more accurate. For a sample with surface vugs, it is not. The overburden pressure, however small, forces the jacketing material into the surface porosity. Thus, the measured pore volume is too small and the calculated porosity is too low. The mag- nitude of the error increases with the surface-to-volume ra- tio. Thus, the problem is more severe with plug samples than with full-core samples. The direct measurement of pore volume may, however, be more common with full- diameter samples. Figure 5 shows the comparison for some full-diameter Arun cores between porosity deter- mined with a directly measured pore volume on sleeved samples and with a pore volume determined from the ca- lipered bulk volume and grain volume. As in Figure 4, the dots fall on the diagonal if both techniques give the same answer.
For vuggy samples, we recommend caliper determina- tion of bulk volume and direct measurement of the grain volume by gas expansion in a cell of known volume. The overestimation of porosity due to calipering should be ca- librated on similar non-vuggy samples. This procedure ap- plies to both plug and full-diameter samples.
Measurement of grain density can be used to get some indication of the accuracy of the grain volume measure- ment. If the grain volume is measured directly, the grain densities can be correct while the porosities are drastical- ly in error due to mismeasurement of the bulk volume.
Pg = WlVg (5)
where pg = grain density, W = weight, and V = grain VO-
lume . g
The error in grain density is usually in the grain volume measurement rather than in the sample weight. If the mea- sured grain volume is too high, the calculated pore volume and porosity is too low. Since the Arun formation is almost always limestone, this has been a very useful test of accura- cy of porosity measurements. However, this test did not de- tect the porosity errors due to mercury immersion.
The volume measurement is needed for several special core analysis tests including capillary pressure, pore com- pressibility, and the electrical resistivity exponents. Mis- measurement of the pore volume can have adverse effects on these other core analysis measurements.
PERMEABILITY
wggy cores, permeability varies drastically with^ di- rection. Thus, it is difficult to do careful quality control measurements. Whole drilling mud invasion reduces the per- meability. Anything that can be done to minimize the mud damage aids in obtaining more accuratemeasurements. Such steps include sandblasting, subcoring, and special cleaning.
CAPILLARY PRESSURE
Standard methods for determining capillary pressure in- clude porous membrane, centrifuge, and mercury injection. For vuggy samples, we recommend mercury injection on large-diameter samples. Centrifuge measurements are not suitable for vuggy samples because they are not appropria- tely represented by the small plugs used in the centrifuge test, and because large surface pores can drain during Sam- ple transfer to the centrifuge. Porous membrane tests are not recommended because: 1) they require very long pe- riods of time, 2) contact between a vuggy sample and the porous membrane is difficult to maintain, and 3) high pres- sures are difficult to attain.
For mercury injection measurements, the pore volume of vuggy samples should be determined using a mercury immersion bulk volume and a measured grain volume. This pore volume should be used because mercury enters some of the pores just from the weight of the column of mercury required to cover the samples. The mercury that enters the sample before pressure is applied is not included in the mercury injection test. The pore volume determined in this way should be used only for mercury injection measu- rements and not to calculate the sample’s porosity. Fai- lure to use a mercury immersion pore volume results in an erroneously high water saturation at any given pressure.
PORE COMPRESSIBILITY Accurate measurement of the pore compressibility of
vuggy limestone is extremely difficult. The problem is jac- keting the samples so that the jacketing does not intrude into the sample as a function of pressure. If this happens, the sleeve occupies space that was counted as part of the initial pore volume. The reduction of pore volume due to jacket intrusion is combined with the reduction in pore volume due to the rock response to pressure. Standard experimental procedures cannot distinguish between re- duced pore volume due to pore compression and reduced pore volume due to sleeve intrusion. In experiments in which jacket intrusion occurs, erroneously high pore com- pressibilities are measured.
If the sleeve material intrudes into the sample, there are two options: 1) alter the sleeve design to present sleeve in- trusion, or 2) measure the amount of sleeve intrusion. Both approaches were tried. Efforts to prevent sleeve intrusion were unsuccessful. Three methods were tried to prevent jacket intrusion in vuggy plugs and full cores: 1) epoxy-fill- ing of surface vugs, 2) wrapping with .OlO-inch hardened stainless steel shim stock, and 3) wrapping in .050-inch stainless steel pipe.
In the fxst method, epoxy-filling of surface vugs pre- vents sleeve intrusion into some vugs, but does not eli- minate the problem. Some large vugs may be separated from the core surface by a thin wall of rock. It is not possi- ble to fill these pores with epoxy without impregnating the whole rock. A large change in pore volume occurs when the thin wall fails and the sleeve occupies the pore. Such a change may be falsely interpreted as crushing of the rock.
In the second method, the core was wrapped with 010- inch hardened stainless steel shim stock before placement in the rubber sleeve. The shim stock reduced the amount of sleeve intrusion, but did not eliminate it. The intrusion was a function of pressure, so compressibility values were too large at all pressures.
Since a .010-inch thick layer of stainless steel inside the sleeve decreased but did not eliininate the sleeve intrusion, the third attempt used a .05(rinch layer of stainless steel. Stainless steel pipe with an inside diameter slightly smaller than the external diameter of the core was placed around the core. The pipe was split lengthwise so that the pressure could be transmitted to the core. There was deformation of even this thickness of steel. A further complication was that fluid was trapped between the edge of the steel pipe and the rubber sleeve. The fluid was squeezed out with pressure and led to falsely large values of pore compressi- bility.
Effort 'was then focused on quantifying the amount of sleeve intrusion using observation with X-ray CAT scanner. Two approaches were used: 1) observation of the core under pressure inside the pressure vessel, and 2) observation of the core outside the pressure vessel after the completion of each cycle of a series of pressure cycles with increasing maximum pressures.
The X-ray CAT scanner allows us to image a core sample inside a pressure vessel under pressure if sufficient X-rays can penetrate the vessel. Usually pressure vessels are made of some kind of steel. Steel has a density of 7.86 gm/cc and absorbs more X-rays than lower density materials such as aluminum (density 2.75 gmlcc). Aluminum or other strong, low-density materials are preferred for construction of pressure vessels which are to be used in conjunction with the X-ray CAT scanner.
The design of the aluminum pressure vessel must con- sider maximum working pressure, core sample diameter,
and desired X-ray CAT scan image quality. A large-dime- ter core is preferred to minimize surface effects such as sleeve intrusion. However, experiments with large-diameter core samples require pressure vessels with large inner dia- meters and thick walls. The thickness of the pressure vessel walls also increase with the maximum working pressure of the pressure vessel. The X-rays used to generate the image are transmitted through the pressure vessel, so each incre ment in wall thickness means double that increment of vesseI wall in the X-ray path. The large diameter core Sam- ples also absorb more X-rays. The larger the core and the. thicker the pressure vessel walls, the poorer the quality of the X-ray CAT scan image.
To simulate the pressures that will be reached in the Arun field at depletion, we constructed a pressure vessel that could sustain pressures of 10,000 psi. Considering the pressure vessel wall thickness required to contain this pres- sure, X-ray CAT scan resolution constraints limited us to a 2-inch diameter core sample.
The X-ray CAT scanner was then used to monitor chan- ges in such a 2-inch diameter sample of Arun core during a test that measured change in pore volume with pressure. The test was run as a single increasing pressure. At each pressure point, the sample was allowed to equilibrate. Then the sample was scanned at 5 mm intervals, and the pore volume change was recorded. A final series of scans were taken in the pressure vessel after the pressure had been dropped to ambient. The compressibility values ob- tained were higher by a factor of two or more than those measured in experiments in which an attempt was made to eliminate jacket intrusion. This was expected, the objec- tive was to measure the volume displaced by jacket intrusi- on from the X-ray CAT scans. The volume occupied by the jacketing material would be subtracted from the nleasured change in pore volume. The quantification was not attempt- ed when the X-ray CAT scans showed that the experiment was dominated by collapse of the core surface by wedge- like jacket intrusion. The conclusion was that samples with large surface-to-volume ratios would be needed to assure adequate intact rock for meaningful experiments.
Much of the damage to the core sample from the sleeve wedging was not observed until the confining pressure was dropped to ambient pressure. At elevated pressures, thin cracks were pressed shut and were difficult to observe. The final scans at imbient pressure showed considerable break- age; all the damage was adjacent to the core surface. The rubber jacket intruded into surface vugs and tended to wed- ge the core apart. The damage had not been visible in the scans taken at 10,000 psi. It was not possibIe to determine conclusively whether the breakage was indicative of sample crushing that could be expected to occur in the reservoir during pressure drawdown or merely experimental arti- facts related to the surface-to-volume ratio. A two-inch dia- meter sample was inadequate for proper modeling of the
16
pore compressibility of samples of the Arun limestone in which large vugs are present.
Interpretation of the above experiment using the X-ray CAT scanner to follow deformation step by step through the pressure cscle has guided us to the necessary condi- tions for a new experiment. First, full-diameter samples should be used to minimize surface effects. Second, cracks are closed under pressure, so cracks formed at a given pres- sure are difficult to observe if the core is scanned under pressure. If it is assumed that *fracturing is primarily due to the magnitude of the applied pressure and not due to fa- tigue from pressure cycling, the core.dhould be scanned at ambient pressure after each new maximum pressure point. Cracks crea'ted in the last pressure cycle will be easier to see at ambient pressure. Third, the sample should be imaged in the jacketing material but outside the pressure vessel. Re- moval of ~e jacketing material would tehd to destroy the sample, because the jacket becomes embedded in the sam- ple. Full-diameter samples (3.5 or 4 inches in diameter) cannot be scanned in the pressure vessel at appropriate pressures because of the pressure vessel design constraints.
' Even with the two-inch diameter sample, the pressure ves- sel degrades resolution, making detection of fine fractures difficult. Fourth, the jacket intrusion does not cease at any given pressure. The jacket continues to wedge its way into the core. If most of the jacket intrusion occurs in the first pressure cycle, measurement of pore compressibi- lity in subsequent pressure cycles, as long as the jacket has not been removed and the core has not been subjected to a higher pressure, should give a good indication of the true pore compressibility.
Figure 6 shows the pore volume change in the different cycles normalized so that the pore changes are taken from 1000 psi. Note the overlapping values as the same pressure points are occupied in cycles subsequent to the cycle in which a given pressure is first reached. The pore volume changes in the new portion of each curve are markedly highef than in subsequent cycles. Pore compressibility is calculated from the pore volume changes. The value of pore compressibility obtained the second time the sample was cycled to a given pressure is selected as the most nearly correct value. These values are considerably lower than the values obtained for the samples in which attempts were made to prevent jacket intrusion.
The Xdray CAT scans confirm that jacket intrusion con- tinues as new maximum pressures are reached. Figure 7 shows a series of X-ray CAT scans of one slice of the core after it has been subjected to different maximum pressures. The slice location may very slightly because the core sam- ple was removed from the X-ray CAT scanner in between slices. The core perimeter is highlighted in white by a dense layer of thin copper foil. In the slice shown in Figure 7, the thin wdll separating a pore from the sample surface has col- lapsed at 6000 psi. (The pore is located at the six to seven o'clock position). The resulting jacket intrusion is to a
depth of around 0.5 inch..,The collapse of the pore wall and subsequent rapid reduction in pore volume is also observed as a sharp increase in pore pressure. More gradual, but also volumetrically significant, jacket intrusion occurs in the two o'dock position of the,same slice. The biggest increment in intrusion in that position is at 8000 psi, but intrusion continues at higher pressures. Predictions of which near-surface pores would fail based on X-ray CAT scan images have not been successful.
With standard procedures, the sharp reduction in pore volume due to jacket breakthrough into near-surface pores would be interpreted as formation crushing. In this experi- ment, no crushing is observed except at the sample-peri- meter. That observation, combined with the reproducibility of changes in pore volume in subsequent runs, leads to the conclusion that the observed crushing is an experimental artifact.
CONCLUSIONS
In vuggy carbonate rocks, all core analysis measure- meants are subject to substantial errors. The problems in- crease with increasing vugginess. Non-destructive X-ray scanning can be used to screen for whole drilling mud in- vasion and the effectiveness of cleaning methods. Special techniques, not recommended for rocks with only micro- porosity, should be used on vuggy rocks such as those from Arun reef facies. Care must be taken that the appropriate pore volume is used in special core analysis tests.
A new set of guidelines has been developed for measur- ing the pore compressibility of vuggy core samples. They ate as follows:
1. Full-diameter core samples must be used to minimize laboratory artifacts due to jacket intrusion and asso- ciated core breakage.
2. The samples should be subjected to a series of pressure cycles with increasing maximum pressures.
3. The compressibility value measured, the second time the core is cycled through a given pressure, should be used to represent the compressibility of the sample. at that pressure.
ACKNOWLEDGEMENTS This work was funded by Mobil Oil Indonesia in sup-
port of the ArUn reservoir reserve determination. E.L. Muegge performed all of the X-ray CAT Scan imaging, A.C. Hall and E.F. Schultz developed core cleaning techniques. W.C. Callaway conducted X-ray fluorescence analyses. L.D. Smallwood performed many core compressibility test. D.P. Yale collaborated on the pressure cycling technique for determining pore compressibility. S.H. Collins and J.M. Rodriguez assisted in many aspects of this project.
REFERENCES American Petroleum Institute Recommended Practice For
Core Analysis Procedures . API RP40, August 1960,55.