A weekly publication of the Agricultural Marketing Service www.ams.usda.gov/GTR July 29, 2021 Contents Article/ Calendar Grain Transportation Indicators Rail Barge Truck Exports Ocean Brazil Mexico Grain Truck/Ocean Rate Advisory Datasets Specialists Subscription Information -------------- The next release is August 5, 2021 Preferred citation: U.S. Department of Agriculture, Agricultural Marketing Service. Grain Transportation Report. July 29, 2021. Web: http://dx.doi.org/10.9752/TS056.07-29-2021 Grain Transportation Report Contact Us WEEKLY HIGHLIGHTS STB Asks Class I Railroads To Provide Information on Container Congestion On July 22, the Surface Transportation Board (STB) asked Class I railroads to provide information on congestion at key container terminals. STB also requested the railroads’ policies and practices for assessing storage charges. These requests come in response to concerns over persistent intermodal congestion and significant container storage fees some shippers must pay to receive their containers. STB hopes to better understand the magnitude of container congestion, the purpose and effect of storage fees, and whether there is relief for receivers who cannot facilitate the release of their containers. Tracking just one of several affected grain commodities, the Soybean Transportation Coalition expects “supply chain issues for exporters to continue for the foreseeable future, including the container squeeze and rail availability, as well as the nationwide shortage of truck drivers.” Soybeans are the largest U.S. containerized grain export, representing more than 40 percent of the market on average. Minnesota Approves Over $800 Million for Road Projects Minnesota State lawmakers recently approved a transportation budget bill to provide over $800 million for State roads and bridges. As part of the budget, the State’s trunk highway system will receive $413 million in trunk highway bonds, including $200 million for the Corridors of Commerce program, $100 million for general State road construction, and $113 million for State road construction projects under the Minnesota Department of Transportation’s Regional and Community Investment planning category. As a major producer of corn and soybeans, Minnesota depends on the condition and performance of its roads for grain transportation. As of 2019, 4.7 percent (13,346) of bridges in Minnesota were structurally deficient, and in 2018, 16 percent of roads in the State were in poor condition— according to the American Society of Civil Engineers. The new funding is expected to boost highway capacity and improve freight movement statewide, which can benefit grain transportation. Panama Canal Makes Way for Larger Vessels As of May 21, the maximum allowable length for vessels transiting the Panama Canal’s Neopanamax Locks has increased from 367.28 meters (1,205 feet) to 370.33 meters (1,215 feet). With this increase, 96.8 percent of the world’s container fleet can now transit the Canal, thereby shortening routes and benefiting economies around the world. The Panama Canal Authority also increased the maximum allowable draft to 15.24 meters (50 feet). By offering larger capacity along with shorter travel distances, the Canal reduces vessels’ fuel consumption and emissions and helps reduce global greenhouse gases. The changes in allowable vessel length and draft were made in anticipation of the fifth anniversary of the Canal’s expansion, on June 26. The Panama Canal is an important outlet for containerized grain shipped from the U.S. East and Gulf Coasts destined for China and other Asian countries. Snapshots by Sector Export Sales For the week ending July 15, unshipped balances of wheat, corn, and soybeans totaled 17.4 million metric tons (mmt). This was 6 percent lower than last week and 13 percent lower than the same time last year. Net corn export sales were −0.089 mmt, significantly lower than the past week. Net soybean export sales were 0.062 mmt, significantly higher from the previous week. Net weekly wheat export sales were 0.473 mmt, up 11 percent from last week. Rail U.S. Class I railroads originated 20,964 grain carloads during the week ending July 17. This was a 22-percent increase from the previous week, 6 percent fewer than last year, and 10 percent fewer than the 3-year average. Average August shuttle secondary railcar bids/offers (per car) were $117 below tariff for the week ending July 22. This was $108 more than last week and $389 lower than this week last year. There were no non-shuttle bids/offers this week. Barge For the week ending July 24, barged grain movements totaled 511,872 tons. This was 32 percent less than the previous week and 31 percent less than the same period last year. For the week ending July 24, 322 grain barges moved down river—177 fewer barges than the previous week. There were 701 grain barges unloaded in New Orleans, 30 percent more than the previous week. Ocean For the week ending July 22, 26 oceangoing grain vessels were loaded in the Gulf—unchanged from the same period last year. Within the next 10 days (starting July 23), 49 vessels were expected to be loaded—36 percent more than the same period last year. As of July 22, the rate for shipping a metric ton (mt) of grain from the U.S. Gulf to Japan was $81.00. This was 4 percent less than the previous week. The rate from the Pacific Northwest to Japan was $44.00 per mt, 2 percent less than the previous week. Fuel For the week ending July 26, the U.S. average diesel fuel price decreased .2 cents from the previous week to $3.342 per gallon, 91.5 cents above the same week last year. This is the first time in 13 weeks that the national average diesel price has decreased.
Transcript
A weekly publication of the Agricultural Marketing Service www.ams.usda.gov/GTR
July 29, 2021
Contents
Article/ Calendar
Grain Transportation
Indicators
Rail
Barge
Truck
Exports
Ocean
Brazil
Mexico
Grain Truck/Ocean Rate Advisory
Datasets
Specialists
Subscription Information
--------------
The next release is
August 5, 2021
Preferred citation: U.S. Department of Agriculture, Agricultural Marketing Service. Grain Transportation Report. July 29, 2021. Web: http://dx.doi.org/10.9752/TS056.07-29-2021
Grain Transportation Report
Contact Us WEEKLY HIGHLIGHTS
STB Asks Class I Railroads To Provide Information on Container Congestion
On July 22, the Surface Transportation Board (STB) asked Class I railroads to provide information on congestion at key container
terminals. STB also requested the railroads’ policies and practices for assessing storage charges. These requests come in response to
concerns over persistent intermodal congestion and significant container storage fees some shippers must pay to receive their containers.
STB hopes to better understand the magnitude of container congestion, the purpose and effect of storage fees, and whether there is relief
for receivers who cannot facilitate the release of their containers. Tracking just one of several affected grain commodities, the Soybean
Transportation Coalition expects “supply chain issues for exporters to continue for the foreseeable future, including the container squeeze
and rail availability, as well as the nationwide shortage of truck drivers.” Soybeans are the largest U.S. containerized grain export,
representing more than 40 percent of the market on average.
Minnesota Approves Over $800 Million for Road Projects
Minnesota State lawmakers recently approved a transportation budget bill to provide over $800 million for State roads and bridges. As
part of the budget, the State’s trunk highway system will receive $413 million in trunk highway bonds, including $200 million for the
Corridors of Commerce program, $100 million for general State road construction, and $113 million for State road construction projects
under the Minnesota Department of Transportation’s Regional and Community Investment planning category. As a major producer of
corn and soybeans, Minnesota depends on the condition and performance of its roads for grain transportation. As of 2019, 4.7 percent
(13,346) of bridges in Minnesota were structurally deficient, and in 2018, 16 percent of roads in the State were in poor condition—
according to the American Society of Civil Engineers. The new funding is expected to boost highway capacity and improve freight
movement statewide, which can benefit grain transportation.
Panama Canal Makes Way for Larger Vessels
As of May 21, the maximum allowable length for vessels transiting the Panama Canal’s Neopanamax Locks has increased from 367.28
meters (1,205 feet) to 370.33 meters (1,215 feet). With this increase, 96.8 percent of the world’s container fleet can now transit the Canal,
thereby shortening routes and benefiting economies around the world. The Panama Canal Authority also increased the maximum
allowable draft to 15.24 meters (50 feet). By offering larger capacity along with shorter travel distances, the Canal reduces vessels’ fuel
consumption and emissions and helps reduce global greenhouse gases. The changes in allowable vessel length and draft were made in
anticipation of the fifth anniversary of the Canal’s expansion, on June 26. The Panama Canal is an important outlet for containerized grain
shipped from the U.S. East and Gulf Coasts destined for China and other Asian countries.
Snapshots by Sector
Export Sales
For the week ending July 15, unshipped balances of wheat, corn, and soybeans totaled 17.4 million metric tons (mmt). This was 6
percent lower than last week and 13 percent lower than the same time last year. Net corn export sales were −0.089 mmt, significantly
lower than the past week. Net soybean export sales were 0.062 mmt, significantly higher from the previous week. Net weekly wheat
export sales were 0.473 mmt, up 11 percent from last week.
Rail
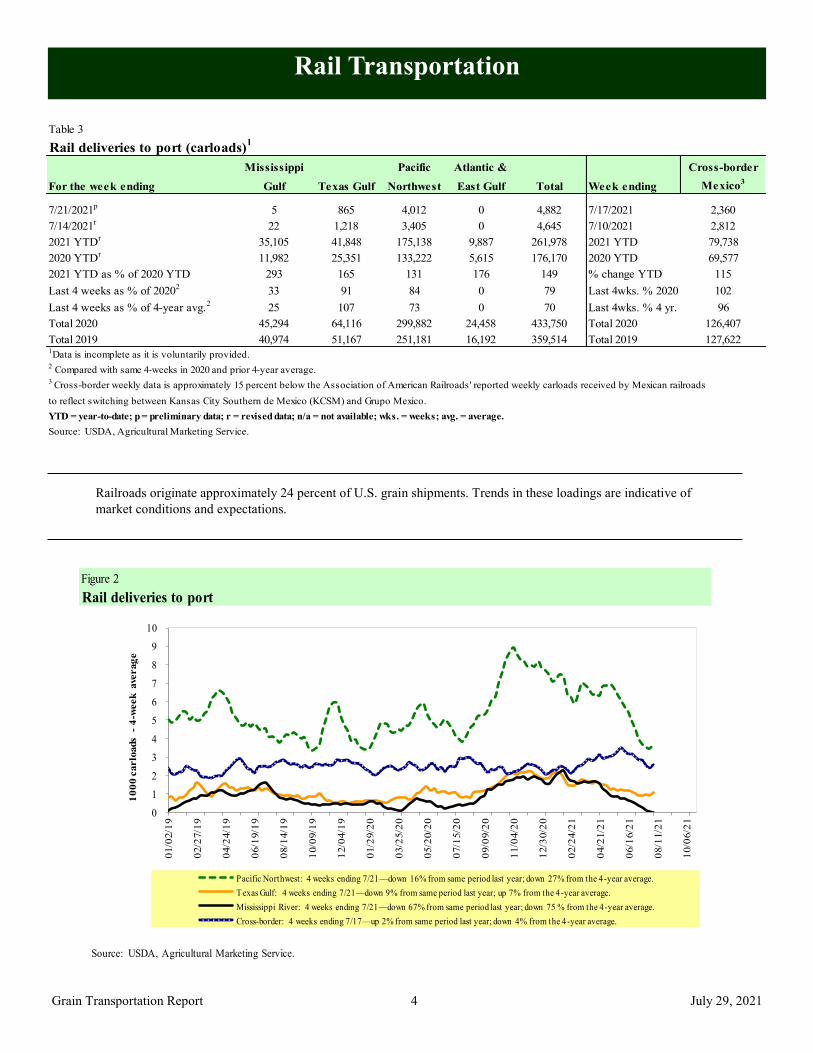
U.S. Class I railroads originated 20,964 grain carloads during the week ending July 17. This was a 22-percent increase from the previous
week, 6 percent fewer than last year, and 10 percent fewer than the 3-year average.
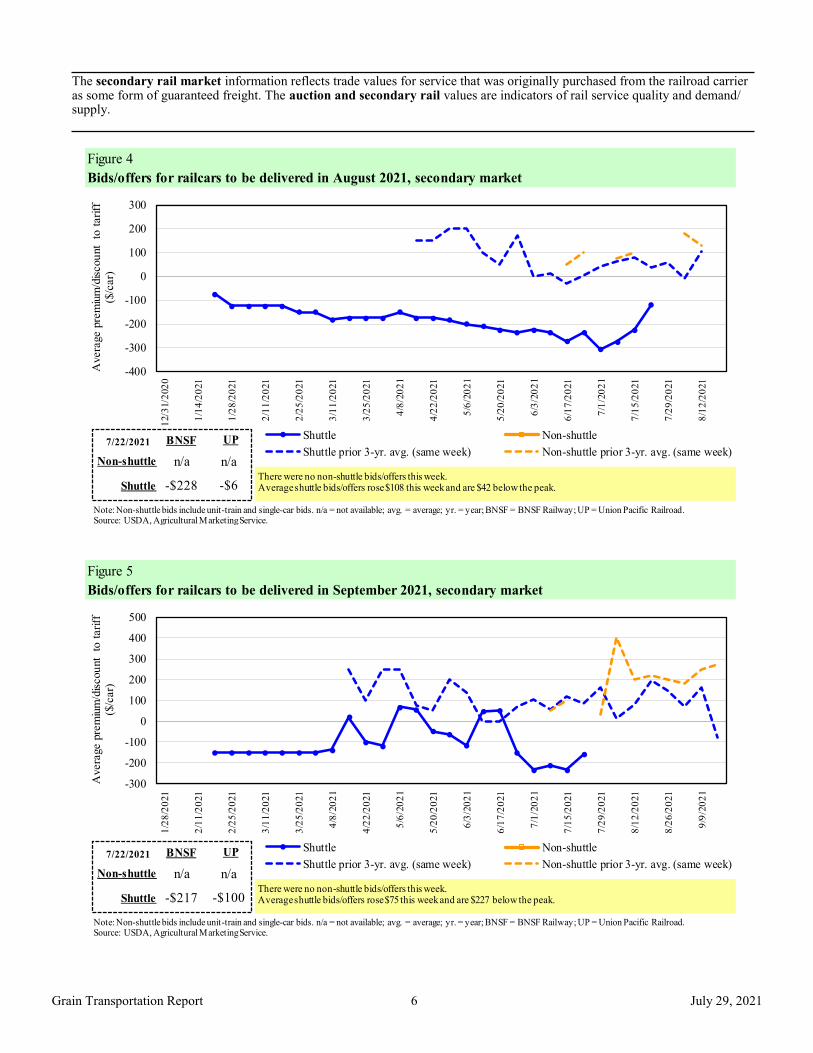
Average August shuttle secondary railcar bids/offers (per car) were $117 below tariff for the week ending July 22. This was $108 more
than last week and $389 lower than this week last year. There were no non-shuttle bids/offers this week.
Barge
For the week ending July 24, barged grain movements totaled 511,872 tons. This was 32 percent less than the previous week and 31
percent less than the same period last year.
For the week ending July 24, 322 grain barges moved down river—177 fewer barges than the previous week. There were 701 grain
barges unloaded in New Orleans, 30 percent more than the previous week.
Ocean
For the week ending July 22, 26 oceangoing grain vessels were loaded in the Gulf—unchanged from the same period last year. Within
the next 10 days (starting July 23), 49 vessels were expected to be loaded—36 percent more than the same period last year.
As of July 22, the rate for shipping a metric ton (mt) of grain from the U.S. Gulf to Japan was $81.00. This was 4 percent less than the
previous week. The rate from the Pacific Northwest to Japan was $44.00 per mt, 2 percent less than the previous week.
Fuel
For the week ending July 26, the U.S. average diesel fuel price decreased .2 cents from the previous week to $3.342 per gallon, 91.5
cents above the same week last year. This is the first time in 13 weeks that the national average diesel price has decreased.
2021 YTD as % of 2020 YTD 293 165 131 176 149 % change YTD 115
Last 4 weeks as % of 20202
33 91 84 0 79 Last 4wks. % 2020 102
Last 4 weeks as % of 4-year avg.2
25 107 73 0 70 Last 4wks. % 4 yr. 96
Total 2020 45,294 64,116 299,882 24,458 433,750 Total 2020 126,407
Total 2019 40,974 51,167 251,181 16,192 359,514 Total 2019 127,6221Data is incomplete as it is voluntarily provided.
2 Compared with same 4-weeks in 2020 and prior 4-year average.
3 Cross-border weekly data is approximately 15 percent below the Association of American Railroads' reported weekly carloads received by Mexican railroads
to reflect switching between Kansas City Southern de Mexico (KCSM) and Grupo Mexico.
YTD = year-to-date; p = preliminary data; r = revised data; n/a = not available; wks. = weeks; avg. = average.
Source: USDA, Agricultural Marketing Service.
July 29, 2021
Grain Transportation Report 5
Figure 3
Total weekly U.S. Class I railroad grain carloads
15
17
19
21
23
25
27
29
31
1,0
00
car
load
s
Prior 3-year, 4-week average Current 4-week average
For the 4 weeks ending July 17, grain carloads were up 2 percent from the previous week, down 2 percent from last year,
and down 10 percent from the 3-year average.
Source: Association of American Railroads.
Table 4
Class I rail carrier grain car bulletin (grain carloads originated)
For the week ending:
7/17/2021 CSXT NS BNSF KCS UP CN CP
This week 1,294 2,361 10,489 1,051 5,769 20,964 2,376 3,841
This week last year 1,497 2,576 11,427 1,052 5,796 22,348 4,445 5,311
GCAS/Region 1 no offer no offer no offer no offer no offer no offer n/a n/a
GCAS/Region 2 no offer 10 no offer no bid no offer no offer n/a n/a
1Auction offerings are for single-car and unit train shipments only.
2Average premium/discount to tariff, last auction. n/a = not available.
3BNSF - COT = BNSF Railway Certificate of Transportation; north grain and south grain bids were combined effective the week ending 6/24/06.
4UP - GCAS = Union Pacific Railroad Grain Car Allocation System.
Region 1 includes: AR, IL, LA, MO, NM, OK, TX, WI, and Duluth, MN.
Region 2 includes: CO, IA, KS, MN, NE, WY, and Kansas City and St. Joseph, MO.
Source: USDA, Agricultural Marketing Service.
UP4
Delivery period
BNSF3
For the week ending:
7/22/2021
July 29, 2021
Grain Transportation Report 6
The secondary rail market information reflects trade values for service that was originally purchased from the railroad carrier as some form of guaranteed freight. The auction and secondary rail values are indicators of rail service quality and demand/supply.
Figure 4
Bids/offers for railcars to be delivered in August 2021, secondary market
Note: Non-shuttle bids include unit-train and single-car bids. n/a = not available; avg. = average; yr. = year; BNSF = BNSF Railway; UP = Union Pacific Railroad.Source: USDA, Agricultural Marketing Service.
n/a
UPBNSF
$700
n/a
$661Shuttle
Non-shuttle
There were no non-shuttle bids/offers this week.Average shuttle bids/offers fell $16 this week and are $374 below the peak.
Table 6
Weekly secondary railcar market ($/car)1
Aug-21 Sep-21 Oct-21 Nov-21 Dec-21 Jan-22
BNSF-GF n/a n/a n/a n/a n/a n/a
Change from last week n/a n/a n/a n/a n/a n/a
Change from same week 2020 n/a n/a n/a n/a n/a n/a
UP-Pool n/a n/a n/a n/a n/a n/a
Change from last week n/a n/a n/a n/a n/a n/a
Change from same week 2020 n/a n/a n/a n/a n/a n/a
BNSF-GF (228) (217) 700 n/a n/a n/a
Change from last week 60 50 6 n/a n/a n/a
Change from same week 2020 (528) (567) 0 n/a n/a n/a
UP-Pool (6) (100) 661 n/a n/a n/a
Change from last week 157 100 (39) n/a n/a n/a
Change from same week 2020 (250) (225) 111 n/a n/a n/a
1Average premium/discount to tariff, $/car-last week.
Note: Bids listed are market indicators only and are not guaranteed prices. n/a = not available; GF = guaranteed freight; Pool = guaranteed pool;
BNSF = BNSF Railway; UP = Union Pacific Railroad.
Data from James B. Joiner Co., Tradewest Brokerage Co.
Source: USDA, Agricultural Marketing Service.
No
n-s
hu
ttle
For the week ending:
7/22/2021
Sh
utt
le
Delivery period
July 29, 2021
Grain Transportation Report 8
The tariff rail rate is the base price of freight rail service. Together with fuel surcharges and any auction and secondary rail values, the tariff rail rate constitutes the full cost of shipping by rail. Typically, auction and secondary rail values are a small fraction of the full cost of shipping by rail relative to the tariff rate. However, during times of high rail demand or short supply, high auction and secondary rail values can exceed the cost of the tariff rate plus fuel surcharge.
Table 7
Tariff rail rates for unit and shuttle train shipments1
Percent
Tariff change
July 2021 Origin region3
Destination region3
rate/car metric ton bushel2
Y/Y4
Unit train
Wheat Wichita, KS St. Louis, MO $3,695 $116 $37.85 $1.03 5
Grand Forks, ND Duluth-Superior, MN $4,208 $0 $41.79 $1.14 -3
Wichita, KS Los Angeles, CA $7,115 $0 $70.66 $1.92 -2
Wichita, KS New Orleans, LA $4,525 $205 $46.97 $1.28 3
Sioux Falls, SD Galveston-Houston, TX $6,851 $0 $68.03 $1.85 -2
Grand Forks, ND Portland, OR $5,676 $0 $56.37 $1.53 -2
Grand Forks, ND Galveston-Houston, TX $5,996 $0 $59.54 $1.62 -2
Colby, KS Portland, OR $6,012 $368 $63.35 $1.72 4
Corn Minneapolis, MN Portland, OR $5,180 $0 $51.44 $1.31 0
Sioux Falls, SD Tacoma, WA $5,140 $0 $51.04 $1.30 0
Champaign-Urbana, IL New Orleans, LA $3,820 $231 $40.23 $1.02 4
Lincoln, NE Galveston-Houston, TX $3,880 $0 $38.53 $0.98 0
Des Moines, IA Amarillo, TX $4,320 $181 $44.70 $1.14 5
Minneapolis, MN Tacoma, WA $5,180 $0 $51.44 $1.31 0
Council Bluffs, IA Stockton, CA $5,100 $0 $50.65 $1.29 2
Soybeans Sioux Falls, SD Tacoma, WA $5,850 $0 $58.09 $1.58 0
Minneapolis, MN Portland, OR $5,900 $0 $58.59 $1.59 0
Fargo, ND Tacoma, WA $5,750 $0 $57.10 $1.55 0
Council Bluffs, IA New Orleans, LA $4,875 $267 $51.06 $1.39 4
Toledo, OH Huntsville, AL $4,945 $0 $49.11 $1.34 3
Grand Island, NE Portland, OR $5,260 $377 $55.97 $1.52 51A unit train refers to shipments of at least 25 cars. Shuttle train rates are generally available for qualified shipments of
75-120 cars that meet railroad efficiency requirements.
2Approximate load per car = 111 short tons (100.7 metric tons): corn 56 pounds per bushel (lbs/bu), wheat and soybeans 60 lbs/bu.
3Regional economic areas are defined by the Bureau of Economic Analysis (BEA).
4Percentage change year over year (Y/Y) calculated using tariff rate plus fuel surcharge.
Source: BNSF Railway, Canadian National Railway, CSX Transportation, and Union Pacific Railroad.
Tariff plus surcharge per:Fuel
surcharge
per car
July 29, 2021
Grain Transportation Report 9
Table 8
Tariff rail rates for U.S. bulk grain shipments to MexicoDate: Percent
change4
Commodity Destination region per car1
per car2
metric ton3
bushel3
Y/Y
Wheat MT Chihuahua, CI $7,384 $0 $75.45 $2.05 -2
OK Cuautitlan, EM $6,813 $160 $71.25 $1.94 2
KS Guadalajara, JA $7,531 $703 $84.13 $2.29 4
TX Salinas Victoria, NL $4,347 $97 $45.41 $1.23 2
Corn IA Guadalajara, JA $8,902 $604 $97.13 $2.46 3
SD Celaya, GJ $8,140 $0 $83.17 $2.11 0
NE Queretaro, QA $8,300 $330 $88.18 $2.24 3
SD Salinas Victoria, NL $6,905 $0 $70.55 $1.79 0
MO Tlalnepantla, EM $7,665 $322 $81.61 $2.07 3
SD Torreon, CU $7,690 $0 $78.57 $1.99 0
Soybeans MO Bojay (Tula), HG $8,547 $567 $93.12 $2.53 3
NE Guadalajara, JA $9,157 $593 $99.61 $2.71 3
IA El Castillo, JA $9,410 $0 $96.15 $2.61 -1
KS Torreon, CU $8,014 $411 $86.08 $2.34 3
Sorghum NE Celaya, GJ $7,772 $535 $84.88 $2.15 3
KS Queretaro, QA $8,108 $200 $84.88 $2.15 2
NE Salinas Victoria, NL $6,713 $161 $70.23 $1.78 2
NE Torreon, CU $7,092 $376 $76.31 $1.94 31Rates are based upon published tariff rates for high-capacity shuttle trains. Shuttle trains are available for qualified
shipments of 75-110 cars that meet railroad efficiency requirements.2Fuel surcharge adjusted to reflect the change in Ferrocarril Mexicano, S.A. de C.V railroad fuel surcharge policy as of 10/01/2009.
3Approximate load per car = 97.87 metric tons: Corn & Sorghum 56 lbs/bu, Wheat & Soybeans 60 lbs/bu.
4Percentage change calculated using tariff rate plus fuel surchage; Y/Y = year over year.
Sources: BNSF Railway, Union Pacific Railroad, Kansas City Southern.
Origin
state
July 2021 Tariff rate plus
fuel surcharge per:Tariff rate
Fuel
surcharge
Figure 7
Railroad fuel surcharges, North American weighted average1
$0.00
$0.05
$0.10
$0.15
$0.20
$0.25
$0.30
Dolla
rs p
er
railc
ar
mile
3-year monthly average
Fuel surcharge* ($/mile/railcar)
July 2021: $0.17/mile, up 1 cent from last month's surcharge of $0.16/mile; up 16 cents from the July 2020 surcharge of $0.01/mile; and up 5 cents from the July prior 3-year average of $0.12/mile.
1 Weighted by each Class I railroad's proportion of grain traffic for the prior year.
* Beginning January 2009, the Canadian Pacific fuel surcharge is computed by a monthly average of the bi-weekly fuel surcharge.
**CSX strike price changed from $2.00/gal. to $3.75/gal. starting January 1, 2015.
Sources: BNSF Railway, Canadian National Railway, CSX Transportation, Canadian Pacific Railway, Union Pacific Railroad, Kansas City
Southern Railway, Norfolk Southern Corporation.
July 29, 2021
Grain Transportation Report 10
Barge Transportation
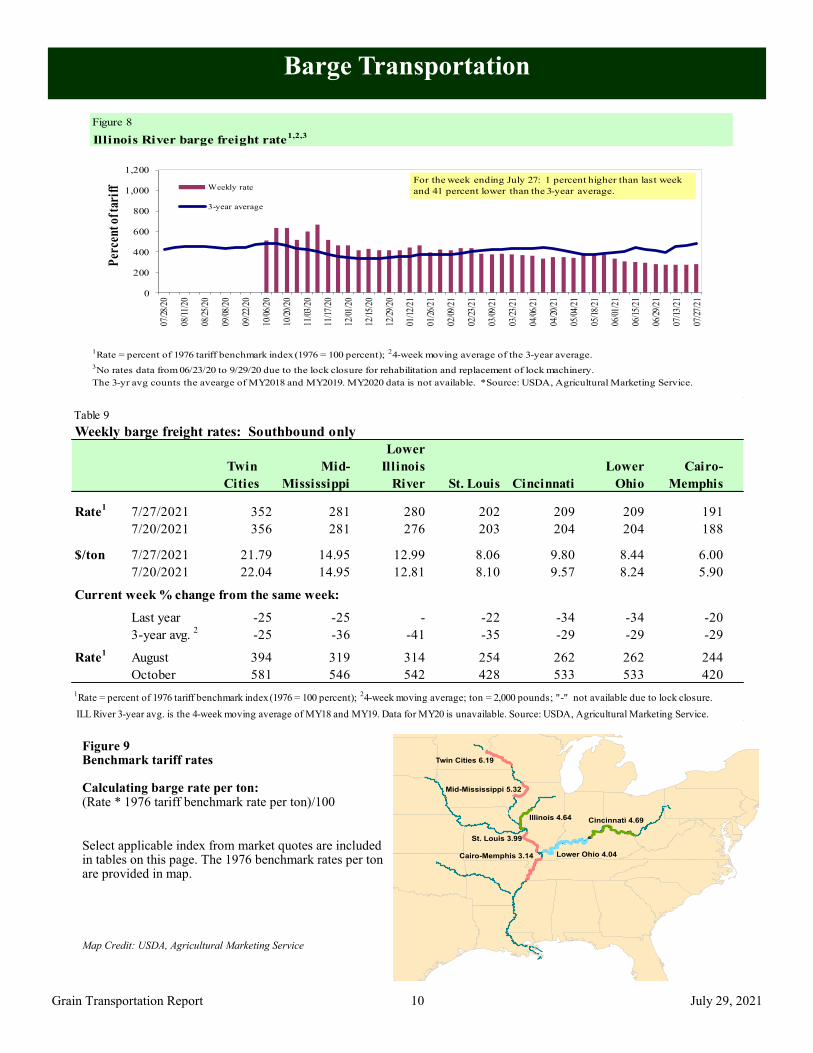
Figure 9 Benchmark tariff rates Calculating barge rate per ton: (Rate * 1976 tariff benchmark rate per ton)/100
Select applicable index from market quotes are included in tables on this page. The 1976 benchmark rates per ton are provided in map.
Map Credit: USDA, Agricultural Marketing Service
Twin Cities 6.19
Mid-Mississippi 5.32
St. Louis 3.99
Cairo-Memphis 3.14
Illinois 4.64 Cincinnati 4.69
Lower Ohio 4.04
Figure 8
Illinois River barge freight rate1,2,3
1Rate = percent of 1976 tariff benchmark index (1976 = 100 percent);
24-week moving average of the 3-year average.
3No rates data from 06/23/20 to 9/29/20 due to the lock closure for rehabilitation and replacement of lock machinery.
The 3-yr avg counts the avearge of MY2018 and MY2019. MY2020 data is not available. *Source: USDA, Agricultural Marketing Service.
0
200
400
600
800
1,000
1,20007
/28/
20
08/1
1/20
08/2
5/20
09/0
8/20
09/2
2/20
10/0
6/20
10/2
0/20
11/0
3/20
11/1
7/20
12/0
1/20
12/1
5/20
12/2
9/20
01/1
2/21
01/2
6/21
02/0
9/21
02/2
3/21
03/0
9/21
03/2
3/21
04/0
6/21
04/2
0/21
05/0
4/21
05/1
8/21
06/0
1/21
06/1
5/21
06/2
9/21
07/1
3/21
07/2
7/21
Per
cen
t of t
arif
f Weekly rate
3-year average
For the week ending July 27: 1 percent higher than last week
Source: U.S. Department of Energy, Energy Information Administration, Retail On-Highway Diesel Prices.
$3.342$2.427
$2.000
$2.100
$2.200
$2.300
$2.400
$2.500
$2.600
$2.700
$2.800
$2.900
$3.000
$3.100
$3.200
$3.300
$3.400
$3.500
1/25
/202
1
2/1/
2021
2/8/
2021
2/15
/202
1
2/22
/202
1
3/1/
2021
3/8/
2021
3/15
/202
1
3/22
/202
1
3/29
/202
1
4/5/
2021
4/12
/202
1
4/19
/202
1
4/26
/202
1
5/3/
2021
5/10
/202
1
5/17
/202
1
5/24
/202
1
5/31
/202
1
6/7/
2021
6/14
/202
1
6/21
/202
1
6/28
/202
1
7/5/
2021
7/12
/202
1
7/19
/202
1
7/26
/202
1
$ pe
r ga
llon
Last year Current yearFor the week ending July 26, the U.S. average diesel fuel price decreased 0.2 cents from the previous week to $3.342 per gallon, 91.5 cents above the same week last year.
July 29, 2021
Grain Transportation Report 14
Grain Exports
Table 13
Top 5 importers1 of U.S. corn
For the week ending 07/15/2021 Total commitments2 % change
Exports3
2021/22 2020/21 2019/20 current MY 3-yr. avg.
next MY current MY last MY from last MY 2017-19 - 1,000 mt -
Mexico 2,053 15,086 14,368 5 14,869
Japan 882 10,916 9,802 11 11,221
Columbia 5 3,893 4,539 (14) 4,830
Korea 65 3,527 2,566 37 4,011
China 10,744 23,101 2,133 983 909
Top 5 importers 13,749 56,523 33,408 69 35,840
Total U.S. corn export sales 16,127 69,771 43,710 60 49,983
% of projected exports 25% 96% 97%
Change from prior week2
48 (89) 221
Top 5 importers' share of U.S. corn
export sales 85% 81% 76% 72%
USDA forecast July 2021 63,613 72,519 45,216 60
Corn use for ethanol USDA forecast,
July 2021 132,080 128,270 123,368 41Based on USDA, Foreign Agricultural Service (FAS) marketing year ranking reports for 2019/20; marketing year (MY) = Sep 1 - Aug 31.
3FAS marketing year ranking reports (carryover plus accumulated export); yr. = year; avg. = average.
2Cumulative exports (shipped) + outstanding sales (unshipped), FAS weekly export sales report, or export sales query. Total commitments change (net sales) from prior week could include
revisions from previous week's outstanding sales or accumulated sales.
Note: A red number in parentheses indicates a negative number; mt = metric ton.
Source: USDA, Foreign Agricultural Service.
Table 12
U.S. export balances and cumulative exports (1,000 metric tons)
Total 2018/19 8,591 3,204 6,776 5,164 479 24,214 48,924 46,189 119,3271 Current unshipped (outstanding) export sales to date.
2 Shipped export sales to date; 2021/22 marketing year now in effect for wheat while corn and soybeans remain in effect for the 2020/21 marketing year.
Note: marketing year: wheat = 6/01-5/31, corn and soybeans = 9/01-8/31. YTD = year-to-date; wks. = weeks; HRW= hard red winter; SRW = soft red winter;
HRS= hard red spring; SWW= soft white wheat; DUR= durum.
Source: USDA, Foreign Agricultural Service.
July 29, 2021
Grain Transportation Report 15
Table 14
Top 5 importers1 of U.S. soybeans
For the week ending 07/15/2021 Total commitments2 % change
Exports3
2021/22 2020/21 2019/20 current MY 3-yr. avg.
next MY current MY last MY from last MY 2017-191,000 mt - - 1,000 mt -
China 4,136 35,826 16,441 118 19,106
Mexico 879 4,798 4,713 2 4,591
Egypt 0 2,777 3,603 (23) 2,980
Indonesia 10 2,318 2,166 7 2,360
Japan 170 2,411 2,397 1 2,288
Top 5 importers 5,195 48,131 29,319 64 31,324
Total U.S. soybean export sales 9,865 61,988 46,395 34 49,352
% of projected exports 17% 100% 101%
change from prior week2
176 62 307
Top 5 importers' share of U.S.
soybean export sales 53% 78% 63% 63%
USDA forecast, July 2021 56,540 61,853 45,749 1351Based on USDA, Foreign Agricultural Service (FAS) marketing year ranking reports for 2019/20; marketing year (MY) = Sep 1 - Aug 31.
Source: USDA, Foreign Agricultural Service.
3FAS marketing year ranking reports (carryover plus accumulated export); yr. = year; avg. = average.
2Cumulative exports (shipped) + outstanding sales (unshipped), FAS weekly export sales report, or export sales query. The total commitments change (net sales) from prior
week could include revisions from previous week's outstanding sales and/or accumulated sales.
Note: A red number in parentheses indicates a negative number; mt = metric ton.
Table 15
Top 10 importers1 of all U.S. wheat
For the week ending 07/15/2021 Total Commitments2 % change
Exports3
2021/22 2020/21 current MY 3-yr. avg.
current MY last MY from last MY 2018-20
1,000 mt - - 1,000 mt -
Mexico 1,271 889 43 3,388
Philippines 1,204 1,212 (1) 3,121
Japan 813 885 (8) 2,567
Korea 451 573 (21) 1,501
Nigeria 560 437 28 1,490
China 483 1,012 (52) 1,268
Taiwan 239 359 (33) 1,187
Indonesia 2 269 (99) 1,131
Thailand 124 199 (38) 768
Italy 54 283 (81) 681
Top 10 importers 5,201 6,118 (15) 17,102
Total U.S. wheat export sales 7,589 8,841 (14) 24,617
% of projected exports 32% 33%
change from prior week2
473 587
Top 10 importers' share of
U.S. wheat export sales 69% 69% 69%
USDA forecast, July 2021 23,842 27,030 (12)1 Based on USDA, Foreign Agricultural Service( FAS) marketing year ranking reports for 2020/21; Marketing year (MY) = Jun 1 - May 31.
Source: USDA, Foreign Agricultural Service.
3 FAS marketing year final reports (carryover plus accumulated export); yr. = year; avg. = average.
2 Cumulative exports (shipped) + outstanding sales (unshipped), FAS weekly export sales report, or export sales query. The total commitments change (net sales) from prior
week could include revisions from the previous week's outstanding and/or accumulated sales.
Note: A red number in parentheses indicates a negative number.
July 29, 2021
Grain Transportation Report 16
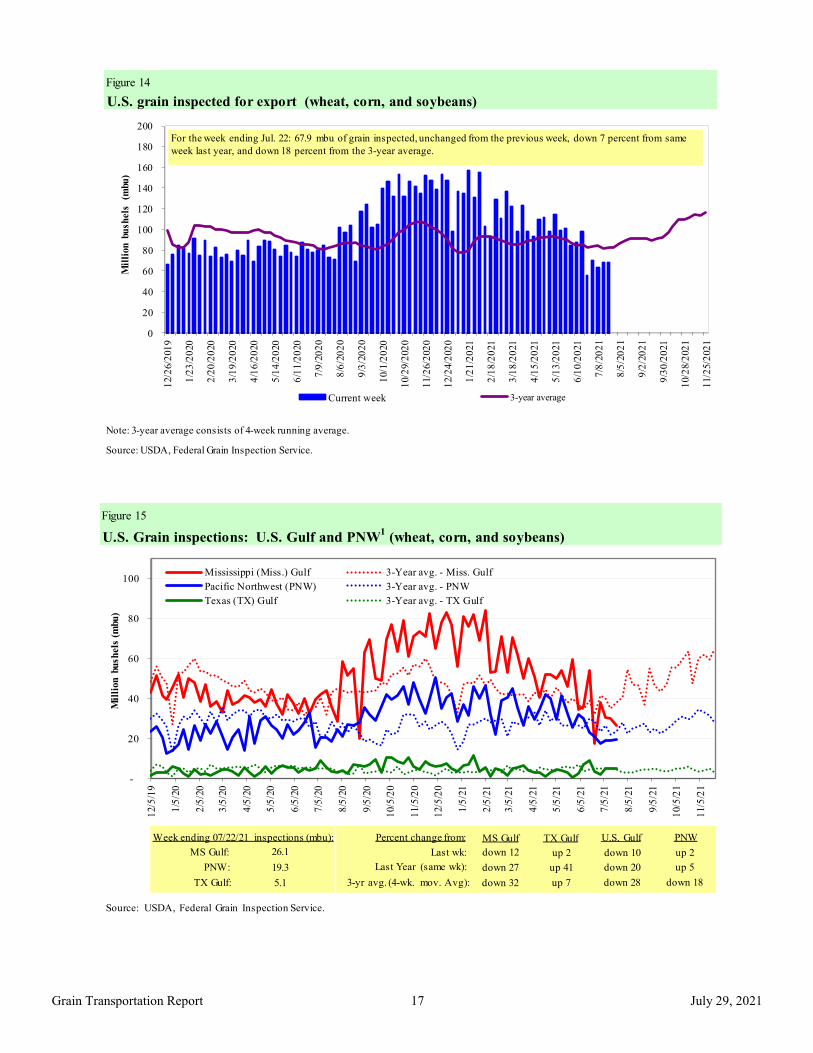
The United States exports approximately one-quarter of the grain it produces. On average, this includes nearly 45 percent of U.S.-grown wheat, 50 percent of U.S.-grown soybeans, and 20 percent of the U.S.-grown corn. Approximately 55 percent of the U.S. export grain shipments departed through the U.S. Gulf region in 2019.
Table 16
Grain inspections for export by U.S. port region (1,000 metric tons)
For the week ending Previous Current week 2021 YTD as
07/22/21 week* as % of previous 2020 YTD* % of 2020 YTD Last year Prior 3-yr. avg.
region region types date (metric tons) (US$/metric ton)
U.S. Gulf Japan Heavy grain Oct 1/10 48,000 70.10
U.S. Gulf Japan Heavy grain Aug 21/Sep 9 50,000 60.90
U.S. Gulf Japan Heavy grain Aug 1/10 50,000 69.75
U.S. Gulf Japan Heavy grain Jul 1/15 50,000 64.10
U.S. Gulf Japan Grain May 25/Jun 25 50,000 46.85 op 47.85
U.S. Gulf Japan Heavy grain Apr 15/May 15 50,000 47.00
U.S. Gulf Sudan Wheat Sep 1/10 49,000 79.12*
U.S. Gulf Djibouti Wheat Jul 6/16 5,880 85.70*
PNW Japan Wheat Sep 1 52,170 56.55*
PNW Japan Wheat Jul 25/ Aug 5 32,590 64.00
PNW Japan Wheat Jul 16/31 30,250 64.35
PNW Japan Wheat Jun 5/15 50,600 49.30
PNW Yemen Wheat Jun 10/20 22,230 132.25*
PNW Taiwan Heavy grain Aug 20/30 35,000 64.20*
PNW Taiwan Wheat Aug 1/10 55,000 54.95
PNW Taiwan Wheat May 29/Jun 12 45,665 48.00 *50 percent of food aid from the United States is required to be shipped on U.S.-flag vessels.
op = option.
Source: Maritime Research, Inc.
Note: Rates shown are per metric ton (2,204.62 lbs. = 1 metric ton), free on board (F.O.B), except where otherwise indicated;
July 29, 2021
Grain Transportation Report 20
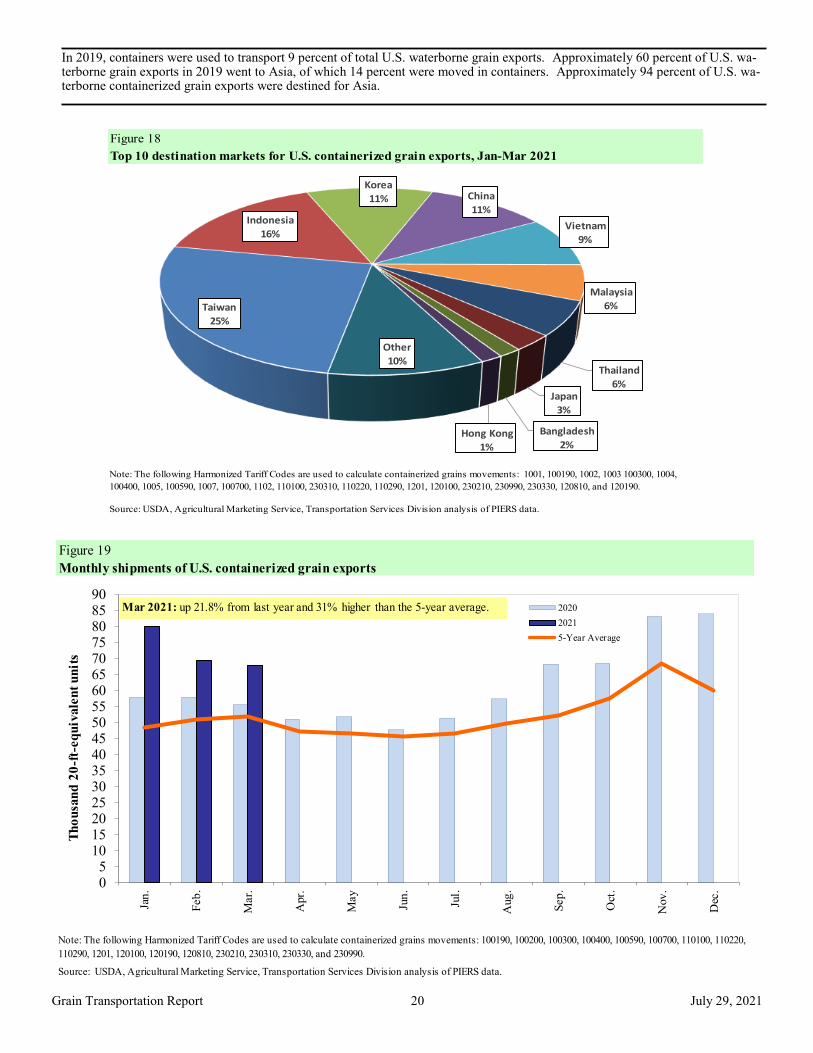
In 2019, containers were used to transport 9 percent of total U.S. waterborne grain exports. Approximately 60 percent of U.S. wa-terborne grain exports in 2019 went to Asia, of which 14 percent were moved in containers. Approximately 94 percent of U.S. wa-terborne containerized grain exports were destined for Asia.
Figure 18
Top 10 destination markets for U.S. containerized grain exports, Jan-Mar 2021
Note: The following Harmonized Tariff Codes are used to calculate containerized grains movements: 100190, 100200, 100300, 100400, 100590, 100700, 110100, 110220,
110290, 1201, 120100, 120190, 120810, 230210, 230310, 230330, and 230990.
05
1015202530354045505560657075808590
Jan
.
Feb
.
Mar.
Apr.
May
Jun
.
Jul.
Aug
.
Sep
.
Oct
.
Nov
.
Dec
.
Th
ou
san
d 2
0-f
t-eq
uiv
ale
nt
un
its
2020
2021
5-Year Average
Mar 2021: up 21.8% from last year and 31% higher than the 5-year average.
Grain Exports Johnny Hill [email protected] (202) 690 - 3295 Kranti Mulik [email protected] (202) 756 - 2577 Ocean Transportation Surajudeen (Deen) Olowolayemo [email protected] (202) 720 - 0119 (Freight rates and vessels) April Taylor [email protected] (202) 720 - 7880 (Container movements)
Editor Maria Williams [email protected] (202) 690-4430 Subscription Information: Please sign up to receive regular email announcements of the latest GTR issue by entering your email address here and selecting your preference to receive Transportation Research and Analysis. For any other infor-mation, you may contact us at [email protected]
Preferred citation: U.S. Department of Agriculture, Agricultural Marketing Service. Grain Transportation Report. July 29, 2021. Web: http://dx.doi.org/10.9752/TS056.07-29-2021
Contacts and Links
In accordance with Federal civil rights law and U.S. Department of Agriculture (USDA) civil rights regulations and policies, the USDA, its Agencies, offices, and employees, and institutions participating in or administering USDA programs are prohibited from discriminating based on race, color, national origin, religion, sex, gender identity (including gender expression), sexual orientation, disability, age, marital status, family/parental status, income derived from a public assistance program, political beliefs, or reprisal or retaliation for prior civil rights activity, in any program or activity conducted or funded by USDA (not all bases apply to all programs). Remedies and complaint filing deadlines vary by pro-gram or incident. Persons with disabilities who require alternative means of communication for program information (e.g., Braille, large print, audiotape, American Sign Language, etc.) should contact the responsible Agency or USDA's TARGET Center at (202) 720-2600 (voice and TTY) or contact USDA through the Federal Relay Service at (800) 877-8339. Additionally, program information may be made available in languages other than English. To file a program discrimination complaint, complete the USDA Program Discrimination Complaint Form, AD-3027, found online at How to File a Program Discrimination Complaint and at any USDA office or write a letter addressed to USDA and provide in the letter all of the infor-mation requested in the form. To request a copy of the complaint form, call (866) 632-9992. Submit your completed form or letter to USDA by: (1) mail: U.S. Department of Agriculture, Office of the Assistant Secretary for Civil Rights, 1400 Independence Avenue, SW, Washington, D.C.