21
SAF Tehnika Interim Report for 6 months of financial year 2010/11 (July 1, 2010 – December 31, 2010) 1

SAF Tehnika Interim Report for 6 months of financial year 2010/11 (July 1, 2010 – December 31, 2010)
1

TABLE OF CONTENTS KEY DATA…………………………………………………………………….. 3 Share and Shareholdings……………………………………………………… 4 Information on management board and supervisory council members…… 6 Statement of Board’s Responsibility…………...…………...………………... 8 Management Report…………………………………………………………... 9 Balance Sheet…………………………………………………........................... 13 Income Statement for 6 months of the financial year 2010/11……………... 14 Income Statement for Q2 of the financial year 2010/11………...…………... 14 Cash Flow Statement………………………………………….......................... 15 Statement of Changes in Equity……………………………………………… 15 Notes for Interim Report……………………………………………………… 16 Note 1 Short-term investments………………..………………………………... 16 Note 2 Customer receivables…..……………..………………………………… 16 Note 3 Loans ……………………………..…………………………………….. 16 Note 4 Inventories…………….…...…………...…………………….…………. 16 Note 5 Shares in Companies…..…………….………………………………….. 17 Note 6 Non-current physical assets …..……………...…………………………. 17 Note 7 Accounts payable..………………..…………………………………….. 17 Note 8 Tax liabilities …………………………………………………………… 18 Note 9 Salary related accrued expenses ………………………...……………… 18 Note 10 Segment information ..…………...…………………………………..... 18 Note 11 Bad receivables ….………....…………………………………………. 20 Note 12 Salaries, bonuses and social expenses ...……………...…………..…… 21
2
KEY DATA
SAF Tehnika is a telecommunications Equipment Company engaged in the development,
production and distribution of digital microwave radio equipment. SAF Tehnika products
provide wireless backhaul solutions for digital voice and data transmission. The Company offers
three product lines: CFM family - low to medium capacity radio links (PDH; up to 34 Mbps),
CFQ family - high capacity radio links (SDH; up to 155 Mbps), and the new CFIP product line
(super PDH; 366Mbps Lumina FODU (Optical Gigabit Ethernet), 108Mbps FODU (Fast
Ethernet) and 366Mbps PhoeniX Hybrid Split Mount System). The complete product range
offers solutions to mobile network operators, data service providers, and government and private
companies. Since its establishment in 1999, SAF Tehnika competes with such multinational
corporations as Nokia Siemens Networks, Ericsson, Alcatel and NEC.
SAF Tehnika Jsc. is a public joint stock company incorporated under the laws of the
Republic of Latvia. The shares of AS SAF Tehnika are quoted on NASDAQ OMX Riga.
Legal address: Ganibu Dambis 24a
Riga, LV – 1005
Latvia
Commercial Registry Nr.: 40003474109
VAT Registry Nr.: LV40003474109
Beginning of financial year: 01.07.2010
End of financial year: 30.06.2011
Phone: +371 67046840
Fax: + 371 67046809
E-mail: [email protected]
3
Share and Shareholdings SAF Tehnika shareholders (over 5%) as of 12.10.2010
Name Ownership interest (%)
Didzis Liepkalns 17.05%
Maleks S, SIA 10.77%
Andrejs Grišans 10.03%
Skandinavia Enskilda Banken 9.98%
Normunds Bergs 9.74%
Juris Ziema 8.71%
Vents Lācars 6.08%
Swedbank AS Clients account 5.01%
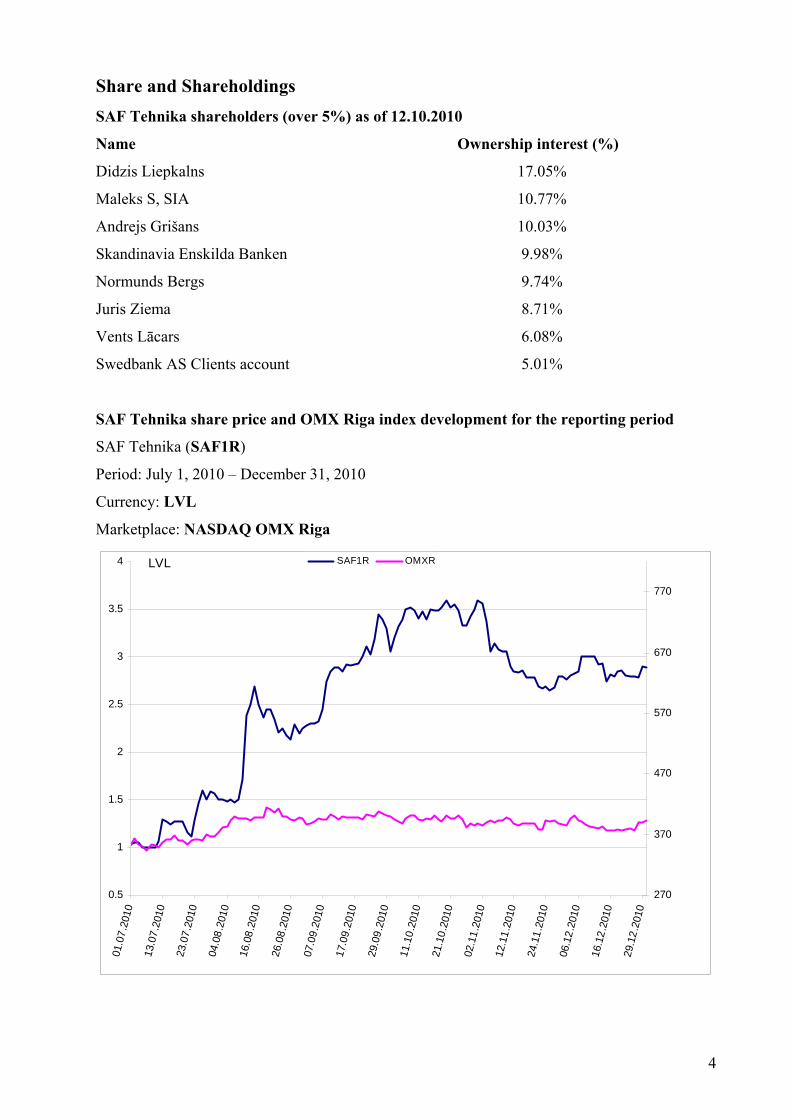
SAF Tehnika share price and OMX Riga index development for the reporting period
SAF Tehnika (SAF1R)
Period: July 1, 2010 – December 31, 2010
Currency: LVL
Marketplace: NASDAQ OMX Riga
0.5
1
1.5
2
2.5
3
3.5
4
01.0
7.20
10
13.0
7.20
10
23.0
7.20
10
04.0
8.20
10
16.0
8.20
10
26.0
8.20
10
07.0
9.20
10
17.0
9.20
10
29.0
9.20
10
11.1
0.20
10
21.1
0.20
10
02.1
1.20
10
12.1
1.20
10
24.1
1.20
10
06.1
2.20
10
16.1
2.20
10
29.1
2.20
10
270
370
470
570
670
770
SAF1R OMXRLVL
4
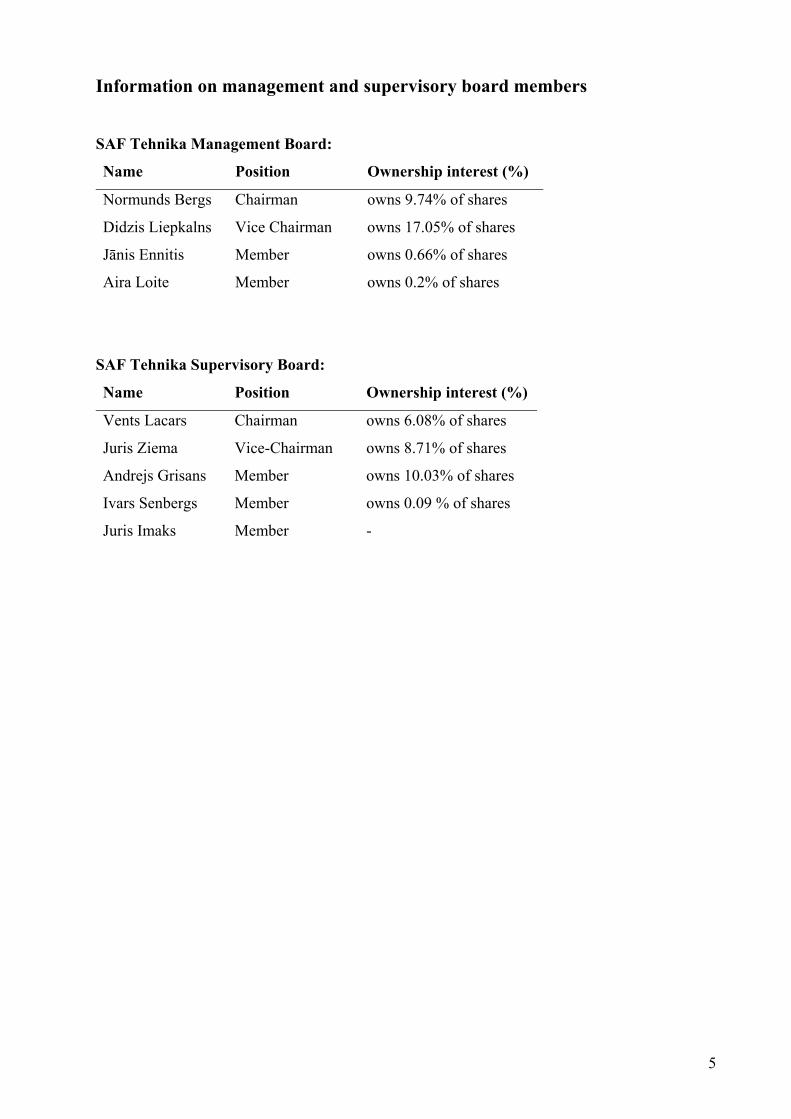
Information on management and supervisory board members
SAF Tehnika Management Board:
Name Position Ownership interest (%)
Normunds Bergs Chairman owns 9.74% of shares
Didzis Liepkalns Vice Chairman owns 17.05% of shares
Jānis Ennitis Member owns 0.66% of shares
Aira Loite Member owns 0.2% of shares
SAF Tehnika Supervisory Board:
Name Position Ownership interest (%)
Vents Lacars Chairman owns 6.08% of shares
Juris Ziema Vice-Chairman owns 8.71% of shares
Andrejs Grisans Member owns 10.03% of shares
Ivars Senbergs Member owns 0.09 % of shares
Juris Imaks Member -
5
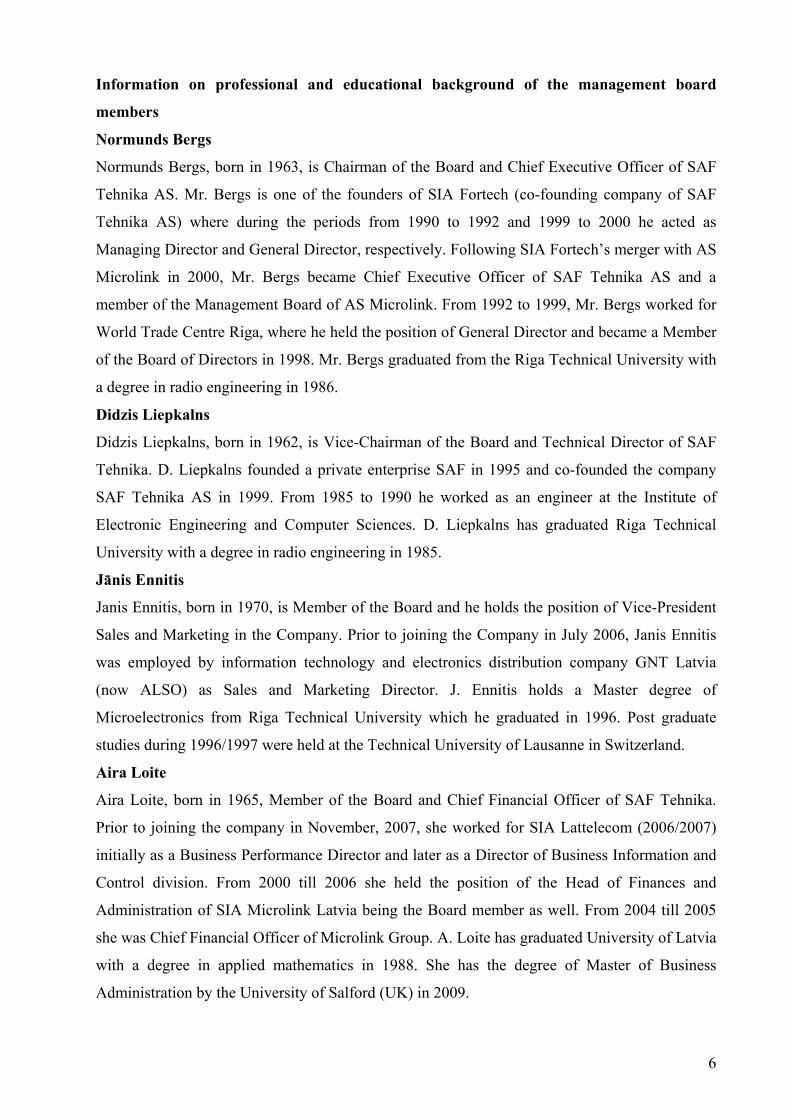
Information on professional and educational background of the management board
members
Normunds Bergs
Normunds Bergs, born in 1963, is Chairman of the Board and Chief Executive Officer of SAF
Tehnika AS. Mr. Bergs is one of the founders of SIA Fortech (co-founding company of SAF
Tehnika AS) where during the periods from 1990 to 1992 and 1999 to 2000 he acted as
Managing Director and General Director, respectively. Following SIA Fortech’s merger with AS
Microlink in 2000, Mr. Bergs became Chief Executive Officer of SAF Tehnika AS and a
member of the Management Board of AS Microlink. From 1992 to 1999, Mr. Bergs worked for
World Trade Centre Riga, where he held the position of General Director and became a Member
of the Board of Directors in 1998. Mr. Bergs graduated from the Riga Technical University with
a degree in radio engineering in 1986.
Didzis Liepkalns
Didzis Liepkalns, born in 1962, is Vice-Chairman of the Board and Technical Director of SAF
Tehnika. D. Liepkalns founded a private enterprise SAF in 1995 and co-founded the company
SAF Tehnika AS in 1999. From 1985 to 1990 he worked as an engineer at the Institute of
Electronic Engineering and Computer Sciences. D. Liepkalns has graduated Riga Technical
University with a degree in radio engineering in 1985.
Jānis Ennitis
Janis Ennitis, born in 1970, is Member of the Board and he holds the position of Vice-President
Sales and Marketing in the Company. Prior to joining the Company in July 2006, Janis Ennitis
was employed by information technology and electronics distribution company GNT Latvia
(now ALSO) as Sales and Marketing Director. J. Ennitis holds a Master degree of
Microelectronics from Riga Technical University which he graduated in 1996. Post graduate
studies during 1996/1997 were held at the Technical University of Lausanne in Switzerland.
Aira Loite
Aira Loite, born in 1965, Member of the Board and Chief Financial Officer of SAF Tehnika.
Prior to joining the company in November, 2007, she worked for SIA Lattelecom (2006/2007)
initially as a Business Performance Director and later as a Director of Business Information and
Control division. From 2000 till 2006 she held the position of the Head of Finances and
Administration of SIA Microlink Latvia being the Board member as well. From 2004 till 2005
she was Chief Financial Officer of Microlink Group. A. Loite has graduated University of Latvia
with a degree in applied mathematics in 1988. She has the degree of Master of Business
Administration by the University of Salford (UK) in 2009.
6

Information on professional and educational background of the supervisory council members Vents Lācars,
born in 1968, is Chairman of the Supervisory Council and Vice-President Business Development of SAF Tehnika. Before co-founding the Company, from 1992 to 1999, he worked in SIA Fortech, where throughout his career he held positions of programmer, leading programmer, and project manager in the networking department and networking department manager. From 1990 to 1992 V. Lacars worked as a programmer at state electric utility company Latvenergo. V. Lacars has studied in Faculty of Physics and Mathematics, University of Latvia. Juris Ziema,
born in 1964, co-founder of the Company, is Vice-Chairman of the Supervisory Council and Production Department Director. From 1998 to 1999 he worked as an engineer at Didzis Liepkalns private enterprise SAF. From 1987 to 1999 J. Ziema worked as an engineer at the Institute of Electronic Engineering and Computer Sciences. J. Ziema has graduated Riga Technical University with a degree in radio engineering in 1987. Andrejs Grišāns
born in 1957, is Member of the Supervisory Council and Production Department Manager. A. Grisans is one of the co-founders of SAF Tehnika. Prior to joining the Company, he owned and managed a private company specializing in electronic equipment engineering, production and distribution. From 1992 to 1999 A. Grisans was involved in entrepreneurial activities in the field of radio engineering. He worked as an engineer-constructor at the Institute of Polymer Mechanics from 1984 to 1992 and in the constructing bureau Orbita from 1980 to 1984. A. Grisans has graduated Riga Technical University with a degree in radio engineering in1980. Ivars Šenbergs,
born in 1962, Member of the Supervisory Council, also Chairman of the Board of SIA Juridiskais Audits, Latnek Ipasumi and SIA Namipasumu parvalde, Member of the Supervisory Council of AS MFS bookkeeping and Member of the Board of SIA Hipno. From 1999 until 2000 he worked as Finance and Administrative Director at SIA Fortech. I. Senbergs has graduated Faculty of Law, University of Latvia. Juris Imaks, born in 1971, worked for VAS „Latvijas Hipotēku un zemes banka" from 1997 up to 2002 as the Head of the Securities trading department. J.Imaks held the office of the Member of the Supervisory Council in the Regulator of public services of the Riga municipality (2005-2007), SIA „Rīgas nami" (2005-2009), AAS „RSK" (2007-2009), but in SIA „Latvijas Garantiju aģentūra" he held the office of the Chairman of the Supervisory Council (2008-2009). J.Imaks has graduated University of Latvia, Faculty of Economics and Management in 1994 as the Engineer-Economist, but in 2004 reached the Master's degree in Business Management.
7

Statement of Board’s Responsibilities The Board of SAF Tehnika Jsc (hereinafter – the Company) is responsible for preparing the
interim financial statements of the Company and its subsidiary. Interim financial statements of
the Company have not been audited or otherwise checked by auditors.
The interim financial statements are prepared in accordance with the source documents and
present fairly the financial position of the Company as at December 31, 2010 and the results of
its operations and cash flows for the 6 month period ended December 31, 2010.
The interim financial statements are prepared in accordance with International Financial
Reporting Standards as adopted by the EU on a going concern basis. Appropriate accounting
policies have been applied on a consistent basis. The interim financial statements have been
prepared based on the same accounting principles applied in the Financial Statements for the
year ended on June 30, 2010. Prudent and reasonable judgments and estimates have been made
by the management in the preparation of the interim financial statements.
The Board of SAF Tehnika is responsible for the maintenance of proper accounting records, the
safeguarding of the Company’s assets and the prevention and detection of fraud and other
irregularities in the Company. The Board is also responsible for the compliance with the laws of
the countries in which the Company operates.
The interim financial statements have been prepared in Latvian Lats and Euro.
Currency Exchange rate for LVL/EUR is 0.702804
_________________________
Aira Loite
CFO, Member of the Management Board
8
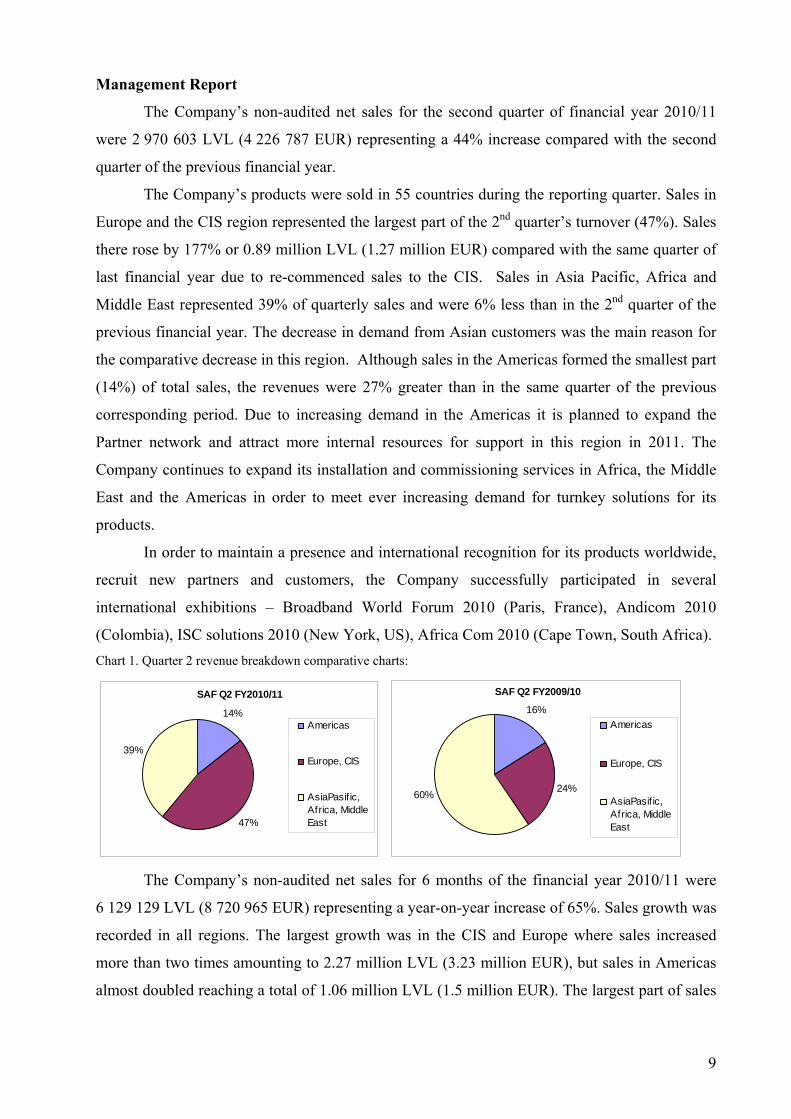
Management Report
The Company’s non-audited net sales for the second quarter of financial year 2010/11
were 2 970 603 LVL (4 226 787 EUR) representing a 44% increase compared with the second
quarter of the previous financial year.
The Company’s products were sold in 55 countries during the reporting quarter. Sales in
Europe and the CIS region represented the largest part of the 2nd quarter’s turnover (47%). Sales
there rose by 177% or 0.89 million LVL (1.27 million EUR) compared with the same quarter of
last financial year due to re-commenced sales to the CIS. Sales in Asia Pacific, Africa and
Middle East represented 39% of quarterly sales and were 6% less than in the 2nd quarter of the
previous financial year. The decrease in demand from Asian customers was the main reason for
the comparative decrease in this region. Although sales in the Americas formed the smallest part
(14%) of total sales, the revenues were 27% greater than in the same quarter of the previous
corresponding period. Due to increasing demand in the Americas it is planned to expand the
Partner network and attract more internal resources for support in this region in 2011. The
Company continues to expand its installation and commissioning services in Africa, the Middle
East and the Americas in order to meet ever increasing demand for turnkey solutions for its
products.
In order to maintain a presence and international recognition for its products worldwide,
recruit new partners and customers, the Company successfully participated in several
international exhibitions – Broadband World Forum 2010 (Paris, France), Andicom 2010
(Colombia), ISC solutions 2010 (New York, US), Africa Com 2010 (Cape Town, South Africa). Chart 1. Quarter 2 revenue breakdown comparative charts:
SAF Q2 FY2010/11
14%
47%
39%
Americas
Europe, CIS
AsiaPasif ic,Africa, MiddleEast
SAF Q2 FY2009/10
16%
24%60%
Americas
Europe, CIS
AsiaPasif ic,Africa, MiddleEast
The Company’s non-audited net sales for 6 months of the financial year 2010/11 were
6 129 129 LVL (8 720 965 EUR) representing a year-on-year increase of 65%. Sales growth was
recorded in all regions. The largest growth was in the CIS and Europe where sales increased
more than two times amounting to 2.27 million LVL (3.23 million EUR), but sales in Americas
almost doubled reaching a total of 1.06 million LVL (1.5 million EUR). The largest part of sales
9

(46%) in 6 months was represented by sales from the Asia Pacific, Africa and Middle East
countries (2.81 million LVL; 3.99 million EUR). Chart 2. 6 months revenue breakdown comparative charts:
SAF 6M FY2010/11
17%
37%
46%
Americas
Europe, CIS
Pacif icAsia,Africa, MiddleEast
SAF 6M FY2009/10
17%
26%57%
Americas
Europe, CIS
Pacif icAsia,Africa, MiddleEast
Ever-increasing demand was seen for CFIP products, which successfully replace CFM
products. CFM and CFIP products formed 74% of 6 month sales. The number of CFQ products
sold in the 2nd quarter was half of that for the second quarter of FY 2009/10 and it is planned that
newly developed CFIP products with their technical parameters will replace orders for CFQ in
the foreseen future. Chart 3. Quarter 2 and 6 months product sales breakdown.
CFM, CFIP and CFQ products sales in Q2 and 6M
0
1 000
2 000
3 000
4 000
5 000
6 000
Q2 2010/11 Q2 2009/10 6M 2010/11 6M 2009/10
Thou
sand
s LV
L
CFQ
CFM+CFIP
The net profit of SAF Tehnika for the second quarter of financial year 2010/11 was 293
827 LVL (418 079 EUR).
The net profit of SAF Tehnika for the 6 months of financial year 2010/11 was 570 427
LVL (811 644 EUR). The result was impacted by recording an allowance for doubtful debtors
amounting to 215 thousand LVL (305 thousand EUR). The main part of the allowance forms
debts from one client who delayed payment (although informing about their liquidity problems).
10

Market overview
2010 ended with the beginning of LTE (Long Term Evolution) technology
implementation in telecommunication networks and growing concerns about WiMax as the
widely accepted and profitable 4G solution. It could be expected that 2011 will be a test year for
LTE as a future technology for telecoms to see if it can achieve worldwide acceptance. As a
consequence there will be further delays for telecom development. The second obstacle towards
a slowdown in telecom developments are profit sharing deals between mobile operators and
large scale equipment vendors. As a result equipment vendors will be not be happy to start
network updates before previous deployment expenses are paid back by network customers.
In the meantime data networks are even hungrier for data bandwidth. Here the market is
driven by new content data operators for individual users via Google, Facebook, Twitter for
commercials – webinars, IP telephony, cloud computing and others. We expect that there is
significant space for new mobile data operators who will satisfy the needs of the rapidly growing
segment of data hungry users now equipped with mobile laptops, smart phones and iPad types of
solutions. The technological platform for newcomers is not unambiguously predictable. It will
have regional differences based on local regulatory restrictions and/or cultural differences.
The conclusion - there will be changes in the wireless mobile market as soon as existing
players are not coping with mobile data customer demands.
Guidance
In such a changing environment we see SAF Tehnika has several advantages ahead of
large-scale dominant competitors. As a middle-sized company it can rapidly change the product
specification based on new customer demands. As a focused manufacturer it could widely
cooperate with other specialized manufacturers to be the first in the market with new solutions
without creating competitive problems, while using its existing extensive partner basis to be
more cost effective in accessing new customers worldwide.
With its existing product line-up SAF Tehnika is able to cover the majority of products
required by the market supporting 4G requirements as well as data broadband specific.
To boost our competitiveness, the Company will continue to focus on efficiency and
quality in all general operations reaching a competitive edge for next level products as well as
extending its product niche in the wireless product spectrum.
The Company’s net cash flow for the 6 month period of the financial year was a negative
-35 840 LVL (-50 996 EUR). The company has deposited 949 355 LVL (1 350 810 EUR)
(deposit period more than 90 days), recorded as a short-term investment in the balance sheet.
11

Besides, the Company paid dividends of LVL 0.23 (twenty three santims) per share or, 683 141
LVL (972 022 EUR) in November 2010. The Company carried a net cash balance (excluding
interest bearing liabilities) of 2 373 449 LVL (3 377 112 EUR) as at December 31, 2010.
On December 31, 2010 the Company employed 159 people. (134 people on December
31, 2009).
12
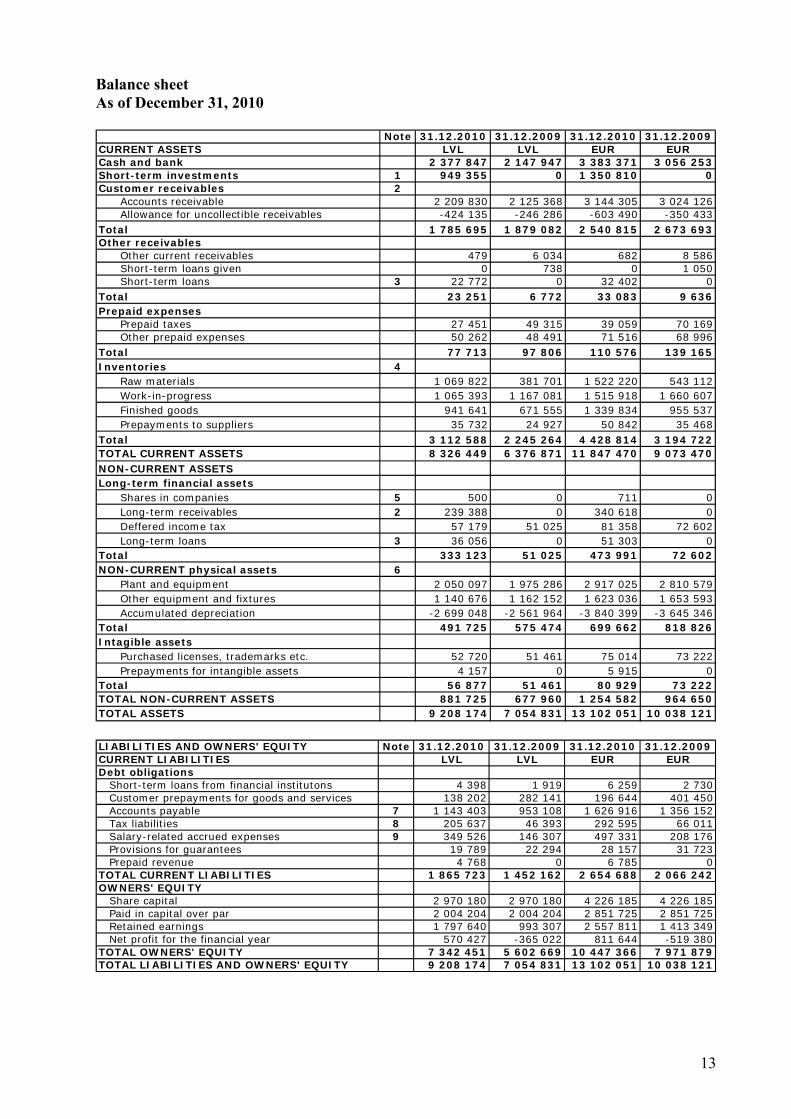
Balance sheet As of December 31, 2010
Note 31.12.2010 31.12.2009 31.12.2010 31.12.2009CURRENT ASSETS LVL LVL EUR EURCash and bank 2 377 847 2 147 947 3 383 371 3 056 253Short-term investments 1 949 355 0 1 350 810 0Customer receivables 2 Accounts receivable 2 209 830 2 125 368 3 144 305 3 024 126 Allowance for uncollectible receivables -424 135 -246 286 -603 490 -350 433Total 1 785 695 1 879 082 2 540 815 2 673 693Other receivables Other current receivables 479 6 034 682 8 586 Short-term loans given 0 738 0 1 050 Short-term loans 3 22 772 0 32 402 0Total 23 251 6 772 33 083 9 636Prepaid expenses Prepaid taxes 27 451 49 315 39 059 70 169 Other prepaid expenses 50 262 48 491 71 516 68 996Total 77 713 97 806 110 576 139 165Inventories 4 Raw materials 1 069 822 381 701 1 522 220 543 112 Work-in-progress 1 065 393 1 167 081 1 515 918 1 660 607 Finished goods 941 641 671 555 1 339 834 955 537 Prepayments to suppliers 35 732 24 927 50 842 35 468Total 3 112 588 2 245 264 4 428 814 3 194 722TOTAL CURRENT ASSETS 8 326 449 6 376 871 11 847 470 9 073 470NON-CURRENT ASSETSLong-term financial assets Shares in companies 5 500 0 711 0 Long-term receivables 2 239 388 0 340 618 0 Deffered income tax 57 179 51 025 81 358 72 602 Long-term loans 3 36 056 0 51 303 0Total 333 123 51 025 473 991 72 602NON-CURRENT physical assets 6 Plant and equipment 2 050 097 1 975 286 2 917 025 2 810 579 Other equipment and fixtures 1 140 676 1 162 152 1 623 036 1 653 593 Accumulated depreciation -2 699 048 -2 561 964 -3 840 399 -3 645 346Total 491 725 575 474 699 662 818 826Intagible assets Purchased licenses, trademarks etc. 52 720 51 461 75 014 73 222 Prepayments for intangible assets 4 157 0 5 915 0Total 56 877 51 461 80 929 73 222TOTAL NON-CURRENT ASSETS 881 725 677 960 1 254 582 964 650TOTAL ASSETS 9 208 174 7 054 831 13 102 051 10 038 121 LIABILITIES AND OWNERS' EQUITY Note 31.12.2010 31.12.2009 31.12.2010 31.12.2009CURRENT LIABILITIES LVL LVL EUR EURDebt obligations Short-term loans from financial institutons 4 398 1 919 6 259 2 730 Customer prepayments for goods and services 138 202 282 141 196 644 401 450 Accounts payable 7 1 143 403 953 108 1 626 916 1 356 152 Tax liabilities 8 205 637 46 393 292 595 66 011 Salary-related accrued expenses 9 349 526 146 307 497 331 208 176 Provisions for guarantees 19 789 22 294 28 157 31 723 Prepaid revenue 4 768 0 6 785 0TOTAL CURRENT LIABILITIES 1 865 723 1 452 162 2 654 688 2 066 242OWNERS' EQUITY Share capital 2 970 180 2 970 180 4 226 185 4 226 185 Paid in capital over par 2 004 204 2 004 204 2 851 725 2 851 725 Retained earnings 1 797 640 993 307 2 557 811 1 413 349 Net profit for the financial year 570 427 -365 022 811 644 -519 380TOTAL OWNERS' EQUITY 7 342 451 5 602 669 10 447 366 7 971 879TOTAL LIABILITIES AND OWNERS' EQUITY 9 208 174 7 054 831 13 102 051 10 038 121
13
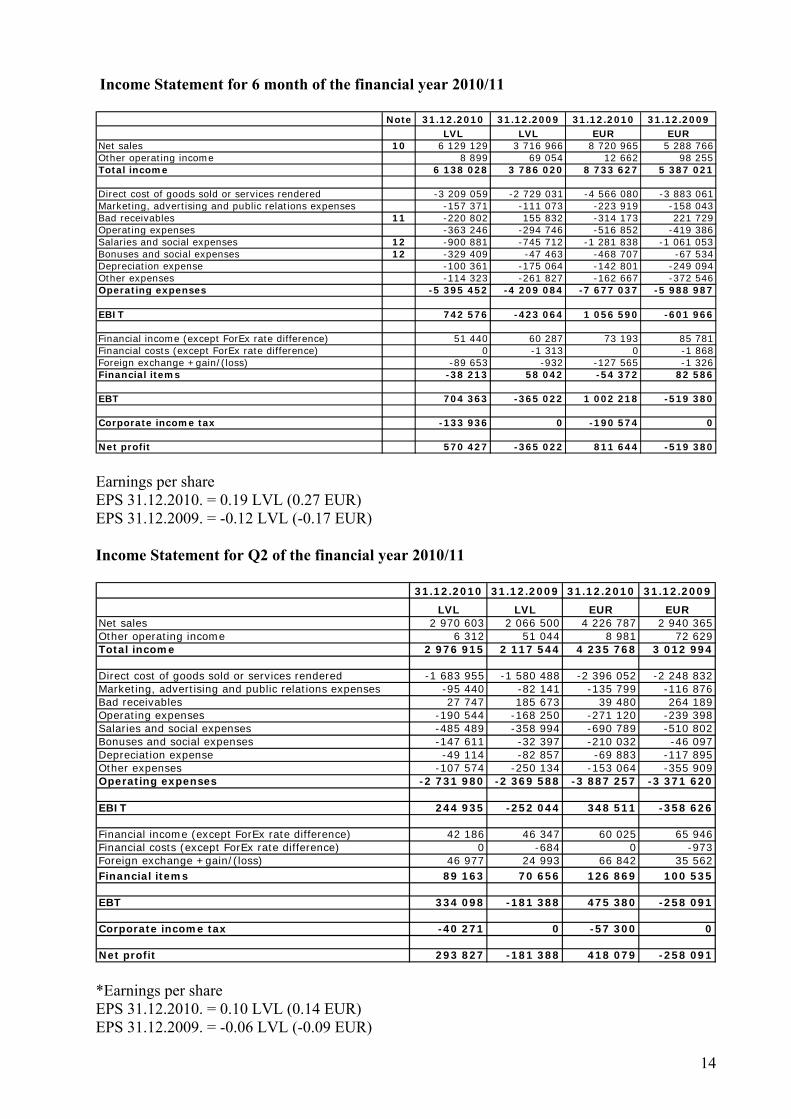
Income Statement for 6 month of the financial year 2010/11
Note 31.12.2010 31.12.2009 31.12.2010 31.12.2009LVL LVL EUR EUR
Net sales 10 6 129 129 3 716 966 8 720 965 5 288 766Other operating income 8 899 69 054 12 662 98 255Total income 6 138 028 3 786 020 8 733 627 5 387 021
Direct cost of goods sold or services rendered -3 209 059 -2 729 031 -4 566 080 -3 883 061Marketing, advertising and public relations expenses -157 371 -111 073 -223 919 -158 043Bad receivables 11 -220 802 155 832 -314 173 221 729Operating expenses -363 246 -294 746 -516 852 -419 386Salaries and social expenses 12 -900 881 -745 712 -1 281 838 -1 061 053Bonuses and social expenses 12 -329 409 -47 463 -468 707 -67 534Depreciation expense -100 361 -175 064 -142 801 -249 094Other expenses -114 323 -261 827 -162 667 -372 546Operating expenses -5 395 452 -4 209 084 -7 677 037 -5 988 987
EBIT 742 576 -423 064 1 056 590 -601 966
Financial income (except ForEx rate difference) 51 440 60 287 73 193 85 781Financial costs (except ForEx rate difference) 0 -1 313 0 -1 868Foreign exchange +gain/(loss) -89 653 -932 -127 565 -1 326Financial items -38 213 58 042 -54 372 82 586
EBT 704 363 -365 022 1 002 218 -519 380
Corporate income tax -133 936 0 -190 574 0
Net profit 570 427 -365 022 811 644 -519 380 Earnings per share EPS 31.12.2010. = 0.19 LVL (0.27 EUR) EPS 31.12.2009. = -0.12 LVL (-0.17 EUR) Income Statement for Q2 of the financial year 2010/11
31.12.2010 31.12.2009 31.12.2010 31.12.2009
LVL LVL EUR EURNet sales 2 970 603 2 066 500 4 226 787 2 940 365Other operating income 6 312 51 044 8 981 72 629Total income 2 976 915 2 117 544 4 235 768 3 012 994
Direct cost of goods sold or services rendered -1 683 955 -1 580 488 -2 396 052 -2 248 832Marketing, advertising and public relations expenses -95 440 -82 141 -135 799 -116 876Bad receivables 27 747 185 673 39 480 264 189Operating expenses -190 544 -168 250 -271 120 -239 398Salaries and social expenses -485 489 -358 994 -690 789 -510 802Bonuses and social expenses -147 611 -32 397 -210 032 -46 097Depreciation expense -49 114 -82 857 -69 883 -117 895Other expenses -107 574 -250 134 -153 064 -355 909Operating expenses -2 731 980 -2 369 588 -3 887 257 -3 371 620
EBIT 244 935 -252 044 348 511 -358 626
Financial income (except ForEx rate difference) 42 186 46 347 60 025 65 946Financial costs (except ForEx rate difference) 0 -684 0 -973Foreign exchange +gain/(loss) 46 977 24 993 66 842 35 562Financial items 89 163 70 656 126 869 100 535
EBT 334 098 -181 388 475 380 -258 091
Corporate income tax -40 271 0 -57 300 0
Net profit 293 827 -181 388 418 079 -258 091 *Earnings per share EPS 31.12.2010. = 0.10 LVL (0.14 EUR) EPS 31.12.2009. = -0.06 LVL (-0.09 EUR)
14

Cash flow statement for 6 months of the financial year 2010/11
31.12.2010 31.12.2009 31.12.2010 31.12.2009LVL LVL EUR EUR
CASH GENERATED FROM OPERATIONS (of which) -103 483 414 896 -147 243 590 344Cash received from customers 5 821 266 3 632 501 8 282 916 5 168 583Cash paid to suppliers and employees -5 926 702 -3 266 462 -8 432 937 -4 647 757Received tax 1 953 48 857 2 779 69 517NET CASH USED IN INVESTING ACTIVITIES (of which) 746 098 30 081 1 061 602 42 801Cash paid for other long-term investments (e.g. purchase of <50% shares) -500 0 -711 0Cash paid/received for short-term investments 710 534 0 1 010 999 0Cash paid for purchasing non-current physical assets -42 717 -34 791 -60 781 -49 503Interest received 78 781 64 872 112 095 92 305NET CASH USED IN FINANCING ACTIVITIES (of which) -678 455 -643 848 -965 354 -916 113Repayment of short-term loans -1 783 23 -2 537 33Repayment of long-term loans 9 490 0 13 503 0Cash paid of long-term loans -68 317 0 -97 206 0Paid interest 0 -1 340 0 -1 907Cash received from EU fonds 65 296 40 610 92 908 57 783Dividends paid -683 141 -683 141 -972 022 -972 022TOTAL CASH FLOW: -35 840 -198 871 -50 996 -282 968Cash and cash equivalents as at the beginning of period 2 413 687 2 346 818 3 434 367 3 339 221Cash and cash equivalents as at the end of period 2 377 847 2 147 947 3 383 371 3 056 253NET INCREASE / DECREASE IN CASH AND CASH EQUIVALENTS -35 840 -198 871 -50 996 -282 968
Share Sharecapital premium
LVL LVL LVL LVL LVL
As at 30 June 2008 2 970 180 2 004 204 - 1 676 448 6 650 832
Dividend relating to 2008/2009 - - - -683 141 -683 141
-683 141 -683 141
Profit for the year - - - 1 487 474 1 487 474
As at 30 June 2009 2 970 180 2 004 204 - 2 480 781 7 455 165
Dividend relating to 2009/2010 - - -
Profit for the period - - - 570 427 570 427
As at 31 December 2010 2 970 180 2 004 204 - 2 368 067 7 342 451
Statement of changes in consolidated equity for the 6 months period ended December 31 2010
Currency translation
reserve
Retained earnings
Total
Share Sharecapital premium
EUR EUR EUR EUR EUR
As at 30 June 2008 4 226 185 2 851 725 - 2 385 371 9 463 281
Dividend relating to 2008/2009 - - - -972 022 -972 022
-972 022 -972 022
Profit for the year - - - 2 116 484 2 116 484
As at 30 June 2009 4 226 185 2 851 725 - 3 529 832 10 607 743
Dividend relating to 2009/2010 - - -
Profit for the period - - - 811 644 811 644
As at 31 December 2010 4 226 185 2 851 725 - 3 369 454 10 447 365
Total
Statement of changes in consolidated equity for the 6 months period ended December 31 2010
Currency translation
reserve
Retained earnings
15
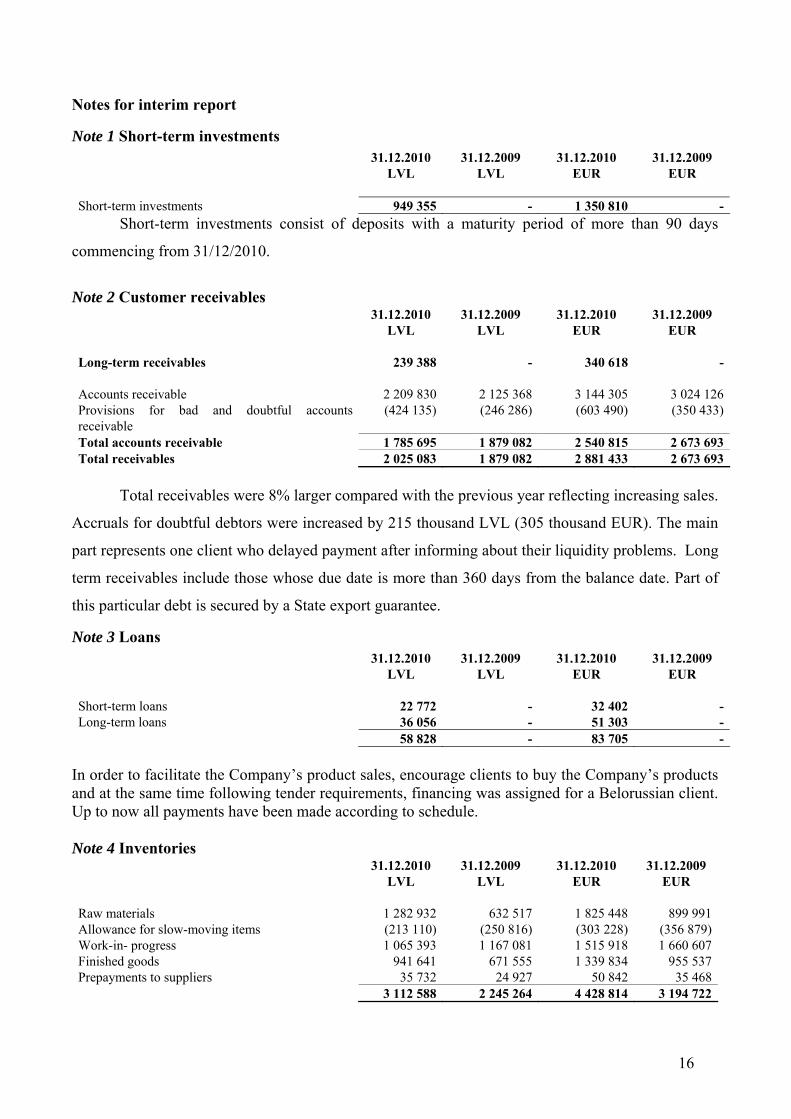
Notes for interim report
Note 1 Short-term investments 31.12.2010 31.12.2009 31.12.2010 31.12.2009 LVL LVL EUR EUR Short-term investments 949 355 - 1 350 810 -
Short-term investments consist of deposits with a maturity period of more than 90 days
commencing from 31/12/2010.
Note 2 Customer receivables 31.12.2010 31.12.2009 31.12.2010 31.12.2009 LVL LVL EUR EUR Long-term receivables 239 388 - 340 618 - Accounts receivable 2 209 830 2 125 368 3 144 305 3 024 126Provisions for bad and doubtful accounts receivable
(424 135) (246 286) (603 490) (350 433)
Total accounts receivable 1 785 695 1 879 082 2 540 815 2 673 693Total receivables 2 025 083 1 879 082 2 881 433 2 673 693
Total receivables were 8% larger compared with the previous year reflecting increasing sales.
Accruals for doubtful debtors were increased by 215 thousand LVL (305 thousand EUR). The main
part represents one client who delayed payment after informing about their liquidity problems. Long
term receivables include those whose due date is more than 360 days from the balance date. Part of
this particular debt is secured by a State export guarantee.
Note 3 Loans 31.12.2010 31.12.2009 31.12.2010 31.12.2009 LVL LVL EUR EUR Short-term loans 22 772 - 32 402 -Long-term loans 36 056 - 51 303 - 58 828 - 83 705 -
In order to facilitate the Company’s product sales, encourage clients to buy the Company’s products and at the same time following tender requirements, financing was assigned for a Belorussian client. Up to now all payments have been made according to schedule. Note 4 Inventories 31.12.2010 31.12.2009 31.12.2010 31.12.2009 LVL LVL EUR EUR Raw materials 1 282 932 632 517 1 825 448 899 991Allowance for slow-moving items (213 110) (250 816) (303 228) (356 879)Work-in- progress 1 065 393 1 167 081 1 515 918 1 660 607Finished goods 941 641 671 555 1 339 834 955 537Prepayments to suppliers 35 732 24 927 50 842 35 468 3 112 588 2 245 264 4 428 814 3 194 722
16

Inventories in comparison with December 31 of the previous financial year 2009/10
increased by 39%. More raw materials were purchased in order to ensure current production
volumes and delivery terms.
Note 5 Shares in Companies 31.12.2010 31.12.2009 31.12.2010 31.12.2009 LVL LVL EUR EUR Shares in companies 500 - 711 -
With the aim to attract EU funds for research and development within the sphere of
electronics and electrical engineering, the Company, together with other members of the Latvian
Electrical Engineering and electronic Industry Association (LETERA), co-founded a limited liability
company “LEO kompetences centrs” (LEO) investing 500 LVL (711 EUR) in its equity capital and
becoming the owner of 10% of its share capital.
Note 6 Non-current physical assets 31.12.2010 31.12.2009 31.12.2010 31.12.2009 LVL LVL EUR EUR Plant and equipment 2 050 097 1 975 286 2 917 025 2 810 579Other equipment and fixtures 1 140 676 1 162 152 1 623 036 1 653 593Accumulated depreciation (2 699 048) (2 561 964) (3 840 399) (3 645 346) 491 725 575 474 699 662 818 826
Decrease of the net book value of non current physical assets, in comparison with the year
before is mainly due to accumulated depreciation. The company has started replacement of its
current IT infrastructure and made investments in order to create new working places for production
and testing purposes.
Note 7 Accounts payable 31.12.2010 31.12.2009 31.12.2010 31.12.2009 LVL LVL EUR EUR Accounts payable 1 143 403 953 108 1 626 916 1 356 152
Accounts payable have risen due to increased purchases for new products, higher production
volumes and larger local marketing services rendered.
17

Note 8 Tax liabilities 31.12.2010 31.12.2009 31.12.2010 31.12.2009 LVL LVL EUR EUR Tax liabilities 205 637 46 393 292 595 66 011
As the Company works with a net profit, accruals for corporate Income Tax payment have been calculated and recorded. Note 9 Salary-related accrued expenses 31.12.2010 31.12.2009 31.12.2010 31.12.2009 LVL LVL EUR EUR Salary-related accrued expenses 349 526 146 307 497 331 208 176
Salary–related accrued expenses increased mainly because of bonuses accrued due to good
financial results and increased headcount.
Note 10 Segment information
a) The Company’s operations may be divided into two major structural units by product lines
– CFM (Hybrid/ PDH radio) and CF IP (Hybrid/ super PDH system) as the first structural unit and
CFQ (SDH) as the second unit. These structural units are used as a basis for providing information
about the primary segments of the Company, i.e. business segments. Production, as well as research
and development are organised and managed for each structural units (CFM, CFIP and CFQ)
separately.
CFM microwave radio product line has been the main type of radio SAF has been
supplying to the market over many years, yet it is still demanded and popular as ever. Such medium
capacity, simple yet extremely reliable and feature rich radio forms the basis of many new
deployments in the areas of rapid development of telecom networks.
CFIP - a new and growing product line is represented by 3 notable models,
- a split mount Phoenix hybrid radio system with Gigabit Ethernet + 20 E1 interfaces;
- Lumina high capacity Full Outdoor all-in-one radio with Gigabit Ethernet traffic interface;
- CFIP-108 entry level radio - perfect for upgrade of E1 networks into packet data networks.
All CFIP radios are offered in most widely used frequency bands from 6 to 38 GHz, thus
enabling the use of CFIP radios all across the globe,
Phoenix radio represents the type of microwave radio which is taking the commanding role
on the market at present,
18

Full Outdoor units of Lumina and 108 modifications are of growing and developing radio
type 'all-in-one' which has biggest potential as part of future data/packet networks.
SAF Tehnika was one of the first companies offering Full Outdoor radios from 2003, thus is
well positioned to use the past experience for development of next generation product.
Even though mentioned CFIP products are set to carry SAF Tehnika's fortunes into the
future, SAF is still offering a popular CFQ radio, still widely used due to an ability to reconfigure the
terminal to provide widest range of interfaces in any SAF system.
This note provides information about division of the Group’s turnover and balance items by
structural units by product type for 6 month of the financial year 2010/11 and financial year 2009/10.
2010/11 2009/10 2010/11 2009/10 2010/11 2009/10 2010/11 2009/10LVL LVL LVL LVL LVL LVL LVL LVL
Segment assets 1 556 516 1 347 404 3 554 308 2 976 837 633 436 490 923 5 744 260 4 815 164Undivided assets 3 463 914 2 239 667Total assets 9 208 174 7 054 831
Segment liabilities 268 267 350 273 942 131 806 991 229 882 195 761 1 440 280 1 353 025Undivided liabilities 425 443 99 137Total liabilities 1 865 723 1 452 162
Net sales 744 343 1 018 135 4 528 691 2 131 261 856 095 567 570 6 129 129 3 716 966Segment results 128 124 270 905 2 063 795 135 118 336 448 152 711 2 528 367 558 734Undivided expenses -1 794 710 -1 050 843Profit from operations 733 657 -492 109Other income 8 911 73 992Financial expenses, net -38 205 53 095Profit before taxes 704 363 -365 022Corporate income tax -133 936 0Net profit 570 427 -365 022
Other information
intangible asets 1 257 0 17 635 5 852 83 0 18 975 5 852Undivided additions 22 988 10 979Total additions of property plant and equipment and intangible asets 41 963 16 831
Depreciation and amortization 5 267 7 947 51 632 108 866 10 10 56 909 116 823Undivided depreciation 43 452 58 241Total depreciation and amortization 100 361 175 064
Other TotalCFQ CFM; CFIP
19

2010/11 2009/10 2010/11 2009/10 2010/11 2009/10 2010/11 2009/10EUR EUR EUR EUR EUR EUR EUR EUR
Segment assets 2 214 723 1 917 183 5 057 325 4 235 657 901 297 698 519 8 173 344 6 851 361Undivided assets 4 928 708 3 186 759Total assets 13 102 051 10 038 121
Segment liabilities 381 710 498 394 1 340 532 1 148 245 327 093 278 543 2 049 334 1 925 181Undivided liabilities 605 350 141 061Total liabilities 2 654 684 2 066 242
Net sales 1 059 105 1 448 676 6 443 747 3 032 511 1 218 113 807 579 8 720 965 5 288 766Segment results 182 304 385 463 2 936 516 192 256 478 722 217 288 3 597 542 795 007Undivided expenses -2 553 641 -1 495 215Profit from operations 1 043 900 -700 208Other income 12 679 105 281Financial expenses, net -54 361 75 547Profit before taxes 1 002 218 -519 380Corporate income tax -190 574 0Net profit 811 644 -519 380
Other information
Additions of property plant and equipment and intangible asets 1 789 0 25 092 8 327 118 0 26 999 8 327Undivided additions 32 709 15 622Total additions of property plant and equipment and intangible asets 59 708 23 949
Depreciation and amortization 7 494 11 308 73 466 154 902 14 14 80 974 166 224Undivided depreciation 61 826 82 868Total depreciation and amortization 142 800 249 092
Other TotalCFQ CFM; CFIP
b) This note provides information about division of the Company’s turnover and assets by
geographical regions (customer location) for 6 month of the financial year 2010/11 and financial
year 2009/10.
2010/11 2009/10 31.12.2010 31.12.2009 2010/11 2009/10 31.12.2010 31.12.2009LVL LVL LVL LVL EUR EUR EUR EUR
America 1 055 065 640 041 218 557 267 087 1 501 223 910 696 310 978 380 031Europe, CIS 2 268 875 978 141 584 107 444 852 3 228 318 1 391 770 831 109 632 968Asia, Africa, Middle East 2 805 189 2 098 784 1 222 419 1 167 143 3 991 424 2 986 300 1 739 346 1 660 696
6 129 129 3 716 966 2 025 083 1 879 082 8 720 965 5 288 766 2 881 433 2 673 693Unallocatted assets - - 7 183 091 5 175 749 - - 10 220 618 7 364 428
6 129 129 3 716 966 9 208 174 7 054 831 8 720 965 5 288 766 13 102 051 10 038 121
Net sales AssetsNet sales Assets
Note 11 Bad receivables 31.12.2010 31.12.2009 31.12.2010 31.12.2009 LVL LVL EUR EUR Bad receivables (220 802) 155 832 (314 173) 221 729
The Company records accruals based on its accrual policy for bad and doubtful debtors. As
information about a client’s liquidity problems were received, the company has posted additional
accruals for doubtful debts amounting to 215 thousand LVL (305 thousand EUR).
20
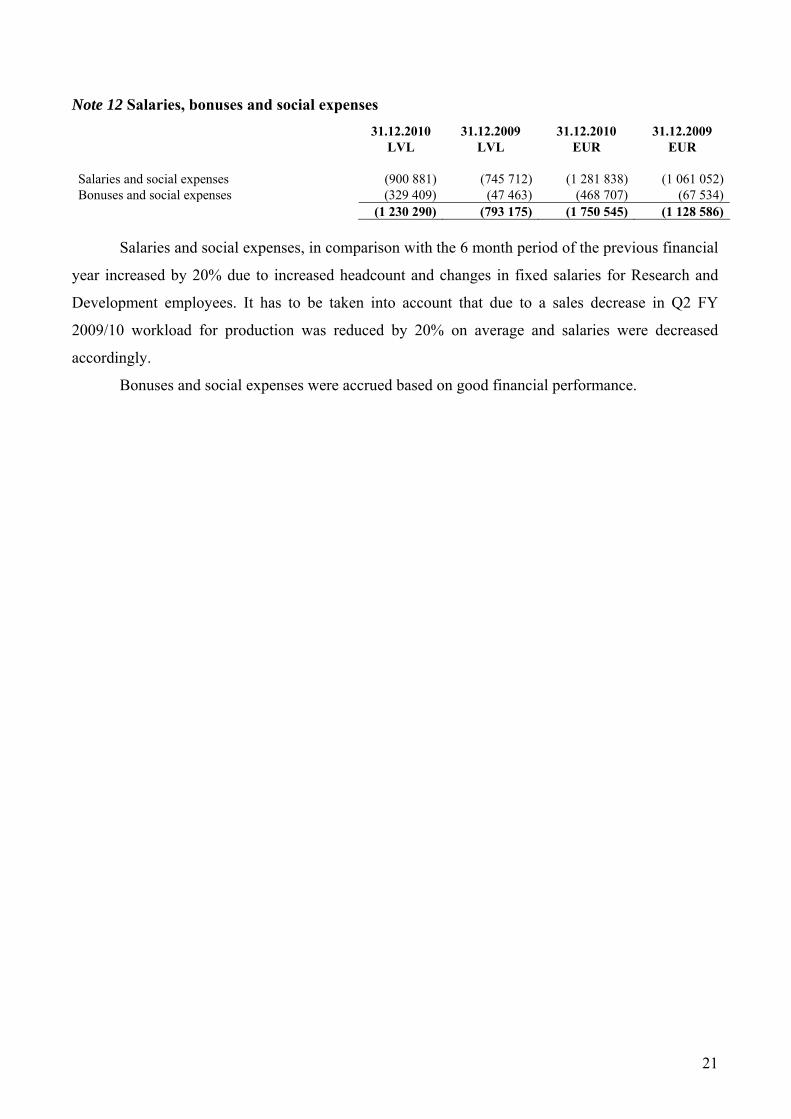
Note 12 Salaries, bonuses and social expenses 31.12.2010 31.12.2009 31.12.2010 31.12.2009 LVL LVL EUR EUR Salaries and social expenses (900 881) (745 712) (1 281 838) (1 061 052)Bonuses and social expenses (329 409) (47 463) (468 707) (67 534) (1 230 290) (793 175) (1 750 545) (1 128 586)
Salaries and social expenses, in comparison with the 6 month period of the previous financial
year increased by 20% due to increased headcount and changes in fixed salaries for Research and
Development employees. It has to be taken into account that due to a sales decrease in Q2 FY
2009/10 workload for production was reduced by 20% on average and salaries were decreased
accordingly.
Bonuses and social expenses were accrued based on good financial performance.
21


