164
Performance Reporter for OS/390 AS/400 System Performance Feature Guide and Reference Release 5 SH19-4019-04

Performance Reporter for OS/390AS/400 System Performance Feature Guideand ReferenceRelease 5 SH19-4019-04


Performance Reporter for OS/390AS/400 System Performance Feature Guideand ReferenceRelease 5

Fifth Edition (August 2000)
This major revision obsoletes and replaces SH19-4019-03. The major changes are described in “Summary of changes”on page xviii. Changes or additions to the text and illustrations are indicated by a vertical line to the left of the change.
This edition applies to Release 5 Modification Level 0 of Tivoli Performance Reporter for OS/390, Program Number5695-101 to all subsequent releases and modifications until otherwise indicated in new editions. Make sure you areusing the correct edition for the level of the product. This product was previously known as Enterprise PerformanceData Manager/MVS (EPDM).
Order publications through your IBM representative or the IBM branch office serving your locality. Publications are notstocked at the address given below.
Tivoli welcomes your comments. Please send your comments to:
Information DevelopmentRome Tivoli LaboratoryIBM Italy S.p.AVia Sciangai, 5300144 RomeItaly
You can also send your comments by fax +39 06 5966 2077 or electronic mail:Internet: [email protected]
When you send information to Tivoli, you grant Tivoli a nonexclusive right to use or distribute the information in anyway it believes appropriate without incurring any obligation to you.
Copyright © 1994, 2000 by IBM Corporation, including this documentation and all software. All rights reserved.May only be used pursuant to a Tivoli Systems Software License Agreement, an IBM Software License Agreement, orAddendum for Tivoli Products to IBM Customer or License Agreement. No part of this publication may be reproduced,transmitted, transcribed, stored in a retrieval system, or translated into any computer language, in any form or by anymeans, electronic, mechanical, magnetic, optical, chemical, manual, or otherwise, without prior written permission ofIBM Corporation. IBM Corporation grants you limited permission to make hardcopy or other reproductions of anymachine-readable documentation for your own use, provided that each such reproduction shall carry the IBMCorporation copyright notice. No other rights under copyright are granted without prior written permission of IBMCorporation. The document is not intended for production and is furnished “as is” without warranty of any kind. Allwarranties on this document are hereby disclaimed including the warranties of merchantability and fitness for aparticular purpose.
Note to U.S. Government Users—Documentation related to restricted rights— Use, duplication or disclosure is subjectto restrictions set forth in GSA ADP Schedule Contract with IBM Corp.
Note
Before using this information and the product it supports, be sure to read the general information under“Notices” on page xi.
ISO 9001 Certification
This product was developed using an ISO 9001 certified quality system.
Certification has been awarded by Bureau Veritas Quality International (BVQI)
(Certification No. BVQI-92053).
BVQI is a world leader in quality certification and is currently recognized by more than 20 accreditation bodies.

Contents
Figures. . . . . . . . . . . . . . . . . . . . . . . . . . . . . . . . . . . . . . . . . . . . . . . . . . . . . . . . . . . . . . . . . . . . . . . ix
Notices. . . . . . . . . . . . . . . . . . . . . . . . . . . . . . . . . . . . . . . . . . . . . . . . . . . . . . . . . . . . . . . . . . . . . . . xi
Programming interfaces. . . . . . . . . . . . . . . . . . . . . . . . . . . . . . . . . . . . . . . . . . . . . . . . . . . xiii
Trademarks and service marks . . . . . . . . . . . . . . . . . . . . . . . . . . . . . . . . . . . . . . . . . . . . xv
About this book . . . . . . . . . . . . . . . . . . . . . . . . . . . . . . . . . . . . . . . . . . . . . . . . . . . . . . . . . . . xviiWho should use this book . . . . . . . . . . . . . . . . . . . . . . . . . . . . . . . . . . . . . . . . . . . . . . . . . . . . . . . xvii
What you need to know to understand this book . . . . . . . . . . . . . . . . . . . . . . . . . . . . . . . . . . . . . . xvii
How to use this book . . . . . . . . . . . . . . . . . . . . . . . . . . . . . . . . . . . . . . . . . . . . . . . . . . . . . . . . . . xviii
Summary of changes . . . . . . . . . . . . . . . . . . . . . . . . . . . . . . . . . . . . . . . . . . . . . . . . . . . . . . . . . . xviii
Changes for this edition . . . . . . . . . . . . . . . . . . . . . . . . . . . . . . . . . . . . . . . . . . . . . . . . . . . . xviii
Changes for the previous edition. . . . . . . . . . . . . . . . . . . . . . . . . . . . . . . . . . . . . . . . . . . . . . xviii
Contacting customer support. . . . . . . . . . . . . . . . . . . . . . . . . . . . . . . . . . . . . . . . . . . . . . . . . . . . . xviii
Where to find more information . . . . . . . . . . . . . . . . . . . . . . . . . . . . . . . . . . . . . . . . . . . . . . . . . . . xix
Performance Reporter library . . . . . . . . . . . . . . . . . . . . . . . . . . . . . . . . . . . . . . . . . . . . . . . . . xix
Part I. Guide . . . . . . . . . . . . . . . . . . . . . . . . . . . . . . . . . . . . . . . . . . . . . . . . . . . . . . . . . . . . . . . 1
Chapter 1. Introducing the SP400 feature . . . . . . . . . . . . . . . . . . . . . . . . . . . . . . . . . . 3Collecting performance data . . . . . . . . . . . . . . . . . . . . . . . . . . . . . . . . . . . . . . . . . . . . . . . . . . . . . . . 3
Chapter 2. Implementing the SP400 feature. . . . . . . . . . . . . . . . . . . . . . . . . . . . . . . . 5Planning the implementation process . . . . . . . . . . . . . . . . . . . . . . . . . . . . . . . . . . . . . . . . . . . . . . . . . 5
Considering which components to install . . . . . . . . . . . . . . . . . . . . . . . . . . . . . . . . . . . . . . . . . . . . . . 6
Installing SP400 feature on AS/400 . . . . . . . . . . . . . . . . . . . . . . . . . . . . . . . . . . . . . . . . . . . . . . . . . . 7
Step 1: Check AS/400 requirements . . . . . . . . . . . . . . . . . . . . . . . . . . . . . . . . . . . . . . . . . . . . . 7
Step 2: Transfer SP400 feature code to AS/400 . . . . . . . . . . . . . . . . . . . . . . . . . . . . . . . . . . . . . 7
Log files and data capture on the AS/400. . . . . . . . . . . . . . . . . . . . . . . . . . . . . . . . . . . . . . . . . . . . . 12
OS/400 log files description. . . . . . . . . . . . . . . . . . . . . . . . . . . . . . . . . . . . . . . . . . . . . . . . . . . 12
Capturing data on the AS/400 with SP400 feature . . . . . . . . . . . . . . . . . . . . . . . . . . . . . . . . . . 13
Transferring captured data files to OS/390 . . . . . . . . . . . . . . . . . . . . . . . . . . . . . . . . . . . . . . . . 17
Installing SP400 feature components on the OS/390 system . . . . . . . . . . . . . . . . . . . . . . . . . . . . . . . 20
Updating the lookup tables . . . . . . . . . . . . . . . . . . . . . . . . . . . . . . . . . . . . . . . . . . . . . . . . . . . . . . . 22
Updating OS400_JOB_ACCTCODE . . . . . . . . . . . . . . . . . . . . . . . . . . . . . . . . . . . . . . . . . . . . 22
Updating OS400_DASDTYPE. . . . . . . . . . . . . . . . . . . . . . . . . . . . . . . . . . . . . . . . . . . . . . . . . 23
Updating OS400_DATE_FORMAT . . . . . . . . . . . . . . . . . . . . . . . . . . . . . . . . . . . . . . . . . . . . . 23
iiiAS/400 System Performance Feature Guide and Reference

Updating OS400_JOBGROUP. . . . . . . . . . . . . . . . . . . . . . . . . . . . . . . . . . . . . . . . . . . . . . . . . 23
Collecting data under Performance Reporter. . . . . . . . . . . . . . . . . . . . . . . . . . . . . . . . . . . . . . . . . . . 24
General COLLECT Job . . . . . . . . . . . . . . . . . . . . . . . . . . . . . . . . . . . . . . . . . . . . . . . . . . . . . . 24
Collect job with specified Performance Reporter tables . . . . . . . . . . . . . . . . . . . . . . . . . . . . . . 25
Backup and delete of data sets. . . . . . . . . . . . . . . . . . . . . . . . . . . . . . . . . . . . . . . . . . . . . . . . . 25
Testing the installation. . . . . . . . . . . . . . . . . . . . . . . . . . . . . . . . . . . . . . . . . . . . . . . . . . . . . . . . . . . 25
Putting the feature into production . . . . . . . . . . . . . . . . . . . . . . . . . . . . . . . . . . . . . . . . . . . . . . . . . . 25
Part II. Reference . . . . . . . . . . . . . . . . . . . . . . . . . . . . . . . . . . . . . . . . . . . . . . . . . . . . . . . 27
Chapter 3. Data flow and Performance Reporter objects . . . . . . . . . . . . . . . . 29SP400 feature general data flow . . . . . . . . . . . . . . . . . . . . . . . . . . . . . . . . . . . . . . . . . . . . . . . . . . . 30
Description of record definitions and logs . . . . . . . . . . . . . . . . . . . . . . . . . . . . . . . . . . . . . . . . 31
SP400 feature accounting component data flow . . . . . . . . . . . . . . . . . . . . . . . . . . . . . . . . . . . . . . . . 33
Where to look for further information . . . . . . . . . . . . . . . . . . . . . . . . . . . . . . . . . . . . . . . . . . . 33
SP400 feature configuration component data flow . . . . . . . . . . . . . . . . . . . . . . . . . . . . . . . . . . . . . . 34
Where to look for further information . . . . . . . . . . . . . . . . . . . . . . . . . . . . . . . . . . . . . . . . . . . 35
SP400 feature job statistics component data flow . . . . . . . . . . . . . . . . . . . . . . . . . . . . . . . . . . . . . . . 36
Where to look for further information . . . . . . . . . . . . . . . . . . . . . . . . . . . . . . . . . . . . . . . . . . . 36
SP400 feature messages component data flow . . . . . . . . . . . . . . . . . . . . . . . . . . . . . . . . . . . . . . . . . 37
Where to look for further information . . . . . . . . . . . . . . . . . . . . . . . . . . . . . . . . . . . . . . . . . . . 38
SP400 feature performance component data flow . . . . . . . . . . . . . . . . . . . . . . . . . . . . . . . . . . . . . . . 39
Where to look for further information . . . . . . . . . . . . . . . . . . . . . . . . . . . . . . . . . . . . . . . . . . . 40
Chapter 4. Data tables and lookup tables. . . . . . . . . . . . . . . . . . . . . . . . . . . . . . . . . 41Naming standard for tables . . . . . . . . . . . . . . . . . . . . . . . . . . . . . . . . . . . . . . . . . . . . . . . . . . . . . . . 41
Table descriptions . . . . . . . . . . . . . . . . . . . . . . . . . . . . . . . . . . . . . . . . . . . . . . . . . . . . . . . . . . . . . . 42
Tables in the SP400 feature accounting component . . . . . . . . . . . . . . . . . . . . . . . . . . . . . . . . . . . . . 42
OS400_ACCT_JOB_D, _M. . . . . . . . . . . . . . . . . . . . . . . . . . . . . . . . . . . . . . . . . . . . . . . . . . . 42
OS400_ACCT_PRINT_D, _M. . . . . . . . . . . . . . . . . . . . . . . . . . . . . . . . . . . . . . . . . . . . . . . . . 43
Tables in the SP400 feature configuration component. . . . . . . . . . . . . . . . . . . . . . . . . . . . . . . . . . . . 43
OS400_CONFIG . . . . . . . . . . . . . . . . . . . . . . . . . . . . . . . . . . . . . . . . . . . . . . . . . . . . . . . . . . . 44
Tables in the SP400 feature job statistics component . . . . . . . . . . . . . . . . . . . . . . . . . . . . . . . . . . . . 45
OS400_JOB_STAT_D, _M . . . . . . . . . . . . . . . . . . . . . . . . . . . . . . . . . . . . . . . . . . . . . . . . . . . 45
Tables in the SP400 feature messages component. . . . . . . . . . . . . . . . . . . . . . . . . . . . . . . . . . . . . . . 46
OS400_MSG_STAT_D, _M. . . . . . . . . . . . . . . . . . . . . . . . . . . . . . . . . . . . . . . . . . . . . . . . . . . 46
OS400_MSG_STAT_DV, _MV . . . . . . . . . . . . . . . . . . . . . . . . . . . . . . . . . . . . . . . . . . . . . . . . 46
Tables in the SP400 feature performance component . . . . . . . . . . . . . . . . . . . . . . . . . . . . . . . . . . . . 47
OS400_PM_DISK_H, _D . . . . . . . . . . . . . . . . . . . . . . . . . . . . . . . . . . . . . . . . . . . . . . . . . . . . 47
iv Release 5

OS400_PM_POOL_H, _D. . . . . . . . . . . . . . . . . . . . . . . . . . . . . . . . . . . . . . . . . . . . . . . . . . . . 49
OS400_PM_SYS_H, _D . . . . . . . . . . . . . . . . . . . . . . . . . . . . . . . . . . . . . . . . . . . . . . . . . . . . . 50
OS400_PM_SYS_JGR_H, _D . . . . . . . . . . . . . . . . . . . . . . . . . . . . . . . . . . . . . . . . . . . . . . . . . 55
OS400_PERF_SUM_H, _D . . . . . . . . . . . . . . . . . . . . . . . . . . . . . . . . . . . . . . . . . . . . . . . . . . . 57
SP400 feature lookup tables. . . . . . . . . . . . . . . . . . . . . . . . . . . . . . . . . . . . . . . . . . . . . . . . . . . . . . . 58
OS400_JOB_ACCTCODE. . . . . . . . . . . . . . . . . . . . . . . . . . . . . . . . . . . . . . . . . . . . . . . . . . . . 58
OS400_DASDTYPE . . . . . . . . . . . . . . . . . . . . . . . . . . . . . . . . . . . . . . . . . . . . . . . . . . . . . . . . 58
OS400_DATE_FORMAT. . . . . . . . . . . . . . . . . . . . . . . . . . . . . . . . . . . . . . . . . . . . . . . . . . . . . 60
OS400_JOBGROUP . . . . . . . . . . . . . . . . . . . . . . . . . . . . . . . . . . . . . . . . . . . . . . . . . . . . . . . . 60
Chapter 5. Reports . . . . . . . . . . . . . . . . . . . . . . . . . . . . . . . . . . . . . . . . . . . . . . . . . . . . . . . . . 63Report format and general description . . . . . . . . . . . . . . . . . . . . . . . . . . . . . . . . . . . . . . . . . . . . . . . 63
Report ID . . . . . . . . . . . . . . . . . . . . . . . . . . . . . . . . . . . . . . . . . . . . . . . . . . . . . . . . . . . . . . . . 63
Report group . . . . . . . . . . . . . . . . . . . . . . . . . . . . . . . . . . . . . . . . . . . . . . . . . . . . . . . . . . . . . . 64
Source Tables . . . . . . . . . . . . . . . . . . . . . . . . . . . . . . . . . . . . . . . . . . . . . . . . . . . . . . . . . . . . . 64
Attributes . . . . . . . . . . . . . . . . . . . . . . . . . . . . . . . . . . . . . . . . . . . . . . . . . . . . . . . . . . . . . . . . 64
Variables . . . . . . . . . . . . . . . . . . . . . . . . . . . . . . . . . . . . . . . . . . . . . . . . . . . . . . . . . . . . . . . . . 64
Reports in the accounting component. . . . . . . . . . . . . . . . . . . . . . . . . . . . . . . . . . . . . . . . . . . . . . . . 65
OS/400 Acct Job Accounting, Monthly Overview. . . . . . . . . . . . . . . . . . . . . . . . . . . . . . . . . . . 65
OS/400 Acct Print Accounting, Monthly Overview. . . . . . . . . . . . . . . . . . . . . . . . . . . . . . . . . . 66
Reports in the configuration component . . . . . . . . . . . . . . . . . . . . . . . . . . . . . . . . . . . . . . . . . . . . . . 67
OS/400 Config all Devices, Overview . . . . . . . . . . . . . . . . . . . . . . . . . . . . . . . . . . . . . . . . . . . 68
OS/400 Config DASD Capacity Overview . . . . . . . . . . . . . . . . . . . . . . . . . . . . . . . . . . . . . . . . 70
OS/400 Config Main Storage Overview . . . . . . . . . . . . . . . . . . . . . . . . . . . . . . . . . . . . . . . . . . 70
OS/400 Config Device Count Type/Model, Overview. . . . . . . . . . . . . . . . . . . . . . . . . . . . . . . . 71
OS/400 Config Device for Specific Type, Overview. . . . . . . . . . . . . . . . . . . . . . . . . . . . . . . . . 72
Reports in the job statistics component . . . . . . . . . . . . . . . . . . . . . . . . . . . . . . . . . . . . . . . . . . . . . . 73
OS/400 Job Statistics by User, Monthly Overview . . . . . . . . . . . . . . . . . . . . . . . . . . . . . . . . . . 74
OS/400 Job CPU Usage by User, Monthly Overview . . . . . . . . . . . . . . . . . . . . . . . . . . . . . . . . 74
OS/400 Job Statistics All Systems, Daily Trend . . . . . . . . . . . . . . . . . . . . . . . . . . . . . . . . . . . . 75
OS/400 Job Statistics all Systems, Monthly Trend . . . . . . . . . . . . . . . . . . . . . . . . . . . . . . . . . . 76
OS/400 Job Statistics for a User, Monthly Overview . . . . . . . . . . . . . . . . . . . . . . . . . . . . . . . . 77
OS/400 Job Type Statistics, Monthly Overview . . . . . . . . . . . . . . . . . . . . . . . . . . . . . . . . . . . . 78
OS/400 Job Acct from History Log, Monthly Overview . . . . . . . . . . . . . . . . . . . . . . . . . . . . . . 79
Reports in the messages component . . . . . . . . . . . . . . . . . . . . . . . . . . . . . . . . . . . . . . . . . . . . . . . . . 80
OS/400 Messages All Systems, Monthly Overview . . . . . . . . . . . . . . . . . . . . . . . . . . . . . . . . . 81
OS/400 Messages Most Frequent, Daily Overview . . . . . . . . . . . . . . . . . . . . . . . . . . . . . . . . . . 82
OS/400 Messages Most Frequent, Monthly Overview. . . . . . . . . . . . . . . . . . . . . . . . . . . . . . . . 83
OS/400 Messages by Sev. Codes, Monthly Overview . . . . . . . . . . . . . . . . . . . . . . . . . . . . . . . . 84
vAS/400 System Performance Feature Guide and Reference
OS/400 Messages for a User, Monthly Overview . . . . . . . . . . . . . . . . . . . . . . . . . . . . . . . . . . . 84
OS/400 Messages by Type, Monthly Overview . . . . . . . . . . . . . . . . . . . . . . . . . . . . . . . . . . . . 85
OS/400 Messages by User Name, Monthly Overview. . . . . . . . . . . . . . . . . . . . . . . . . . . . . . . . 86
Reports in the performance component . . . . . . . . . . . . . . . . . . . . . . . . . . . . . . . . . . . . . . . . . . . . . . 87
OS/400 Perf CPU and RTM Statistics, Hourly Trend . . . . . . . . . . . . . . . . . . . . . . . . . . . . . . . . 87
OS/400 Perf Exception and Lock Stat, Hourly Trend . . . . . . . . . . . . . . . . . . . . . . . . . . . . . . . . 89
OS/400 Perf Disk I/O Statistics, Hourly Trend . . . . . . . . . . . . . . . . . . . . . . . . . . . . . . . . . . . . . 90
OS/400 Perf Disk Capacity Statistics, Hourly Trend . . . . . . . . . . . . . . . . . . . . . . . . . . . . . . . . . 92
OS/400 Perf Disk Arm Movements, Hourly Trend . . . . . . . . . . . . . . . . . . . . . . . . . . . . . . . . . . 94
OS/400 Perf CPU & Trans by Job Group, Hourly Trend . . . . . . . . . . . . . . . . . . . . . . . . . . . . . 95
OS/400 Perf CPU by Job Group, Hourly Trend . . . . . . . . . . . . . . . . . . . . . . . . . . . . . . . . . . . . 97
OS/400 Perf Paging Statistics, Hourly Trend . . . . . . . . . . . . . . . . . . . . . . . . . . . . . . . . . . . . . . 98
OS/400 Perf Storage Pool & Act Level, Hourly Trend . . . . . . . . . . . . . . . . . . . . . . . . . . . . . . 100
OS/400 Perf Transition Statistics, Hourly Trend . . . . . . . . . . . . . . . . . . . . . . . . . . . . . . . . . . . 102
OS/400 Perf Max & Avg CPU Usage, Hourly Trend . . . . . . . . . . . . . . . . . . . . . . . . . . . . . . . 103
OS/400 Perf CPU Usage all Systems, Daily Overview . . . . . . . . . . . . . . . . . . . . . . . . . . . . . . 104
OS/400 Perf Summary all Systems, Daily Overview. . . . . . . . . . . . . . . . . . . . . . . . . . . . . . . . 105
OS/400 Perf Summary for a System, Daily Trend . . . . . . . . . . . . . . . . . . . . . . . . . . . . . . . . . 106
OS/400 Perf Summary for a System, Hourly Trend . . . . . . . . . . . . . . . . . . . . . . . . . . . . . . . . 108
Part III. Appendixes. . . . . . . . . . . . . . . . . . . . . . . . . . . . . . . . . . . . . . . . . . . . . . . . . . . 111
Appendix A. AS/400 system performance commands . . . . . . . . . . . . . . . . . . 113How to read syntax diagrams. . . . . . . . . . . . . . . . . . . . . . . . . . . . . . . . . . . . . . . . . . . . . . . . . . . . . 113
Reading syntax diagrams . . . . . . . . . . . . . . . . . . . . . . . . . . . . . . . . . . . . . . . . . . . . . . . . . . . . 113
Abbreviating keywords . . . . . . . . . . . . . . . . . . . . . . . . . . . . . . . . . . . . . . . . . . . . . . . . . . . . . 113
Parameters. . . . . . . . . . . . . . . . . . . . . . . . . . . . . . . . . . . . . . . . . . . . . . . . . . . . . . . . . . . . . . . 113
Repeating parameters . . . . . . . . . . . . . . . . . . . . . . . . . . . . . . . . . . . . . . . . . . . . . . . . . . . . . . . 114
Reading fragments . . . . . . . . . . . . . . . . . . . . . . . . . . . . . . . . . . . . . . . . . . . . . . . . . . . . . . . . . 114
Long syntax diagrams . . . . . . . . . . . . . . . . . . . . . . . . . . . . . . . . . . . . . . . . . . . . . . . . . . . . . . 115
STRSPSRV (Start SP400 Server) command . . . . . . . . . . . . . . . . . . . . . . . . . . . . . . . . . . . . . . . . . . 115
Purpose . . . . . . . . . . . . . . . . . . . . . . . . . . . . . . . . . . . . . . . . . . . . . . . . . . . . . . . . . . . . . . . . . 115
Optional Parameters. . . . . . . . . . . . . . . . . . . . . . . . . . . . . . . . . . . . . . . . . . . . . . . . . . . . . . . . 116
Example . . . . . . . . . . . . . . . . . . . . . . . . . . . . . . . . . . . . . . . . . . . . . . . . . . . . . . . . . . . . . . . . 116
STRSP400 (Start SP400 data capturing) command . . . . . . . . . . . . . . . . . . . . . . . . . . . . . . . . . . . . . 116
Purpose . . . . . . . . . . . . . . . . . . . . . . . . . . . . . . . . . . . . . . . . . . . . . . . . . . . . . . . . . . . . . . . . . 117
Optional Parameters. . . . . . . . . . . . . . . . . . . . . . . . . . . . . . . . . . . . . . . . . . . . . . . . . . . . . . . . 117
Examples . . . . . . . . . . . . . . . . . . . . . . . . . . . . . . . . . . . . . . . . . . . . . . . . . . . . . . . . . . . . . . . 121
INZTAP (Initialize Tape) command . . . . . . . . . . . . . . . . . . . . . . . . . . . . . . . . . . . . . . . . . . . . . . . . 121
Purpose . . . . . . . . . . . . . . . . . . . . . . . . . . . . . . . . . . . . . . . . . . . . . . . . . . . . . . . . . . . . . . . . . 122
vi Release 5
Required parameter . . . . . . . . . . . . . . . . . . . . . . . . . . . . . . . . . . . . . . . . . . . . . . . . . . . . . . . . 122
Optional Parameters. . . . . . . . . . . . . . . . . . . . . . . . . . . . . . . . . . . . . . . . . . . . . . . . . . . . . . . . 123
Example. . . . . . . . . . . . . . . . . . . . . . . . . . . . . . . . . . . . . . . . . . . . . . . . . . . . . . . . . . . . . . . . . 124
SAVSPDTA (Save SP400 Data) command . . . . . . . . . . . . . . . . . . . . . . . . . . . . . . . . . . . . . . . . . . . 125
Purpose . . . . . . . . . . . . . . . . . . . . . . . . . . . . . . . . . . . . . . . . . . . . . . . . . . . . . . . . . . . . . . . . . 125
Optional Parameters. . . . . . . . . . . . . . . . . . . . . . . . . . . . . . . . . . . . . . . . . . . . . . . . . . . . . . . . 125
Examples . . . . . . . . . . . . . . . . . . . . . . . . . . . . . . . . . . . . . . . . . . . . . . . . . . . . . . . . . . . . . . . 126
Appendix B. List of abbreviations. . . . . . . . . . . . . . . . . . . . . . . . . . . . . . . . . . . . . . . . 129
Appendix C. Glossary. . . . . . . . . . . . . . . . . . . . . . . . . . . . . . . . . . . . . . . . . . . . . . . . . . . . . 131
Index . . . . . . . . . . . . . . . . . . . . . . . . . . . . . . . . . . . . . . . . . . . . . . . . . . . . . . . . . . . . . . . . . . . . . . . 135
viiAS/400 System Performance Feature Guide and Reference

viii Release 5
Figures
1. Organizing and presenting system performance data . . . . . . . . . . . . . . . . . . . . . . . . . . . . . . . . . . . . . . 42. Implementation process for the SP400 feature . . . . . . . . . . . . . . . . . . . . . . . . . . . . . . . . . . . . . . . . . . 63. Restoring SP400 library from tape . . . . . . . . . . . . . . . . . . . . . . . . . . . . . . . . . . . . . . . . . . . . . . . . . . . 84. Restoring SP400 library from savefile . . . . . . . . . . . . . . . . . . . . . . . . . . . . . . . . . . . . . . . . . . . . . . . . 95. Listing of objects contained in DRLLIB . . . . . . . . . . . . . . . . . . . . . . . . . . . . . . . . . . . . . . . . . . . . . . . 96. Restoring DRLDTA database library from DRLDTA savefile . . . . . . . . . . . . . . . . . . . . . . . . . . . . . . 107. Listing of objects contained in DRLDTA library . . . . . . . . . . . . . . . . . . . . . . . . . . . . . . . . . . . . . . . . 118. Adding DRLLIB to the library list of a job . . . . . . . . . . . . . . . . . . . . . . . . . . . . . . . . . . . . . . . . . . . 129. SP400 Main Menu . . . . . . . . . . . . . . . . . . . . . . . . . . . . . . . . . . . . . . . . . . . . . . . . . . . . . . . . . . . . . . 14
10. Start Performance Reporter SP400 server (STRSPSRV) . . . . . . . . . . . . . . . . . . . . . . . . . . . . . . . . . . 1411. Start of history log data capture . . . . . . . . . . . . . . . . . . . . . . . . . . . . . . . . . . . . . . . . . . . . . . . . . . . . 1512. Set time period parameter for data capturing. . . . . . . . . . . . . . . . . . . . . . . . . . . . . . . . . . . . . . . . . . . 1613. Start of OS/400 performance monitor to create performance logs . . . . . . . . . . . . . . . . . . . . . . . . . . . 1714. Initialization of tape for data transfer to Performance Reporter . . . . . . . . . . . . . . . . . . . . . . . . . . . . . 1815. Density values . . . . . . . . . . . . . . . . . . . . . . . . . . . . . . . . . . . . . . . . . . . . . . . . . . . . . . . . . . . . . . . . . 1816. The SAVSPDTA command window . . . . . . . . . . . . . . . . . . . . . . . . . . . . . . . . . . . . . . . . . . . . . . . . . 1917. Performance Reporter Administration window . . . . . . . . . . . . . . . . . . . . . . . . . . . . . . . . . . . . . . . . . 2018. Components window . . . . . . . . . . . . . . . . . . . . . . . . . . . . . . . . . . . . . . . . . . . . . . . . . . . . . . . . . . . . 2119. Installation Options window . . . . . . . . . . . . . . . . . . . . . . . . . . . . . . . . . . . . . . . . . . . . . . . . . . . . . . . 2120. General COLLECT job . . . . . . . . . . . . . . . . . . . . . . . . . . . . . . . . . . . . . . . . . . . . . . . . . . . . . . . . . . 2421. Sample COLLECT job using INCLUDE statement . . . . . . . . . . . . . . . . . . . . . . . . . . . . . . . . . . . . . . 2522. Daily steps involved in using Performance Reporter . . . . . . . . . . . . . . . . . . . . . . . . . . . . . . . . . . . . . 2623. General SP400 feature data flow . . . . . . . . . . . . . . . . . . . . . . . . . . . . . . . . . . . . . . . . . . . . . . . . . . . 3024. SP400 feature accounting component data flow . . . . . . . . . . . . . . . . . . . . . . . . . . . . . . . . . . . . . . . . 3325. SP400 feature configuration component data flow. . . . . . . . . . . . . . . . . . . . . . . . . . . . . . . . . . . . . . . 3426. SP400 feature job statistics component data flow . . . . . . . . . . . . . . . . . . . . . . . . . . . . . . . . . . . . . . . 3627. SP400 feature messages component data flow. . . . . . . . . . . . . . . . . . . . . . . . . . . . . . . . . . . . . . . . . . 3728. SP400 feature performance component data flow . . . . . . . . . . . . . . . . . . . . . . . . . . . . . . . . . . . . . . . 3929. Example of OS/400 Acct Job Accounting, Monthly Overview. . . . . . . . . . . . . . . . . . . . . . . . . . . . . . 6630. Example of OS/400 Acct Print Accounting, Monthly Overview. . . . . . . . . . . . . . . . . . . . . . . . . . . . . 6731. Example of OS/400 Config all Devices, Overview . . . . . . . . . . . . . . . . . . . . . . . . . . . . . . . . . . . . . . 6932. Example of OS/400 Config DASD Capacity Overview . . . . . . . . . . . . . . . . . . . . . . . . . . . . . . . . . . . 7033. Example of OS/400 Config Main Storage Overview . . . . . . . . . . . . . . . . . . . . . . . . . . . . . . . . . . . . . 7134. Example of OS/400 Config Device Count Type/Model, Overview. . . . . . . . . . . . . . . . . . . . . . . . . . . 7235. Example of OS/400 Config Device for Specific Type, Overview. . . . . . . . . . . . . . . . . . . . . . . . . . . . 7336. Example of OS/400 Job Statistics by User, Monthly Overview . . . . . . . . . . . . . . . . . . . . . . . . . . . . . 7437. Example of OS/400 Job CPU Usage by User, Monthly Overview . . . . . . . . . . . . . . . . . . . . . . . . . . . 7538. Example of OS/400 Job Statistics all Systems, Daily Trend. . . . . . . . . . . . . . . . . . . . . . . . . . . . . . . . 7639. Example of OS/400 Job Statistics all Systems, Monthly Trend . . . . . . . . . . . . . . . . . . . . . . . . . . . . . 7740. Example of OS/400 Jobs Statistics for a User, Monthly Overview. . . . . . . . . . . . . . . . . . . . . . . . . . . 7841. Example of OS/400 Job Type Statistics, Monthly Overview . . . . . . . . . . . . . . . . . . . . . . . . . . . . . . . 7942. Example of OS/400 Job Acct from History Log, Monthly Overview . . . . . . . . . . . . . . . . . . . . . . . . . 8043. Example of OS/400 Messages All Systems, Monthly Overview. . . . . . . . . . . . . . . . . . . . . . . . . . . . . 8144. Example of OS/400 Messages Most Frequent, Daily Overview . . . . . . . . . . . . . . . . . . . . . . . . . . . . . 8245. Example of OS/400 Messages Most Frequent, Monthly Overview. . . . . . . . . . . . . . . . . . . . . . . . . . . 8346. Example of OS/400 Messages by Sev. Codes, Monthly Overview . . . . . . . . . . . . . . . . . . . . . . . . . . . 8447. Example of OS/400 Messages for a User, Monthly Overview . . . . . . . . . . . . . . . . . . . . . . . . . . . . . . 8548. Example of OS/400 Messages by Type, Monthly Overview . . . . . . . . . . . . . . . . . . . . . . . . . . . . . . . 8649. Example of OS/400 Messages by User Name, Monthly Overview. . . . . . . . . . . . . . . . . . . . . . . . . . . 86
ixAS/400 System Performance Feature Guide and Reference
||

50. Example of OS/400 Perf CPU and RTM Statistics, Hourly Trend . . . . . . . . . . . . . . . . . . . . . . . . . . . 8851. Example of OS/400 Perf Exception and Lock Stat, Hourly Trend . . . . . . . . . . . . . . . . . . . . . . . . . . . 8952. Example of OS/400 Perf Disk I/O Statistics, Hourly Trend . . . . . . . . . . . . . . . . . . . . . . . . . . . . . . . . 9153. Example of OS/400 Perf Disk Capacity Statistics, Hourly Trend . . . . . . . . . . . . . . . . . . . . . . . . . . . . 9354. Example of OS/400 Perf Disk Arm Movements, Hourly Trend . . . . . . . . . . . . . . . . . . . . . . . . . . . . . 9455. Example of OS/400 Perf CPU & Trans by Job Group, Hourly Trend . . . . . . . . . . . . . . . . . . . . . . . . 9656. Example of OS/400 Perf CPU by Job Group, Hourly Trend . . . . . . . . . . . . . . . . . . . . . . . . . . . . . . . 9757. Example of OS/400 Perf Paging Statistics, Hourly Trend . . . . . . . . . . . . . . . . . . . . . . . . . . . . . . . . . 9958. Example of OS/400 Perf Storage Pool & Act Level, Hourly Trend . . . . . . . . . . . . . . . . . . . . . . . . . 10159. Example of OS/400 Perf Transition Statistics, Hourly Trend . . . . . . . . . . . . . . . . . . . . . . . . . . . . . . 10260. Example of OS/400 Perf Max & Avg CPU Usage, Hourly Trend . . . . . . . . . . . . . . . . . . . . . . . . . . 10461. Example of OS/400 Perf CPU Usage all Systems, Daily Overview . . . . . . . . . . . . . . . . . . . . . . . . . 10562. Example of OS/400 Perf Summary all Systems, Daily Overview. . . . . . . . . . . . . . . . . . . . . . . . . . . 10663. Example of OS/400 Perf Summary for a System, Daily Trend. . . . . . . . . . . . . . . . . . . . . . . . . . . . . 10764. Example of OS/400 Perf Summary for a System, Hourly Trend . . . . . . . . . . . . . . . . . . . . . . . . . . . 109
x Release 5

Notices
References in this publication to Tivoli Systems or IBM products, programs, or services donot imply that they will be available in all countries in which Tivoli Systems or IBMoperates. Any reference to these products, programs, or services is not intended to imply thatonly Tivoli Systems or IBM products, programs, or services can be used. Subject to TivoliSystems’s or IBM’s valid intellectual property or other legally protectable right, anyfunctionally equivalent product, program, or service can be used instead of the referencedproduct, program, or service. The evaluation and verification of operation in conjunctionwith other products, except those expressly designated by Tivoli Systems or IBM, are theresponsibility of the user.
Tivoli Systems or IBM may have patents or pending patent applications covering subjectmatter in this document. The furnishing of this document does not give you any license tothese patents. You can send license inquiries, in writing, to:
IBM Director of LicensingIBM CorporationNorth Castle DriveArmonk, NY 10504 - 1785USA
Licensees of this program who wish to have information about it for the purpose ofenabling: (i) the exchange of information between independently created programs and otherprograms (including this one) and (ii) the mutual use of the information which has beenexchanged, should contact:
IBM CorporationP.O. Box 121953039 CornwallisResearch Triangle Park, NC 27709-2195USA
Such information may be available, subject to appropriate terms and conditions, including insome cases, payment of a fee.
For information about the trademarks of Tivoli Systems, the IBM Corporation, and othercompanies that appear in the Tivoli Performance Reporter for OS/390 library, see“Trademarks and service marks” on page xv.
xiAS/400 System Performance Feature Guide and Reference

xii Release 5

Programming interfaces
This book is intended to help users monitor AS/400. This book documents informationwhich is Diagnosis, Modification, or Tuning information provided by Tivoli PerformanceReporter for OS/390, which was previously known as Enterprise Performance Data Managerfor MVS.
Attention:
Do not use this Diagnosis, Modification, or Tuning information as a programming interface.
xiiiAS/400 System Performance Feature Guide and Reference

xiv Release 5

Trademarks and service marks
The following terms are trademarks of International Business Machines Corporation orTivoli Systems Inc, in the United States, other countries, or both. In Denmark, Tivoli is atrademark licensed from Kjøbenhavns Sommer - Tivoli A/S.
IBM TivoliADSTAR AIXAS/400 BookManagerCICS CICS/MVSMVS Operating System/400OS/390 OS/400
Other company, product, and service names may be trademarks or service marks of others.
xvAS/400 System Performance Feature Guide and Reference

xvi Release 5
About this book
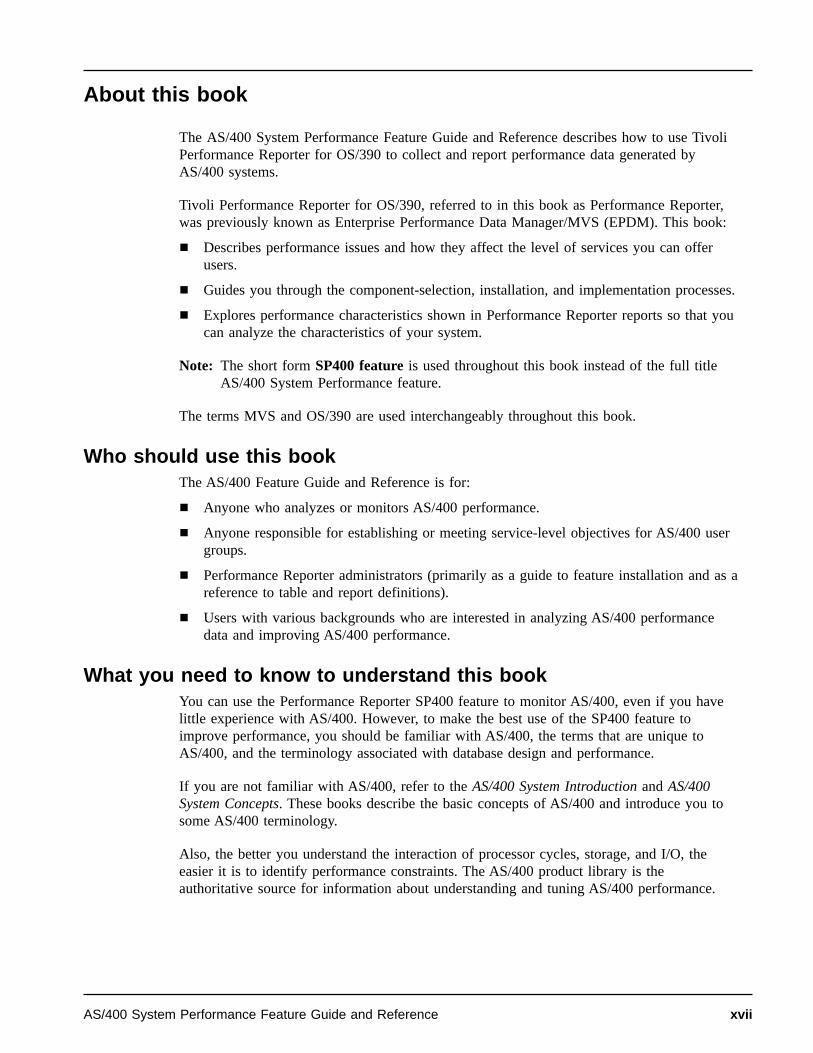
The AS/400 System Performance Feature Guide and Reference describes how to use TivoliPerformance Reporter for OS/390 to collect and report performance data generated byAS/400 systems.
Tivoli Performance Reporter for OS/390, referred to in this book as Performance Reporter,was previously known as Enterprise Performance Data Manager/MVS (EPDM). This book:
¶ Describes performance issues and how they affect the level of services you can offerusers.
¶ Guides you through the component-selection, installation, and implementation processes.
¶ Explores performance characteristics shown in Performance Reporter reports so that youcan analyze the characteristics of your system.
Note: The short form SP400 feature is used throughout this book instead of the full titleAS/400 System Performance feature.
The terms MVS and OS/390 are used interchangeably throughout this book.
Who should use this bookThe AS/400 Feature Guide and Reference is for:
¶ Anyone who analyzes or monitors AS/400 performance.
¶ Anyone responsible for establishing or meeting service-level objectives for AS/400 usergroups.
¶ Performance Reporter administrators (primarily as a guide to feature installation and as areference to table and report definitions).
¶ Users with various backgrounds who are interested in analyzing AS/400 performancedata and improving AS/400 performance.
What you need to know to understand this bookYou can use the Performance Reporter SP400 feature to monitor AS/400, even if you havelittle experience with AS/400. However, to make the best use of the SP400 feature toimprove performance, you should be familiar with AS/400, the terms that are unique toAS/400, and the terminology associated with database design and performance.
If you are not familiar with AS/400, refer to the AS/400 System Introduction and AS/400System Concepts. These books describe the basic concepts of AS/400 and introduce you tosome AS/400 terminology.
Also, the better you understand the interaction of processor cycles, storage, and I/O, theeasier it is to identify performance constraints. The AS/400 product library is theauthoritative source for information about understanding and tuning AS/400 performance.
xviiAS/400 System Performance Feature Guide and Reference

How to use this bookUse this book to help you collect AS/400-generated performance data and create the reportssupplied with the SP400 feature. This book explains how to create and display PerformanceReporter reports to both monitor and understand AS/400 performance.
This book contains the following parts:
¶ Part I, Guide explains basic concepts of system management and offers suggestions onestablishing performance objectives and service-level agreements. It also describes theSP400 feature role in the Performance Reporter environment and contains atask-oriented description of how to plan for and set up the SP400 feature so that usefulreports and decision-support information are available immediately.
¶ Part II, Reference describes the flow of data from OS/400 logs to reports, showingPerformance Reporter log and record definitions, tables, and reports. It also describes thesupplied data tables and lookup tables, including their columns and expressions.
¶ Part III, Appendixes describes the use and the syntax of the following commands:
v STRSPSRV, which starts the SP400 monitoring job.
v STRSP400, which starts the data capturing process.
v INZTAP, which prepares magnetic tape to be used to save data.
v SAVSPDTA, which saves the data captured with the STRSP400 command andprovides the file transfer of this data from the AS/400 system to an OS/390 hostsystem.
In addition, the Appendixes contain a list of abbreviations and a Glossary.
Summary of changesThis section explains the changes that have been made to this edition and to previouseditions of this book.
Changes for this editionGeneral updates have been made to the book to reflect the new release. In addition, APARsPQ10781 and PQ13885 have been incorporated into this book.
Except for editorial changes, updates to this edition are marked with a vertical bar to the leftof the change.
Changes for the previous editionThe name of the base product was changed to Tivoli Performance Reporter for OS/390.
Contacting customer supportIf you encounter difficulties with any Tivoli products, you can enter http://www.support.tivoli.com to view the Tivoli Support home page. After you link to and submit the customerregistration form, you will be able to access many customer support services on the Web.
Use the following phone numbers to contact customer support in the United States: theTivoli number is 1-800-848-6548 (1-800-TIVOLI8) and the IBM number is 1-800-237-5511(press or say 8 after you reach this number). Both of these numbers direct your call to theTivoli Customer Support Call Center.
xviii Release 5
||
We are very interested in hearing from you about your experience with Tivoli products anddocumentation. We welcome your suggestions for improvements. If you have comments orsuggestions about this documentation, please send e-mail to [email protected].
Where to find more informationInformation that will help you as you use the SP400 feature is available in the PerformanceReporter library and in related libraries.
The Guide to the Reporting Dialog describes how to use the Performance Reporter reportingdialog to print reports. Also, Performance Reporter provides extensive online help wheneveryou use Performance Reporter dialogs from the host or from a workstation; this help givesyou access to the online versions of books in the Performance Reporter library.
Whenever you need programming interface information or more information about specificfeatures or functions of AS/400, refer to books in the product library for the related AS/400product.
Performance Reporter libraryTivoli customers can find the Tivoli Performance Reporter for OS/390 Release 4 library athttp://www.support.tivoli.com/Prodman/html/AB.html. Choose Availability, thenPerformance Reporter for OS/390.
BookManager softcopy versions of the Performance Reporter library will be available onCD-ROM in the following collection kits:¶ OS/390 Collection, order number SK2T-6700.¶ Networking Systems Collection, order number SK2T-6012.
While using any Performance Reporter dialog, you can use the help menu to start usingBookManager to view any of the following Performance Reporter books:
Administration
Administration Guide SH19-6816
Reporting dialogs
Guide to the Reporting Dialog SH19-6842
Programming
Language Guide and Reference SH19-6817
User interface
Viewer Guide SH19-4517
xixAS/400 System Performance Feature Guide and Reference
Problem determination
Messages and Problem Determination SH19-6902
Performance analysis
Accounting Feature for the Host SH19-4495
Accounting Feature for the Workstation SH19-4516
AS/400 System Performance Feature Guide andReference
SH19-4019
Capacity Planner Feature Guide and Reference SH19-4021
CICS Performance Feature Guide and Reference SH19-6820
Distributed Systems Performance Feature Guide andReference
SH19-4018
IMS Performance Feature Guide and Reference SH19-6825
Network Performance Feature Installation andAdministration
SH19-6901
Network Performance Feature Reference SH19-6822
Network Performance Feature Reports SH19-6821
System Performance Feature Guide SH19-6818
System Performance Feature Reference Volume I SH19-6819
System Performance Feature Reference Volume II SH19-4494
xx Release 5

I — GuideChapter 1. Introducing the SP400 feature . . . . . . . . . . . . . . . . . . . . . . . . . . . . . . . . . . 3Collecting performance data . . . . . . . . . . . . . . . . . . . . . . . . . . . . . . . . . . . . . . . . . . . . . . . . . . . . . . . . . . . 3
Chapter 2. Implementing the SP400 feature. . . . . . . . . . . . . . . . . . . . . . . . . . . . . . . . 5Planning the implementation process . . . . . . . . . . . . . . . . . . . . . . . . . . . . . . . . . . . . . . . . . . . . . . . . . . . . . 5Considering which components to install . . . . . . . . . . . . . . . . . . . . . . . . . . . . . . . . . . . . . . . . . . . . . . . . . . 6Installing SP400 feature on AS/400 . . . . . . . . . . . . . . . . . . . . . . . . . . . . . . . . . . . . . . . . . . . . . . . . . . . . . . 7
Step 1: Check AS/400 requirements . . . . . . . . . . . . . . . . . . . . . . . . . . . . . . . . . . . . . . . . . . . . . . . . . . . 7Disk space requirements . . . . . . . . . . . . . . . . . . . . . . . . . . . . . . . . . . . . . . . . . . . . . . . . . . . . . . . . . . 7Software requirements . . . . . . . . . . . . . . . . . . . . . . . . . . . . . . . . . . . . . . . . . . . . . . . . . . . . . . . . . . . . 7
Step 2: Transfer SP400 feature code to AS/400 . . . . . . . . . . . . . . . . . . . . . . . . . . . . . . . . . . . . . . . . . . . 7Step 2a: Generate tape or transfer file for installation on AS/400 . . . . . . . . . . . . . . . . . . . . . . . . . . . . 8Step 2b: Sign on to the AS/400 as QSECOFR. . . . . . . . . . . . . . . . . . . . . . . . . . . . . . . . . . . . . . . . . . 8Step 2c: Restore DRLLIB library from tape . . . . . . . . . . . . . . . . . . . . . . . . . . . . . . . . . . . . . . . . . . . 8Step 2d: Restore DRLLIB library from DRLINST savefile . . . . . . . . . . . . . . . . . . . . . . . . . . . . . . . . 8Step 2e: Restore DRLDTA database library from DRLDTA savefile. . . . . . . . . . . . . . . . . . . . . . . . . 10Step 2f: Add Library DRLLIB to your library list . . . . . . . . . . . . . . . . . . . . . . . . . . . . . . . . . . . . . . 11
Log files and data capture on the AS/400. . . . . . . . . . . . . . . . . . . . . . . . . . . . . . . . . . . . . . . . . . . . . . . . . 12OS/400 log files description. . . . . . . . . . . . . . . . . . . . . . . . . . . . . . . . . . . . . . . . . . . . . . . . . . . . . . . . . 12Capturing data on the AS/400 with SP400 feature . . . . . . . . . . . . . . . . . . . . . . . . . . . . . . . . . . . . . . . . 13Transferring captured data files to OS/390 . . . . . . . . . . . . . . . . . . . . . . . . . . . . . . . . . . . . . . . . . . . . . . 17
Additional methods of transferring data to OS/390 . . . . . . . . . . . . . . . . . . . . . . . . . . . . . . . . . . . . . . 19Installing SP400 feature components on the OS/390 system . . . . . . . . . . . . . . . . . . . . . . . . . . . . . . . . . . . 20Updating the lookup tables . . . . . . . . . . . . . . . . . . . . . . . . . . . . . . . . . . . . . . . . . . . . . . . . . . . . . . . . . . . 22
Updating OS400_JOB_ACCTCODE . . . . . . . . . . . . . . . . . . . . . . . . . . . . . . . . . . . . . . . . . . . . . . . . . . 22Updating OS400_DASDTYPE. . . . . . . . . . . . . . . . . . . . . . . . . . . . . . . . . . . . . . . . . . . . . . . . . . . . . . . 23Updating OS400_DATE_FORMAT . . . . . . . . . . . . . . . . . . . . . . . . . . . . . . . . . . . . . . . . . . . . . . . . . . . 23Updating OS400_JOBGROUP. . . . . . . . . . . . . . . . . . . . . . . . . . . . . . . . . . . . . . . . . . . . . . . . . . . . . . . 23
Collecting data under Performance Reporter. . . . . . . . . . . . . . . . . . . . . . . . . . . . . . . . . . . . . . . . . . . . . . . 24General COLLECT Job . . . . . . . . . . . . . . . . . . . . . . . . . . . . . . . . . . . . . . . . . . . . . . . . . . . . . . . . . . . . 24Collect job with specified Performance Reporter tables . . . . . . . . . . . . . . . . . . . . . . . . . . . . . . . . . . . . 25Backup and delete of data sets. . . . . . . . . . . . . . . . . . . . . . . . . . . . . . . . . . . . . . . . . . . . . . . . . . . . . . . 25
Testing the installation. . . . . . . . . . . . . . . . . . . . . . . . . . . . . . . . . . . . . . . . . . . . . . . . . . . . . . . . . . . . . . . 25Putting the feature into production . . . . . . . . . . . . . . . . . . . . . . . . . . . . . . . . . . . . . . . . . . . . . . . . . . . . . . 25
1AS/400 System Performance Feature Guide and Reference

2 Release 5

Introducing the SP400 feature
Tivoli Performance Reporter for OS/390 (hereafter referred to as Performance Reporter) is areporting system that collects utilization and throughput data logged by computer systems,then summarizes the data and presents it in a variety of forms. Performance Reporterconsists of a base product and several optional features that are used in systemsmanagement.
Collecting performance dataAll IBM systems and subsystems provide data on how well they perform. For the AS/400,this information is stored in OS/400 logs, which provide the basic information for SP400feature. However, the information in the OS/400 logs must be captured and then transmittedto OS/390. To transmit the information to OS/390, two methods are supported by SP400feature: using tape, and Network Job Entry (NJE). However, you can also use the NetViewFile Transfer Program or Remote Job Entry (RJE), but you must perform some programmingwork.
Before you can analyze the transmitted data to understand the AS/400 characteristics, thetransmitted data must be collected from the OS/390 log data sets (where it is stored afterbeing transmitted). Performance Reporter and the SP400 feature can be customized to collectonly the data required to meet your needs. The collected data is combined with more data(called environment data), and is finally presented in reports.
The process of entering and maintaining environment data is called administration.Performance Reporter provides an administration dialog for maintaining resourceinformation. Refer to the Administration Guide for information on how to use theadministration dialog.
Figure 1 on page 4 illustrates how data is organized for presentation in Performance Reporterreports. For a more detailed description, see “SP400 feature general data flow” on page 30.
1
3AS/400 System Performance Feature Guide and Reference
1.In
trod
ucin
gth
eS
P400
feature
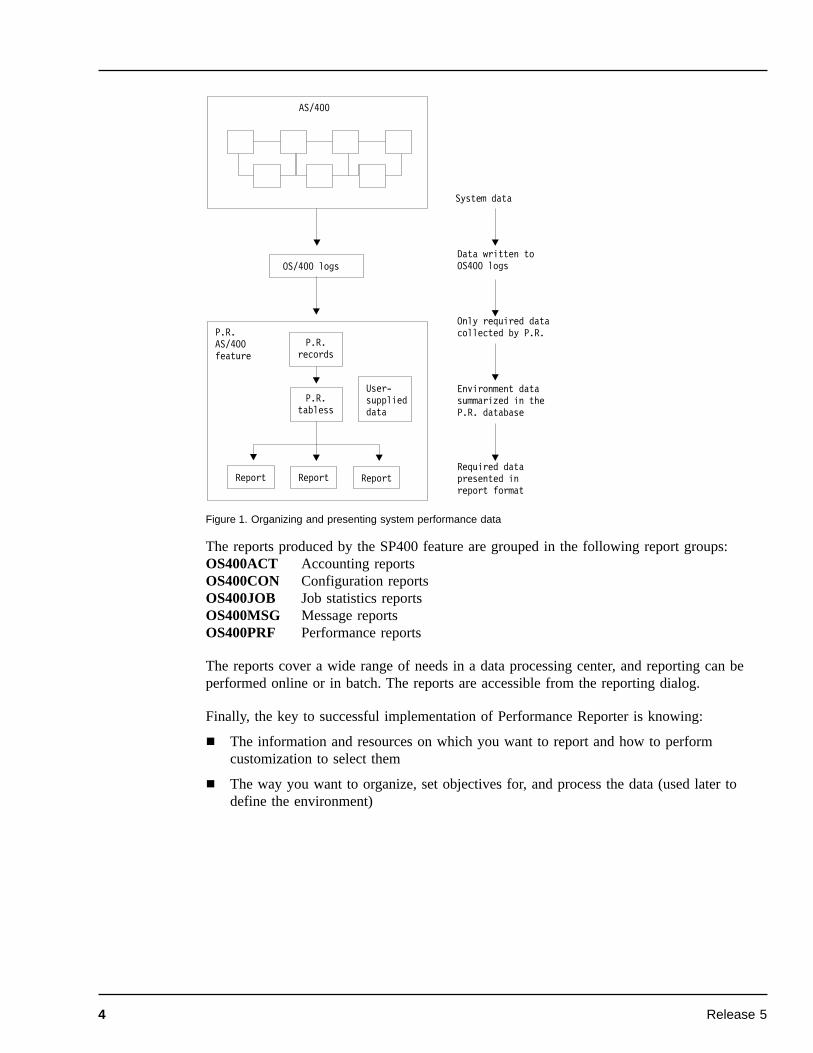
The reports produced by the SP400 feature are grouped in the following report groups:OS400ACT Accounting reportsOS400CON Configuration reportsOS400JOB Job statistics reportsOS400MSG Message reportsOS400PRF Performance reports
The reports cover a wide range of needs in a data processing center, and reporting can beperformed online or in batch. The reports are accessible from the reporting dialog.
Finally, the key to successful implementation of Performance Reporter is knowing:
¶ The information and resources on which you want to report and how to performcustomization to select them
¶ The way you want to organize, set objectives for, and process the data (used later todefine the environment)
AS/400
OS/400 logs
P.R.AS/400feature
P.R.records
P.R.tabless
User-supplieddata
System data
Data written toOS400 logs
Only required datacollected by P.R.
Environment datasummarized in theP.R. database
Required datapresented inreport format
Report Report Report
Figure 1. Organizing and presenting system performance data
4 Release 5
Implementing the SP400 feature
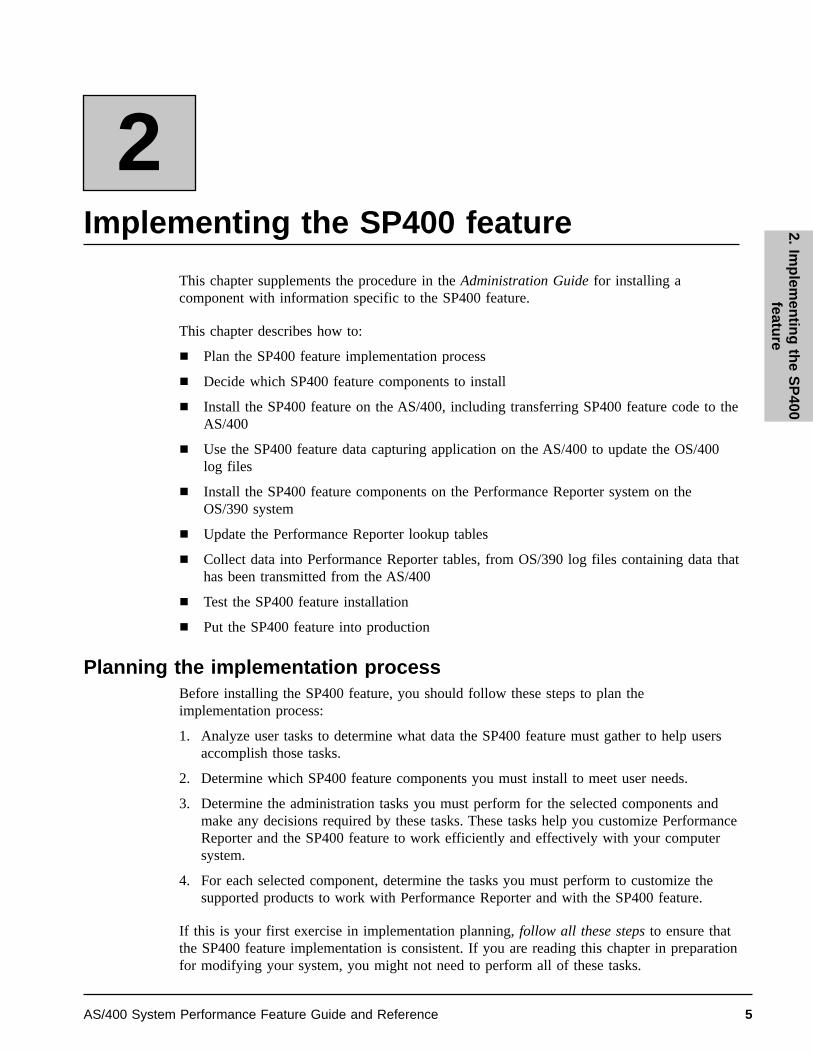
This chapter supplements the procedure in the Administration Guide for installing acomponent with information specific to the SP400 feature.
This chapter describes how to:
¶ Plan the SP400 feature implementation process
¶ Decide which SP400 feature components to install
¶ Install the SP400 feature on the AS/400, including transferring SP400 feature code to theAS/400
¶ Use the SP400 feature data capturing application on the AS/400 to update the OS/400log files
¶ Install the SP400 feature components on the Performance Reporter system on theOS/390 system
¶ Update the Performance Reporter lookup tables
¶ Collect data into Performance Reporter tables, from OS/390 log files containing data thathas been transmitted from the AS/400
¶ Test the SP400 feature installation
¶ Put the SP400 feature into production
Planning the implementation processBefore installing the SP400 feature, you should follow these steps to plan theimplementation process:
1. Analyze user tasks to determine what data the SP400 feature must gather to help usersaccomplish those tasks.
2. Determine which SP400 feature components you must install to meet user needs.
3. Determine the administration tasks you must perform for the selected components andmake any decisions required by these tasks. These tasks help you customize PerformanceReporter and the SP400 feature to work efficiently and effectively with your computersystem.
4. For each selected component, determine the tasks you must perform to customize thesupported products to work with Performance Reporter and with the SP400 feature.
If this is your first exercise in implementation planning, follow all these steps to ensure thatthe SP400 feature implementation is consistent. If you are reading this chapter in preparationfor modifying your system, you might not need to perform all of these tasks.
2
5AS/400 System Performance Feature Guide and Reference
2.Im
plem
entin
gth
eS
P400
feature

Use the planning process to prepare for these main customization tasks:
¶ Customizing your AS/400 systems to generate the data required by the components youinstall.
¶ Defining environment data, which is all the information (besides the input data) that theSP400 feature needs to create reports. Environment data controls the data-collectionprocess and provides more information in the reports.
Figure 2 illustrates the process for implementing the SP400 feature:
Considering which components to installYour most critical planning task is determining what information users need from the SP400feature. For example, users might be interested only in error conditions or in processorcapacity. Installing only those parts of the feature needed to meet user requirements ensuresthat the feature benefits users while it minimizes the performance impact caused by datacollection and interpretation activities.
The SP400 feature is divided into five components:
Installing Performance Reporter
Installing the SP400feature (and itscomponents).
Administering PerformanceReporter and the SP400 feature
Testing the feature
Evaluating the feature'simplementation
Putting the featureinto production
Modification requirements
Maintenance requirements
Customizing OS/400
Planning to use theSP400 feature:implementationmodifications
Figure 2. Implementation process for the SP400 feature
6 Release 5
¶ Accounting
¶ Configuration
¶ Job statistics
¶ Messages
¶ Performance
Consider carefully which components to install. Components are groups of PerformanceReporter objects, such as predefined update definitions, data tables, and reports. If you findthat you need reports from a component that you have not installed, you must install thatcomponent, then wait several days or weeks until enough data has been collected to createreports. However, if you install more components than you need, Performance Reportercollects needless data, which takes up disk space and uses processor time.
At this point, you might find it helpful to examine the predefined reports for eachcomponent. For more information, see “Reports” on page 63.
Installing SP400 feature on AS/400This section gives you practical information on how to install SP400 feature on the AS/400.
Step 1: Check AS/400 requirements
Disk space requirementsThe disk space required by SP400 feature depends upon the size of the databases createdwhen data is captured.
To minimize the use of storage, you should perform data captures as frequently as possible.You can run time-set-batches to achieve this.
Software requirementsThe SP400 feature requires the following programs, or subsequent upward-compatible levels,unless stated otherwise:
¶ Operating System/400* (OS/400*) Version 3 Release 2 (5763-SS1). The AS/400 networkshould be connected to the OS/390 host either through an SDLC or Token-Ringconnection.
¶ NetView* FTP Version 2 Release 1 (5685-108) and NetView FTP/400 Version 3 Release1 (5733-196) are recommended for transfer of files to OS/390.
Step 2: Transfer SP400 feature code to AS/400To install the AS/400 code from tape, you should:
1. Generate the tape to be installed on AS/400, or use your network to transfer anSMP-installed target library member to your AS/400 installation.
2. Sign on to the AS/400 system as QSECOFR.
3. Restore the DRLLIB library from tape or from the DRLINST savefile.
4. Restore the DRLDTA database library from the DRLDTA savefile.
5. Add the DRLLIB and DRLDTA libraries to your library list.
These steps are explained in detail in Steps 2a through 2f.
7AS/400 System Performance Feature Guide and Reference
|||
||
|
|
2.Im
plem
entin
gth
eS
P400
feature

Step 2a: Generate tape or transfer file for installation on AS/400If you are installing from tape, you need to create a job that will enable you to transfer theSP400 feature code from the SMP-installed target library member, DRL150.SDRLA400(DRLAS400), to tape. To do this, modify the sample JCL contained in the partitioned dataset member DRL150.SDRLCNTL (DRLJA400)
Run the job you have created. This produces a tape that contains the savefile used to installthe SP400 feature on the AS/400, (see Step 2c).
If you use your network to transfer the file DRL150.SDRLA400 (DRLA400V) to theAS/400, use NJE or NetView to perform the transfer. This produces the savefile used toinstall the SP400 feature on the AS/400, (see Step 2d).
Step 2b: Sign on to the AS/400 as QSECOFRSet the QSECOFR message queue in breakmode.
Step 2c: Restore DRLLIB library from tape1. Mount the installation tape.
2. Get the system name for the tape device and the data file label. The data file label isDRL.CODE.
3. Run RSTLIB and press F4. The following window is displayed:
Step 2d: Restore DRLLIB library from DRLINST savefileTo restore the DRLLIB library:
1. Use the CRTSAVF command to create a temporary savefile called QGPL/DRLINST.
2. Receive the file you received from the OS/390 system into the QGPL/DRLINSTsavefile.
3. Run the RSTLIB command to restore the DRLLIB library.
Restore Library (RSTLIB)
Type choices, press Enter.
Saved library. . . . . . . . . . > DRLLIB____ Name, *NONSYS, *ALLDevice . . . . . . . . . . . . . > TAP01_____ Name, *SAVF
+ for more values __________Volume identifier . . . . . . . *MOUNTED Character value, *SAVVOL
+ for more values ________Sequence number . . . . . . . . *SEARCH 1-9999, *SEARCHLabel . . . . . . . . . . . . . > DRL.CODE__ *SAVLIBEnd of tape option . . . . . . . *REWIND___ *REWIND, *LEAVE, *UNLOAD
F3=Exit F4=Prompt F5=Refresh F10=Additional parameters F12=CancelF13=How to use this display F24=More keys
Figure 3. Restoring SP400 library from tape
8 Release 5
||||
|||
||

4. Press F4 to see a choice of valid field options. See Figure 4:
5. Use the DSPLIB command to display the library. See Figure 5:
6. Check that all objects in the library have been restored. There are 17 objects in DRLLIB.Figure 5 on page 9 shows an example with the first 11 objects restored. To see theremaining objects, press PageDown.
Restore Library (RSTLIB)
Type choices, press Enter.
Saved library . . . . . . . . . > DRLLIB____ Name, *NONSYS, *ALLUSRDevice . . . . . . . . . . . . . > *SAVF_____ Name, *SAVF
+ for more values __________Save file . . . . . . . . . . . > DRLINST___ Name
Library . . . . . . . . . . . > QGPL______ Name, *LIBL, *CURLIB
Additional Parameters
Option . . . . . . . . . . . . . *ALL_ *ALL, *NEW, *OLD, *FREEData base member option . . . . *MATCH *MATCH, *ALL, *NEW, *OLDDate when saved . . . . . . . . ________ DateTime when saved . . . . . . . . ________ TimeAllow object differences . . . . *NONE *NONE, *ALLRestore to library . . . . . . . *SAVLIB___ Name, *SAVLIBAuxiliary storage pool ID . . . *SAVASP 1-16, *SAVASPOutput . . . . . . . . . . . . . *NONE_ *NONE, *PRINT
F3=Exit F4=Prompt F5=Refresh F12=Cancel F13=How to use this displayF24=More keys
Figure 4. Restoring SP400 library from savefile
Display Library
Library . . . . . . : DRLLIB Number of objects . : 17Type . . . . . . . . : PROD ASP of library . . . : 1Create authority . . : *SYSVAL
Type options, press Enter.5=Display full attributes 8=Display service attributes
Opt Object Type Attribute Freed Size TextDRL601C *PGM C NO 10240DRL602A *PGM CLP NO 19456DRL602C *PGM C NO 9728DRL603A *PGM CLP NO 13824DRL603I *PGM NO 2048DRL605A *PGM CLP NO 5632DRL802I *PGM NO 3072DRLMSGF *MSGF NO 14848DRLDTA *FILE SAVF NO 153600SAVSPDTA *CMD NO 2048 Save SP400 dataSTRSPSRV *CMD NO 1024 Start SP400 server
More...F3=Exit F12=Cancel F17=Top F18=Bottom(C) COPYRIGHT IBM CORP. 1980, 2000.
Figure 5. Listing of objects contained in DRLLIB
9AS/400 System Performance Feature Guide and Reference
2.Im
plem
entin
gth
eS
P400
feature

Step 2e: Restore DRLDTA database library from DRLDTA savefile1. Run the RSTLIB command to restore the DRLDTA library, then press F4 to see a choice
of valid field options.
2. Specify the DRLLIB/DRLDTA savefile as the SAVF parameter.
3. Use the DSPLIB command to display the library, see Figure 7 on page 11:
Restore Library (RSTLIB)
Type choices, press Enter.
Saved library . . . . . . . . . > DRLDTA____ Name, *NONSYS, *ALLUSRDevice . . . . . . . . . . . . . > *SAVF_____ Name, *SAVF
+ for more values __________Save file . . . . . . . . . . . > DRLDTA____ Name
Library . . . . . . . . . . . > DRLLIB____ Name, *LIBL, *CURLIB
Additional Parameters
Option . . . . . . . . . . . . . *ALL_ *ALL, *NEW, *OLD, *FREEData base member option . . . . *MATCH *MATCH, *ALL, *NEW, *OLDDate when saved . . . . . . . . ________ DateTime when saved . . . . . . . . ________ TimeAllow object differences . . . . *NONE *NONE, *ALLRestore to library . . . . . . . *SAVLIB___ Name, *SAVLIBAuxiliary storage pool ID . . . *SAVASP 1-16, *SAVASPOutput . . . . . . . . . . . . . *NONE_ *NONE, *PRINT
F3=Exit F4=Prompt F5=Refresh F12=Cancel F13=How to use this displayF24=More keys
Figure 6. Restoring DRLDTA database library from DRLDTA savefile
10 Release 5
||
|

4. Check that all objects in the library in the library have been restored. There are 11objects delivered in DRLDTA.
Step 2f: Add Library DRLLIB to your library listTo obtain the correct library list to use with SP400 feature, add DRLLIB to the initial librarylist of the job description to be used, as shown in Figure 8 on page 12. Do the same for theDRLDTA library. These library list entries could also be added to the user part of the systemlibrary list. All users of the system would then have access to the SP400 feature.
Display Library
Library . . . . . . : DRLDTA Number of objects . : 11Type . . . . . . . . : PROD ASP of library . . . : 1Create authority . . : *SYSVAL
Type options, press Enter.5=Display full attributes 8=Display service attributes
Opt Object Type Attribute Freed Size TextDRLQACG *FILE PF NO 8704 P.R. SP400 accountiDRLQDSK *FILE PF NO 16384 Disk drive performaDRLQHDW *FILE PF NO 11776 Outfile for DSPLCLHDRLQHST *FILE PF NO 8192DRLQPOL *FILE PF NO 13824 Storage pool perforDRLQSYS *FILE PF NO 40448 General system perfSAVSPDTA *DTAARA NO 512 P.R. SP400 data capDRLQHST *USRSPC NO 33280 P.R.s SP400 HistoryDRL602A *USRSPC NO 10752 User Space for SP40DRL605A *USRSPC NO 1024 User Space for SP40
BottomF3=Exit F12=Cancel F17=Top F18=Bottom(C) COPYRIGHT IBM CORP. 1980, 2000.
Figure 7. Listing of objects contained in DRLDTA library
11AS/400 System Performance Feature Guide and Reference
||||
2.Im
plem
entin
gth
eS
P400
feature

Run the GO SPMAIN command. This enables the SP400 feature main menu.
Log files and data capture on the AS/400This section describes:
¶ The OS/400 log files, their format and record lengths
¶ The use of SP400 feature in capturing data on the AS/400
¶ The transfer of the captured performance data files to OS/390
OS/400 log files descriptionThe log files to be transferred to OS/390 must have a format that is acceptable toPerformance Reporter. To distinguish between data from different systems, the SP400 featureuses a column called SYSTEMID containing the name of the system. However, OS/400 logsdo not usually contain this information. Therefore the first record in all log files transferredmust be a SOURCE record, with the following layout:
1...+....10...+....20...+....30...+....40...+....50...+....60..SOURCE netname systemid logtype version
The fields have the following format:
SOURCE Must be coded in columns 1-6.
netname Is the network name of the AS/400 and must be coded in columns 8-15.
systemid Is the system identification of the AS/400 and must be coded in columns16-23.
logtype Is the OS/400 log type used and must be coded in columns 50-57. For eachOS/400 log, a specific entry is required in this field, as shown in Table 1 onpage 13.
Add Library List Entry (ADDLIBLE)
Type choices, press Enter.
Library . . . . . . . . . . . . DRLLIB____ NameLibrary list position:
List position . . . . . . . . *LAST___ *FIRST, *LAST, *AFTER.Reference library . . . . . . __________ Name
F3=Exit F4=Prompt F5=Refresh F12=Cancel F13=How to use this displayF24=More keys
Figure 8. Adding DRLLIB to the library list of a job
12 Release 5
||

version Is the OS/400 system version and must be coded in columns 57-62 in theform VxRyNz.
All log files must have fixed length records. For each log file, the following table gives therecord length, and the entry required in columns 50-57 of the log file’s first record.
Table 1. Record lengths and logtype entries for OS/400 logsOS/400 log Record length Logtype entry (pos. 50-57
of 1st record)OS/400 version
QACGJRN 310
344
JOURNAL V3R2 to V4R1
V4R2 and later
QRZALLF 318
322
330
CONFIG V3R2 to V4R2
V4R3 to V4R4
V4R5 and later
QHST 142 HISTORY V3R2 and later
QAPMSYS 3110
3250
3268
3288
PMSYS V3R2 to V3R6
V3R7 to V4R3
V4R4
V4R5 and later
QAPMDISK 267
346
352
PMDISK V3R2 to V4R1
V4R2 to V4R3
V4R4 and later
QAPMOOL 95 PMPOOL V3R2 and later
To see how these OS/400 logs are used as the input to the SP400 feature log and recorddefinitions, see “Description of record definitions and logs” on page 31.
Capturing data on the AS/400 with SP400 featureAn application for capturing data is delivered with the SP400 feature and is installed on allAS/400 systems. This application allows you to capture data without needing to know thedetailed format requirements for log files.
The following example shows you how to use the data capturing application.
1. Display the Main Menu window, as shown below:
13AS/400 System Performance Feature Guide and Reference
|||
||||
||||
||||||
||||||
||||
||||||||
||||||||
||||||
||||||
||||
2.Im
plem
entin
gth
eS
P400
feature

2. From the SP400 Main Menu window, select option 1, then press Enter. The followingwindow is displayed:
3. Press Enter to start the SP400 monitor.
The SP400 monitoring job runs, by default, in the QCTL subsystem . When the SP400 isactive, the message DRL8003 is sent to the system history log. You can specify howoften the message is sent to the history log using the Time Interval parameter shown in
SPMAIN Performance Reporter SP400 Main MenuSystem: S44A0061
Select one of the following:
1. Start SP400 monitor2. Start SP400 data capturing3. Initialize tape4. Save SP400 data
90. Signoff
Selection or command===> _________________________________________________________________________________________________________________________________________________________F3=Exit F4=Prompt F9=Retrieve F12=Cancel(C) COPYRIGHT IBM CORP. 1994, 2000.
Figure 9. SP400 Main Menu
Start Performance Reporter SP400 Server (STRSPSRV)
Type choices, press Enter.
Time interval . . . . . . . . . 5______ Number of minutesJob queue . . . . . . . . . . . QCTL___ NameLibrary . . . . . . . . . . . . *LIBL__ Name, *LIBL, *CURLIB
BottomF3=Exit F4=Prompt F5=Refresh F12=Cancel F13=How to use this displayF24=More keys
Figure 10. Start Performance Reporter SP400 server (STRSPSRV)
14 Release 5
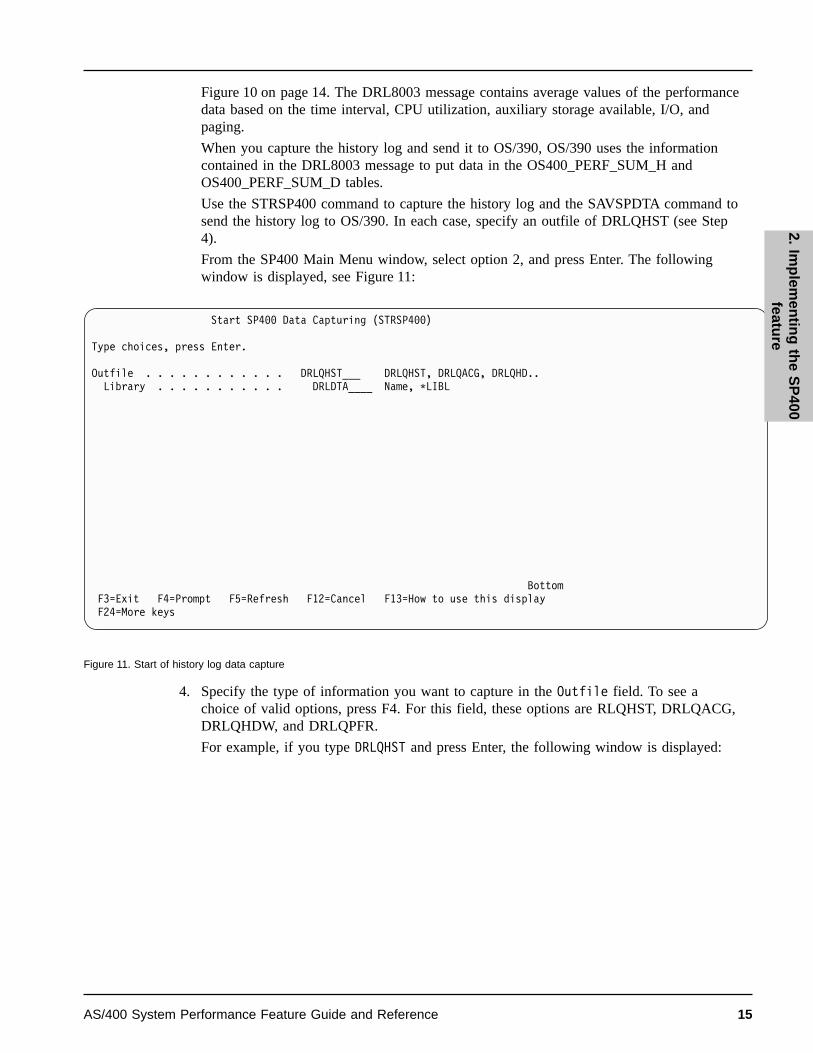
Figure 10 on page 14. The DRL8003 message contains average values of the performancedata based on the time interval, CPU utilization, auxiliary storage available, I/O, andpaging.
When you capture the history log and send it to OS/390, OS/390 uses the informationcontained in the DRL8003 message to put data in the OS400_PERF_SUM_H andOS400_PERF_SUM_D tables.
Use the STRSP400 command to capture the history log and the SAVSPDTA command tosend the history log to OS/390. In each case, specify an outfile of DRLQHST (see Step4).
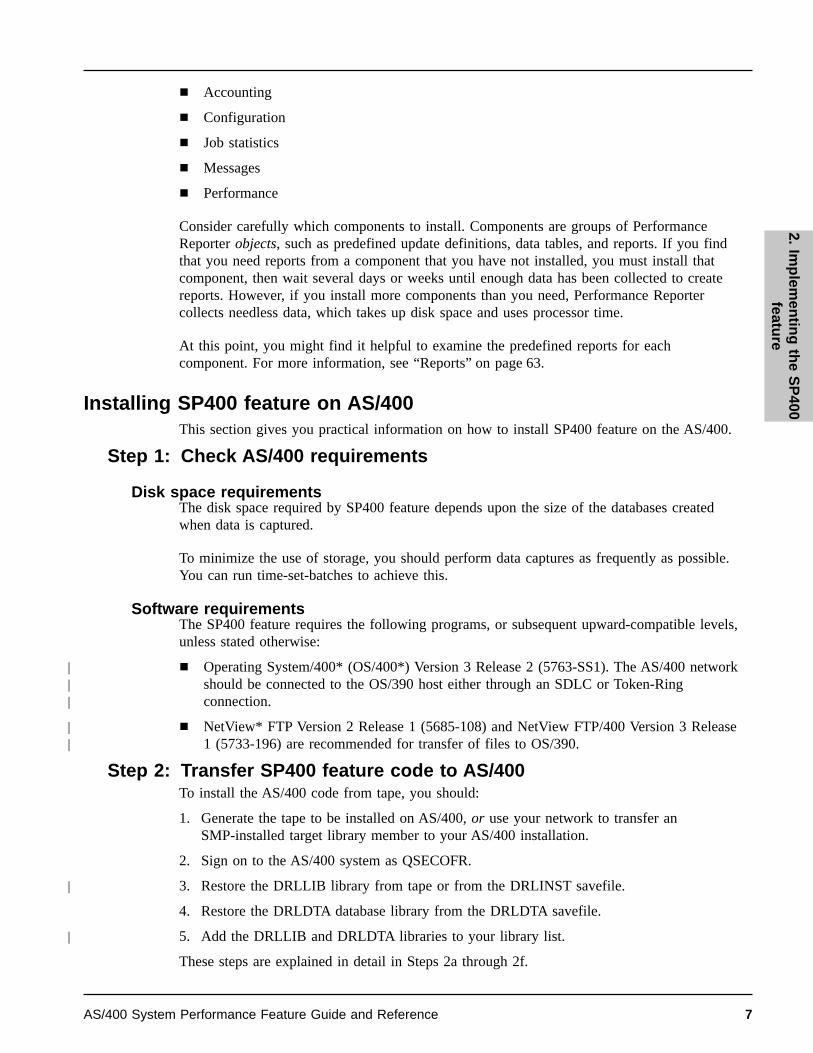
From the SP400 Main Menu window, select option 2, and press Enter. The followingwindow is displayed, see Figure 11:
4. Specify the type of information you want to capture in the Outfile field. To see achoice of valid options, press F4. For this field, these options are RLQHST, DRLQACG,DRLQHDW, and DRLQPFR.
For example, if you type DRLQHST and press Enter, the following window is displayed:
Start SP400 Data Capturing (STRSP400)
Type choices, press Enter.
Outfile . . . . . . . . . . . . DRLQHST___ DRLQHST, DRLQACG, DRLQHD..Library . . . . . . . . . . . DRLDTA____ Name, *LIBL
BottomF3=Exit F4=Prompt F5=Refresh F12=Cancel F13=How to use this displayF24=More keys
Figure 11. Start of history log data capture
15AS/400 System Performance Feature Guide and Reference
2.Im
plem
entin
gth
eS
P400
feature

5. The fields under the heading Time period for log output specify when the datacapture starts and ends. Figure 12 shows the default values. Data is captured from thesystem history log, based on these values. If the defaults are used, the command goesback to the last time the command was run and captures all the logged message datafrom that time up to the present.
The first time that the command is run using the defaults, data is captured from thebeginning of all the history files on the system. The maximum number of history filesthat the SP400 feature can capture is 273. When this number is reached, the DRL000Dmessage prompts you to save and delete old history files until fewer than 274 remain.
When you press Enter, the data is captured and placed in the DRLQHST outfile. You canthen send the data to OS/390 using the SAVSPDTA command.
Note: When you select DRLQHDW as the outfile to capture hardware data, there are nostart and end time entries.
When you select DRLQPFR as the outfile to capture performance data, noDRLQPRF output file is produced. Output files are produced when you selectDRLQHDW, DRLQHST, and DRLQACG as the outfile.
The command STRSP400 with DRLQPRF as the outfile starts the performancemonitor job. Later, when you run the SAVSPDTA command with DRLQPFR asthe outfile, the output files DRLQSYS, DRLQDSK, and DRLQPOL are producedand transmitted.
6. In the following window, type:¶ The number of days, hours, and minutes that you want the performance monitor to
run¶ The time interval, in minutes, that you want to set between collections of
performance data¶ The type of internal trace that you want to start
Start SP400 Data Capturing (STRSP400)
Type choices, press Enter.
Outfile . . . . . . . . . . . . DRLQHST___ DRLQHST, DRLQACG, DRLQHD..Library . . . . . . . . . . . DRLDTA____ Name, *LIBL
Time period for log output:Start time and date:Beginning time . . . . . . . . *AVAIL____ Time, *AVAILBeginning date . . . . . . . . *BEGIN____ Date, *BEGIN, *CURRENTEnd time and date:Ending time . . . . . . . . . *AVAIL____ Time, *AVAILEnding date . . . . . . . . . *CURRENT__ Date, *CURRENT
BottomF3=Exit F4=Prompt F5=Refresh F12=Cancel F13=How to use this displayF24=More keys
Figure 12. Set time period parameter for data capturing
16 Release 5
7. Press Enter to start the performance monitor job.
Transferring captured data files to OS/390There are several methods of transferring captured data to OS/390, the one you choosedepends upon the facilities you have available in your environment.
An easy method of transferring captured data to OS/390 involves using the SP400 featureautomatic saving tape. To copy the files on the save tape to a disk accessible byPerformance Reporter:
1. Select option 3 from the main menu, and press Enter. The following window isdisplayed:
Start SP400 Data Capturing (STRSP400)
Type choices, press Enter.
Outfile . . . . . . . . . . . . > DRLQPFR___ DRLQHST, DRLQACG, DRLQH...Library . . . . . . . . . . . DRLDTA____ Name, *LIBLMember . . . . . . . . . . . . . *GEN______ Name, *GENLibrary . . . . . . . . . . . . DRLDTA____ NameDay . . . . . . . . . . . . . . 0_____ 0-7Hour . . . . . . . . . . . . . . 2_____ 0-999Minute . . . . . . . . . . . . . 0_____ 0-99Interval . . . . . . . . . . . . 15____ 5, 10, 15, 20, 25, 30,...Trace . . . . . . . . . . . . . *NONE_ *ALL, *NONE
BottomF3=Exit F4=Prompt F5=Refresh F12=Cancel F13=How to use this displayF24=More keys
Figure 13. Start of OS/400 performance monitor to create performance logs
17AS/400 System Performance Feature Guide and Reference
2.Im
plem
entin
gth
eS
P400
feature

2. On TAP01, mount a tape with a density supported by OS/390. The tape must also bevalid for this device and for the device you intend to use on OS/390. To display a list oftape densities in AS/400, press F4. Press Enter to initialize this tape.
3. When you have initialized the tape, select Option 4 (save SP400 data) and press Enter.The following window is displayed:
Initialize Tape (INZTAP)
Type choices, press Enter.
Tape device . . . . . . . . . . > TAP01_____ NameNew volume identifier . . . . . > *NONE_____ Character value, *NONETape density . . . . . . . . . . > *DEVTYPE___ *DEVTYPE, *FMT3480...
BottomF3=Exit F4=Prompt F5=Refresh F12=Cancel F13=How to use this displayF24=More keys
Figure 14. Initialization of tape for data transfer to Performance Reporter
Specify Value for Parameter DENSITY
Type choice, press Enter.
Tape density . . . . . . . . . . > *DEVTYPE___
*DEVTYPE*FMT3480*FMT3490E*QIC130*QIC525*QIC1000
16003200625010000160003800043200
F3=Exit F5=Refresh F12=Cancel F13=How to use this display F24=More keys
Figure 15. Density values
18 Release 5

4. Type the names of all the files you want to save or specify *ALL, then press Enter tostart this function.
Note: If you select DLRQPFR or *ALL in the File field, you are prompted to completetwo additional fields. In the Member field, specify either the name of the memberyou want to save from the AS/400 Performance files, or *SP400 if you want tosave all available members.
In the Delete unused perf files field, specify *YES or *NO depending on whetheror not you want to save the performance files that were captured but not used.
Additional methods of transferring data to OS/390You can also use one of the following methods to transfer data to OS/390:
NJE connectionIf you have an NJE connection to OS/390, you can use NJE instead of tape. In this case,specify *NJE in the File transfer type field in Figure 16.
User exit programYou can use a user exit program. In this case, specify *USER in the File transfer typefield in Figure 16.
To use this method:¶ You must first create a user exit program and a data area.¶ The user program must reside in a library on the library list. It must define the Library
and File parameters because it will be called from the SP400 feature with the library andfile names of the files you want to transfer.
Save Performance Reporter SP400 data (SAVSPDTA)
Type choices, press Enter.
File . . . . . . . . . . . . . . *ALL______ *ALL, DRLQHST, DRLQACG+ for more values __________
Library . . . . . . . . . . . . DRLDTA____ Name, *LIBL, *CURLIBMember . . . . . . . . . . . . *SP400____ Name, *SP400Delete unused perf. files . . . *NO_______ *NO, *YESFile transfer type . . . . . . . *TAPE *TAPE, *NJE, *USER
F3=Exit F4=Prompt F5=Refresh F12=Cancel F13=How to use this displayF24=More keys
Figure 16. The SAVSPDTA command window
19AS/400 System Performance Feature Guide and Reference
2.Im
plem
entin
gth
eS
P400
feature

¶ The user data area must have the name DRLDTA/USERDTAARA, and the programname must reside in the first 10 characters of the user data area. The first time that theSAVSPDTA command is executed with *USER specified in the File transfer type,the command creates the DRLDTA/USERDTAARA data area. You must add theprogram name to this data area.
NetView FTPYou can use the NetView File Transfer Program. This method requires some programmingwork.
Remote job entryYou can use Remote Job Entry (RJE). This method requires some programming work.
Installing SP400 feature components on the OS/390 systemAfter the system programmer has successfully installed the Performance Reporter base andfeatures, choose the feature components you want to load. Performance Reporter installs thenecessary log and record definitins, log procedure, and update definitions to PerformanceReporter system tables. Performance Reporter also installs the predefined tables (described inData tables and lookup tables) and reports (described in Reports).
Each component of the SP400 feature is optional. To avoid wasting system resources, installonly the SP400 feature components that meet your requirements. Use the administrationdialog to select which components of the SP400 feature to install.
To install SP400 feature components:
1. From the Performance Reporter Administration window ( see Figure 17), select 2,Components, and press Enter.
Other Utilities Help--------------------------------------------------------------------------
Performance Reporter Administration
Select one of the following. Then press Enter.
2_ 1. System2. Components3. Logs4. Tables5. Reports
Command ===> ______________________________________________________________F1=Help F2=Split F3=Exit F9=Swap F10=Actions F12=Cancel
Figure 17. Performance Reporter Administration window
20 Release 5

The Components window is displayed, see Figure 18:
2. From the Components window, select the components to install (here, the AS/400accounting component), and press F6. The Installation Options window is displayed:
Components Other Help------------------------------------------------------------------------------
Components ROW 1 TO 13 OF 47
Select one or more components. Then press Enter to Open component.
/ Components Status Date_ Network Line Utilization Component Installed 93-03-19_ Network NetView FTP Component Installed 93-03-19_ Network NPM Internal Utilization Component Installed 93-03-19_ Network NV/SM Internal Utilization Component Installed 93-03-19_ Network Problem Component Installed 93-03-19_ Network RTM Response Time Component Installed 93-03-19_ Network Service Component Installed 93-03-19_ DB2 Component Installed 93-03-17/ OS/400 Accounting Component_ OS/400 Configuration Component_ OS/400 Jobs Component_ OS/400 Messages Component_ OS/400 Performance Component
Command ===> _________________________________________________________________F1=Help F2=Split F3=Exit F5=New F6=Install F7=BkwdF8=Fwd F9=Swap F10=Actions F12=Cancel
Figure 18. Components window
Components Other Help.-----------------------------------------------------------------------------.| ROW 1 TO 7 OF 7 || .--------------------------------------------------------------. || S| Installation Options | Enter. || | | || /| Select one of the following. Then press Enter. |Date || /| | || _| __ 1. Online | || _| 2. Batch | || _| | || _| F1=Help F2=Split F6=Objects F9=Swap F12=Cancel | || _.--------------------------------------------------------------. || _ || ***************************** BOTTOM OF DATA ****************************** || || || || || || Command ===> ______________________________________________________________ || F1=Help F2=Split F7=Bkwd F8=Fwd F9=Swap F12=Cancel |'-----------------------------------------------------------------------------'F18=Fwd F9=Swap F10=Actions F12=Cancel
Figure 19. Installation Options window
21AS/400 System Performance Feature Guide and Reference
2.Im
plem
entin
gth
eS
P400
feature
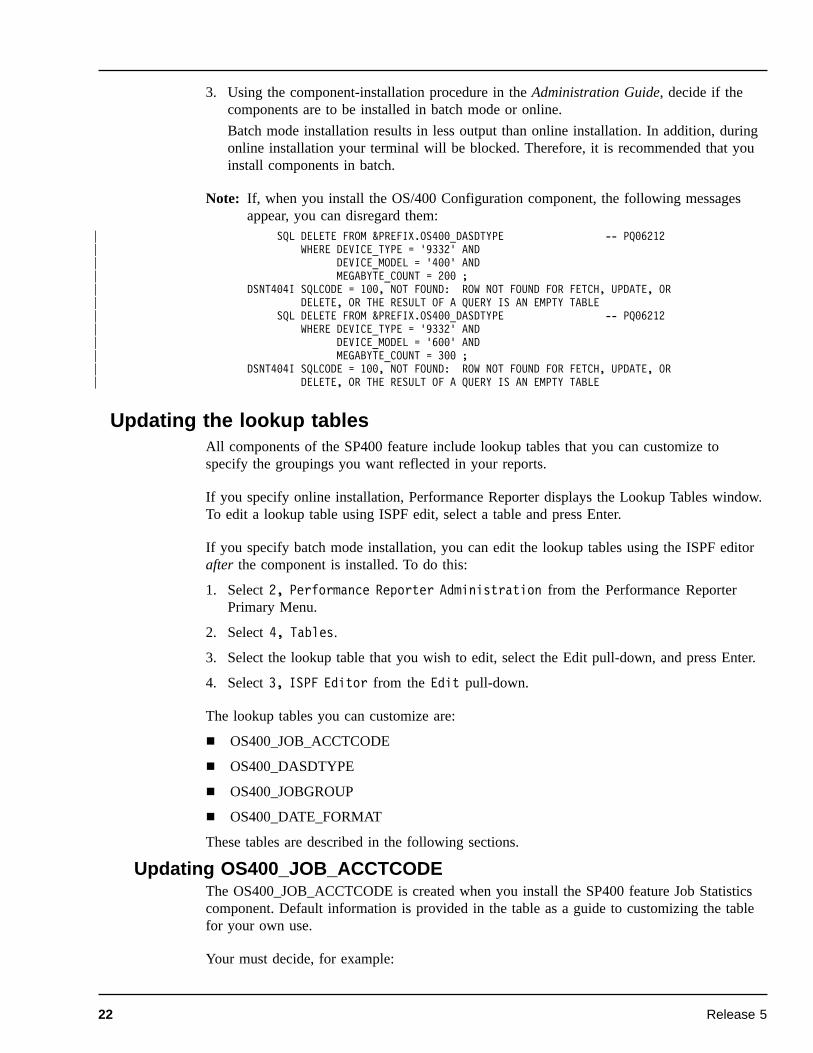
3. Using the component-installation procedure in the Administration Guide, decide if thecomponents are to be installed in batch mode or online.
Batch mode installation results in less output than online installation. In addition, duringonline installation your terminal will be blocked. Therefore, it is recommended that youinstall components in batch.
Note: If, when you install the OS/400 Configuration component, the following messagesappear, you can disregard them:
SQL DELETE FROM &PREFIX.OS400_DASDTYPE -- PQ06212WHERE DEVICE_TYPE = '9332' AND
DEVICE_MODEL = '400' ANDMEGABYTE_COUNT = 200 ;
DSNT404I SQLCODE = 100, NOT FOUND: ROW NOT FOUND FOR FETCH, UPDATE, ORDELETE, OR THE RESULT OF A QUERY IS AN EMPTY TABLE
SQL DELETE FROM &PREFIX.OS400_DASDTYPE -- PQ06212WHERE DEVICE_TYPE = '9332' AND
DEVICE_MODEL = '600' ANDMEGABYTE_COUNT = 300 ;
DSNT404I SQLCODE = 100, NOT FOUND: ROW NOT FOUND FOR FETCH, UPDATE, ORDELETE, OR THE RESULT OF A QUERY IS AN EMPTY TABLE
Updating the lookup tablesAll components of the SP400 feature include lookup tables that you can customize tospecify the groupings you want reflected in your reports.
If you specify online installation, Performance Reporter displays the Lookup Tables window.To edit a lookup table using ISPF edit, select a table and press Enter.
If you specify batch mode installation, you can edit the lookup tables using the ISPF editorafter the component is installed. To do this:
1. Select 2, Performance Reporter Administration from the Performance ReporterPrimary Menu.
2. Select 4, Tables.
3. Select the lookup table that you wish to edit, select the Edit pull-down, and press Enter.
4. Select 3, ISPF Editor from the Edit pull-down.
The lookup tables you can customize are:
¶ OS400_JOB_ACCTCODE
¶ OS400_DASDTYPE
¶ OS400_JOBGROUP
¶ OS400_DATE_FORMAT
These tables are described in the following sections.
Updating OS400_JOB_ACCTCODEThe OS400_JOB_ACCTCODE is created when you install the SP400 feature Job Statisticscomponent. Default information is provided in the table as a guide to customizing the tablefor your own use.
Your must decide, for example:
22 Release 5
||||||||||||

¶ Which account codes are to be used?
¶ Are account codes to be different for batch and for online jobs types?
¶ Which account codes should users be allocated?
¶ Should certain job names carry specific account codes?
A sample of the lookup table contents is given in “OS400_JOB_ACCTCODE” on page 58.
Updating OS400_DASDTYPEThe SP400 feature uses the OS400_DASDTYPE table when Performance Componentreports are produced.
The table contains information about OS/400 device types, model information, and theircapacity (in megabytes). You must update this table whenever additional devices areinstalled.
A sample of the lookup table contents is given in “OS400_DASDTYPE” on page 58.
Updating OS400_DATE_FORMATThe OS400_DATE_FORMAT table is created when you install the SP400 feature JobStatistics component or Accounting component.
You must complete the table if the the system date format or the job date format in yourAS/400 system is not MDY.
In that instance, you must specify:
¶ The AS/400 system ID
¶ The system date format (use the DSPSYSVAL QDAFTMT AS/400 command to find theformat)
¶ The job date format (display your Job Definition attribute and use its Date Format)
Updating OS400_JOBGROUPAll jobs are grouped automatically by the SP400 feature when a job is started. Performancedata is collected and categorized on the basis of the job group number.
When the reports “OS/400 Perf CPU & Trans by Job Group, Hourly Trend” and “OS/400Perf CPU by Job Group, Hourly Trend” are being produced, the SP400 feature uses thislookup table to find a job group name from a job group number.
A sample of the lookup table contents is given in “OS400_JOBGROUP” on page 60.
A description of each of the job group types, together with an example of their use in aperformance report, are given in “Explanation of job group types” on page 97.
After installation is complete, Performance Reporter returns to the Components window, andthe Status field indicates that the component is installed.
23AS/400 System Performance Feature Guide and Reference
2.Im
plem
entin
gth
eS
P400
feature

Collecting data under Performance ReporterThis section describes:
¶ The JCL for a general COLLECT job
¶ The JCL for a COLLECT job in which specific Performance Reporter tables are updated
¶ Backup and delete procedure when the COLLECT is completed
General COLLECT JobThe member DRL150.SDRLCNTL(DRLJCOLL) contains sample JCL for a general collect.
Another way to obtain the COLLECT JCL, is to:
1. Select 2, Performance Reporter Administration from the Performance ReporterPrimary Menu.
2. Select 3, Logs.
3. Select AIX from the list of logs. Select the Utilities pull-down, and press Enter.
4. Select 1, Collect.
5. Type your installation-specific information in this window, and press Enter.
The example given in Figure 20 is for the accounting component. However for othercomponents the collect JCL differs only by the data set name for DRLLOG, the name of thelog definition (OS400_JOURNAL in the following example), and the table names used withthe INCLUDE.
JCL examples for each component are included when you install the SP400 feature.
//JOBCARD//* *//* Notes: *//* Before you submit the job: *//* - Check the P.R. and DB2 data set names. *//* - Check the DB2 subsystem name (default is DSN) *//* and P.R. system table prefix (default is DRLSYS). *//* - Insert the correct collect statement in DRLIN *//* - Specify the name of the log data set in DRLLOG *//* - In this example, ALL tables for the accounting *//* component will be included in the COLLECT *//* *//***************************************************************//COLLECT EXEC PGM=DRLPLC,PARM=('SYSTEM=DB2A SYSPREFIX=DRLSYS')//STEPLIB DD DISP=SHR,DSN=DRL150.SDRLLOAD// DD DISP=SHR,DSN=DSN410.DSNLOAD//DRLIN DD *
COLLECT OS400_JOURNAL;
//DRLLOG DD DISP=SHR,DSN=TEST.QACGJRN.LOG1//DRLOUT DD SYSOUT=*,DCB=(RECFM=F,LRECL=80)//DRLDUMP DD SYSOUT=*,DCB=(RECFM=VB,LRECL=32756)/*
Figure 20. General COLLECT job
24 Release 5
|
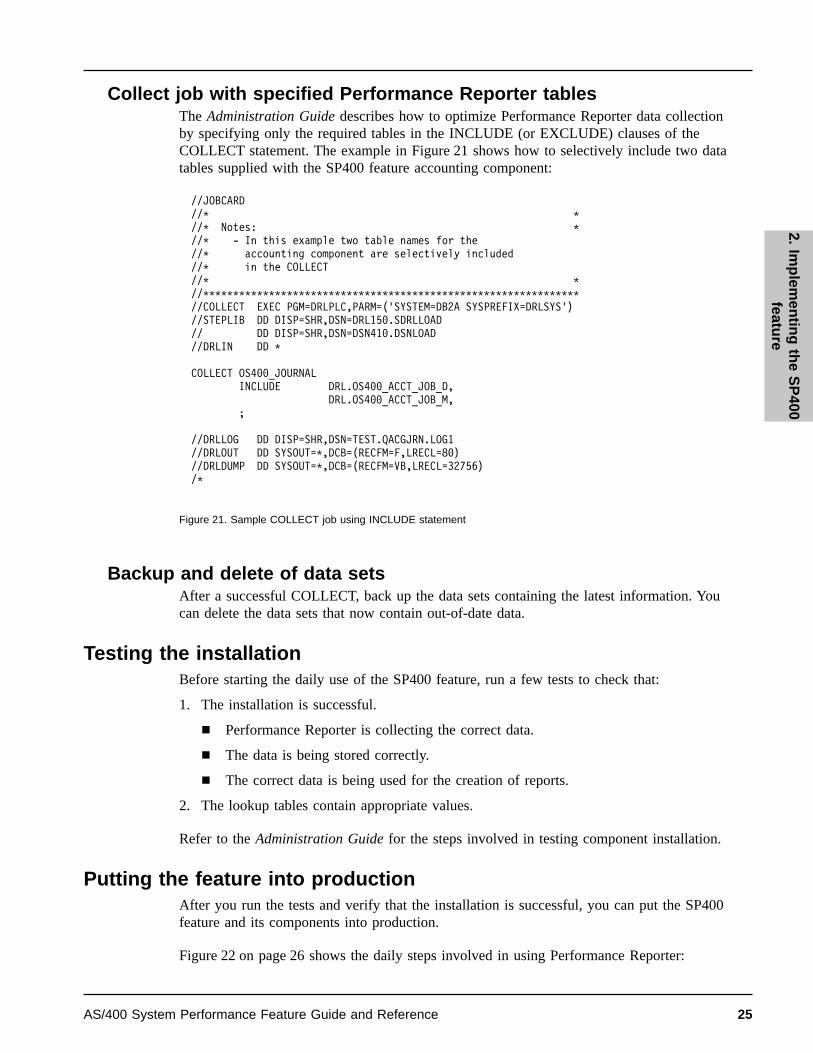
Collect job with specified Performance Reporter tablesThe Administration Guide describes how to optimize Performance Reporter data collectionby specifying only the required tables in the INCLUDE (or EXCLUDE) clauses of theCOLLECT statement. The example in Figure 21 shows how to selectively include two datatables supplied with the SP400 feature accounting component:
Backup and delete of data setsAfter a successful COLLECT, back up the data sets containing the latest information. Youcan delete the data sets that now contain out-of-date data.
Testing the installationBefore starting the daily use of the SP400 feature, run a few tests to check that:
1. The installation is successful.
¶ Performance Reporter is collecting the correct data.
¶ The data is being stored correctly.
¶ The correct data is being used for the creation of reports.
2. The lookup tables contain appropriate values.
Refer to the Administration Guide for the steps involved in testing component installation.
Putting the feature into productionAfter you run the tests and verify that the installation is successful, you can put the SP400feature and its components into production.
Figure 22 on page 26 shows the daily steps involved in using Performance Reporter:
//JOBCARD//* *//* Notes: *//* - In this example two table names for the//* accounting component are selectively included//* in the COLLECT//* *//***************************************************************//COLLECT EXEC PGM=DRLPLC,PARM=('SYSTEM=DB2A SYSPREFIX=DRLSYS')//STEPLIB DD DISP=SHR,DSN=DRL150.SDRLLOAD// DD DISP=SHR,DSN=DSN410.DSNLOAD//DRLIN DD *
COLLECT OS400_JOURNALINCLUDE DRL.OS400_ACCT_JOB_D,
DRL.OS400_ACCT_JOB_M,;
//DRLLOG DD DISP=SHR,DSN=TEST.QACGJRN.LOG1//DRLOUT DD SYSOUT=*,DCB=(RECFM=F,LRECL=80)//DRLDUMP DD SYSOUT=*,DCB=(RECFM=VB,LRECL=32756)/*
Figure 21. Sample COLLECT job using INCLUDE statement
25AS/400 System Performance Feature Guide and Reference
2.Im
plem
entin
gth
eS
P400
feature

You can run reports in batch, after setting batch parameters for each report using theadministration dialog.
For detailed information about these steps, refer to the Administration Guide.
Check that thefile transferprogram hastransferred data
RunCOLLECTjob
Performdatabasemaintenance
Createreports
Figure 22. Daily steps involved in using Performance Reporter
26 Release 5
II — ReferenceChapter 3. Data flow and Performance Reporter objects . . . . . . . . . . . . . . . . 29SP400 feature general data flow . . . . . . . . . . . . . . . . . . . . . . . . . . . . . . . . . . . . . . . . . . . . . . . . . . . . . . . 30
Description of record definitions and logs . . . . . . . . . . . . . . . . . . . . . . . . . . . . . . . . . . . . . . . . . . . . . . 31SP400 feature accounting component data flow . . . . . . . . . . . . . . . . . . . . . . . . . . . . . . . . . . . . . . . . . . . . 33
Where to look for further information . . . . . . . . . . . . . . . . . . . . . . . . . . . . . . . . . . . . . . . . . . . . . . . . . 33SP400 feature configuration component data flow . . . . . . . . . . . . . . . . . . . . . . . . . . . . . . . . . . . . . . . . . . 34
Where to look for further information . . . . . . . . . . . . . . . . . . . . . . . . . . . . . . . . . . . . . . . . . . . . . . . . . 35SP400 feature job statistics component data flow . . . . . . . . . . . . . . . . . . . . . . . . . . . . . . . . . . . . . . . . . . . 36
Where to look for further information . . . . . . . . . . . . . . . . . . . . . . . . . . . . . . . . . . . . . . . . . . . . . . . . . 36SP400 feature messages component data flow . . . . . . . . . . . . . . . . . . . . . . . . . . . . . . . . . . . . . . . . . . . . . 37
Where to look for further information . . . . . . . . . . . . . . . . . . . . . . . . . . . . . . . . . . . . . . . . . . . . . . . . . 38SP400 feature performance component data flow . . . . . . . . . . . . . . . . . . . . . . . . . . . . . . . . . . . . . . . . . . . 39
Where to look for further information . . . . . . . . . . . . . . . . . . . . . . . . . . . . . . . . . . . . . . . . . . . . . . . . . 40
Chapter 4. Data tables and lookup tables. . . . . . . . . . . . . . . . . . . . . . . . . . . . . . . . . 41Naming standard for tables . . . . . . . . . . . . . . . . . . . . . . . . . . . . . . . . . . . . . . . . . . . . . . . . . . . . . . . . . . . 41Table descriptions . . . . . . . . . . . . . . . . . . . . . . . . . . . . . . . . . . . . . . . . . . . . . . . . . . . . . . . . . . . . . . . . . . 42Tables in the SP400 feature accounting component . . . . . . . . . . . . . . . . . . . . . . . . . . . . . . . . . . . . . . . . . 42
OS400_ACCT_JOB_D, _M. . . . . . . . . . . . . . . . . . . . . . . . . . . . . . . . . . . . . . . . . . . . . . . . . . . . . . . . . 42OS400_ACCT_PRINT_D, _M. . . . . . . . . . . . . . . . . . . . . . . . . . . . . . . . . . . . . . . . . . . . . . . . . . . . . . . 43
Tables in the SP400 feature configuration component. . . . . . . . . . . . . . . . . . . . . . . . . . . . . . . . . . . . . . . . 43OS400_CONFIG . . . . . . . . . . . . . . . . . . . . . . . . . . . . . . . . . . . . . . . . . . . . . . . . . . . . . . . . . . . . . . . . . 44
Tables in the SP400 feature job statistics component . . . . . . . . . . . . . . . . . . . . . . . . . . . . . . . . . . . . . . . . 45OS400_JOB_STAT_D, _M . . . . . . . . . . . . . . . . . . . . . . . . . . . . . . . . . . . . . . . . . . . . . . . . . . . . . . . . . 45
Tables in the SP400 feature messages component. . . . . . . . . . . . . . . . . . . . . . . . . . . . . . . . . . . . . . . . . . . 46OS400_MSG_STAT_D, _M. . . . . . . . . . . . . . . . . . . . . . . . . . . . . . . . . . . . . . . . . . . . . . . . . . . . . . . . . 46OS400_MSG_STAT_DV, _MV . . . . . . . . . . . . . . . . . . . . . . . . . . . . . . . . . . . . . . . . . . . . . . . . . . . . . . 46
Tables in the SP400 feature performance component . . . . . . . . . . . . . . . . . . . . . . . . . . . . . . . . . . . . . . . . 47OS400_PM_DISK_H, _D . . . . . . . . . . . . . . . . . . . . . . . . . . . . . . . . . . . . . . . . . . . . . . . . . . . . . . . . . . 47OS400_PM_POOL_H, _D. . . . . . . . . . . . . . . . . . . . . . . . . . . . . . . . . . . . . . . . . . . . . . . . . . . . . . . . . . 49OS400_PM_SYS_H, _D . . . . . . . . . . . . . . . . . . . . . . . . . . . . . . . . . . . . . . . . . . . . . . . . . . . . . . . . . . . 50OS400_PM_SYS_JGR_H, _D . . . . . . . . . . . . . . . . . . . . . . . . . . . . . . . . . . . . . . . . . . . . . . . . . . . . . . . 55OS400_PERF_SUM_H, _D . . . . . . . . . . . . . . . . . . . . . . . . . . . . . . . . . . . . . . . . . . . . . . . . . . . . . . . . . 57
SP400 feature lookup tables. . . . . . . . . . . . . . . . . . . . . . . . . . . . . . . . . . . . . . . . . . . . . . . . . . . . . . . . . . . 58OS400_JOB_ACCTCODE. . . . . . . . . . . . . . . . . . . . . . . . . . . . . . . . . . . . . . . . . . . . . . . . . . . . . . . . . . 58
Example of table contents . . . . . . . . . . . . . . . . . . . . . . . . . . . . . . . . . . . . . . . . . . . . . . . . . . . . . . . . 58OS400_DASDTYPE . . . . . . . . . . . . . . . . . . . . . . . . . . . . . . . . . . . . . . . . . . . . . . . . . . . . . . . . . . . . . . 58
Example of table contents . . . . . . . . . . . . . . . . . . . . . . . . . . . . . . . . . . . . . . . . . . . . . . . . . . . . . . . . 59OS400_DATE_FORMAT. . . . . . . . . . . . . . . . . . . . . . . . . . . . . . . . . . . . . . . . . . . . . . . . . . . . . . . . . . . 60
Example of table contents . . . . . . . . . . . . . . . . . . . . . . . . . . . . . . . . . . . . . . . . . . . . . . . . . . . . . . . . 60OS400_JOBGROUP . . . . . . . . . . . . . . . . . . . . . . . . . . . . . . . . . . . . . . . . . . . . . . . . . . . . . . . . . . . . . . 60
Example of table contents . . . . . . . . . . . . . . . . . . . . . . . . . . . . . . . . . . . . . . . . . . . . . . . . . . . . . . . . 60
Chapter 5. Reports . . . . . . . . . . . . . . . . . . . . . . . . . . . . . . . . . . . . . . . . . . . . . . . . . . . . . . . . . 63Report format and general description . . . . . . . . . . . . . . . . . . . . . . . . . . . . . . . . . . . . . . . . . . . . . . . . . . . 63
Report ID . . . . . . . . . . . . . . . . . . . . . . . . . . . . . . . . . . . . . . . . . . . . . . . . . . . . . . . . . . . . . . . . . . . . . . 63Report group . . . . . . . . . . . . . . . . . . . . . . . . . . . . . . . . . . . . . . . . . . . . . . . . . . . . . . . . . . . . . . . . . . . . 64Source Tables . . . . . . . . . . . . . . . . . . . . . . . . . . . . . . . . . . . . . . . . . . . . . . . . . . . . . . . . . . . . . . . . . . . 64
27AS/400 System Performance Feature Guide and Reference

Attributes . . . . . . . . . . . . . . . . . . . . . . . . . . . . . . . . . . . . . . . . . . . . . . . . . . . . . . . . . . . . . . . . . . . . . . 64Variables . . . . . . . . . . . . . . . . . . . . . . . . . . . . . . . . . . . . . . . . . . . . . . . . . . . . . . . . . . . . . . . . . . . . . . . 64
Reports in the accounting component. . . . . . . . . . . . . . . . . . . . . . . . . . . . . . . . . . . . . . . . . . . . . . . . . . . . 65OS/400 Acct Job Accounting, Monthly Overview. . . . . . . . . . . . . . . . . . . . . . . . . . . . . . . . . . . . . . . . . 65OS/400 Acct Print Accounting, Monthly Overview. . . . . . . . . . . . . . . . . . . . . . . . . . . . . . . . . . . . . . . . 66
Reports in the configuration component . . . . . . . . . . . . . . . . . . . . . . . . . . . . . . . . . . . . . . . . . . . . . . . . . . 67OS/400 Config all Devices, Overview . . . . . . . . . . . . . . . . . . . . . . . . . . . . . . . . . . . . . . . . . . . . . . . . . 68OS/400 Config DASD Capacity Overview . . . . . . . . . . . . . . . . . . . . . . . . . . . . . . . . . . . . . . . . . . . . . . 70OS/400 Config Main Storage Overview . . . . . . . . . . . . . . . . . . . . . . . . . . . . . . . . . . . . . . . . . . . . . . . . 70OS/400 Config Device Count Type/Model, Overview. . . . . . . . . . . . . . . . . . . . . . . . . . . . . . . . . . . . . . 71OS/400 Config Device for Specific Type, Overview. . . . . . . . . . . . . . . . . . . . . . . . . . . . . . . . . . . . . . . 72
Reports in the job statistics component . . . . . . . . . . . . . . . . . . . . . . . . . . . . . . . . . . . . . . . . . . . . . . . . . . 73OS/400 Job Statistics by User, Monthly Overview . . . . . . . . . . . . . . . . . . . . . . . . . . . . . . . . . . . . . . . . 74OS/400 Job CPU Usage by User, Monthly Overview . . . . . . . . . . . . . . . . . . . . . . . . . . . . . . . . . . . . . . 74OS/400 Job Statistics All Systems, Daily Trend . . . . . . . . . . . . . . . . . . . . . . . . . . . . . . . . . . . . . . . . . . 75OS/400 Job Statistics all Systems, Monthly Trend . . . . . . . . . . . . . . . . . . . . . . . . . . . . . . . . . . . . . . . . 76OS/400 Job Statistics for a User, Monthly Overview . . . . . . . . . . . . . . . . . . . . . . . . . . . . . . . . . . . . . . 77OS/400 Job Type Statistics, Monthly Overview . . . . . . . . . . . . . . . . . . . . . . . . . . . . . . . . . . . . . . . . . . 78OS/400 Job Acct from History Log, Monthly Overview . . . . . . . . . . . . . . . . . . . . . . . . . . . . . . . . . . . . 79
Reports in the messages component . . . . . . . . . . . . . . . . . . . . . . . . . . . . . . . . . . . . . . . . . . . . . . . . . . . . . 80OS/400 Messages All Systems, Monthly Overview . . . . . . . . . . . . . . . . . . . . . . . . . . . . . . . . . . . . . . . 81OS/400 Messages Most Frequent, Daily Overview . . . . . . . . . . . . . . . . . . . . . . . . . . . . . . . . . . . . . . . . 82OS/400 Messages Most Frequent, Monthly Overview. . . . . . . . . . . . . . . . . . . . . . . . . . . . . . . . . . . . . . 83OS/400 Messages by Sev. Codes, Monthly Overview . . . . . . . . . . . . . . . . . . . . . . . . . . . . . . . . . . . . . . 84OS/400 Messages for a User, Monthly Overview . . . . . . . . . . . . . . . . . . . . . . . . . . . . . . . . . . . . . . . . . 84OS/400 Messages by Type, Monthly Overview . . . . . . . . . . . . . . . . . . . . . . . . . . . . . . . . . . . . . . . . . . 85OS/400 Messages by User Name, Monthly Overview. . . . . . . . . . . . . . . . . . . . . . . . . . . . . . . . . . . . . . 86
Reports in the performance component . . . . . . . . . . . . . . . . . . . . . . . . . . . . . . . . . . . . . . . . . . . . . . . . . . 87OS/400 Perf CPU and RTM Statistics, Hourly Trend . . . . . . . . . . . . . . . . . . . . . . . . . . . . . . . . . . . . . . 87OS/400 Perf Exception and Lock Stat, Hourly Trend . . . . . . . . . . . . . . . . . . . . . . . . . . . . . . . . . . . . . . 89OS/400 Perf Disk I/O Statistics, Hourly Trend . . . . . . . . . . . . . . . . . . . . . . . . . . . . . . . . . . . . . . . . . . . 90OS/400 Perf Disk Capacity Statistics, Hourly Trend . . . . . . . . . . . . . . . . . . . . . . . . . . . . . . . . . . . . . . . 92OS/400 Perf Disk Arm Movements, Hourly Trend . . . . . . . . . . . . . . . . . . . . . . . . . . . . . . . . . . . . . . . . 94OS/400 Perf CPU & Trans by Job Group, Hourly Trend . . . . . . . . . . . . . . . . . . . . . . . . . . . . . . . . . . . 95OS/400 Perf CPU by Job Group, Hourly Trend . . . . . . . . . . . . . . . . . . . . . . . . . . . . . . . . . . . . . . . . . . 97
Explanation of job group types . . . . . . . . . . . . . . . . . . . . . . . . . . . . . . . . . . . . . . . . . . . . . . . . . . . . 97OS/400 Perf Paging Statistics, Hourly Trend . . . . . . . . . . . . . . . . . . . . . . . . . . . . . . . . . . . . . . . . . . . . 98OS/400 Perf Storage Pool & Act Level, Hourly Trend . . . . . . . . . . . . . . . . . . . . . . . . . . . . . . . . . . . . 100OS/400 Perf Transition Statistics, Hourly Trend . . . . . . . . . . . . . . . . . . . . . . . . . . . . . . . . . . . . . . . . . 102OS/400 Perf Max & Avg CPU Usage, Hourly Trend . . . . . . . . . . . . . . . . . . . . . . . . . . . . . . . . . . . . . 103OS/400 Perf CPU Usage all Systems, Daily Overview . . . . . . . . . . . . . . . . . . . . . . . . . . . . . . . . . . . . 104OS/400 Perf Summary all Systems, Daily Overview. . . . . . . . . . . . . . . . . . . . . . . . . . . . . . . . . . . . . . 105OS/400 Perf Summary for a System, Daily Trend . . . . . . . . . . . . . . . . . . . . . . . . . . . . . . . . . . . . . . . 106OS/400 Perf Summary for a System, Hourly Trend . . . . . . . . . . . . . . . . . . . . . . . . . . . . . . . . . . . . . . 108
28 Release 5
Data flow and Performance Reporterobjects
This chapter describes:
¶ The general data flow, starting with the OS/400 logs and ending with the production ofPerformance Reporter reports. Included is a description of the SP400 feature recorddefinitions and OS/400 logs.
¶ The data flow for each SP400 feature component, including the names of OS/400 logs,Performance Reporter records, tables, and reports. The SP400 feature components are:
v Accounting component
v Configuration component
v Job statistics component
v Messages component
v Performance component
3
29AS/400 System Performance Feature Guide and Reference
3.D
ataflo
wan
dP
Ro
bjects
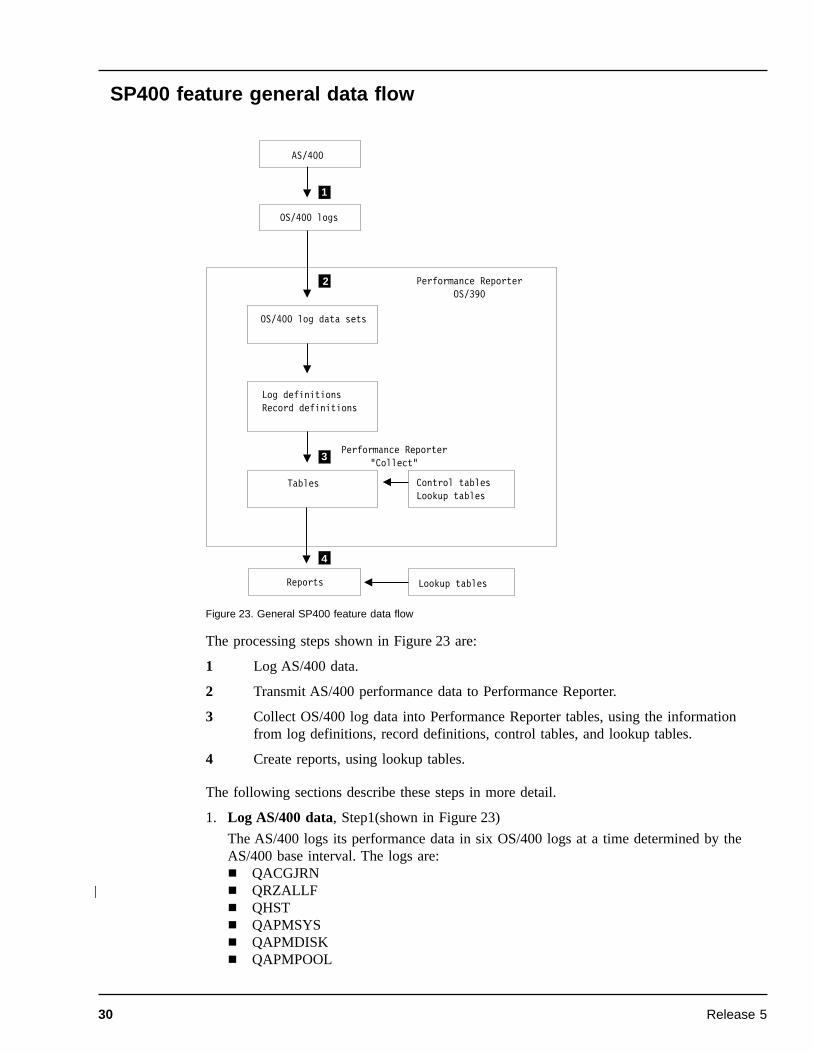
SP400 feature general data flow
The processing steps shown in Figure 23 are:
1 Log AS/400 data.
2 Transmit AS/400 performance data to Performance Reporter.
3 Collect OS/400 log data into Performance Reporter tables, using the informationfrom log definitions, record definitions, control tables, and lookup tables.
4 Create reports, using lookup tables.
The following sections describe these steps in more detail.
1. Log AS/400 data, Step1(shown in Figure 23)
The AS/400 logs its performance data in six OS/400 logs at a time determined by theAS/400 base interval. The logs are:¶ QACGJRN¶ QRZALLF¶ QHST¶ QAPMSYS¶ QAPMDISK¶ QAPMPOOL
AS/400
OS/400 logs
OS/400 log data sets
Log definitionsRecord definitions
Performance Reporter"Collect"
Performance ReporterOS/390
Tables Control tablesLookup tables
Lookup tablesReports
1
2
3
4
Figure 23. General SP400 feature data flow
30 Release 5
|

These OS/400 logs are used by record definitions to create the information to be enteredinto Performance Reporter tables. The logs and the record definitions that use the logsare described on page 31.
2. Transmit AS/400 performance data to Performance Reporter, Step2
You can transmit information to OS/390 using either tape or Network Job Entry (NJE).You can also use NetView File Transfer Program, or Remote Job Entry (RJE), but someprogramming work is needed to use these methods.
3. Collect OS/400 log data into Performance Reporter tables, Step3
In processing each record contained in the OS/400 log, the collect procedure:
a. Uses a log procedure to read the record from the OS/400 log and reformat accordingto the Performance Reporter record definition.
b. Uses a log collector to update the Performance Reporter table with the reformattedrecord. To do this, the log collector:
¶ Uses the log definition and record definitions to update the Performance Reportertable with the reformatted record.
¶ Uses an update definition to decide which reformatted record fields are to beincluded in which Performance Reporter table, including further summarizinginto other tables (for example, updating the monthly table OS400_ACCT_JOB_Mfrom the information used for updating the daily table OS400_ACCT_JOB_D).
¶ Takes information from control tables (for example, the SP400 feature maydetermine the period in which the measurements were made by looking up theday type information in the SPECIAL_DAY or DAY_OF_WEEK tables).
¶ Uses lookup tables (which contain user-defined information that defines anorganization’s operating environment) to add user-defined data to thePerformance Reporter table record.
4. For a description of the COLLECT procedure, see the Language Guide and Reference.
For a description of the use of control tables, refer to the Administration Guide.
5. Create reports, Step4
A description of how to create new reports is provided in the Guide to the ReportingDialog.
The reports that are created after installing the SP400 feature are described in Reports.
Description of record definitions and logsTable 2 shows the following:¶ The OS/400 log file that the record definition uses¶ The Performance Reporter log to which the record belongs¶ The Performance Reporter record definition and record definition description¶ The SP400 feature component to which the log and the record definitions belong
Table 2. Record definitions and logs used by SP400 featureOS/400 log (seeNote 2)
Performance Reporter logdefinition
Performance Reporter recorddefinition and description (see Note1)
SP400 feature component
QACGJRN(journal)
OS400_JOURNAL OS400_ACCT_JOB (accounting jobdata)
Accounting
31AS/400 System Performance Feature Guide and Reference
3.D
ataflo
wan
dP
Ro
bjects
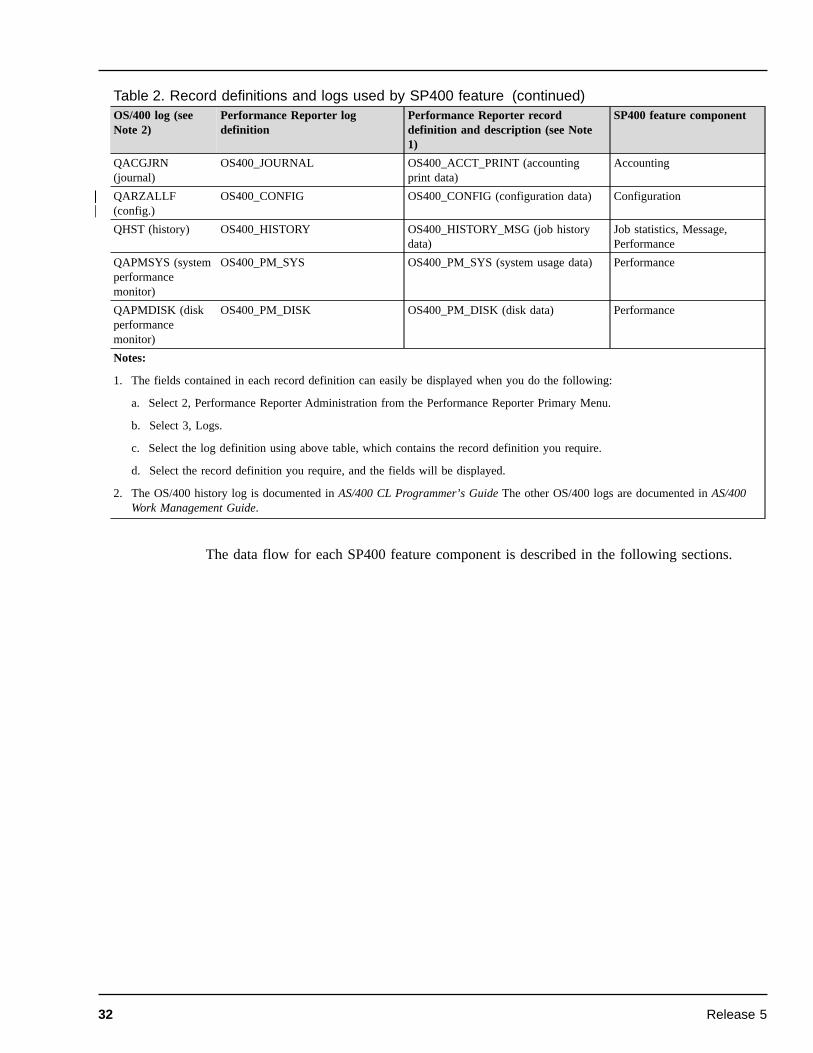
Table 2. Record definitions and logs used by SP400 feature (continued)OS/400 log (seeNote 2)
Performance Reporter logdefinition
Performance Reporter recorddefinition and description (see Note1)
SP400 feature component
QACGJRN(journal)
OS400_JOURNAL OS400_ACCT_PRINT (accountingprint data)
Accounting
QARZALLF(config.)
OS400_CONFIG OS400_CONFIG (configuration data) Configuration
QHST (history) OS400_HISTORY OS400_HISTORY_MSG (job historydata)
Job statistics, Message,Performance
QAPMSYS (systemperformancemonitor)
OS400_PM_SYS OS400_PM_SYS (system usage data) Performance
QAPMDISK (diskperformancemonitor)
OS400_PM_DISK OS400_PM_DISK (disk data) Performance
Notes:
1. The fields contained in each record definition can easily be displayed when you do the following:
a. Select 2, Performance Reporter Administration from the Performance Reporter Primary Menu.
b. Select 3, Logs.
c. Select the log definition using above table, which contains the record definition you require.
d. Select the record definition you require, and the fields will be displayed.
2. The OS/400 history log is documented in AS/400 CL Programmer’s Guide The other OS/400 logs are documented in AS/400Work Management Guide.
The data flow for each SP400 feature component is described in the following sections.
32 Release 5
|||||
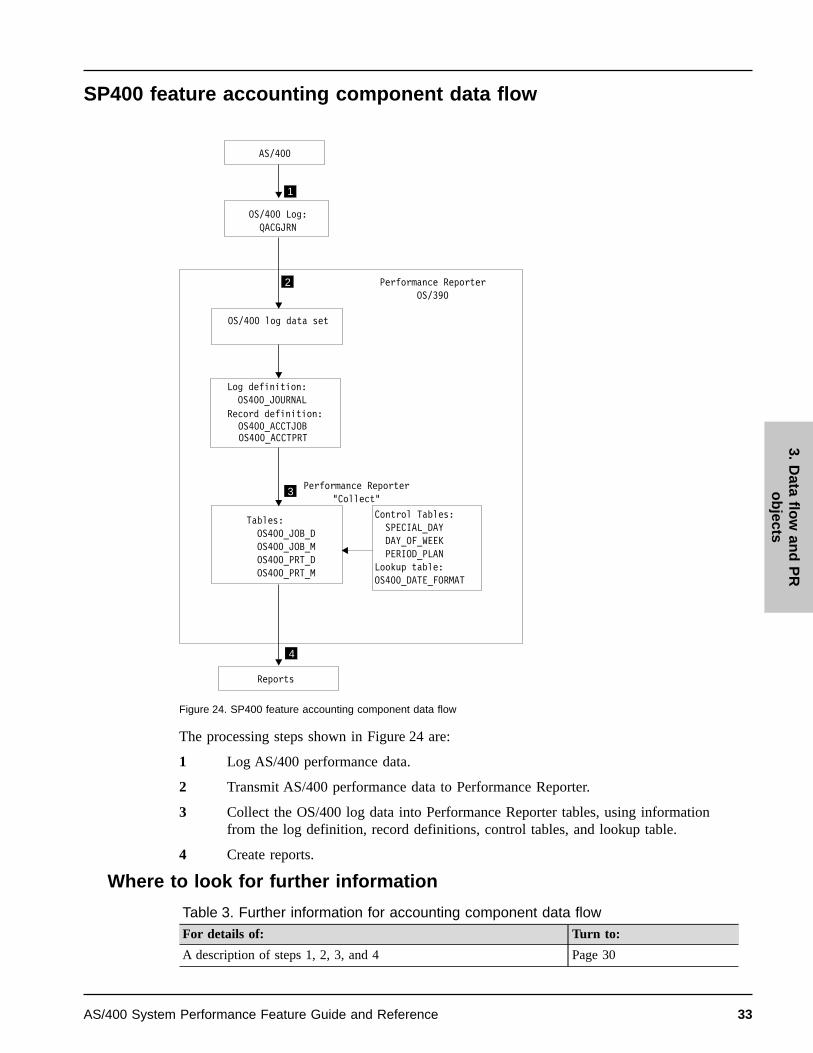
SP400 feature accounting component data flow
The processing steps shown in Figure 24 are:
1 Log AS/400 performance data.
2 Transmit AS/400 performance data to Performance Reporter.
3 Collect the OS/400 log data into Performance Reporter tables, using informationfrom the log definition, record definitions, control tables, and lookup table.
4 Create reports.
Where to look for further information
Table 3. Further information for accounting component data flowFor details of: Turn to:
A description of steps 1, 2, 3, and 4 Page 30
AS/400
Reports
OS/400 Log:QACGJRN
OS/400 log data set
Performance ReporterOS/390
Performance Reporter"Collect"
Log definition:OS400_JOURNAL
Record definition:OS400_ACCTJOBOS400_ACCTPRT
Tables:OS400_JOB_DOS400_JOB_MOS400_PRT_DOS400_PRT_M
Control Tables:SPECIAL_DAYDAY_OF_WEEKPERIOD_PLAN
Lookup table:OS400_DATE_FORMAT
1
2
3
4
Figure 24. SP400 feature accounting component data flow
33AS/400 System Performance Feature Guide and Reference
3.D
ataflo
wan
dP
Ro
bjects
Table 3. Further information for accounting component data flow (continued)For details of: Turn to:
A description of the record definitions and OS/400 log Page 31
OS400_ACCT_JOB_D and OS400_ACCT_JOB_M tables Page 42
OS400_ACCT_PRINT_D and OS400_ACCT_PRINT_M tables Page 43
Accounting component reports Page 65
Note: Control tables are explained in the Administration Guide.
SP400 feature configuration component data flow
The processing steps shown in Figure 25 are:
1 Log AS/400 performance data.
2 Transmit AS/400 performance data to Performance Reporter.
3 Collect the OS/400 log data into Performance Reporter tables, using informationfrom the log definition and record definition.
2
3
4
1
AS/400
OS/400 log data set
OS/400_CONFIGRecord definition0S400_CONFIG
Table:0S400_CONFIG
Performance Reporter"Collect"
Performance Reporter0S/390
Reports Lookup table:OS400_DASDTYPE
OS/400 logQARZALLF
Log definition:
Figure 25. SP400 feature configuration component data flow
34 Release 5
4 Create reports, using lookup table information.
Where to look for further information
Table 4. Further information for configuration component data flowFor details of: Turn to:
A description of steps 1, 2, 3, and 4 Pages 34
A description of the record definitions and OS/400 log Page 31
OS400_CONFIG table Page 44
OS400_DASDTYPE lookup table Page 58
Configuration component reports Page 67
35AS/400 System Performance Feature Guide and Reference
3.D
ataflo
wan
dP
Ro
bjects

SP400 feature job statistics component data flow
The processing steps shown in Figure 26 are:
1 Log AS/400 performance data.
2 Transmit AS/400 performance data to Performance Reporter.
3 Collect the OS/400 log data into Performance Reporter tables using informationfrom the log definition, record definition, control tables, and lookup tables.
4 Create reports.
Where to look for further information
Table 5. Further information for job statistics component data flowFor details of: Turn to:
A description of steps 1, 2, 3, and 4 Pages 36
AS/400
Reports
OS/400 Log:QHST
OS/400 log data set
Performance ReporterOS/390
Performance Reporter"Collect"
Log definition:OS400_HISTORY
Record definition:OS400_HISTORY_MSG
Tables:OS400_JOB_STAT_DOS400_JOB_STAT_M
Control Tables:SPECIAL_DAYDAY_OF_WEEKPERIOD_PLAN
Lookup tables:OS400_JOB_ACCTODEOS400_DATE_FORMAT
1
2
3
4
Figure 26. SP400 feature job statistics component data flow
36 Release 5
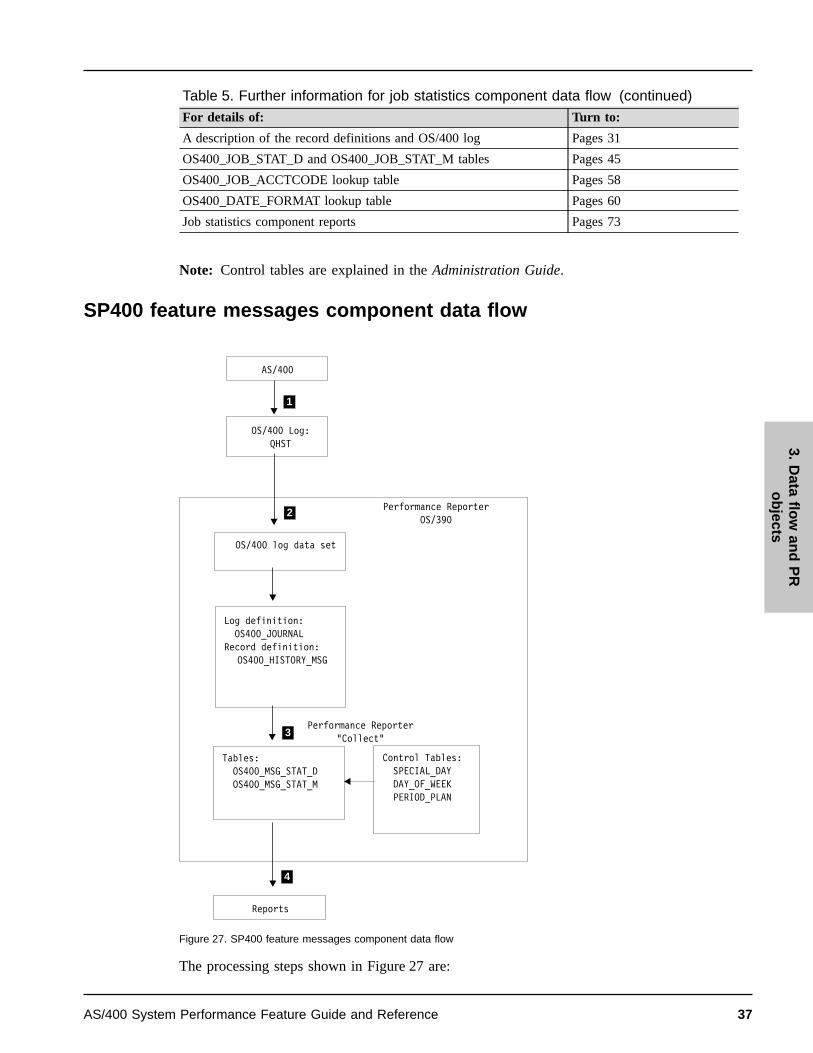
Table 5. Further information for job statistics component data flow (continued)For details of: Turn to:
A description of the record definitions and OS/400 log Pages 31
OS400_JOB_STAT_D and OS400_JOB_STAT_M tables Pages 45
OS400_JOB_ACCTCODE lookup table Pages 58
OS400_DATE_FORMAT lookup table Pages 60
Job statistics component reports Pages 73
Note: Control tables are explained in the Administration Guide.
SP400 feature messages component data flow
The processing steps shown in Figure 27 are:
AS/400
Reports
OS/400 Log:QHST
OS/400 log data set
Performance ReporterOS/390
Performance Reporter"Collect"
Log definition:OS400_JOURNAL
Record definition:OS400_HISTORY_MSG
Tables:OS400_MSG_STAT_DOS400_MSG_STAT_M
Control Tables:SPECIAL_DAYDAY_OF_WEEKPERIOD_PLAN
1
2
3
4
Figure 27. SP400 feature messages component data flow
37AS/400 System Performance Feature Guide and Reference
3.D
ataflo
wan
dP
Ro
bjects
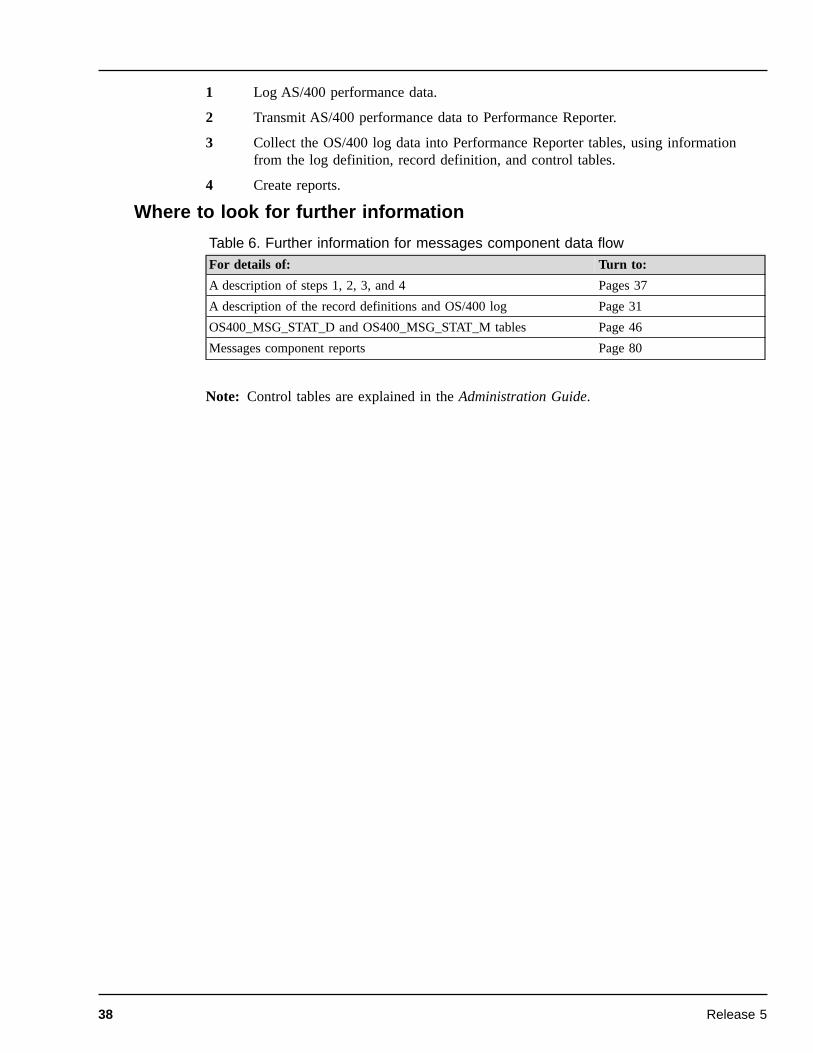
1 Log AS/400 performance data.
2 Transmit AS/400 performance data to Performance Reporter.
3 Collect the OS/400 log data into Performance Reporter tables, using informationfrom the log definition, record definition, and control tables.
4 Create reports.
Where to look for further information
Table 6. Further information for messages component data flowFor details of: Turn to:
A description of steps 1, 2, 3, and 4 Pages 37
A description of the record definitions and OS/400 log Page 31
OS400_MSG_STAT_D and OS400_MSG_STAT_M tables Page 46
Messages component reports Page 80
Note: Control tables are explained in the Administration Guide.
38 Release 5

SP400 feature performance component data flow
The processing steps shown in Figure 28 are:
1 Log AS/400 performance data.
2 Transmit AS/400 performance data to Performance Reporter.
3 Collect the OS/400 log data into Performance Reporter tables, using informationfrom the log definitions, record definitions, and control tables.
4 Create reports, using lookup table information.
AS/400
Reports
OS/400 Log:
OS/400 log data set
Performance ReporterOS/390
Performance Reporter"Collect"
Log definitions:OS400_HISTORYOS400_PM_DISKOS400_PM_POOLOS400_PM_SYS
Record definitions:OS400_HISTORY_MSGOS400_PM_DISKOS400_PM_POOLOS400_PM_SYS
Tables:OS400_PM_SYS_JGR_HOS400_PM_SYS_JGR_DOS400_PERF_SUM_HOS400_PERF_SUM_DOS400_PM_DISK_HOS400_PM_DISK_DOS400_PM_POOL_HOS400_PM_POOL_DOS400_PM_SYS_HOS400_PM_SYS_D
Control Tables:SPECIAL_DAYDAY_OF_WEEKPERIOD_PLAN
Lookup table:OS400_JOBGROUP
QHSTQAMPDISKQAPMPOOLQAMPSYS
1
2
3
4
Figure 28. SP400 feature performance component data flow
39AS/400 System Performance Feature Guide and Reference
3.D
ataflo
wan
dP
Ro
bjects

Where to look for further information
Table 7. Further information for performance component data flowFor details of: Turn to:
A description of steps 1, 2, 3, and 4 Pages 39
A description of the record definitions and OS/400 log Page 31
OS400_PM_SYS_JGR_H and OS400_PM_SYS_JGR_D tables Page 55
OS400_PM_SYS_H and OS400_PM_SYS_D tables Page 50
OS400_PM_DISK_H and OS400_PM_DISK_D tables Page 47
OS400_PM_POOL_H and OS400_PM_POOL_D tables Page 49
OS400_PERF_SUM_H and OS400_PERF_SUM_D tables Page 57
OS400_JOBGROUP lookup table Page 60
Performance component reports Page 87
Note: Control tables are explained in the Administration Guide.
40 Release 5

Data tables and lookup tables
The Performance Reporter database is a collection of DB2 tables, where each table containsa fixed number of columns. The number of rows in each table varies with time, because ofrows added by the collect function and because of database maintenance.
This chapter describes:
¶ The naming standard used for defining SP400 feature table names
¶ How each table is described in this chapter
¶ The tables used by the accounting component
¶ The tables used by the configuration component
¶ The tables used by the job statistics component
¶ The tables used by the messages component
¶ The tables used by the performance component
¶ The lookup tables used by some of the components
Note: For descriptions of common data tables used by the SP400 feature and otherPerformance Reporter features, refer to the Administration Guide.
Naming standard for tablesThe names of SP400 feature tables use this format:
OS400_prefix_content_suffix
where:
¶ prefix identifies the component (for example, PERF for the performance component).
¶ content is a description (for example, DISK for the performance component diskstatistics).
¶ suffix indicates the summarization level of the data in the table (for example,PM_DISK_D for disk performance statistics summarized by day). Table names for theconfiguration component do not contain suffixes.
A table name can have these summarization-level suffixes:_H The table holds data summarized by hour (hourly data)._D The table holds data summarized by day (daily data)._M The table holds data summarized by month (monthly data).
Note: The configuration, lookup, and control tables do not have a prefix or suffix.
4
41AS/400 System Performance Feature Guide and Reference
4.D
atatab
lesan
dlo
oku
ptab
les
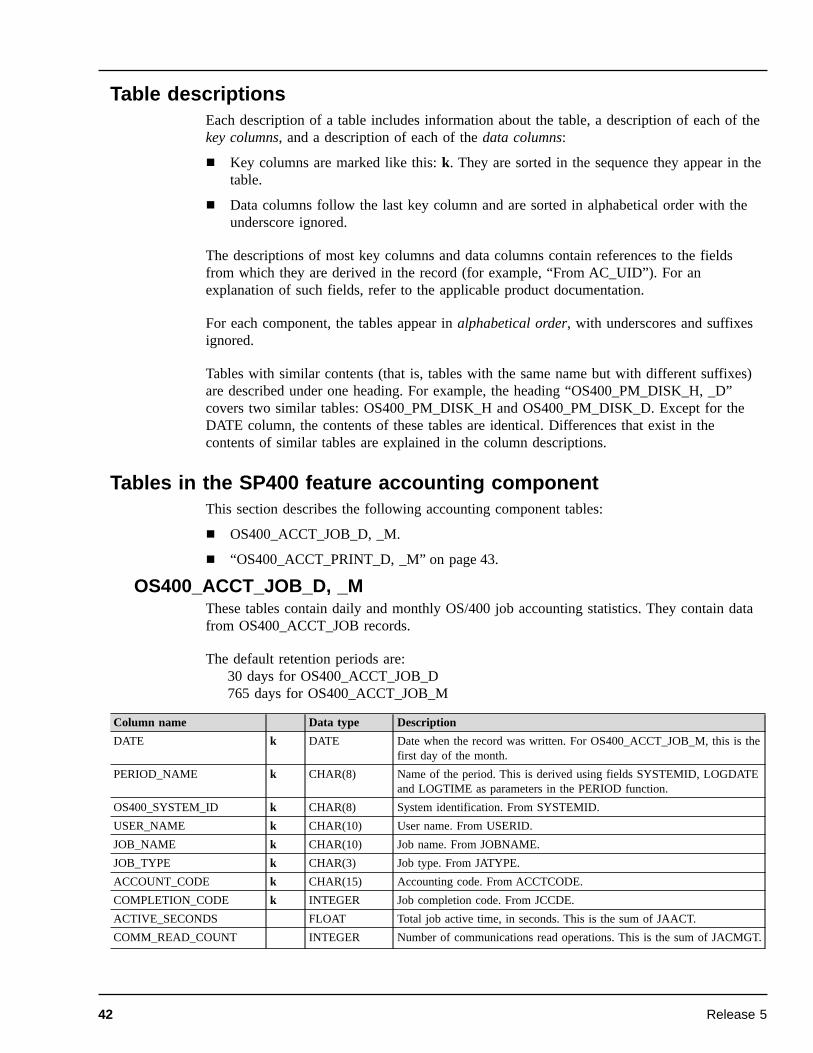
Table descriptionsEach description of a table includes information about the table, a description of each of thekey columns, and a description of each of the data columns:
¶ Key columns are marked like this: k. They are sorted in the sequence they appear in thetable.
¶ Data columns follow the last key column and are sorted in alphabetical order with theunderscore ignored.
The descriptions of most key columns and data columns contain references to the fieldsfrom which they are derived in the record (for example, “From AC_UID”). For anexplanation of such fields, refer to the applicable product documentation.
For each component, the tables appear in alphabetical order, with underscores and suffixesignored.
Tables with similar contents (that is, tables with the same name but with different suffixes)are described under one heading. For example, the heading “OS400_PM_DISK_H, _D”covers two similar tables: OS400_PM_DISK_H and OS400_PM_DISK_D. Except for theDATE column, the contents of these tables are identical. Differences that exist in thecontents of similar tables are explained in the column descriptions.
Tables in the SP400 feature accounting componentThis section describes the following accounting component tables:
¶ OS400_ACCT_JOB_D, _M.
¶ “OS400_ACCT_PRINT_D, _M” on page 43.
OS400_ACCT_JOB_D, _MThese tables contain daily and monthly OS/400 job accounting statistics. They contain datafrom OS400_ACCT_JOB records.
The default retention periods are:30 days for OS400_ACCT_JOB_D765 days for OS400_ACCT_JOB_M
Column name Data type Description
DATE k DATE Date when the record was written. For OS400_ACCT_JOB_M, this is thefirst day of the month.
PERIOD_NAME k CHAR(8) Name of the period. This is derived using fields SYSTEMID, LOGDATEand LOGTIME as parameters in the PERIOD function.
OS400_SYSTEM_ID k CHAR(8) System identification. From SYSTEMID.
USER_NAME k CHAR(10) User name. From USERID.
JOB_NAME k CHAR(10) Job name. From JOBNAME.
JOB_TYPE k CHAR(3) Job type. From JATYPE.
ACCOUNT_CODE k CHAR(15) Accounting code. From ACCTCODE.
COMPLETION_CODE k INTEGER Job completion code. From JCCDE.
ACTIVE_SECONDS FLOAT Total job active time, in seconds. This is the sum of JAACT.
COMM_READ_COUNT INTEGER Number of communications read operations. This is the sum of JACMGT.
42 Release 5

Column name Data type Description
COMM_WRITE_COUNT INTEGER Number of communications write operations. This is the sum ofJACMPT.
CPU_SECONDS FLOAT Total processor time, in seconds. This is the sum of JACPU.
DB_READ_COUNT INTEGER Number of database read operations. This is the sum of JADBGT.
DB_UPDATE_COUNT INTEGER Number of database update operations. This is the sum of JADBUP.
DB_WRITE_COUNT INTEGER Number of database write operations. This is the sum of JADBPT.
ELAPSED_SECONDS INTEGER Total elapsed time, in seconds. This is the sum of the interval fromJASDTE, JASTME to LOGDATE, LOGTIME.
IO_ASYNC_COUNT INTEGER Number of synchronous auxiliary I/O operations and database operations.This is the sum of JAAUX.
IO_COUNT INTEGER Number of auxiliary I/O. This is the sum of JAAUX.
JOBS INTEGER Number of jobs. This is the count of JOBNAME.
PRINT_FILE_COUNT INTEGER Number of print files. This is the sum of JAPRTF.
PRINT_LINE_COUNT INTEGER Number of print lines. This is the sum of JALINE.
PRINT_PAGE_COUNT INTEGER Number of print pages. This is the sum of JAPAGE.
ROUTING_STEPS INTEGER Number of routing steps. This is the sum of JARTGS.
SUSPEND_SECONDS FLOAT Total job suspend time, in seconds. This is the sum of JASPN.
TRANSACTIONS INTEGER Number of transactions. This is the sum of JATRNS.
TRANSACTION_SEC INTEGER Total transaction time, in seconds. This is the sum of JATRNT.
OS400_ACCT_PRINT_D, _MThese tables contain daily and monthly OS/400 print accounting statistics. They contain datafrom OS400_ACCT_PRINT records.
The default retention periods are:30 days for OS400_ACCT_PRINT_D765 days for OS400_ACCT_PRINT_M
Column name Data type Description
DATE k DATE Date when the record was written. From LOGDATE. ForOS400_ACCT_PRINT_M, this is the first day of the month.
PERIOD_NAME k CHAR(8) Name of the period. This is derived using fields SYSTEMID, LOGDATE,and LOGTIME as parameters in the PERIOD function.
OS400_SYSTEM_ID k CHAR(8) System identification. From SYSTEMID.
USER_NAME k CHAR(10) User name. From USERID.
JOB_NAME k CHAR(10) Job name. From JOBNAME.
FORM_TYPE k CHAR(10) Print form type. From JAFMTP.
ACCOUNT_CODE k CHAR(15) Accounting code. From ACCTCODE.
JOBS INTEGER Number of jobs. This is the count of JOBNAME.
PRINT_BYTE_COUNT INTEGER Number of print bytes. This is the sum of JABYTE.
PRINT_LINE_COUNT INTEGER Number of print lines. This is the sum of JATLIN.
PRINT_PAGE_COUNT INTEGER Number of print pages. This is the sum of JATPAG.
Tables in the SP400 feature configuration componentThis section describes the OS400_CONFIG configuration component table:
43AS/400 System Performance Feature Guide and Reference
4.D
atatab
lesan
dlo
oku
ptab
les
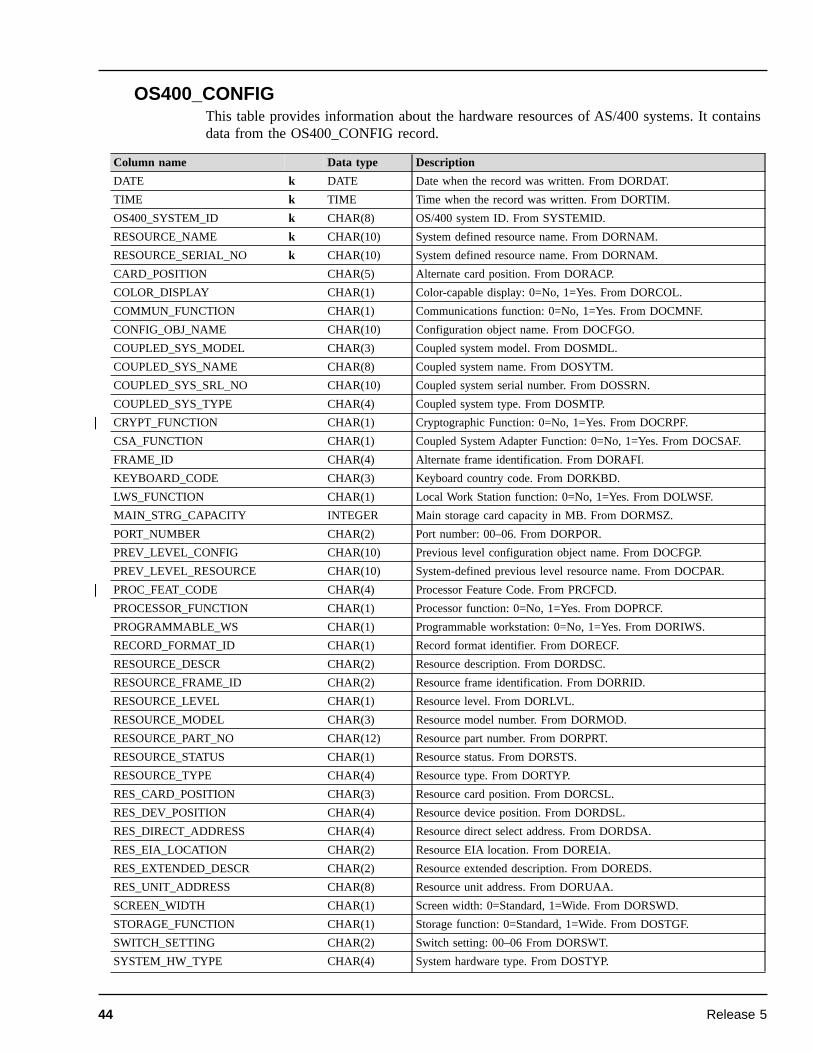
OS400_CONFIGThis table provides information about the hardware resources of AS/400 systems. It containsdata from the OS400_CONFIG record.
Column name Data type Description
DATE k DATE Date when the record was written. From DORDAT.
TIME k TIME Time when the record was written. From DORTIM.
OS400_SYSTEM_ID k CHAR(8) OS/400 system ID. From SYSTEMID.
RESOURCE_NAME k CHAR(10) System defined resource name. From DORNAM.
RESOURCE_SERIAL_NO k CHAR(10) System defined resource name. From DORNAM.
CARD_POSITION CHAR(5) Alternate card position. From DORACP.
COLOR_DISPLAY CHAR(1) Color-capable display: 0=No, 1=Yes. From DORCOL.
COMMUN_FUNCTION CHAR(1) Communications function: 0=No, 1=Yes. From DOCMNF.
CONFIG_OBJ_NAME CHAR(10) Configuration object name. From DOCFGO.
COUPLED_SYS_MODEL CHAR(3) Coupled system model. From DOSMDL.
COUPLED_SYS_NAME CHAR(8) Coupled system name. From DOSYTM.
COUPLED_SYS_SRL_NO CHAR(10) Coupled system serial number. From DOSSRN.
COUPLED_SYS_TYPE CHAR(4) Coupled system type. From DOSMTP.
CRYPT_FUNCTION CHAR(1) Cryptographic Function: 0=No, 1=Yes. From DOCRPF.
CSA_FUNCTION CHAR(1) Coupled System Adapter Function: 0=No, 1=Yes. From DOCSAF.
FRAME_ID CHAR(4) Alternate frame identification. From DORAFI.
KEYBOARD_CODE CHAR(3) Keyboard country code. From DORKBD.
LWS_FUNCTION CHAR(1) Local Work Station function: 0=No, 1=Yes. From DOLWSF.
MAIN_STRG_CAPACITY INTEGER Main storage card capacity in MB. From DORMSZ.
PORT_NUMBER CHAR(2) Port number: 00–06. From DORPOR.
PREV_LEVEL_CONFIG CHAR(10) Previous level configuration object name. From DOCFGP.
PREV_LEVEL_RESOURCE CHAR(10) System-defined previous level resource name. From DOCPAR.
PROC_FEAT_CODE CHAR(4) Processor Feature Code. From PRCFCD.
PROCESSOR_FUNCTION CHAR(1) Processor function: 0=No, 1=Yes. From DOPRCF.
PROGRAMMABLE_WS CHAR(1) Programmable workstation: 0=No, 1=Yes. From DORIWS.
RECORD_FORMAT_ID CHAR(1) Record format identifier. From DORECF.
RESOURCE_DESCR CHAR(2) Resource description. From DORDSC.
RESOURCE_FRAME_ID CHAR(2) Resource frame identification. From DORRID.
RESOURCE_LEVEL CHAR(1) Resource level. From DORLVL.
RESOURCE_MODEL CHAR(3) Resource model number. From DORMOD.
RESOURCE_PART_NO CHAR(12) Resource part number. From DORPRT.
RESOURCE_STATUS CHAR(1) Resource status. From DORSTS.
RESOURCE_TYPE CHAR(4) Resource type. From DORTYP.
RES_CARD_POSITION CHAR(3) Resource card position. From DORCSL.
RES_DEV_POSITION CHAR(4) Resource device position. From DORDSL.
RES_DIRECT_ADDRESS CHAR(4) Resource direct select address. From DORDSA.
RES_EIA_LOCATION CHAR(2) Resource EIA location. From DOREIA.
RES_EXTENDED_DESCR CHAR(2) Resource extended description. From DOREDS.
RES_UNIT_ADDRESS CHAR(8) Resource unit address. From DORUAA.
SCREEN_WIDTH CHAR(1) Screen width: 0=Standard, 1=Wide. From DORSWD.
STORAGE_FUNCTION CHAR(1) Storage function: 0=Standard, 1=Wide. From DOSTGF.
SWITCH_SETTING CHAR(2) Switch setting: 00–06 From DORSWT.
SYSTEM_HW_TYPE CHAR(4) System hardware type. From DOSTYP.
44 Release 5
||||
||||

Column name Data type Description
SYSTEM_MODEL_NO CHAR(3) System model number. From DOSMOD.
SYSTEM_SERIAL_NO CHAR(10) System serial number. From DOSSER.
TRANSPORT_TYPE_DEF CHAR(2) Transport type definition. From DORTTY.
TRANSP_LOC_FIELD1 CHAR(4) Transport location field1. From DORTF1.
TRANSP_LOC_FIELD2 CHAR(4) Transport location field2. From DORTF2.
TRANSP_LOC_FIELD3 CHAR(4) Transport location field3. From DORTF3.
UNIT_ADDRESS_TYPE CHAR(2) Unit Address type. From DORUAT.
UNIT_ADDR_FIELD1 CHAR(4) Unit Address field1. From DORUA1.
UNIT_ADDR_FIELD2 CHAR(4) Unit Address field2. From DORUA2.
UNIT_ADDR_FIELD3 CHAR(4) Unit Address field3. From DORUA3.
UNIT_ADDR_FIELD4 CHAR(4) Unit Address field4. From DORUA4.
UNIT_ADDR_FIELD5 CHAR(4) Unit Address field5. From DORUA5.
UNIT_POSITION CHAR(5) Alternate unit position. From DORADP.
VERS_RELEASE_MOD CHAR(6) Operating system level. From DOSVRM.
Tables in the SP400 feature job statistics componentThis section describes the following job statistics component tables:
OS400_JOB_STAT_D, _M.
OS400_JOB_STAT_D, _MThese tables provides daily and monthly statistics on OS400 jobs. They contain data fromCPF1164 messages in the history file.
The default retention periods are:30 days for OS400_JOB_STAT_D765 days for OS400_JOB_STAT_M
Column name Data type Description
DATE k DATE Date when the job ended. From JDEND and JTEND. ForOS400_JOB_STAT_M, this is the first day of the month.
PERIOD_NAME k CHAR(8) Name of the period. This is derived using fields SYSTEMID, JDEND, andJTEND from the record as parameters in the PERIOD function.
OS400_SYSTEM_ID k CHAR(8) System identification. From SYSTEMID.
USER_NAME k CHAR(10) User name. From USERID.
JOB_NAME k CHAR(10) Job name. From JOBNAME.
JOB_TYPE k CHAR(3) Job type. From JOBTYPE.
ACCOUNT_CODE k CHAR(15) Accounting code. From ACCOUNT_CODE in theOS400_JOB_ACCTCODE lookup table. This is derived using fieldsSYSTEMID, USERID, JOBNAME and JOBTYPE from the record as keys.If no match is found, this column is set to ?.
COMPLETION_CODE k INTEGER Job completion code. From JOBCC.
CPU_SECONDS INTEGER Total processor time, in seconds. This is the sum of CPUTIME.
ELAPSED_SECONDS INTEGER Total elapsed time, in seconds. This is the sum of the interval fromJDSTR,JTSTR to JDEND,JTEND.
IO_COUNT INTEGER Total number of auxiliary I/O. This is the sum of JOBIO.
JOBS INTEGER Total number of jobs. This is the count of MSGID.
RESPONSE_SECONDS INTEGER Total response time, in seconds. This is the sum of JOBRT.
ROUTING_STEPS INTEGER Total number of routing steps. This is the sum of JOBRSTP.
45AS/400 System Performance Feature Guide and Reference
4.D
atatab
lesan
dlo
oku
ptab
les

Column name Data type Description
TRANSACTIONS INTEGER Total number of transactions. This is the sum of JOBTR.
Tables in the SP400 feature messages componentThis section describes the following message component tables:
¶ OS400_MSG_STAT_D, _M.
¶ OS400_MSG_STAT_DV, _MV.
OS400_MSG_STAT_D, _MThese tables contain daily and monthly message statistics from the history file. They containdata from messages in the history file.
The default retention periods are:30 days for OS400_MSG_STAT_D765 days for OS400_MSG_STAT_M
Column name Data type Description
DATE k DATE Date when the record was written. From LOGCENTURY and LOGDATE.For OS400_MSG_STAT_M, this is the first day of the month.
PERIOD_NAME k CHAR(8) Name of the period. This is derived using fields SYSTEMID,LOGCENTURY, LOGDATE and LOGTIME from the record as parametersin the PERIOD function.
OS400_SYSTEM_ID k CHAR(8) System identification. From SYSTEMID.
USER_NAME k CHAR(10) User name. From USERID.
JOB_NAME k CHAR(10) Job name. From JOBNAME.
MESSAGE_ID k CHAR(7) Message identification. From MSGID.
MESSAGE_TYPE k CHAR(2) Message type. From MSGTYPE.
MESSAGE_SEVERITY k CHAR(2) Severity code. From SEVERITY.
MESSAGE_FILE k CHAR(10) Name of message file. From MSGFILE.
DATA_BYTE_COUNT INTEGER Total number of bytes for data. This is the sum of MSGDATA.
LINE_COUNT INTEGER Total number of message lines. Calculated as the sum of(MSGTEXT+MSGDATA+132+132)/132.
MESSAGE_COUNT INTEGER Total number of messages. This is the count of MSGID.
TEXT_BYTE_COUNT INTEGER Total number of bytes for text. This is the sum of MSGTEXT.
OS400_MSG_STAT_DV, _MVThese views provide daily and monthly message statistics from the history file. They arebased upon the OS400_MSG_STAT_D, _M tables.
The default retention periods are:30 days for OS400_MSG_STAT_DV765 days for OS400_MSG_STAT_MV
Column name Data type Description
DATE k DATE Date when the record was written. From LOGCENTURY and LOGDATE.For OS400_MSG_STAT_MV, this is the first day of the month.
PERIOD_NAME k CHAR(8) Name of the period. This is derived using fields SYSTEMID,LOGCENTURY, LOGDATE and LOGTIME from the record as parametersin the PERIOD function.
46 Release 5

Column name Data type Description
OS400_SYSTEM_ID k CHAR(8) System identification. From SYSTEMID.
DATA_BYTE_COUNT INTEGER Total number of bytes for data. This is the sum of MSGDATA.
LINE_COUNT INTEGER Total number of message lines. Calculated as the sum of(MSGTEXT+MSGDATA+132+132)/132.
MESSAGE_COUNT INTEGER Total number of messages. This is the count of MSGID.
TEXT_BYTE_COUNT INTEGER Total number of bytes for text. This is the sum of MSGTEXT.
Tables in the SP400 feature performance componentThis section describes the following performance component tables:
¶ OS400_PM_DISK_H, _D.
¶ “OS400_PM_POOL_H, _D” on page 49.
¶ “OS400_PM_SYS_H, _D” on page 50.
¶ “OS400_PM_SYS_JGR_H, _D” on page 55.
¶ “OS400_PERF_SUM_H, _D” on page 57.
OS400_PM_DISK_H, _DThese tables contain hourly and daily disk performance statistics. They contain data from theperformance data file QAPMDISK.
The default retention periods are:30 days for OS400_PM_DISK_H365 days for OS400_PM_DISK_D
Column name Data type Description
DATE k DATE Date when the record was written. From LDATE.
TIME k TIME Time when the record was written (OS400_PM_DISK_H only). FromLTIME.
PERIOD_NAME k CHAR(8) Name of the period. This is derived using fields SYSTEMID, LDATE,and LTIME from the record as parameters in the PERIOD function.
OS400_SYSTEM_ID k CHAR(8) System identification. From SYSTEMID.
IOP_ADDRESS k CHAR(2) IOP address. From DIOPID.
DISKARM_NUMBER k CHAR(4) Disk arm number. From DSARM.
ACCESS_RATE_AVG FLOAT Average arm access rate in I/O per second. Calculated as the average of(DSRDS+DSWRTS)/INTSEC.
ACCESS_RATE_MAX FLOAT Maximum arm access rate in I/O per second. Calculated as themaximum of (DSRDS+DSWRTS)/INTSEC.
ARM_NOTBUSY_CNT INTEGER Sum of times that arm was not busy. This is the sum of DSNBSY.
ARM_UTIL_AVG FLOAT Average arm utilization %. Calculated as the average of100*(DSSMPL-DSNBSY)/DSSMPL.
ARM_UTIL_MAX FLOAT Maximum arm utilization %. Calculated as the maximum of100*(DSSMPL-DSNBSY)/DSSMPL.
AVAILABLE_SPACE_MB FLOAT Average of drive available space in megabytes. Calculated as theaverage of DSAVL/1048576.
BACK_DIR_READ_CNT INTEGER Total number of device read operations on compression directorystructures not immediately required to complete host commands. It is 0for non-compressed units. Calculated as the sum of DSBGDR.
47AS/400 System Performance Feature Guide and Reference
4.D
atatab
lesan
dlo
oku
ptab
les

Column name Data type Description
BACK_DIR_WRT_CNT INTEGER Total number of device write operations on compression directorystructures not immediately required to complete host commands. It is 0for non-compressed units. Calculated as the sum of DSBGDW.
BACK_SWEEPS_CNT INTEGER Total number of times a 1 MB compression group was required to beswept not immediately required to complete host system commands. Itis 0 for non-compressed units. Calculated as the sum of DSBGS.
BFR_OVERRUN_CNT INTEGER Sum of buffer overruns. This is the sum of DSBUFO.
BFR_UNDERRUN_CNT INTEGER Sum of buffer underruns. This is the sum of DSBUFU.
BLOCK_READ_COUNT INTEGER Number of blocks read. This is the sum of DSBLKR.
BLOCK_WRITE_COUNT INTEGER Number of blocks written. This is the sum of DSBLKW.
COMP_UNIT_IND CHAR(1) Compressed unit indicator. It is 1 if the disk data is compressed, 0 ifthe disk data is not compressed. From DSCOMP.
CNTRL_RD_CACHE INTEGER Total number of times that the data requested by the read operationcould have been obtained from a controller read cache. It is 0 when theextended cache simulator is not enabled. Calculated by the sum ofDSCERC.
DISK_TYPE CHAR(4) Disk drive type. From DSTYPE.
DRIVE_CAPACITY_MB FLOAT Average of drive capacity in megabytes. Calculated as the average ofDSCAP/1048576.
FOR_DIR_READ_CNT INTEGER Total number of device read operations on compression directorystructures needed to complete host system commands. It is 0 fornon-compressed units. Calculated as the sum of DSFGDR.
FOR_DIR_WRT_CNT INTEGER Total number of device write operations on compression directorystructures needed to complete host system commands. It is 0 fornon-compressed units. Calculated as the sum of DSFGDW.
FOR_EXC_READ_CNT INTEGER Total number of additional read operations on compression exceptionarea needed to complete host system commands. It is 0 fornon-compressed units. Calculated as the sum of DSFGRE.
FOR_EXC_WRT_CNT INTEGER Total number of additional write operations on compression exceptionarea needed to complete host system commands. It is 0 fornon-compressed units. Calculated as the sum of DSFGWE.
FOR_SWEEPS_CNT INTEGER Total number of times a 1 MB compression group was required to beswept to complete host system commands. It is 0 for non-compressedunits. Calculated as the sum of DSFGS.
IOP_UTIL_AVG FLOAT Average IOP utilization %. Calculated as the average of 100 *(INTSEC-DSIDLC*DSIDLT / 100000000) / INTSEC.
IOP_UTIL_MAX FLOAT Maximum IOP utilization %. Calculated as the maximum of 100 *(INTSEC-DSIDLC*DSIDLT / 100000000) / INTSEC.
LOG_BLOCK_ALL_CNT INTEGER Total number of logical blocks contained in allocated compressiongroups. It is 0 for non-compressed units. Calculated as the sum ofDLSBA.
LOG_BLOCK_WRT_CNT INTEGER Total number of logical blocks written in the device user data area. It is0 for non-compressed units. Calculated as the sum of DLSBW.
MEASURED_SEC INTEGER Interval time, in seconds. This is the sum of INTSEC.
PERM_STOR_AVAIL_MB FLOAT Average of permanent storage available in megabytes. Calculated as theaverage of DSPAVL/1048576.
PERM_STOR_CAP_MB FLOAT Average of permanent storage capacity in megabytes. Calculated as theaverage of DSPCAP/1048576.
PHYS_BLOCK_ALL_CNT INTEGER Total number of physical blocks reserved in the device data area forDASD extents. It is 0 for non-compressed units. Calculated as the sumof DLPBA.
48 Release 5
|||||||

Column name Data type Description
PHYS_BLOCK_CPR_CNT INTEGER Total number of physical blocks used for compression overhead, that is,compression directory structures and other reserved areas. It is 0 fornon-compressed units. Calculated as the sum of DSPBCO.
PHYS_BLOCK_USE_CNT INTEGER Total number of physical blocks reserved in the device user data area. Itis 0 for non-compressed units. Calculated as the sum of DSPBU.
QUEUE_ELEMENT_CNT INTEGER Total queue elements. This is the sum of DSQUEL.
QUEUE_LENGTH_AVG FLOAT Average queue length. Calculated as the average of DSQUEL/DSSMPL.
QUEUE_LENGTH_MAX FLOAT Maximum queue length. Calculated as the maximum ofDSQUEL/DSSMPL.
READ_DATA_CMD_CNT INTEGER Sum of read data commands. This is the sum of DSRDS.
SAMPLES INTEGER Number of intervals. This is the count of INTNUM.
SAMPLES_2PERSEC INTEGER Sum of samples taken at 2 per second. This is the sum of DSSMPL.
SEARCH_STRCMD_CNT INTEGER Number of search string commands. This is the sum of DSSCAN.
SEEK_EQ_0_CNT INTEGER Total number of zero seeks. This is the sum of DSSK6.
SEEK_GT_1_12_CNT INTEGER Total number of seeks arm traveled > 1/12 and < 1/6 on disk. This isthe sum of DSSK4.
SEEK_GT_1_3_CNT INTEGER Total number of seeks arm traveled > 1/3 and < 2/3 on disk. This is thesum of DSSK2.
SEEK_GT_1_6_CNT INTEGER Total number of seeks arm traveled > 1/6 and < 1/3 on disk. This is thesum of DSSK3.
SEEK_GT_2_3_CNT INTEGER Total number of seeks arm traveled > 2/3 on disk. This is the sum ofDSSK1.
SEEK_LT_1_12_CNT INTEGER Total number of seeks arm traveled < 1/12 on disk. This is the sum ofDSSK5.
SERVICE_TIME_AVG FLOAT Average arm service time in seconds. Calculated as the average of((DSSMPL-DSNBSY)/DSSMPL) / ((DSRDS+DSWRTS)/INTSEC).
SERVICE_TIME_MAX FLOAT Maximum arm service time in seconds. Calculated as the maximum of((DSSMPL-DSNBSY)/DSSMPL) / ((DSRDS+DSWRTS)/INTSEC).
WRITE_DATA_CMD_CNT INTEGER Sum of write data commands. This is the sum of DSWRTS.
OS400_PM_POOL_H, _DThese tables provide hourly and daily storage pool performance statistics. They contain datafrom the performance data file QAPMPOOL.
The default retention periods are:30 days for OS400_PM_POOL_H365 days for OS400_PM_POOL_D
Column name Data type Description
DATE k DATE Date when the record was written. From LDATE.
TIME k TIME Time when the record was written (for OS400_PM_POOL_H only).From LTIME.
PERIOD_NAME k CHAR(8) Name of the period. This is derived using fields SYSTEMID, LDATEand LTIME from the record as parameters in the PERIOD function.
OS400_SYSTEM_ID k CHAR(8) System identification. From SYSTEMID.
POOL_NUMBER k CHAR(2) Pool number. From PONBR.
ACT_INEL_RTE_MAX FLOAT Maximum active to ineligible transitions rate. Calculated as themaximum of POAI/INTSEC.
ACT_INEL_SUM INTEGER Sum of active to ineligible transitions. From POAI.
ACT_LVL_SET_AVG FLOAT Average activity level setting. This is the average of POACTL.
49AS/400 System Performance Feature Guide and Reference
4.D
atatab
lesan
dlo
oku
ptab
les

Column name Data type Description
ACT_LVL_SET_MAX INTEGER Maximum activity level setting. This is the maximum of POACTL.
ACT_LVL_SET_MIN INTEGER Minimum activity level setting. This is the minimum of POACTL.
ACT_WAIT_RTE_MAX FLOAT Maximum active to wait transitions rate. Calculated as the maximum ofPOAW/INTSEC.
ACT_WAIT_SUM INTEGER Sum of active to wait transitions. This is the sum of POAW.
DB_FAULTRTE_MAX FLOAT Maximum database fault rate. Calculated as the maximum ofPODBF/INTSEC.
DB_FAULT_SUM INTEGER Sum of database faults. This is the sum of PODBF.
DBPG_READRTE_MAX FLOAT Maximum database page read rate. Calculated as the maximum ofPODBPG/INTSEC.
DBPG_READ_SUM INTEGER Sum of database pages read. This is the sum of PODBPG.
MEASURED_SEC INTEGER Total interval seconds. This is the sum of INTSEC.
NDB_FAULTRTE_MAX FLOAT Maximum non-database fault rate. Calculated as the maximum ofPONDBF/INTSEC.
NDB_FAULT_SUM INTEGER Sum of non-database faults. This is the sum of PONDBF.
NDBPG_READRTE_MAX FLOAT Maximum non-database page read rate. Calculated as the maximum ofPONDPG/INTSEC.
NDBPG_READ_SUM INTEGER Sum of non-database pages read. This is the sum of PONDPG.
POOL_SIZE_AVG FLOAT Average pool size, in kilobytes. This is the average of POSIZ.
POOL_SIZE_MAX INTEGER Maximum pool size, in kilobytes. This is the maximum of POSIZ.
POOL_SIZE_MIN INTEGER Minimum pool size, in kilobytes. This is the minimum of POSIZ.
POOL_SIZE_RSV_AVG FLOAT Average reserved pool size, in kilobytes. This is the average of PORES.
POOL_SIZE_RSV_MAX INTEGER Maximum reserved pool size, in kilobytes. This is the maximum ofPORES.
POOL_SIZE_RSV_MIN INTEGER Minimum reserved pool size, in kilobytes. This is the minimum ofPORES.
SAMPLES INTEGER Total number of intervals. This is the count of INTNUM.
WAIT_INEL_RTE_MAX FLOAT Maximum wait to ineligible transitions rate. Calculated as the maximumof POWI/INTSEC.
WAIT_INEL_SUM INTEGER Sum of wait to ineligible transitions. This is the sum of POWI.
OS400_PM_SYS_H, _DThese tables contain hourly and daily OS/400 system performance statistics. They containdata from OS400_PM_SYS records in the OS/400 system performance monitor.
The default retention periods are:30 days for OS400_PM_SYS_H365 days for OS400_PM_SYS_D
Column name Data type Description
DATE k DATE Date when the record was written. From LDATE
TIME k TIME Time when the record was written (for OS400_PM_SYS_H only).From LTIME.
PERIOD_NAME k CHAR(8) Name of the period. This is derived using fields SYSTEMID, LDATE,and LTIME as parameters in the PERIOD function.
OS400_SYSTEM_ID k CHAR(8) OS/400 system ID. From SYSTEMID
AGMPG_FAULT_CNT INTEGER Number of access group member page faults. This is the sum ofSYAPGF.
ASYNCH_LOCK_CNT INTEGER Number of asynchronous lock conflicts. This is the sum of SYASYL.
50 Release 5
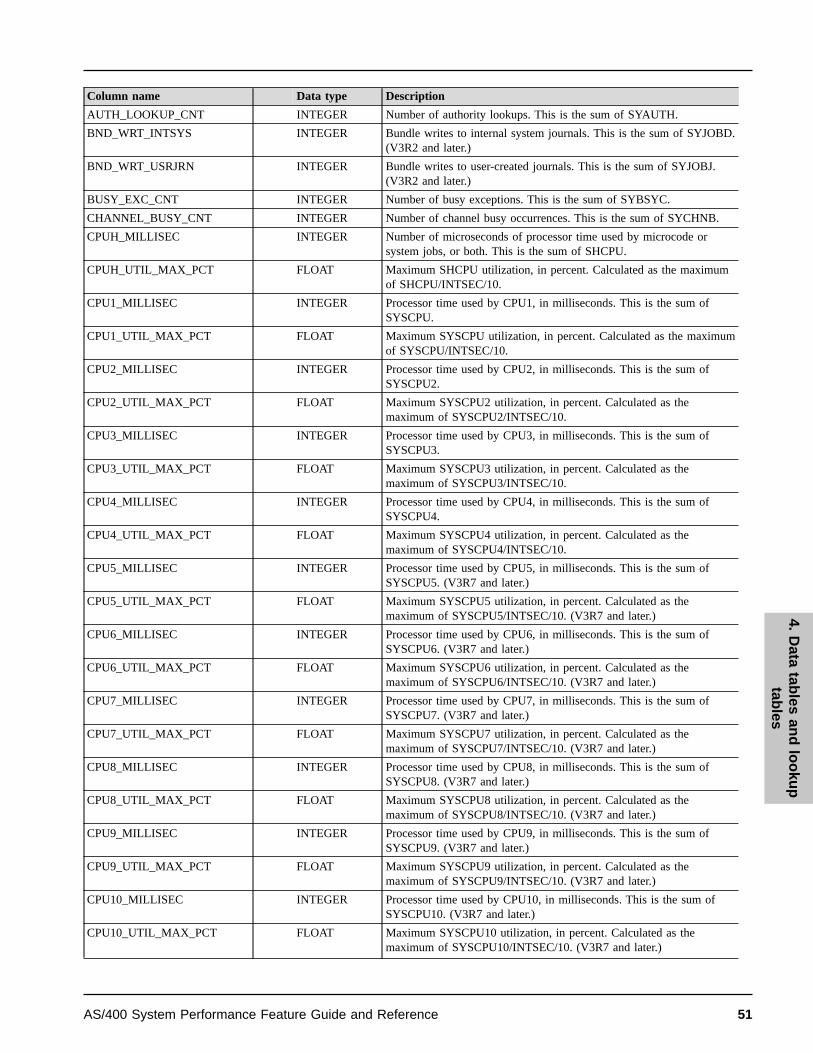
Column name Data type Description
AUTH_LOOKUP_CNT INTEGER Number of authority lookups. This is the sum of SYAUTH.
BND_WRT_INTSYS INTEGER Bundle writes to internal system journals. This is the sum of SYJOBD.(V3R2 and later.)
BND_WRT_USRJRN INTEGER Bundle writes to user-created journals. This is the sum of SYJOBJ.(V3R2 and later.)
BUSY_EXC_CNT INTEGER Number of busy exceptions. This is the sum of SYBSYC.
CHANNEL_BUSY_CNT INTEGER Number of channel busy occurrences. This is the sum of SYCHNB.
CPUH_MILLISEC INTEGER Number of microseconds of processor time used by microcode orsystem jobs, or both. This is the sum of SHCPU.
CPUH_UTIL_MAX_PCT FLOAT Maximum SHCPU utilization, in percent. Calculated as the maximumof SHCPU/INTSEC/10.
CPU1_MILLISEC INTEGER Processor time used by CPU1, in milliseconds. This is the sum ofSYSCPU.
CPU1_UTIL_MAX_PCT FLOAT Maximum SYSCPU utilization, in percent. Calculated as the maximumof SYSCPU/INTSEC/10.
CPU2_MILLISEC INTEGER Processor time used by CPU2, in milliseconds. This is the sum ofSYSCPU2.
CPU2_UTIL_MAX_PCT FLOAT Maximum SYSCPU2 utilization, in percent. Calculated as themaximum of SYSCPU2/INTSEC/10.
CPU3_MILLISEC INTEGER Processor time used by CPU3, in milliseconds. This is the sum ofSYSCPU3.
CPU3_UTIL_MAX_PCT FLOAT Maximum SYSCPU3 utilization, in percent. Calculated as themaximum of SYSCPU3/INTSEC/10.
CPU4_MILLISEC INTEGER Processor time used by CPU4, in milliseconds. This is the sum ofSYSCPU4.
CPU4_UTIL_MAX_PCT FLOAT Maximum SYSCPU4 utilization, in percent. Calculated as themaximum of SYSCPU4/INTSEC/10.
CPU5_MILLISEC INTEGER Processor time used by CPU5, in milliseconds. This is the sum ofSYSCPU5. (V3R7 and later.)
CPU5_UTIL_MAX_PCT FLOAT Maximum SYSCPU5 utilization, in percent. Calculated as themaximum of SYSCPU5/INTSEC/10. (V3R7 and later.)
CPU6_MILLISEC INTEGER Processor time used by CPU6, in milliseconds. This is the sum ofSYSCPU6. (V3R7 and later.)
CPU6_UTIL_MAX_PCT FLOAT Maximum SYSCPU6 utilization, in percent. Calculated as themaximum of SYSCPU6/INTSEC/10. (V3R7 and later.)
CPU7_MILLISEC INTEGER Processor time used by CPU7, in milliseconds. This is the sum ofSYSCPU7. (V3R7 and later.)
CPU7_UTIL_MAX_PCT FLOAT Maximum SYSCPU7 utilization, in percent. Calculated as themaximum of SYSCPU7/INTSEC/10. (V3R7 and later.)
CPU8_MILLISEC INTEGER Processor time used by CPU8, in milliseconds. This is the sum ofSYSCPU8. (V3R7 and later.)
CPU8_UTIL_MAX_PCT FLOAT Maximum SYSCPU8 utilization, in percent. Calculated as themaximum of SYSCPU8/INTSEC/10. (V3R7 and later.)
CPU9_MILLISEC INTEGER Processor time used by CPU9, in milliseconds. This is the sum ofSYSCPU9. (V3R7 and later.)
CPU9_UTIL_MAX_PCT FLOAT Maximum SYSCPU9 utilization, in percent. Calculated as themaximum of SYSCPU9/INTSEC/10. (V3R7 and later.)
CPU10_MILLISEC INTEGER Processor time used by CPU10, in milliseconds. This is the sum ofSYSCPU10. (V3R7 and later.)
CPU10_UTIL_MAX_PCT FLOAT Maximum SYSCPU10 utilization, in percent. Calculated as themaximum of SYSCPU10/INTSEC/10. (V3R7 and later.)
51AS/400 System Performance Feature Guide and Reference
4.D
atatab
lesan
dlo
oku
ptab
les

Column name Data type Description
CPU11_MILLISEC INTEGER Processor time used by CPU11, in milliseconds. This is the sum ofSYSCPU11. (V3R7 and later.)
CPU11_UTIL_MAX_PCT FLOAT Maximum SYSCPU11 utilization, in percent. Calculated as themaximum of SYSCPU11/INTSEC/10. (V3R7 and later.)
CPU12_MILLISEC INTEGER Processor time used by CPU12, in milliseconds. This is the sum ofSYSCPU12. (V3R7 and later.)
CPU12_UTIL_MAX_PCT FLOAT Maximum SYSCPU12 utilization, in percent. Calculated as themaximum of SYSCPU12/INTSEC/10. (V3R7 and later.)
CPU13_MILLISEC INTEGER Processor time used by CPU13, in milliseconds. This is the sum ofSYSCPU13. (V3R7 and later.)
CPU13_UTIL_MAX_PCT FLOAT Maximum SYSCPU13 utilization, in percent. Calculated as themaximum of SYSCPU13/INTSEC/10. (V3R7 and later.)
CPU14_MILLISEC INTEGER Processor time used by CPU14, in milliseconds. This is the sum ofSYSCPU14. (V3R7 and later.)
CPU14_UTIL_MAX_PCT FLOAT Maximum SYSCPU14 utilization, in percent. Calculated as themaximum of SYSCPU14/INTSEC/10. (V3R7 and later.)
CPU15_MILLISEC INTEGER Processor time used by CPU15, in milliseconds. This is the sum ofSYSCPU15. (V3R7 and later.)
CPU15_UTIL_MAX_PCT FLOAT Maximum SYSCPU15 utilization, in percent. Calculated as themaximum of SYSCPU15/INTSEC/10. (V3R7 and later.)
CPU16_MILLISEC INTEGER Processor time used by CPU16, in milliseconds. This is the sum ofSYSCPU16. (V3R7 and later.)
CPU16_UTIL_MAX_PCT FLOAT Maximum SYSCPU16 utilization, in percent. Calculated as themaximum of SYSCPU16/INTSEC/10. (V3R7 and later.)
CPU17_MILLISEC INTEGER Processor time used by CPU17, in milliseconds. This is the sum ofSYSCPU17. (V3R7 and later.)
CPU17_UTIL_MAX_PCT FLOAT Maximum SYSCPU17 utilization, in percent. Calculated as themaximum of SYSCPU17/INTSEC/10. (V3R7 and later.)
CPU18_MILLISEC INTEGER Processor time used by CPU18, in milliseconds. This is the sum ofSYSCPU18. (V3R7 and later.)
CPU18_UTIL_MAX_PCT FLOAT Maximum SYSCPU18 utilization, in percent. Calculated as themaximum of SYSCPU18/INTSEC/10. (V3R7 and later.)
CPU19_MILLISEC INTEGER Processor time used by CPU19, in milliseconds. This is the sum ofSYSCPU19. (V3R7 and later.)
CPU19_UTIL_MAX_PCT FLOAT Maximum SYSCPU19 utilization, in percent. Calculated as themaximum of SYSCPU19/INTSEC/10. (V3R7 and later.)
CPU20_MILLISEC INTEGER Processor time used by CPU20, in milliseconds. This is the sum ofSYSCPU20. (V3R7 and later.)
CPU20_UTIL_MAX_PCT FLOAT Maximum SYSCPU20 utilization, in percent. Calculated as themaximum of SYSCPU20/INTSEC/10. (V3R7 and later.)
CPU21_MILLISEC INTEGER Processor time used by CPU21, in milliseconds. This is the sum ofSYSCPU21. (V3R7 and later.)
CPU21_UTIL_MAX_PCT FLOAT Maximum SYSCPU21 utilization, in percent. Calculated as themaximum of SYSCPU21/INTSEC/10. (V3R7 and later.)
CPU22_MILLISEC INTEGER Processor time used by CPU22, in milliseconds. This is the sum ofSYSCPU22. (V3R7 and later.)
CPU22_UTIL_MAX_PCT FLOAT Maximum SYSCPU22 utilization, in percent. Calculated as themaximum of SYSCPU22/INTSEC/10. (V3R7 and later.)
CPU23_MILLISEC INTEGER Processor time used by CPU23, in milliseconds. This is the sum ofSYSCPU23. (V3R7 and later.)
CPU23_UTIL_MAX_PCT FLOAT Maximum SYSCPU23 utilization, in percent. Calculated as themaximum of SYSCPU23/INTSEC/10. (V3R7 and later.)
52 Release 5

Column name Data type Description
CPU24_MILLISEC INTEGER Processor time used by CPU24, in milliseconds. This is the sum ofSYSCPU24. (V3R7 and later.)
CPU24_UTIL_MAX_PCT FLOAT Maximum SYSCPU24 utilization, in percent. Calculated as themaximum of SYSCPU24/INTSEC/10. (V3R7 and later.)
CPU25_MILLISEC INTEGER Processor time used by CPU25, in milliseconds. This is the sum ofSYSCPU25. (V3R7 and later.)
CPU25_UTIL_MAX_PCT FLOAT Maximum SYSCPU25 utilization, in percent. Calculated as themaximum of SYSCPU25/INTSEC/10. (V3R7 and later.)
CPU26_MILLISEC INTEGER Processor time used by CPU26, in milliseconds. This is the sum ofSYSCPU26. (V3R7 and later.)
CPU26_UTIL_MAX_PCT FLOAT Maximum SYSCPU26 utilization, in percent. Calculated as themaximum of SYSCPU26/INTSEC/10. (V3R7 and later.)
CPU27_MILLISEC INTEGER Processor time used by CPU27, in milliseconds. This is the sum ofSYSCPU27. (V3R7 and later.)
CPU27_UTIL_MAX_PCT FLOAT Maximum SYSCPU27 utilization, in percent. Calculated as themaximum of SYSCPU27/INTSEC/10. (V3R7 and later.)
CPU28_MILLISEC INTEGER Processor time used by CPU28, in milliseconds. This is the sum ofSYSCPU28. (V3R7 and later.)
CPU28_UTIL_MAX_PCT FLOAT Maximum SYSCPU28 utilization, in percent. Calculated as themaximum of SYSCPU28/INTSEC/10. (V3R7 and later.)
CPU29_MILLISEC INTEGER Processor time used by CPU29, in milliseconds. This is the sum ofSYSCPU29. (V3R7 and later.)
CPU29_UTIL_MAX_PCT FLOAT Maximum SYSCPU29 utilization, in percent. Calculated as themaximum of SYSCPU29/INTSEC/10. (V3R7 and later.)
CPU30_MILLISEC INTEGER Processor time used by CPU30, in milliseconds. This is the sum ofSYSCPU30. (V3R7 and later.)
CPU30_UTIL_MAX_PCT FLOAT Maximum SYSCPU30 utilization, in percent. Calculated as themaximum of SYSCPU30/INTSEC/10. (V3R7 and later.)
CPU31_MILLISEC INTEGER Processor time used by CPU31, in milliseconds. This is the sum ofSYSCPU31. (V3R7 and later.)
CPU31_UTIL_MAX_PCT FLOAT Maximum SYSCPU31 utilization, in percent. Calculated as themaximum of SYSCPU31/INTSEC/10. (V3R7 and later.)
CPU32_MILLISEC INTEGER Processor time used by CPU32, in milliseconds. This is the sum ofSYSCPU32. (V3R7 and later.)
CPU32_UTIL_MAX_PCT FLOAT Maximum SYSCPU32 utilization, in percent. Calculated as themaximum of SYSCPU32/INTSEC/10. (V3R7 and later.)
DB_CPU_MSEC FLOAT Database CPU time in milliseconds. New with DSD/EWL support inV4R5. Calculated as the sum of SYSDBC.
DECDATA_EXC_CNT INTEGER Number of decimal data exceptions. This is the sum of SYDECD.
DIRPG_FAULT_CNT INTEGER Number of directory page faults. This is the sum of SYDPGF.
DISK_UTIL_MAX INTEGER Sum of maximum disk utilization. This is the sum of SMXDU.
EADDR_LOFL_EXC_CNT INTEGER Number of effective address length overflow exceptions. This is thesum of SYEAOL.
EADDR_OFL_EXC_CNT INTEGER Number of effective address overflow exceptions. This is the sum ofSYEAOT.
EXCEPTION_CNT INTEGER Number of exceptions. This is the sum of SYEXPN.
EXP_ACC_PATH_JRN INTEGER Exposed access paths currently being journalized by the system. Thisis the sum of STJOJY. (V3R2 and later.)
EXP_ACC_PATH_NOJRN INTEGER Exposed access paths currently not being journalized. This is the sumof STJOJN. (V3R2 and later.)
53AS/400 System Performance Feature Guide and Reference
|||||
4.D
atatab
lesan
dlo
oku
ptab
les

Column name Data type Description
FALSE_TRAP_CNT INTEGER False traps, that is, the number of space address computations thatrequired extra processing. New with OS/400 V4R4. It is the sum ofSYHFTS.
IND_REBLD_CNT INTEGER Number of index rebuilds system wide. This is the sum of SYIXRB.(V3R2 and later.)
INTER_FEAT_MSEC FLOAT Time used on interactive feature. New with the support of interactivecounters in V4R5. Calculated as the sum of SYIFUS.
INT_THRS_EXCD_MSEC FLOAT Time used on exceeding the interactive threshold. New with thesupport of interactive counters in V4R5. Calculated as the sum ofSYIFTE.
JRNDEP_SYSJRN_TOT INTEGER Journal deposits resulting from system-journaled objects–total. This isthe sum of SYJOID. (V3R2 and later.)
JRNDEP_SYS_TO_USR INTEGER Journal deposits resulting from system-journaled objects touser-created journals. This is the sum of SYJOJP. (V3R2 and later.)
JRNDEP_USRJRN INTEGER Journal deposits resulting from user-journaled objects. This is the sumof SYJOXD. (V3R2 and later.)
MCPG_FAULT_CNT INTEGER Number of microcode page faults. This is the sum of SYMPGF.
MEASURED_SEC INTEGER Total measurement time, in seconds. This is the sum of INTSEC.
MPOOL_PG_CNT INTEGER Number of machine pool paging operations. This is the sum ofSMPLP.
MPOOL_PG_MAX_CNT INTEGER Number of user pool paging operations for pool with highest paging.This is the sum of SMUPL.
MRT_MAX_SEC INTEGER Number of seconds spent at MRTMAX by all multi-requestingterminals. This is the sum of SMMMT.
MRT_REQ_CNT INTEGER Number of requests routed to a multi-requesting terminal. This is thesum of SMMME.
MTASK_READ_CNT INTEGER Number of microtask read operations. This is the sum of SYMCTR.
MTASK_WRITE_CNT INTEGER Number of microtask write operations. This is the sum of SYMCTW.
OPEN_SYST_CNT INTEGER Number of full opens system wide. This is the sum of SYFOPN.(V3R2 and later.)
PERM_TRANS_BLOCK INTEGER Number of 512-byte blocks of permanent data transferred from mainstorage. This is the sum of SYPRMW.
REDUND_TRANS_BLOCK INTEGER Number of 512-byte blocks of redundancy data transferred from mainstorage. This is the sum of SYXSRW.
SAMPLES INTEGER Total number of measurement intervals. This is the count of INTNUM.
SEC_WRKLD_CPU_MSEC FLOAT Secondary workload CPU in milliseconds. New with DSD/EWLsupport in V4R5. Calculated as the sum of SYSSWC.
SEIZE_WAIT_EXC_CNT INTEGER Number of seize wait exceptions. This is the sum of SYSEZC.
SEIZE_WAIT_TIME INTEGER Seize/Wait time in milliseconds. This is the sum of SYSZWT. (V3R2and later.)
SIZE_EXC_CNT INTEGER Number of size exceptions. This is the sum of SYSIZC.
STPJRN_OP_USR INTEGER Stop journal operations initiated by user. This is the sum of SYJOXP.(V3R2 and later.)
STRJRN_OP_USR INTEGER Start journal operations initiated by user. This is the sum of SYJOXR.(V3R2 and later.)
STPJRN_OP_SYS INTEGER Stop journal operations initiated by system. This is the sum ofSYJOIP. (V3R2 and later.)
STRJRN_OP_SYS INTEGER Start journal operations initiated by system. This is the sum ofSYJOIR. (V3R2 and later.)
SYNCH_LOCK_CNT INTEGER Number of synchronous lock conflicts. This is the sum of SYSYNL.
54 Release 5
||||||
|||||
||||||
|||||
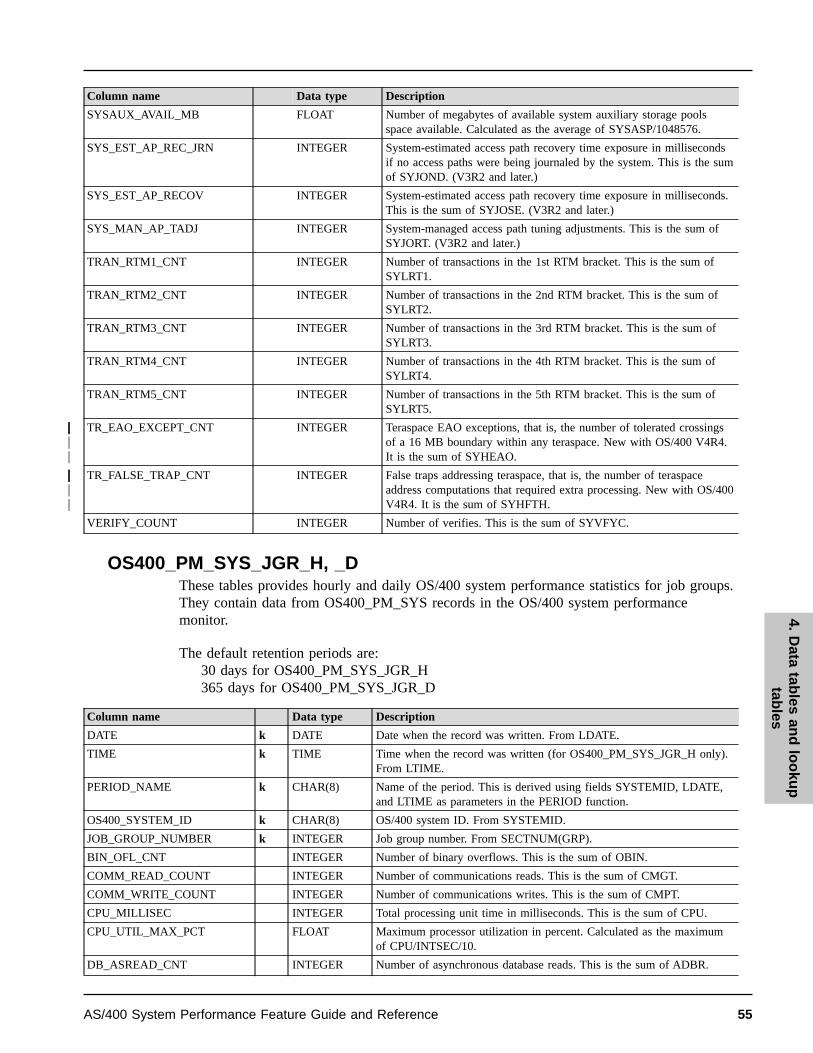
Column name Data type Description
SYSAUX_AVAIL_MB FLOAT Number of megabytes of available system auxiliary storage poolsspace available. Calculated as the average of SYSASP/1048576.
SYS_EST_AP_REC_JRN INTEGER System-estimated access path recovery time exposure in millisecondsif no access paths were being journaled by the system. This is the sumof SYJOND. (V3R2 and later.)
SYS_EST_AP_RECOV INTEGER System-estimated access path recovery time exposure in milliseconds.This is the sum of SYJOSE. (V3R2 and later.)
SYS_MAN_AP_TADJ INTEGER System-managed access path tuning adjustments. This is the sum ofSYJORT. (V3R2 and later.)
TRAN_RTM1_CNT INTEGER Number of transactions in the 1st RTM bracket. This is the sum ofSYLRT1.
TRAN_RTM2_CNT INTEGER Number of transactions in the 2nd RTM bracket. This is the sum ofSYLRT2.
TRAN_RTM3_CNT INTEGER Number of transactions in the 3rd RTM bracket. This is the sum ofSYLRT3.
TRAN_RTM4_CNT INTEGER Number of transactions in the 4th RTM bracket. This is the sum ofSYLRT4.
TRAN_RTM5_CNT INTEGER Number of transactions in the 5th RTM bracket. This is the sum ofSYLRT5.
TR_EAO_EXCEPT_CNT INTEGER Teraspace EAO exceptions, that is, the number of tolerated crossingsof a 16 MB boundary within any teraspace. New with OS/400 V4R4.It is the sum of SYHEAO.
TR_FALSE_TRAP_CNT INTEGER False traps addressing teraspace, that is, the number of teraspaceaddress computations that required extra processing. New with OS/400V4R4. It is the sum of SYHFTH.
VERIFY_COUNT INTEGER Number of verifies. This is the sum of SYVFYC.
OS400_PM_SYS_JGR_H, _DThese tables provides hourly and daily OS/400 system performance statistics for job groups.They contain data from OS400_PM_SYS records in the OS/400 system performancemonitor.
The default retention periods are:30 days for OS400_PM_SYS_JGR_H365 days for OS400_PM_SYS_JGR_D
Column name Data type Description
DATE k DATE Date when the record was written. From LDATE.
TIME k TIME Time when the record was written (for OS400_PM_SYS_JGR_H only).From LTIME.
PERIOD_NAME k CHAR(8) Name of the period. This is derived using fields SYSTEMID, LDATE,and LTIME as parameters in the PERIOD function.
OS400_SYSTEM_ID k CHAR(8) OS/400 system ID. From SYSTEMID.
JOB_GROUP_NUMBER k INTEGER Job group number. From SECTNUM(GRP).
BIN_OFL_CNT INTEGER Number of binary overflows. This is the sum of OBIN.
COMM_READ_COUNT INTEGER Number of communications reads. This is the sum of CMGT.
COMM_WRITE_COUNT INTEGER Number of communications writes. This is the sum of CMPT.
CPU_MILLISEC INTEGER Total processing unit time in milliseconds. This is the sum of CPU.
CPU_UTIL_MAX_PCT FLOAT Maximum processor utilization in percent. Calculated as the maximumof CPU/INTSEC/10.
DB_ASREAD_CNT INTEGER Number of asynchronous database reads. This is the sum of ADBR.
55AS/400 System Performance Feature Guide and Reference
||||||
||||||
4.D
atatab
lesan
dlo
oku
ptab
les

Column name Data type Description
DB_ASWRITE_CNT INTEGER Number of asynchronous database writes. This is the sum of ADBW.
DB_LOG_READ_COUNT INTEGER Number of logical database reads. This is the sum of LDBR.
DB_LOG_WRITE_COUNT INTEGER Number of logical database writes. This is the sum of LDBW.
DB_MISC_OPER_COUNT INTEGER Number of miscellaneous database operations. This is the sum of LDBU.
DBNDB_PS_WRITE_CNT INTEGER Number of physical synchronous database and non-database writes. Thisis the sum of PWRT.
DB_PS_READ_COUNT INTEGER Number of physical synchronous database reads. This is the sum ofPDBR.
DB_SWRITE_CNT INTEGER Number of synchronous database writes. This is the sum of DBW.
DECIMAL_OFL_CNT INTEGER Number of decimal overflows. This is the sum of ODEC.
EADDR_OFL_EXC_CNT INTEGER Number of effective address overflow exceptions. This is the sum ofEAO.
EFS_REG_FILE_READS INTEGER Enhanced file system regular file reads. This is the sum of XRFR.(V3R2 and later.)
EFS_REG_FILE_WRTES INTEGER Enhanced file system regular file writes. This is the sum of XRFW.(V3R2 and later.)
EFS_SYM_DIR_READS INTEGER Enhanced file system directory reads. This is the sum of XDYR. (V3R2and later.)
EFS_SYM_DR_LC_HITS INTEGER Enhanced file system directory lookup cache hits. This is the sum ofDLCH. (V3R2 and later.)
EFS_SYM_DR_LC_MISS INTEGER Enhanced file system directory lookup cache misses. This is the sum ofDLCM. (V3R2 and later.)
EFS_SYM_LINK_READS INTEGER Enhanced file system symbolic link reads. This is the sum of XSLR.(V3R2 and later.)
FLP_OFL_CNT INTEGER Number of floating point overflows. This is the sum of OFLP.
IO_CHECKSUM_CNT INTEGER Number of checksum I/Os. This is the sum of CS.
IO_WAIT_COUNT INTEGER Number of waits for asynchronous I/O operations. This is the sum ofWIO.
JOB_END_COUNT INTEGER Number of ended jobs. This is the sum of JBTERM.
JOBS INTEGER Total number of jobs. This is the sum of JBCT.
JOB_START_COUNT INTEGER Number of started jobs. This is the sum of JBNEW.
MEASURED_SEC INTEGER Total measurement time in seconds. This is the sum of INTSEC.
NBD_PS_READ_COUNT INTEGER Number of physical synchronous non-database reads. This is the sum ofPNDB.
NDB_ASREAD_CNT INTEGER Number of asynchronous non-database reads. This is the sum of ANDR.
NDB_ASWRITE_CNT INTEGER Number of asynchronous non-database writes. This is the sum ofANDW.
NDB_SWRITE_CNT INTEGER Number of synchronous non-database writes. This is the sum of NDW.
PAGE_FAULT_AUX_CNT INTEGER Number of page faults on an address currently part of an auxiliary I/Ooperation. This is the sum of IPF.
PAGE_FAULT_CNT INTEGER Number of program access group (PAG) faults. This is the sum ofPAGF.
PRINT_LINE_COUNT INTEGER Number of print lines. This is the sum of PRTL.
PRINT_PAGE_COUNT INTEGER Number of print pages. This is the sum of PRTP.
REROUTE_WAIT_MS INTEGER Total time a job waited during rerouting in milliseconds. This is the sumof RRTT.
SAMPLES INTEGER Total number of measurement intervals. This is the sum of INTNUM.
SEIZE_WAIT_TIME INTEGER Seize/wait time in milliseconds. This is the sum of SZWT. (V3R2 andlater.)
56 Release 5

Column name Data type Description
SOCKET_BS_REC_CNT INTEGER Number of socket bytes received. This is the sum of SKBR. (V3R2 andlater.)
SOCKET_BS_SENT_CNT INTEGER Number of socket bytes sent. This is the sum of SKBS. (V3R2 andlater.)
SOCKET_RECS_CNT INTEGER Number of socket receives. This is the sum of SKRC. (V3R2 and later.)
SOCKET_SENDS_CNT INTEGER Number of socket sends. This is the sum of SKSC. (V3R2 and later.)
SUSPEND_MILLISEC INTEGER Total job suspend time in milliseconds. This is the sum of SPDT.
TRAN_MILLISEC INTEGER Total transaction time in milliseconds. This is the sum of TRNT.
TRAN_PNO_COUNT INTEGER Number of DYNAMIC PURGE(*NO) transactions. This is the sum ofPRG.
TRAN_PYES_COUNT INTEGER Number of PURGE(*YES) transactions. This is the sum of BRG.
TRAN_RATE_MAX FLOAT Maximum number of transactions per second. Calculated as themaximum of TRNT/INTSEC.
TRAN_RESP_MAX_SEC FLOAT Maximum transaction response time in seconds. Calculated as themaximum of TRNT/TRNS.
TRANSACTIONS INTEGER Number of transactions. This is the sum of TRNS.
WRITE_PERM_CNT INTEGER Number of permanent writes. This is the sum of PW.
OS400_PERF_SUM_H, _DThese tables provide hourly and daily summary performance statistics. They contain datafrom DRL8003 messages in the history file.
The default retention periods are:30 days for OS400_PERF_SUM_H365 days for OS400_PERF_SUM_D
Column name Data type Description
DATE k DATE Date when the record was written. From LOGDATE.
TIME k TIME Time when the record was written (for OS400_PERF_SUM_H only).Calculated from LOGTIME and MINT.
PERIOD_NAME k CHAR(8) Name of the period. This is derived using the field SYSTEMID andcalculations from the fields LOGDATE, LOGTIME and MINT asparameters in the PERIOD function.
OS400_SYSTEM_ID k CHAR(8) System identification. From SYSTEMID.
AUX_STOR_AVAIL_MB FLOAT Average of available auxiliary storage, in megabytes. This is the averageof AAUX.
AUX_STOR_MB FLOAT Average of total auxiliary storage, in megabytes. This is the average ofTAUX.
CPU_PCT_MAX FLOAT Maximum processor time used, in percent. Calculated as the maximum of100*CPUU/MINT.
CPU_SECONDS INTEGER Total processor time used, in seconds. This is the sum of CPUU.
IO_COUNT INTEGER Sum of I/Os. This is the sum of IOS.
IO_MAX_RATE FLOAT Maximum I/O rate. Calculated as the maximum of IOS/MINT.
JOB_COUNT INTEGER Sum of jobs. This is the sum of TJOBS.
MEASURED_SEC INTEGER Total measurement time, in seconds. This is the sum of MSINT
PAGE_COUNT INTEGER Sum of pages. This is the sum of PAGES.
PAGE_MAX_RATE FLOAT Maximum page rate. Calculated as the maximum of PAGES/MINT.
SAMPLES INTEGER Total number of measurement intervals. This is the count of MSGID.
57AS/400 System Performance Feature Guide and Reference
||
4.D
atatab
lesan
dlo
oku
ptab
les

SP400 feature lookup tablesThis section describes the following lookup tables specific to the SP400 feature:
¶ OS400_JOB_ACCTCODE.
¶ “OS400_DASDTYPE”.
¶ “OS400_JOBGROUP” on page 60.
For descriptions of common lookup tables used by the SP400 feature and other PerformanceReporter features, refer to the Administration Guide.
OS400_JOB_ACCTCODEThis lookup table is used in the SP400 feature job statistics component and contains accountcode information. It converts system identification, user name, job name and job type to anaccounting code.
Column name Data type Description
OS400_SYSTEM_ID k CHAR(8) System identification. This field can contain global search characters.
USER_NAME k CHAR(10) User name. This field can contain global search characters.
JOB_NAME k CHAR(10) Job name. This field can contain global search characters.
JOB_TYPE k CHAR(3) Job type. This field can contain global search characters.
ACCOUNT_CODE CHAR(15) Accounting code to be assigned to job
Example of table contentsOS400_SYSTEM_ID USER_NAME JOB_NAME JOB_TYPE ACCOUNT_CODE--------------- --------- -------- -------- ---------------S44A0061 LENNART % % 100000000000000S44A0061 ALMOS % % 100000000000000S44A0061 RAYNER % % 400000000000000S44A0061 DAVIS % B 400000000000000S44A0061 DAVIS % I 406600000000000% % % % 999999999999999
The above six table entries are explained as follows:
1. The user LENNART is given the account code 100000000000000 for all job names and alljob types in the system S44A0061
2. The user ALMOS is also given the account code 100000000000000 for all job names andall job types in the system S44A0061
3. The user RAYNER is given the account code 400000000000000 for all job names and alljob types in the system S44A0061
4. The user DAVIS is given the account code 400000000000000 for all job names with jobtype B in the system S44A0061
5. The user DAVIS is given the account code 406600000000000 for all job names with jobtype I in the system S44A0061
6. The default account code 999999999999999 is given for all other jobs in all othersystems.
OS400_DASDTYPEThis lookup table is used in the SP400 feature configuration component to calculate DASDcapacity for a device type and model.
58 Release 5
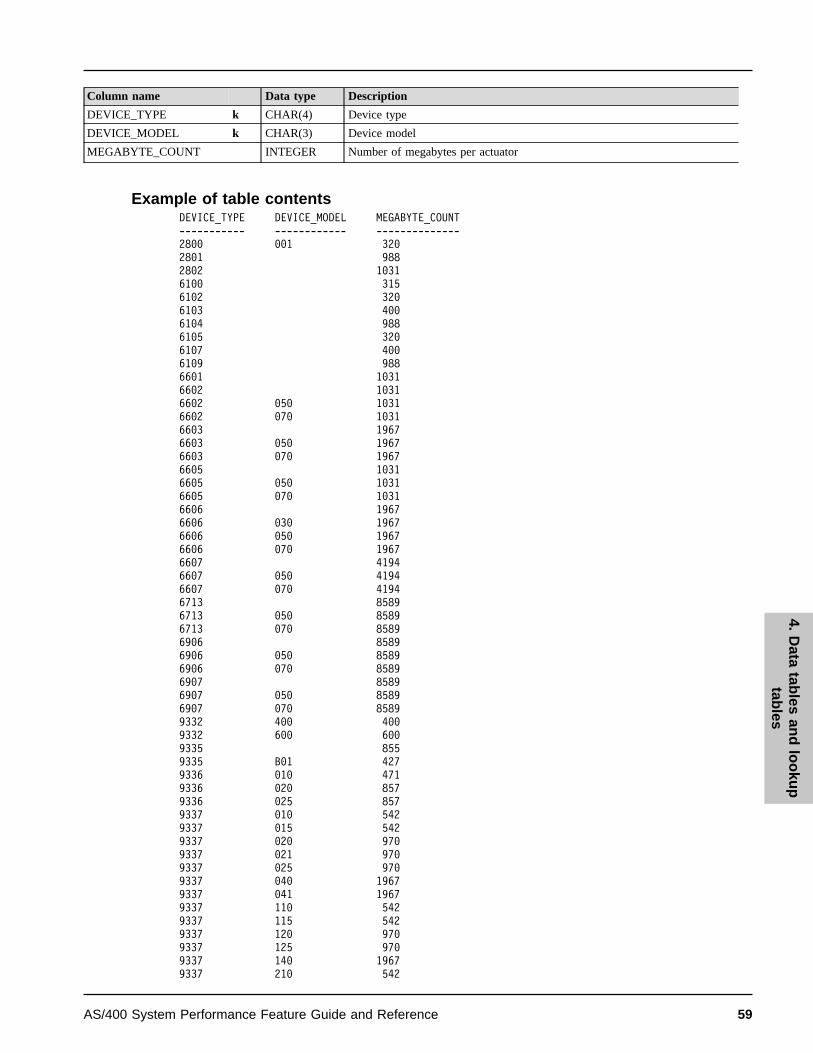
Column name Data type Description
DEVICE_TYPE k CHAR(4) Device type
DEVICE_MODEL k CHAR(3) Device model
MEGABYTE_COUNT INTEGER Number of megabytes per actuator
Example of table contentsDEVICE_TYPE DEVICE_MODEL MEGABYTE_COUNT----------- ------------ --------------2800 001 3202801 9882802 10316100 3156102 3206103 4006104 9886105 3206107 4006109 9886601 10316602 10316602 050 10316602 070 10316603 19676603 050 19676603 070 19676605 10316605 050 10316605 070 10316606 19676606 030 19676606 050 19676606 070 19676607 41946607 050 41946607 070 41946713 85896713 050 85896713 070 85896906 85896906 050 85896906 070 85896907 85896907 050 85896907 070 85899332 400 4009332 600 6009335 8559335 B01 4279336 010 4719336 020 8579336 025 8579337 010 5429337 015 5429337 020 9709337 021 9709337 025 9709337 040 19679337 041 19679337 110 5429337 115 5429337 120 9709337 125 9709337 140 19679337 210 542
59AS/400 System Performance Feature Guide and Reference
4.D
atatab
lesan
dlo
oku
ptab
les
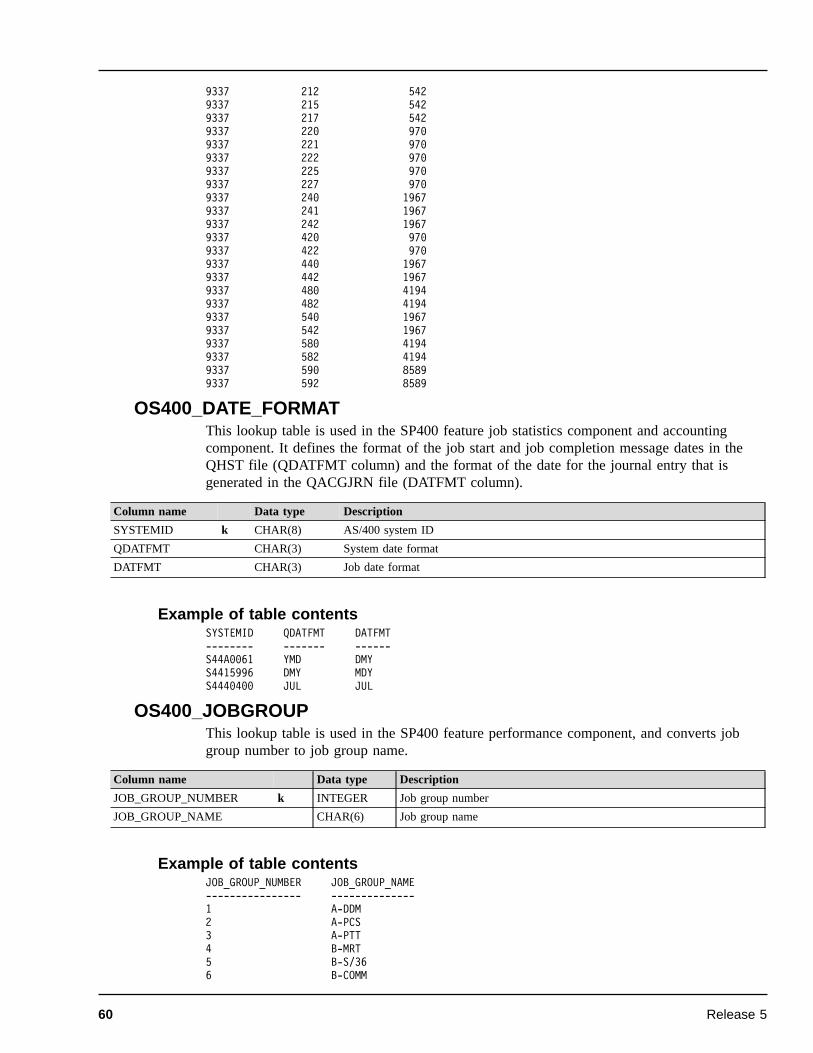
9337 212 5429337 215 5429337 217 5429337 220 9709337 221 9709337 222 9709337 225 9709337 227 9709337 240 19679337 241 19679337 242 19679337 420 9709337 422 9709337 440 19679337 442 19679337 480 41949337 482 41949337 540 19679337 542 19679337 580 41949337 582 41949337 590 85899337 592 8589
OS400_DATE_FORMATThis lookup table is used in the SP400 feature job statistics component and accountingcomponent. It defines the format of the job start and job completion message dates in theQHST file (QDATFMT column) and the format of the date for the journal entry that isgenerated in the QACGJRN file (DATFMT column).
Column name Data type Description
SYSTEMID k CHAR(8) AS/400 system ID
QDATFMT CHAR(3) System date format
DATFMT CHAR(3) Job date format
Example of table contentsSYSTEMID QDATFMT DATFMT-------- ------- ------S44A0061 YMD DMYS4415996 DMY MDYS4440400 JUL JUL
OS400_JOBGROUPThis lookup table is used in the SP400 feature performance component, and converts jobgroup number to job group name.
Column name Data type Description
JOB_GROUP_NUMBER k INTEGER Job group number
JOB_GROUP_NAME CHAR(6) Job group name
Example of table contentsJOB_GROUP_NUMBER JOB_GROUP_NAME---------------- --------------1 A-DDM2 A-PCS3 A-PTT4 B-MRT5 B-S/366 B-COMM
60 Release 5
7 B-AUTO8 B-BTCH9 A-INT10 B-CPF
You can find an explanation of the job groups, and see how these job groups are used in theperformance component, by referring to the report “OS/400 Perf CPU by Job Group, HourlyTrend” on page 97.
61AS/400 System Performance Feature Guide and Reference
4.D
atatab
lesan
dlo
oku
ptab
les

62 Release 5

Reports
The reporting function produces reports based on the data in the Performance Reporterdatabase. Reports can show data from tables or from views. You can request reports onlineor by submitting batch jobs. Typically, you use online reporting for reports that you useonce, and batch reporting for regularly required reports.
This chapter describes:
¶ The format of the names used to define each report, and how source tables, attributes,and variables are used
¶ The reports in the accounting component
¶ The reports in the configuration component
¶ The reports in the job statistics component
¶ The reports in the messages component
¶ The reports in the performance component
Report format and general descriptionPerformance Reporter presents reports in tables or graphs. All reports have the same basicreport layout. This section describes the elements that are common among PerformanceReporter feature reports:¶ Report ID¶ Report group¶ Source¶ Attributes¶ Variables
Report IDPerformance Reporter assigns each report a unique identifier. The SP400 feature uses thefollowing format for report IDs:
OS400yxx
where:
¶ y can be:A The accounting componentC The configuration componentJ The job statistics componentM The messages componentP The performance component
5
63AS/400 System Performance Feature Guide and Reference
5.R
epo
rts

¶ xx is a sequential number identifying the report.
Examples:OS400A01OS400P11
Report groupPerformance Reporter uses several predefined report groups. For SP400 feature, eachcomponent has one group. The five SP400 feature report groups are given on page 4.
Source TablesEach report contains information from one or more source tables. The report descriptions inthis chapter list source tables. Refer to these source tables if you are interested in learningwhere certain data originates.
AttributesEach report has certain attributes associated with it. Use these attributes as keywords tosearch for specific reports in the dialogs.
You can specify any number of attributes for a report, but these attributes are always presentfor predefined reports:
¶ The area to which the report belongs (for example, AS400)
¶ The task that the report supports:Performance Performance control taskService Service-level planning taskCapacity Capacity planning taskSecurity Security control taskConfiguration Configuration management disciplineOperation Operations management disciplineChange Change management disciplineProblem Problem management discipline
You can also specify these attributes, when appropriate:
¶ Resource types, such as storage or processor time
¶ Performance issues, such as availability or response
¶ Presentation forms, such as detail, overview, or trend
¶ Time resolutions, such as hourly, daily, or monthly
VariablesEach report has variables associated with it. You specify the values for these variables whenyou generate the report using the reporting dialog.
When you specify a date for a monthly report, specify the first day of the month. Otherwise,there is no match in the data table.
If a character variable has only numeric characters, enclose it in single quotation marks,otherwise it will not match the data. For example, if you have a system ID of 1234, specifyit as ’1234’ in the Variables window.
64 Release 5

Reports in the accounting componentThis section describes the following accounting component reports:
¶ “OS/400 Acct Job Accounting, Monthly Overview”.
¶ “OS/400 Acct Print Accounting, Monthly Overview” on page 66.
The data flow for the accounting component (including the names of OS/400 logs,Performance Reporter records and tables) is given in “SP400 feature accounting componentdata flow” on page 33.
OS/400 Acct Job Accounting, Monthly OverviewFor a specific OS/400 system in the network, this report (see Figure 29 on page 66) providesmonthly overview information about how much of the resources each user and departmenthas used, summarized by account code. The report can be used as a guide for charging usersand departments for the system resources they have used, and is produced by period name(for example, PRIME or NIGHT).
This information identifies the report:
Report ID OS400A01
Report group OS/400 Accounting Component Reports
Source OS400_ACCT_JOB_M (described on page 42)
Attributes OS400, Acct, Accounting, Job, Monthly, Overview,
Variables Month, Period name, OS400 system ID
65AS/400 System Performance Feature Guide and Reference
5.R
epo
rts

The report contains this information:
Account code The accounting code.
User name The user name.
Jobs (count) The number of jobs.
CPU time (hours) The total processor time, in hours. This is calculated asSUM(CPU_SECONDS)/3600.
I/O (1000s) The total number of auxiliary I/Os, in thousands. This iscalculated as SUM(IO_COUNT)/1000.
OS/400 Acct Print Accounting, Monthly OverviewFor a specific OS/400 system in the network, this report (see Figure 30 on page 67) providesmonthly overview information about how much of the printing resources each user anddepartment has used. The report is produced by period name (for example, PRIME orNIGHT), and can be used as a guide for charging users and departments for the printingresources they have used.
This information identifies the report:
Report ID OS400A02
Report group OS/400 Accounting Component Reports
OS/400 Acct Job Accounting, Monthly OverviewSystem: 'S44A0001'
Month: '2000-03-01' Period: 'PRIME'
CPUAccount User Jobs time I/Ocode name (count) (hours) (1000s)--------------- ---------- -------- --------- ---------
AURELL 34 0.46 15CHRISTIN 312 0.43 240FAXADMIN 62 0.16 1IBM 18 0.05 2JAN400 11 0.25 2JIVE 74 0.07 2LENNART 48 0.09 2QPGMR 12 0.03 1QSECOFR 21 0.12 14QSNADS 19 0.04 1QSYSOPR 80 0.28 9QUSER 21 0.02 1SVEN 62 0.24 4
-------- --------- ---------Total 774 2.24 294
*SYS QSNADS 32 0.11 5QSPLJOB 56 0.21 12
-------- --------- ---------Total 88 0.32 17
======== ========= =========Total 862 2.56 311
Performance Reporter Report: OS400A01
Figure 29. Example of OS/400 Acct Job Accounting, Monthly Overview
66 Release 5

Source OS400_ACCT_PRINT_M (described on page 43)
Attributes OS400, Acct, Accounting, Print, Monthly, Overview
Variables Month, Period name, OS400 system ID
The report contains this information:
Account code The accounting code.
User name The user name.
Form type The print form type.
Jobs (count) The number of jobs.
Print lines (count) The number of print lines.
Print pages (count) The number of print pages.
Reports in the configuration componentThis section describes the following configuration component reports:
¶ “OS/400 Config all Devices, Overview” on page 68.
¶ “OS/400 Config DASD Capacity Overview” on page 70.
¶ “OS/400 Config Main Storage Overview” on page 70.
¶ “OS/400 Config Device Count Type/Model, Overview” on page 71.
¶ “OS/400 Config Device for Specific Type, Overview” on page 72.
OS/400 Acct Print Accounting, Monthly OverviewSystem: 'S44A0001'
Month: '2000-03-01' Period: 'PRIME'
Print PrintAccount User Form Jobs lines pagescode name type (count) (count) (count)--------------- ---------- ---------- -------- -------- --------
CHRISTIN *STD 47 4520 248FAXADMIN *STD 2 157 5JIVE *STD 1 17 1
-------- -------- --------Total 50 4694 254
NI3 CPOPGMR *STD 1 12 1-------- -------- --------
Total 1 12 1
======== ======== ========Total 51 4706 255
Performance Reporter Report: OS400A02
Figure 30. Example of OS/400 Acct Print Accounting, Monthly Overview
67AS/400 System Performance Feature Guide and Reference
5.R
epo
rts

The data flow for the configuration component (including the names of OS/400 logs,Performance Reporter records, and tables) is given in “SP400 feature configurationcomponent data flow” on page 34.
OS/400 Config all Devices, OverviewFor a specific OS/400 system in the network, this report (see Figure 31 on page 69) providesoverview information about the hardware resources the system uses.
The following information identifies the report:
Report ID OS400C01
Report group OS/400 Configuration Component Reports
Source OS400_CONFIG (described on page 44)
Attributes OS400, Configuration, HW, Hardware, Device Overview
Variables Date, OS/400 system ID
68 Release 5
|
||
||
||
||
||

The report contains the following information:
Resource Name The resource name.
Resource Type The resource type.
Resource Serial number The resource serial number.
Resource Model The resource model.
Resource Part number The resource part number.
Resource Status The resource status.
OS/400 Config all devices, OverviewSystem: 'S44R6067'Date: 2000-4-22
Resource ResourceResource Resource serial Resource part Resourcename type no model no status---------- -------- ---------- -------- ------------ --------BCC01 00-0000000 3CC01 2617 53-6872005 001 0000085F9107 3CC02 2619 53-6859004 001 0000085F9089 3CC02 2619 53-6859004 001 0000085F9089 3CEC01 9402 44-R6067 40S 3CMB01 918B 53-6868135 001 0000074G9702 3CMB01 918B 53-6868135 001 0000074G9702 3CMN01 2609 53-6818562 001 0000021F4867 3CMN02 2609 53-6818562 001 0000021F4867 3CMN03 2617 53-6872005 001 0000085F9107 3CMN04 2619 53-6859004 001 0000085F9089 3CTL01 2661 53-6868135 001 0000074G9701 3CTL02 6055 53-6859004 001 0000085F9089 3DC01 6606 00-0C18815 030 3DC02 6606 00-0D14721 030 3DC03 6606 00-0D25034 030 3DC04 6380 00-4231503 001 3DC05 6320 00-00000 002 3DD001 6606 00-0D25034 030 3DD002 6606 00-0D14721 030 3DD003 6606 00-0C18815 030 3DSP002 5292 00-00000 001 3LIN01 2609 53-6818562 001 0000021F4867 3LIN02 2617 53-6872005 001 0000085F9107 3LIN03 2619 53-6859004 001 0000085F9089 3LIN04 605A 53-6859004 001 0000085F9089 3MP01 2110 53-6875021 000 0000021H8384 3MS01 00-00000 3MS02 00-00000 3OPT01 6320 00-00000 002 3PN01 2468 00-0000000 001 0000021F5772 3SP01 918B 53-6868135 001 3TAP01 6380 00-4231503 001 3WS01 2661 53-6868135 001 0000074G9701 3
Performance Reporter Report: OS436C01
Figure 31. Example of OS/400 Config all Devices, Overview
69AS/400 System Performance Feature Guide and Reference
5.R
epo
rts
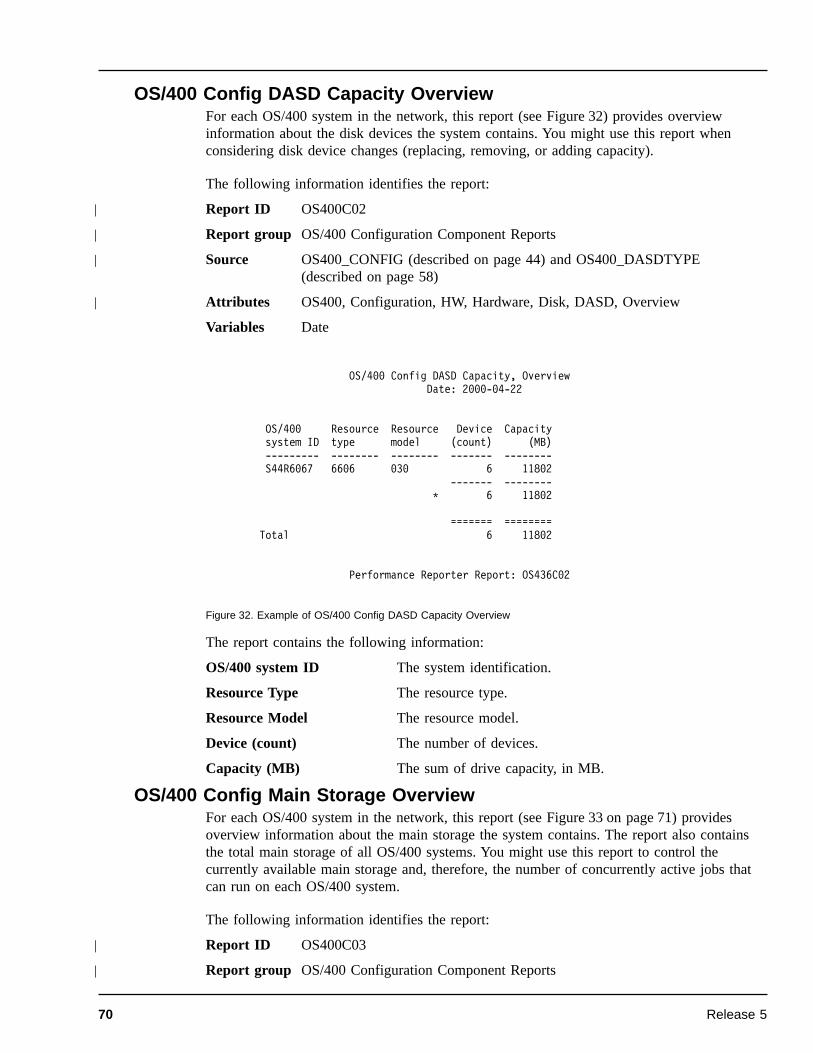
OS/400 Config DASD Capacity OverviewFor each OS/400 system in the network, this report (see Figure 32) provides overviewinformation about the disk devices the system contains. You might use this report whenconsidering disk device changes (replacing, removing, or adding capacity).
The following information identifies the report:
Report ID OS400C02
Report group OS/400 Configuration Component Reports
Source OS400_CONFIG (described on page 44) and OS400_DASDTYPE(described on page 58)
Attributes OS400, Configuration, HW, Hardware, Disk, DASD, Overview
Variables Date
The report contains the following information:
OS/400 system ID The system identification.
Resource Type The resource type.
Resource Model The resource model.
Device (count) The number of devices.
Capacity (MB) The sum of drive capacity, in MB.
OS/400 Config Main Storage OverviewFor each OS/400 system in the network, this report (see Figure 33 on page 71) providesoverview information about the main storage the system contains. The report also containsthe total main storage of all OS/400 systems. You might use this report to control thecurrently available main storage and, therefore, the number of concurrently active jobs thatcan run on each OS/400 system.
The following information identifies the report:
Report ID OS400C03
Report group OS/400 Configuration Component Reports
OS/400 Config DASD Capacity, OverviewDate: 2000-04-22
OS/400 Resource Resource Device Capacitysystem ID type model (count) (MB)--------- -------- -------- ------- --------S44R6067 6606 030 6 11802
------- --------* 6 11802
======= ========Total 6 11802
Performance Reporter Report: OS436C02
Figure 32. Example of OS/400 Config DASD Capacity Overview
70 Release 5
|
|
|
|
|
|

Source OS400_CONFIG (described on page 44)
Attributes OS400, Configuration, HW, Hardware, Storage, Overview
Variables Date
The report contains the following information:
OS/400 system ID The system identification.
Resource Name The resource name.
Resource Type The resource type.
Storage (MB) The number of megabytes of main storage.
OS/400 Config Device Count Type/Model, OverviewFor each OS/400 system in the network, this report (see Figure 34 on page 72) providesoverview information about their resource types (resource models and number of hardwaredevices). Detailed information about each resource type is provided in the report OS/400Config Device for Specific Type, Overview, which contains an an example of resource type2619).
The following information identifies the report:
Report ID OS400C04
Report group OS/400 Configuration Component Reports
Source OS400_CONFIG (described on page 44)
Attributes OS400, Configuration, HW, Hardware, Device, Overview
Variables Date
OS/400 Config Main Storage, OverviewDate: 2000-04-22
OS/400 Resource Resource Storagesystem ID name type (MB)--------- ---------- -------- -------S44R6067 MS01 815
MS02 815-------
* 1630
=======Total 1630
Performance Reporter: OS436C03
Figure 33. Example of OS/400 Config Main Storage Overview
71AS/400 System Performance Feature Guide and Reference
|
|
|
|
|
|
5.R
epo
rts
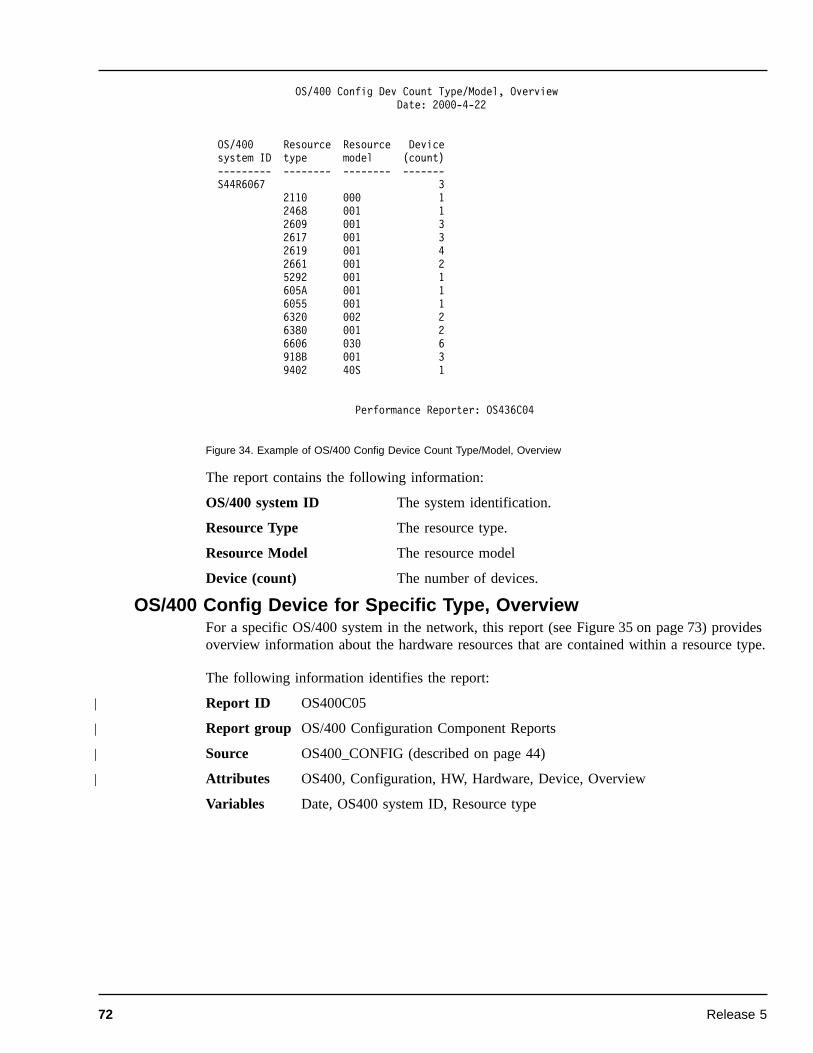
The report contains the following information:
OS/400 system ID The system identification.
Resource Type The resource type.
Resource Model The resource model
Device (count) The number of devices.
OS/400 Config Device for Specific Type, OverviewFor a specific OS/400 system in the network, this report (see Figure 35 on page 73) providesoverview information about the hardware resources that are contained within a resource type.
The following information identifies the report:
Report ID OS400C05
Report group OS/400 Configuration Component Reports
Source OS400_CONFIG (described on page 44)
Attributes OS400, Configuration, HW, Hardware, Device, Overview
Variables Date, OS400 system ID, Resource type
OS/400 Config Dev Count Type/Model, OverviewDate: 2000-4-22
OS/400 Resource Resource Devicesystem ID type model (count)--------- -------- -------- -------S44R6067 3
2110 000 12468 001 12609 001 32617 001 32619 001 42661 001 25292 001 1605A 001 16055 001 16320 002 26380 001 26606 030 6918B 001 39402 40S 1
Performance Reporter: OS436C04
Figure 34. Example of OS/400 Config Device Count Type/Model, Overview
72 Release 5
|
|
|
|
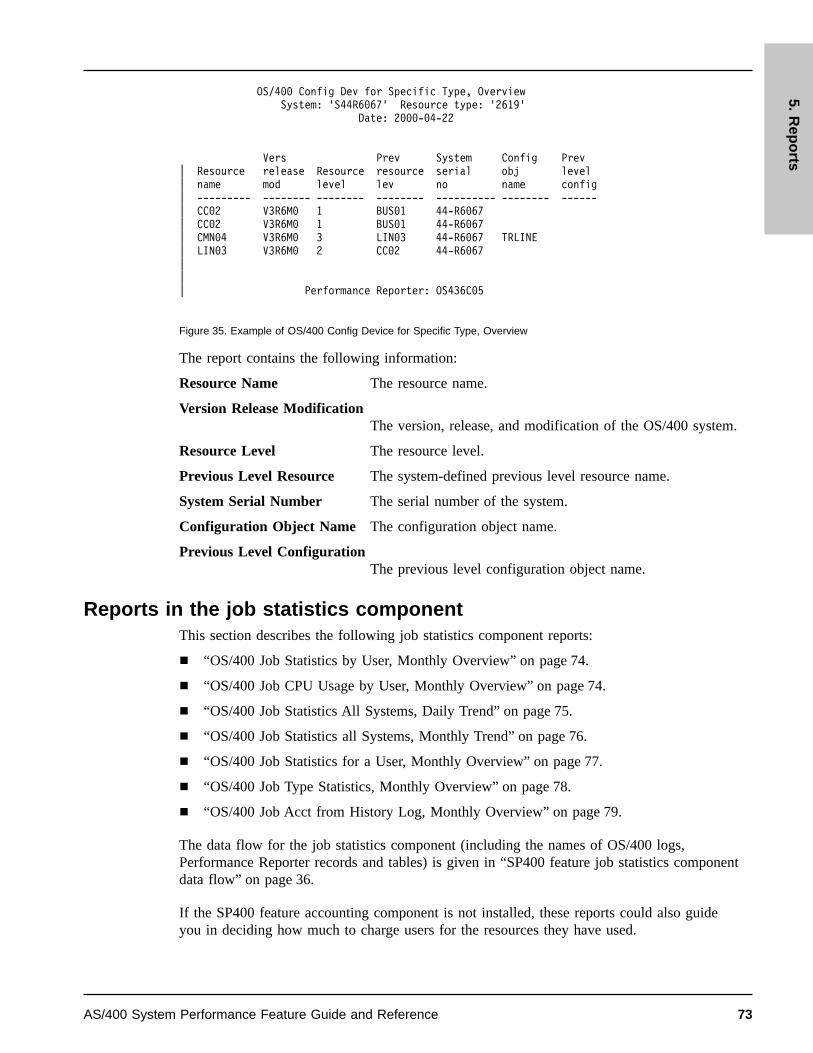
The report contains the following information:
Resource Name The resource name.
Version Release ModificationThe version, release, and modification of the OS/400 system.
Resource Level The resource level.
Previous Level Resource The system-defined previous level resource name.
System Serial Number The serial number of the system.
Configuration Object Name The configuration object name.
Previous Level ConfigurationThe previous level configuration object name.
Reports in the job statistics componentThis section describes the following job statistics component reports:
¶ “OS/400 Job Statistics by User, Monthly Overview” on page 74.
¶ “OS/400 Job CPU Usage by User, Monthly Overview” on page 74.
¶ “OS/400 Job Statistics All Systems, Daily Trend” on page 75.
¶ “OS/400 Job Statistics all Systems, Monthly Trend” on page 76.
¶ “OS/400 Job Statistics for a User, Monthly Overview” on page 77.
¶ “OS/400 Job Type Statistics, Monthly Overview” on page 78.
¶ “OS/400 Job Acct from History Log, Monthly Overview” on page 79.
The data flow for the job statistics component (including the names of OS/400 logs,Performance Reporter records and tables) is given in “SP400 feature job statistics componentdata flow” on page 36.
If the SP400 feature accounting component is not installed, these reports could also guideyou in deciding how much to charge users for the resources they have used.
OS/400 Config Dev for Specific Type, OverviewSystem: 'S44R6067' Resource type: '2619'
Date: 2000-04-22
Vers Prev System Config Prev| Resource release Resource resource serial obj level| name mod level lev no name config| --------- -------- -------- -------- ---------- -------- ------| CC02 V3R6M0 1 BUS01 44-R6067| CC02 V3R6M0 1 BUS01 44-R6067| CMN04 V3R6M0 3 LIN03 44-R6067 TRLINE| LIN03 V3R6M0 2 CC02 44-R6067||| Performance Reporter: OS436C05
Figure 35. Example of OS/400 Config Device for Specific Type, Overview
73AS/400 System Performance Feature Guide and Reference
5.R
epo
rts
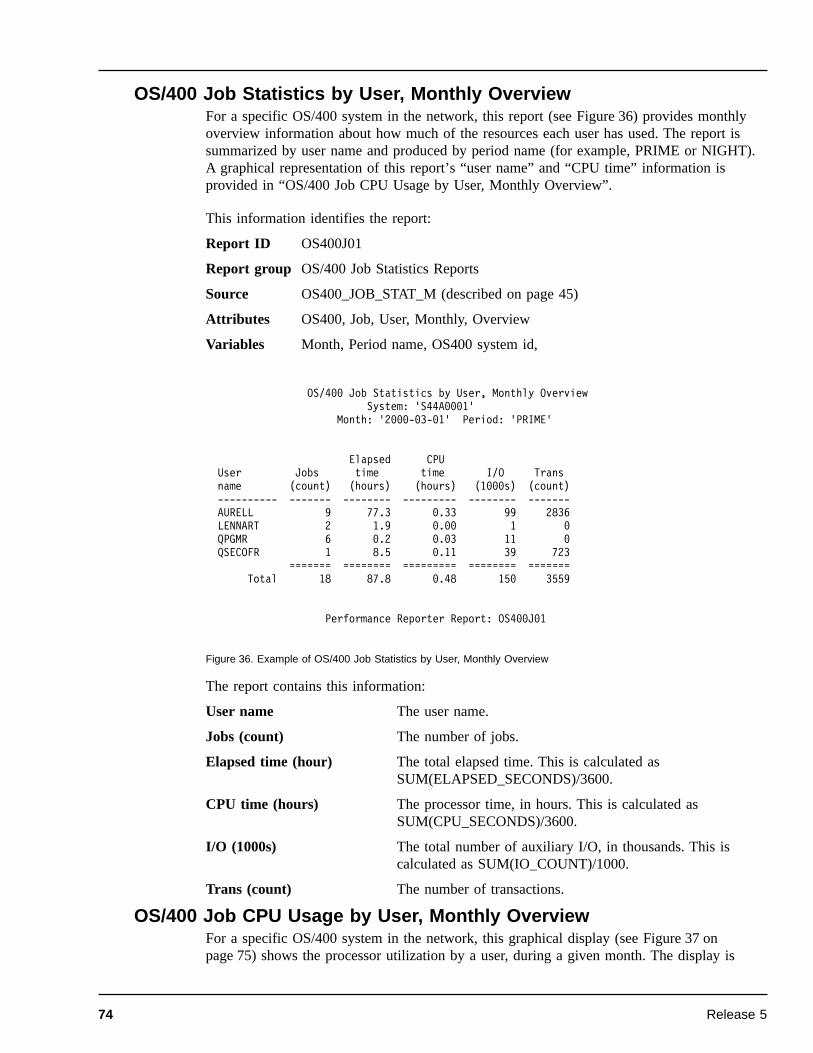
OS/400 Job Statistics by User, Monthly OverviewFor a specific OS/400 system in the network, this report (see Figure 36) provides monthlyoverview information about how much of the resources each user has used. The report issummarized by user name and produced by period name (for example, PRIME or NIGHT).A graphical representation of this report’s “user name” and “CPU time” information isprovided in “OS/400 Job CPU Usage by User, Monthly Overview”.
This information identifies the report:
Report ID OS400J01
Report group OS/400 Job Statistics Reports
Source OS400_JOB_STAT_M (described on page 45)
Attributes OS400, Job, User, Monthly, Overview
Variables Month, Period name, OS400 system id,
The report contains this information:
User name The user name.
Jobs (count) The number of jobs.
Elapsed time (hour) The total elapsed time. This is calculated asSUM(ELAPSED_SECONDS)/3600.
CPU time (hours) The processor time, in hours. This is calculated asSUM(CPU_SECONDS)/3600.
I/O (1000s) The total number of auxiliary I/O, in thousands. This iscalculated as SUM(IO_COUNT)/1000.
Trans (count) The number of transactions.
OS/400 Job CPU Usage by User, Monthly OverviewFor a specific OS/400 system in the network, this graphical display (see Figure 37 onpage 75) shows the processor utilization by a user, during a given month. The display is
OS/400 Job Statistics by User, Monthly OverviewSystem: 'S44A0001'
Month: '2000-03-01' Period: 'PRIME'
Elapsed CPUUser Jobs time time I/O Transname (count) (hours) (hours) (1000s) (count)---------- ------- -------- --------- -------- -------AURELL 9 77.3 0.33 99 2836LENNART 2 1.9 0.00 1 0QPGMR 6 0.2 0.03 11 0QSECOFR 1 8.5 0.11 39 723
======= ======== ========= ======== =======Total 18 87.8 0.48 150 3559
Performance Reporter Report: OS400J01
Figure 36. Example of OS/400 Job Statistics by User, Monthly Overview
74 Release 5

produced by period name (for example, PRIME or NIGHT). The information used in thisdisplay is also included in the report “OS/400 Job Statistics by User, Monthly Overview” onpage 74.
This information identifies the report:
Report ID OS400J02
Report group OS/400 Job Statistics Reports
Source OS400_JOB_STAT_M (described on page 45)
Chart format DRLG4J02
Attributes OS400, Job, User, CPU, Monthly, Overview
Variables Month, Period name, OS400 system ID
The report contains this information:
User name The user name.
CPU Time (hours) The processor time, in hours. This is calculated asSUM(CPU_SECONDS)/3600.
OS/400 Job Statistics All Systems, Daily TrendFor each OS/400 system in the network, this report (see Figure 38 on page 76) providesdaily trend information about how much of the system resources are being used. The reportis produced by period name (for example, PRIME or NIGHT). You might use the report (forexample) to determine when batch jobs can be scheduled. The same information over amonthly trend period, is provided in “OS/400 Job Statistics all Systems, Monthly Trend” onpage 76.
This information identifies the report:
Report ID OS400J03
Report group OS/400 Job Statistics Reports
0.000
0. 33
0. 11
AURELL
QSECOFR
0.050 0.100 0.150 0.200 0.250 0.300 0.350
OS/400 Job CPU Usage by User, Monthly OverviewSystem 'S44A0002'
Month: '2000-07-05' Period 'PRIME'
CPUtime(hours)
CPU hours
Use
r N
ame
Figure 37. Example of OS/400 Job CPU Usage by User, Monthly Overview
75AS/400 System Performance Feature Guide and Reference
5.R
epo
rts

Source OS400_JOB_STAT_D (described on page 45)
Attributes OS400, Job, Daily, Trend
Variables From date, To date, Period name
The report contains this information:
Date The date.
Jobs (count) The number of jobs.
Elapsed time (hour) The elapsed time, in hours. This is calculated asSUM(ELAPSED_SECONDS)/3600.
CPU time (hours) The processor time, in hours. This is calculated asSUM(CPU_SECONDS)/3600.
I/O (1000s) The total number of auxiliary I/Os, in thousands. This iscalculated as SUM(IO_COUNT)/1000.
Trans (count) The number of transactions.
OS/400 Job Statistics all Systems, Monthly TrendFor each OS/400 system in the network, this report (see Figure 39 on page 77) providesmonthly trend information about how much of the system resources are being used. Thereport is summarized by OS/400 system. and is produced by period name (for example,PRIME or NIGHT). You might use the report to anticipate potential resource constraints (forexample, if processor usage is increasing over the time-period). The same information over adaily trend period is provided in “OS/400 Job Statistics All Systems, Daily Trend” onpage 75.
This information identifies the report:
Report ID OS400J04
OS/400 Job statistics All Systems, Daily TrendDate: '2000-03-01' to '1993-05-01'
Period: 'PRIME'
Elapsed CPUOS/400 Jobs time time I/O Transsystem ID Date (count) (hours) (hours) (1000s) (count)--------- ---------- ------- -------- --------- -------- -------S44A0001 1993-03-10 11 85.8 0.45 139 3559
------- -------- --------- -------- -------Total 11 85.8 0.45 139 3559
S44A0002 1993-03-10 19 162.9 3.42 1020 29029------- -------- --------- -------- -------
Total 19 162.9 3.42 1020 29029
======= ======== ========= ======== =======Total 30 248.7 3.87 1159 32588
Performance Reporter Report: OS400J03
Figure 38. Example of OS/400 Job Statistics all Systems, Daily Trend
76 Release 5

Report group OS/400 Job Statistics Reports
Source OS400_JOB_STAT_M (described on page 45)
Attributes OS400, Job, Monthly, Trend
Variables From month, To month, Period name
The report contains this information:
OS/400 system ID The system identification.
Month The month.
Jobs (count) The number of jobs.
Elapsed time (hour) The elapsed time, in hours. This is calculated asSUM(ELAPSED_SECONDS)/3600.
CPU time (hours) The processor time, in hours. This is calculated asSUM(CPU_SECONDS)/3600.
I/O (1000s) The total number of auxiliary I/O, in thousands. This iscalculated as SUM(IO_COUNT)/1000.
OS/400 Job Statistics for a User, Monthly OverviewFor a specific OS/400 system in the network, this report (see Figure 40 on page 78) providesmonthly overview information about how much of the system resources a specific user hasused. The report is produced by period name (for example, PRIME or NIGHT).
This information identifies the report:
Report ID OS400J05
Report group OS/400 Job Statistics Reports
Source OS400_JOB_STAT_M (described on page 45)
OS/400 Job Statistics all Systems, Monthly TrendMonth: '2000-03-01' to '1993-05-01'
Period: 'PRIME'
Elapsed CPUOS/400 Jobs time time I/O Transsystem ID Month (count) (hours) (hours) (1000s) (count)--------- ---------- ------- -------- --------- -------- -------S44A0001 1993-03-01 11 85.8 0.45 139 3559
------- -------- --------- --------Total 11 85.8 0.45 139
S44A0002 1993-03-01 19 162.9 3.42 1020 290291993-05-01 10 85.7 0.45 138 3559
------- -------- --------- --------Total 29 248.6 3.87 1158
======= ======== ========= ========Total 40 334.4 4.32 1297
Performance Reporter Report: OS400J04
Figure 39. Example of OS/400 Job Statistics all Systems, Monthly Trend
77AS/400 System Performance Feature Guide and Reference
5.R
epo
rts

Attributes OS400, Job, User, Type, Monthly, Overview
Variables Month, Period name, OS400 system id, User name
The report contains this information:
Job Type The job type.
Jobs (count) The number of jobs.
Elapsed time (hour) The elapsed time, in hours. This is calculated asSUM(ELAPSED_SECONDS)/3600.
CPU time (hours) The processor time, in hours. This is calculated asSUM(CPU_SECONDS)/3600.
I/O (1000s) The total number of auxiliary I/Os, in thousands. This iscalculated as SUM(IO_COUNT)/1000.
Trans (count) The number of transactions.
Total resp (seconds) The total response time, in seconds.
Average resp (seconds) The average response time, in seconds. This is calculated asSUM(RESPONSE_SECONDS)/SUM(TRANSACTIONS).
OS/400 Job Type Statistics, Monthly OverviewFor a specific OS/400 system in the network, this report (see Figure 41 on page 79) providesmonthly overview information about how much resources have been used. The report isproduced by period name (for example, PRIME or NIGHT). You might use this report todetermine if resources should be re-allocated between processing types batch and online (byincreasing or decreasing the main storage pool for a processing type).
This information identifies the report:
Report ID OS400J06
Report group OS/400 Job Statistics Reports
Source OS400_JOB_STAT_M (described on page 45)
Attributes OS400, Job, Type, Monthly, Overview
OS/400 Job Statistics for a User, Monthly OverviewSystem: 'S44A0001' Month: '2000-03-01'
Period: 'PRIME' User: 'AURELL'
Elapsed CPU Total AverageJob Jobs time time I/O Trans response responsetype (count) (hours) (hours) (1000s) (count) (seconds) (seconds)---- ------- -------- --------- -------- ------- --------- ---------B 52 43.0 0.52 272 0 0 0.00I 106 34.3 0.33 99 2836 3159 1.11
======= ======== ========= ======== ======= =========Total 158 77.3 0.85 371 2836 3159
Performance Reporter Report: OS400J05
Figure 40. Example of OS/400 Jobs Statistics for a User, Monthly Overview
78 Release 5

Variables Month, Period name, OS400 system ID
The report contains this information:
Job Type The job type.
Jobs (count) The number of jobs.
Elapsed time (hours) The elapsed time, in hours. This is calculated asSUM(ELAPSED_SECONDS)/3600.
CPU time (hours) The processor time, in hours. This is calculated asSUM(CPU_SECONDS)/3600.
I/O (1000s) The total number of auxiliary I/Os, in thousands. This iscalculated as SUM(IO_COUNT)/1000.
Trans (count) The number of transactions.
OS/400 Job Acct from History Log, Monthly OverviewFor a specific OS/400 system in the network, this report (see Figure 42 on page 80) providesmonthly overview information about how much resources have been used by each accountcode. The report is produced by period name (for example, PRIME or NIGHT).
This information identifies the report:
Report ID OS400J07
Report group OS/400 Job Statistics Reports
Source OS400_JOB_STAT_M (described on page 45)
Attributes OS400, Acct, Accounting, Job, Monthly, Overview
Variables Month, Period name, OS400 system ID
OS/400 Job Type Statistics, Monthly OverviewSystem: 'S44A0004'
Month: '2000-03-01' Period: 'PRIME'
Elapsed CPUJob Jobs time time I/O TransType (count) (hours) (hours) (1000s) (count)---- ------- -------- --------- -------- -------B 12 45.0 0.04 12 0I 6 42.8 0.45 138 3559
======= ======== ========= ======== =======Total 18 87.8 0.48 150 3559
Performance Reporter Report: OS400J06
Figure 41. Example of OS/400 Job Type Statistics, Monthly Overview
79AS/400 System Performance Feature Guide and Reference
5.R
epo
rts

The report contains this information:
Account code The accounting code, taken from the account code lookuptable.
User name The user name.
Jobs (count) The number of jobs.
CPU time (hours) The total processor time, in hours. This is calculated asSUM(CPU_SECONDS)/3600.
I/O (count) The total number of auxiliary I/O, in thousands. This iscalculated as SUM(IO_COUNT)/1000.
Reports in the messages componentThis section describes the following messages component reports:
¶ “OS/400 Messages All Systems, Monthly Overview” on page 81.
¶ “OS/400 Messages Most Frequent, Daily Overview” on page 82.
¶ “OS/400 Messages Most Frequent, Monthly Overview” on page 83.
¶ “OS/400 Messages by Sev. Codes, Monthly Overview” on page 84.
¶ “OS/400 Messages for a User, Monthly Overview” on page 84.
¶ “OS/400 Messages by Type, Monthly Overview” on page 85.
¶ “OS/400 Messages by User Name, Monthly Overview” on page 86.
The data flow for the messages component (including the names of OS/400 logs,Performance Reporter records and tables) is given in “SP400 feature messages componentdata flow” on page 37.
OS/400 Job Acct from History Log, Monthly OverviewSystem: 'S44A0003'
Month: '2000-03-01' Period: 'PRIME'
CPUAccount User Jobs time I/Ocode name (count) (hours) (1000s)--------------- ---------- -------- --------- ---------999999999999999 AURELL 51 0.22 19
LENNART 19 0.01 8QPGMR 67 0.35 11QSECOFR 10 0.11 39
-------- --------- ---------Total 147 0.69 77
======== ========= =========Total 147 0.69 77
Performance Reporter Report: OS400J07
Figure 42. Example of OS/400 Job Acct from History Log, Monthly Overview
80 Release 5

OS/400 Messages All Systems, Monthly OverviewFor each OS/400 system in the network, this report (see Figure 43) provides monthlyoverview information about the messages generated. The report is produced by period name(for example, PRIME or NIGHT). Although mainly reference information is given here, youcould also use the report to check the amount of data being generated into the OS/400history log.
This information identifies the report:
Report ID OS400M01
Report group OS/400 Messages Component Reports
Source OS400_MSG_STAT_M (described on page 45)
Attributes OS400, Message, Monthly, Overview
Variables From month, To month, Period name
The report contains this information:
OS/400 system IDThe system identification.
Month The month.
Messages (count)The number of messages.
Lines (/message)The number of print lines per message. This is calculated asSUM(LINE_COUNT)/SUM(MESSAGE_COUNT).
Text bytes (/message)The number of bytes of text per message. This is calculated asSUM(TEXT_BYTE_COUNT)/SUM(MESSAGE_COUNT).
OS/400 Messages all Systems, Monthly OverviewMonth: '2000-03-01' to '1993-05-01'
Period: 'PRIME'
OS/400 Messages Lines Text bytes Data bytessystem ID Month (count) (/message) (/message) (/message)--------- ---------- ---------- ---------- ---------- ----------S44A0001 1993-03-01 77 2.79 94.01 81.29
---------- ---------- ---------- ----------Total/average 77 2.79 94.01 81.29
S44A0002 1993-03-01 77 2.87 98.61 92.491993-05-01 68 2.72 94.19 71.51
---------- ---------- ---------- ----------Total/average 145 2.80 96.40 82.00
========== ========== ========== ==========Total/average 222 2.79 95.60 81.76
Performance Reporter Report: OS400M01
Figure 43. Example of OS/400 Messages All Systems, Monthly Overview
81AS/400 System Performance Feature Guide and Reference
5.R
epo
rts

Data bytes (/message)The number of bytes of data per message. This is calculated asSUM(DATA_BYTE_COUNT)/SUM(MESSAGE_COUNT).
OS/400 Messages Most Frequent, Daily OverviewFor a specific OS/400 system in the network, this report (see Figure 44) provides dailyoverview information about the messages generated. The report is produced by period name(for example, PRIME or NIGHT). You could use this report to identify potential problemswithin an application, since the message ID allows you to differentiate between errorscaused by software applications, operational errors, and so on. A monthly summary of theinformation in this report is provided in “OS/400 Messages Most Frequent, MonthlyOverview” on page 83.
This information identifies the report:
Report ID OS400M02
Report group OS/400 Messages Component Reports
Source OS400_MSG_STAT_D (described on page 46)
Attributes OS400, Message, Daily, Overview
Variables Date, Period name, OS400 system id, Maxrows
The report contains this information:
Date The date.
Message file The name of the message file.
Message ID The message identification.
Messages (count) The number of messages.
Messages (%) The percentage occurrence of a message.
OS/400 Messages Most Frequent, Daily OverviewSystem: 'S44A0001'
Date: '2000-10-13' Period: 'PRIME'
Message Message Messages Messagesfile ID (count) (%)-------- -------- ---------- ----------AMOMSGF AMO8001 24 31.17QCPFMSG CPF8B41 15 19.48QCPFMSG CPF1164 11 14.29QCPFMSG CPF590A 5 6.49QCPFMSG CPF4058 4 5.19QCPFMSG CPA4067 3 3.90QCPFMSG CPC3722 3 3.90QCPFMSG CPF1124 2 2.60QCPFMSG CPF2758 2 2.60QCPFMSG CPF1269 2 2.60
Performance Reporter Report: OS400M02
Figure 44. Example of OS/400 Messages Most Frequent, Daily Overview
82 Release 5

OS/400 Messages Most Frequent, Monthly OverviewFor a specific OS/400 system in the network, this report (see Figure 45) provides monthlyoverview information about the messages generated. The report is produced by period name(for example, PRIME or NIGHT). You could use this report to identify potential problemswithin an application since the message ID allows you to differentiate between errors causedby software applications, operational errors, and so on. For a daily summary of some of theinformation in this report, see “OS/400 Messages Most Frequent, Daily Overview” onpage 82.
This information identifies the report:
Report ID OS400M03
Report group OS/400 Messages Component Reports
Source OS400_MSG_STAT_M (described on page 46)
Attributes OS400, Message, Monthly, Overview
Variables Month, Period name, OS400 system id, Maxrows
The report contains this information:
Message file The name of the message file.
Message ID The message identification.
Messages (count)The number of messages.
Messages (%) The percentage occurrence of a message.
Text bytes (/message)The number of bytes of text per message. This is calculated asSUM(TEXT_BYTE_COUNT)/SUM(MESSAGE_COUNT).
OS/400 Messages Most Frequent, Monthly OverviewSystem: 'S44A0001'
Month: '2000-10-01' Period: 'PRIME '
Message Message Messages Messages Text bytes Data bytesfile ID (count) (%) (/message) (/message)-------- -------- ---------- ---------- ---------- ----------AMOMSGF AMO8001 24 31.17 132.00 38.00QCPFMSG CPF8B41 15 19.48 64.00 34.00QCPFMSG CPF1164 11 14.29 132.00 251.00QCPFMSG CPF590A 5 6.49 42.00 10.00QCPFMSG CPF4058 4 5.19 45.00 46.00QCPFMSG CPC3722 3 3.90 45.67 217.00QCPFMSG CPA4067 3 3.90 58.00 40.00QCPFMSG CPF1124 2 2.60 132.00 266.00QCPFMSG CPF2758 2 2.60 39.00 10.00QCPFMSG CPF1269 2 2.60 106.00 93.00
Performance Reporter Report: OS400M03
Figure 45. Example of OS/400 Messages Most Frequent, Monthly Overview
83AS/400 System Performance Feature Guide and Reference
5.R
epo
rts

Data bytes (/message)The number of bytes of data per message. This is calculated asSUM(DATA_BYTE_COUNT)/SUM(MESSAGE_COUNT).
OS/400 Messages by Sev. Codes, Monthly OverviewFor a specific OS/400 system in the network, this report (see Figure 46) provides monthlyoverview information about the severity codes of messages generated. The report isproduced by period name (for example, PRIME or NIGHT). You could use this reportchange the message filter to reduce the numbers of low severity messages that are sent tousers.
This information identifies the report:
Report ID OS400M04
Report group OS/400 Messages Component Reports
Source OS400_MSG_STAT_M (described on page 46)
Attributes OS400, Message, Code, Monthly, Overview
Variables Month, Period name, OS400 system ID
The report contains this information:
Messages severity code The message severity code.
Messages (count) The number of messages.
Messages (%) The percentage occurrence of a message.
OS/400 Messages for a User, Monthly OverviewFor a specific OS/400 system in the network, this report (see Figure 47 on page 85) providesmonthly overview information about the messages generated for a system user. The report isproduced by period name (for example, PRIME or NIGHT). You could use this report toidentify problems caused by a user. The message ID allows you to differentiate betweenerrors caused by software applications, operational errors, and so on.
This information identifies the report:
Report ID OS400M05
OS/400 Messages by Sev. Codes, Monthly OverviewSystem: 'S44A0001'
Month: '2000-03-01' Period: 'PRIME'
Messagesseverity Messages Messages
code (count) (%)---------- ---------- ----------00 68 88.3140 5 6.4999 3 3.9030 1 1.30
Performance Reporter Report: OS400M04
Figure 46. Example of OS/400 Messages by Sev. Codes, Monthly Overview
84 Release 5

Report group OS/400 Messages Component Reports
Source OS400_MSG_STAT_M, OS400_MSG_STAT_MV (View) (described onpages 46 and 46 respectively)
Attributes OS400, Message, User, Monthly, Overview
Variables Month, Period name, OS400 system id, User, Maxrows
The report contains this information:
Message file The name of the message file.
Message ID The message identification.
Messages (count) The number of messages with the message ID.
Messages (%) The percentage of messages in the message file with themessage ID.
Message lines (count) The number of message lines.
OS/400 Messages by Type, Monthly OverviewFor a specific OS/400 system in the network, this report (see Figure 48 on page 86) providesmonthly overview information about the message types generated. The report is produced byperiod name (for example, PRIME or NIGHT). You could use this report for example, tocheck if the system operator is spending too much time replying to inquiry messages.
This information identifies the report:
Report ID OS400M06
Report group OS/400 Messages Component Reports
Source OS400_MSG_STAT_M (described on page 46)
Attributes OS400, Message, Type, Monthly, Overview
Variables Month, Period name, OS400 system ID
OS/400 Messages for a User, Monthly OverviewSystem: 'S44A0001' User: 'AURELL 'Month: 2000-03-01 Period: 'PRIME'
MessageMessage Message Messages Messages linesfile ID (count) (%) (count)---------- -------- ---------- ---------- ----------QCPFMSG CPF1164 9 11.69 36QCPFMSG CPF2240 1 1.30 3QCPFMSG CPF4058 1 1.30 2
Performance Reporter Report: OS400M05
Figure 47. Example of OS/400 Messages for a User, Monthly Overview
85AS/400 System Performance Feature Guide and Reference
5.R
epo
rts
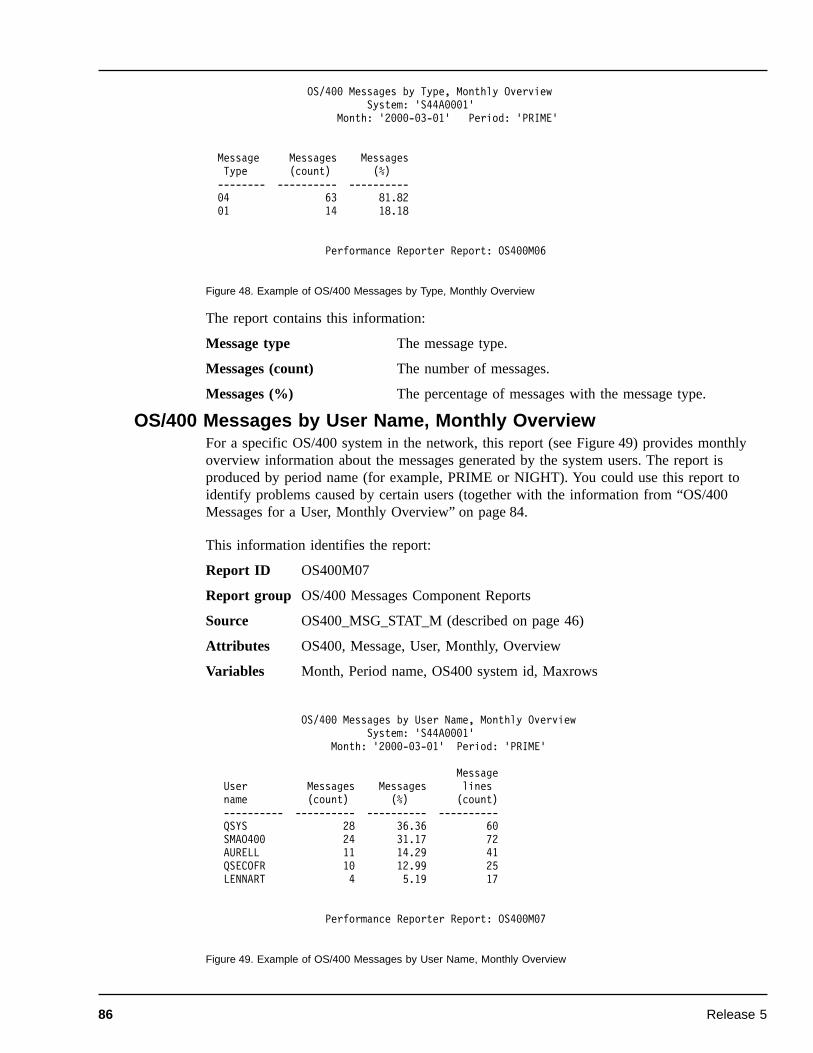
The report contains this information:
Message type The message type.
Messages (count) The number of messages.
Messages (%) The percentage of messages with the message type.
OS/400 Messages by User Name, Monthly OverviewFor a specific OS/400 system in the network, this report (see Figure 49) provides monthlyoverview information about the messages generated by the system users. The report isproduced by period name (for example, PRIME or NIGHT). You could use this report toidentify problems caused by certain users (together with the information from “OS/400Messages for a User, Monthly Overview” on page 84.
This information identifies the report:
Report ID OS400M07
Report group OS/400 Messages Component Reports
Source OS400_MSG_STAT_M (described on page 46)
Attributes OS400, Message, User, Monthly, Overview
Variables Month, Period name, OS400 system id, Maxrows
OS/400 Messages by Type, Monthly OverviewSystem: 'S44A0001'
Month: '2000-03-01' Period: 'PRIME'
Message Messages MessagesType (count) (%)-------- ---------- ----------04 63 81.8201 14 18.18
Performance Reporter Report: OS400M06
Figure 48. Example of OS/400 Messages by Type, Monthly Overview
OS/400 Messages by User Name, Monthly OverviewSystem: 'S44A0001'
Month: '2000-03-01' Period: 'PRIME'
MessageUser Messages Messages linesname (count) (%) (count)---------- ---------- ---------- ----------QSYS 28 36.36 60SMAO400 24 31.17 72AURELL 11 14.29 41QSECOFR 10 12.99 25LENNART 4 5.19 17
Performance Reporter Report: OS400M07
Figure 49. Example of OS/400 Messages by User Name, Monthly Overview
86 Release 5

The report contains this information:
User name The user name.
Messages (count) The number of messages.
Messages (%) The percentage occurrence of the message type.
Message lines (count) The number of message lines for this user.
Reports in the performance componentThis section describes the following performance component reports:
¶ “OS/400 Perf CPU and RTM Statistics, Hourly Trend”.
¶ “OS/400 Perf Exception and Lock Stat, Hourly Trend” on page 89.
¶ “OS/400 Perf Disk I/O Statistics, Hourly Trend” on page 90.
¶ “OS/400 Perf Disk Capacity Statistics, Hourly Trend” on page 92.
¶ “OS/400 Perf Disk Arm Movements, Hourly Trend” on page 94.
¶ “OS/400 Perf CPU & Trans by Job Group, Hourly Trend” on page 95.
¶ “OS/400 Perf CPU by Job Group, Hourly Trend” on page 97.
¶ “OS/400 Perf Paging Statistics, Hourly Trend” on page 98.
¶ “OS/400 Perf Storage Pool & Act Level, Hourly Trend” on page 100.
¶ “OS/400 Perf Transition Statistics, Hourly Trend” on page 102.
¶ “OS/400 Perf Max & Avg CPU Usage, Hourly Trend” on page 103.
¶ “OS/400 Perf CPU Usage all Systems, Daily Overview” on page 104.
¶ “OS/400 Perf Summary all Systems, Daily Overview” on page 105.
¶ “OS/400 Perf Summary for a System, Daily Trend” on page 106.
¶ “OS/400 Perf Summary for a System, Hourly Trend” on page 108.
The data flow for the performance component (including the names of OS/400 logs,Performance Reporter records and tables) is given in “SP400 feature performance componentdata flow” on page 39.
OS/400 Perf CPU and RTM Statistics, Hourly TrendFor a specific OS/400 system in the network, this report (see Figure 50 on page 88) provideshourly trend information about the average and maximum percentage processor time used,and the percentage of transactions falling within five response time (RTM) brackets. You canuse the report to determine the times of peak processor load, and (for interactive processing)how response time varies during the hourly periods, and how many users have bad responsetimes.
87AS/400 System Performance Feature Guide and Reference
5.R
epo
rts

This information identifies the report:
Report ID OS400P01
Report group OS/400 Performance Component Reports
Source OS400_PM_SYS_H (described on page 50)
Attributes OS400, Performance, CPU, Utilization, Usage, Hourly, Trend
Variables Date, OS400 system ID
The report contains this information:
Hour The hour.
CPU1 avg (%) The average percentage CPU1. This is calculated asCPU1_MILLISEC/MEASURED_SEC/10.
CPU1 max (%) The maximum percentage CPU1.
CPU2 avg (%) The average percentage CPU2. This is calculated asCPU2_MILLISEC/MEASURED_SEC/10.
CPU2 max (%) The maximum percentage CPU2.
CPUH avg (%) The average percentage CPUH. This is calculated asCPUH_MILLISEC/MEASURED_SEC/10.
CPUH max (%) The maximum percentage CPUH.
Trans 1st RTM (%) The percentage of transactions in the first RTM bracket. Thisis calculated asTRAN_RTM1_CNT*100/(TRAN_RTM1_CNT +TRAN_RTM2_CNT + TRAN_RTM3_CNT +TRAN_RTM4_CNT + TRAN_RTM5_CNT).
Trans 2nd RTM (%) The percentage of transactions in the second RTM bracket.This is calculated as TRAN_RTM2_CNT*100/(TRAN_RTM1_CNT + TRAN_RTM2_CNT +TRAN_RTM3_CNT + TRAN_RTM4_CNT +TRAN_RTM5_CNT).
OS/400 Perf CPU and RTM Statistics, Hourly TrendSystem: 'S44A0001' Date: 2000-05-12
Trans Trans Trans Trans TransCPU1 CPU1 CPU2 CPU2 CPUH CPUH 1st 2nd 3rd 4th 5thavg max avg max avg max RTM RTM RTM RTM RTM
Hour (%) (%) (%) (%) (%) (%) (%) (%) (%) (%) (%)---- ----- ----- ----- ----- ----- ----- ----- ----- ----- ----- -----
9 25.5 59.2 0.0 0.0 3.3 5.8 78.1 9.5 4.5 1.5 6.510 29.1 42.5 0.0 0.0 5.1 8.2 72.7 6.7 2.9 1.4 16.311 22.8 40.2 0.0 0.0 5.3 10.2 66.5 2.7 7.6 4.3 18.912 14.0 31.8 0.0 0.0 2.0 4.2 69.6 0.9 4.5 2.7 22.313 6.8 12.4 0.0 0.0 1.5 3.7 0.0 0.0 0.0 0.0 0.014 9.6 22.1 0.0 0.0 2.3 9.5 0.0 0.0 0.0 0.0 0.015 27.1 58.9 0.0 0.0 4.6 12.2 57.1 21.4 7.1 7.1 7.1
Performance Reporter Report: OS400P01
Figure 50. Example of OS/400 Perf CPU and RTM Statistics, Hourly Trend
88 Release 5
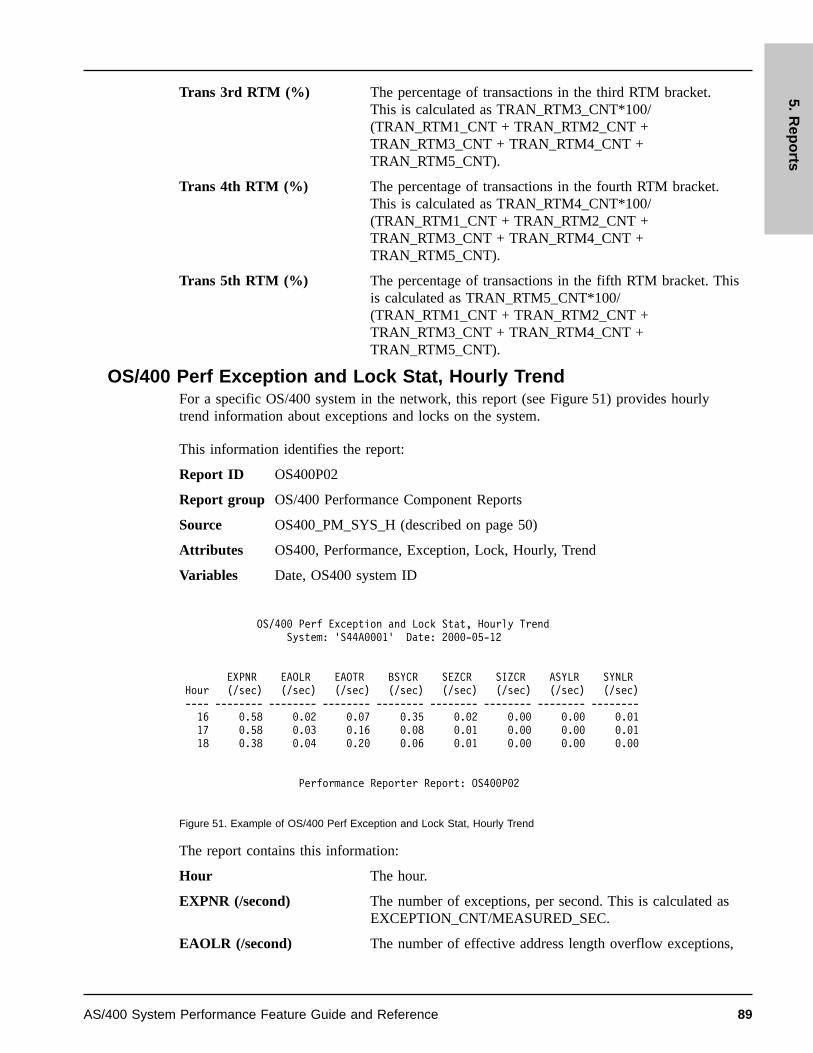
Trans 3rd RTM (%) The percentage of transactions in the third RTM bracket.This is calculated as TRAN_RTM3_CNT*100/(TRAN_RTM1_CNT + TRAN_RTM2_CNT +TRAN_RTM3_CNT + TRAN_RTM4_CNT +TRAN_RTM5_CNT).
Trans 4th RTM (%) The percentage of transactions in the fourth RTM bracket.This is calculated as TRAN_RTM4_CNT*100/(TRAN_RTM1_CNT + TRAN_RTM2_CNT +TRAN_RTM3_CNT + TRAN_RTM4_CNT +TRAN_RTM5_CNT).
Trans 5th RTM (%) The percentage of transactions in the fifth RTM bracket. Thisis calculated as TRAN_RTM5_CNT*100/(TRAN_RTM1_CNT + TRAN_RTM2_CNT +TRAN_RTM3_CNT + TRAN_RTM4_CNT +TRAN_RTM5_CNT).
OS/400 Perf Exception and Lock Stat, Hourly TrendFor a specific OS/400 system in the network, this report (see Figure 51) provides hourlytrend information about exceptions and locks on the system.
This information identifies the report:
Report ID OS400P02
Report group OS/400 Performance Component Reports
Source OS400_PM_SYS_H (described on page 50)
Attributes OS400, Performance, Exception, Lock, Hourly, Trend
Variables Date, OS400 system ID
The report contains this information:
Hour The hour.
EXPNR (/second) The number of exceptions, per second. This is calculated asEXCEPTION_CNT/MEASURED_SEC.
EAOLR (/second) The number of effective address length overflow exceptions,
OS/400 Perf Exception and Lock Stat, Hourly TrendSystem: 'S44A0001' Date: 2000-05-12
EXPNR EAOLR EAOTR BSYCR SEZCR SIZCR ASYLR SYNLRHour (/sec) (/sec) (/sec) (/sec) (/sec) (/sec) (/sec) (/sec)---- -------- -------- -------- -------- -------- -------- -------- --------
16 0.58 0.02 0.07 0.35 0.02 0.00 0.00 0.0117 0.58 0.03 0.16 0.08 0.01 0.00 0.00 0.0118 0.38 0.04 0.20 0.06 0.01 0.00 0.00 0.00
Performance Reporter Report: OS400P02
Figure 51. Example of OS/400 Perf Exception and Lock Stat, Hourly Trend
89AS/400 System Performance Feature Guide and Reference
5.R
epo
rts

per second. This is calculated asEADDR_LOFL_EXC_CNT/MEASURED_SEC.
EAOTR (/second) The number of effective address overflow exceptions, persecond. This is calculated asEADDR_OFL_EXC_CNT/MEASURED_SEC.
BSYCR (/second) The number of busy exceptions, per second. This iscalculated as BUSY_EXC_CNT/MEASURED_SEC.
SEZCR (/second) The number of seize wait exceptions, per second. This iscalculated as SEIZE_WAIT_EXC_CNT/MEASURED_SEC.
SIZCR (/second) The number of size exceptions, per second. This iscalculated as SIZE_EXC_CNT/MEASURED_SEC.
ASYLR (/second) The number of asynchronous lock conflicts, per second. Thisis calculated as ASYNCH_LOCK_CNT/MEASURED_SEC.
SYNLR (/second) The number of synchronous lock conflicts, per second. Thisis calculated as SYNCH_LOCK_CNT/MEASURED_SEC.
OS/400 Perf Disk I/O Statistics, Hourly TrendFor a specific OS/400 system in the network, this report (see Figure 52 on page 91) provideshourly trend information about disk arm utilization. For guidelines on how to interpret thisinformation, refer to the AS/400 Performance Tools/400 Guide.
This information identifies the report:
Report ID OS400P03
Report group OS/400 Performance Component Reports
Source OS400_PM_DISK_H (described on page 47)
Attributes OS400, Performance, Disk, Dasd, I/O, Hourly, Trend
Variables Date, OS400 system ID
90 Release 5

The report contains this information:
Hour The hour.
IOP address The IOP address.
Disk arm number The disk arm number.
Average access (/second) The average access time, per second. This is calculated as(READ_DATA_CMD_CNT+WRITE_DATA_CMD_CNT)/MEASURED_SEC.
Maximum access (/second) The maximum access time, in seconds.
Average service time (seconds)The average service time, in seconds. This is calculated as((SAMPLES_2PERSEC - ARM_NOTBUSY_CNT)/SAMPLES_2PERSEC) / ((READ_DATA_CMD_CNT +WRITE_DATA_CMD_CNT) / MEASURED_SEC).
OS/400 Perf Disk I/O Statistics, Hourly TrendSystem: 'S44A0001' Date: 2000-05-12
Avg Max Avg Max Avg Max Avg MaxDisk Avg Max service service diskarm diskarm queue queue IOP IOP
IOP arm access access time time util util length length util utilHour address number (/sec) (/sec) (sec) (sec) (%) (%) (count) (count) (%) (%)---- ------- ------ ------ ------ ------- ------- ------- ------- ------- ------- ------- ------
9 02 0001 0.5 1.1 0.035 0.055 1.5 3.2 0.0 0.0 5.0 7.202 0002 1.4 3.1 0.029 0.056 3.5 8.0 0.0 0.1 6.9 13.902 0003 2.3 5.6 0.029 0.035 6.6 17.0 0.1 0.2 11.9 26.102 0004 1.6 3.8 0.023 0.033 4.1 10.1 0.0 0.1 6.9 13.902 0005 2.0 4.2 0.027 0.031 5.4 11.7 0.1 0.2 9.3 16.802 0006 1.5 3.0 0.029 0.042 3.9 6.9 0.0 0.1 5.0 7.202 0007 1.9 4.8 0.032 0.045 6.8 16.1 0.1 0.2 11.9 26.102 0008 1.9 4.5 0.022 0.028 4.3 10.4 0.0 0.1 9.3 16.8
*
10 02 0001 0.6 1.3 0.035 0.056 2.1 5.1 0.0 0.1 6.3 15.402 0002 2.2 4.0 0.027 0.034 5.7 11.5 0.1 0.1 9.0 12.102 0003 3.1 6.9 0.030 0.039 9.5 20.5 0.1 0.2 16.3 28.502 0004 1.8 3.0 0.028 0.038 5.2 8.7 0.1 0.1 9.0 12.102 0005 1.8 2.7 0.028 0.038 5.1 9.5 0.1 0.1 9.5 14.602 0006 1.9 5.7 0.025 0.032 4.9 13.8 0.1 0.2 6.3 15.502 0007 2.6 4.3 0.033 0.041 8.4 13.0 0.1 0.2 16.3 28.502 0008 2.0 3.2 0.025 0.033 5.2 9.8 0.1 0.1 9.5 14.6
*
11 02 0001 0.3 0.6 0.028 0.056 0.8 1.5 0.0 0.0 4.3 8.202 0002 1.3 3.2 0.027 0.037 3.4 8.3 0.0 0.1 6.2 12.302 0003 1.9 4.2 0.029 0.035 5.8 14.4 0.1 0.2 11.2 24.602 0004 1.4 2.9 0.024 0.043 3.2 7.2 0.0 0.1 6.2 12.302 0005 2.1 4.6 0.027 0.034 5.8 12.6 0.1 0.2 10.3 23.602 0006 1.3 3.1 0.025 0.043 3.4 8.0 0.0 0.1 4.3 8.302 0007 1.9 4.2 0.030 0.042 6.3 13.8 0.1 0.1 11.2 24.602 0008 2.3 5.7 0.027 0.039 6.4 17.2 0.1 0.2 10.3 23.6
*
Performance Reporter Report: OS400P03
Figure 52. Example of OS/400 Perf Disk I/O Statistics, Hourly Trend
91AS/400 System Performance Feature Guide and Reference
5.R
epo
rts

Maximum service time (seconds)The maximum service time, in seconds.
Average diskarm util (%) The average percentage disk arm utilization. This iscalculated as (100*(SAMPLES_2PERSEC -ARM_NOTBUSY_CNT)/ SAMPLES_2PERSEC).
Maximum diskarm util (%) The maximum percentage disk arm utilization.
Average queue length (count)The average queue length. This is calculated as(QUEUE_ELEMENT_CNT/SAMPLES_2PERSEC).
Maximum queue length (count)The maximum queue length.
Average IOP util (%) The average percentage IOP utilization. This is calculated as(100*(MEASURED_SEC-((PROC_IDLELOOP_CNT/SAMPLES* PROC_IDLELOOP_HMS)/100000000)/MEASURED_SEC).
Maximum IOP util (%) The maximum percentage IOP utilization.
OS/400 Perf Disk Capacity Statistics, Hourly TrendFor a specific OS/400 system in the network, this report (see Figure 53 on page 93) provideshourly trend information about the amount of data on each disk. Disk drive capacity shouldnot vary (since disks are not normally added or removed during the day). However theavailable space will change as the result of files being restored or deleted.
This information identifies the report:
Report ID OS400P04
Report group OS/400 Performance Component Reports
Source OS400_PM_DISK_H (described on page 47)
Attributes OS400, Performance, Disk, Dasd, Usage, Hourly, Trend
Variables Date, OS400 system ID
92 Release 5

The report contains this information:
Hour The hour.
IOP address The IOP address.
Disk arm number The disk arm number.
Disk drive type The disk drive type.
Available space (MB) The drive available space, in megabytes. This is calculatedas AVAILABLE_SPACE_MB/SAMPLES.
Drive capacity (MB) The drive capacity, in megabytes. This is calculated asDRIVE_CAPACITY_MB/SAMPLES.
Permanent availspace (MB) The permanent storage available, in megabytes. This iscalculated as PERM_STOR_AVAIL_MB/SAMPLES.
Permanent drivecap (MB) The permanent storage capacity, in megabytes. This iscalculated as PERM_STOR_CAP_MB/SAMPLES.
OS/400 Perf Disk Capacity Statistics, Hourly TrendSystem: 'S44A0001' Date: 2000-05-12
Disk Disk Available Drive Permanent PermanentIOP arm drive space capacity availspace drivecap
Hour address number type (MB) (MB) (MB) (MB)---- ------- ------ ----- --------- -------- ---------- ---------
9 02 0001 9332 0 191 0 002 0002 9332 26 191 0 002 0003 9332 26 191 0 002 0004 9332 26 191 0 002 0005 9332 26 191 0 002 0006 9332 26 191 0 002 0007 9332 26 191 0 002 0008 9332 26 191 0 0
*
10 02 0001 9332 0 191 0 002 0002 9332 24 191 0 002 0003 9332 24 191 0 002 0004 9332 24 191 0 002 0005 9332 24 191 0 002 0006 9332 24 191 0 002 0007 9332 24 191 0 002 0008 9332 24 191 0 0
*
11 02 0001 9332 0 191 0 002 0002 9332 22 191 0 002 0003 9332 22 191 0 002 0004 9332 22 191 0 002 0005 9332 22 191 0 002 0006 9332 22 191 0 002 0007 9332 22 191 0 002 0008 9332 22 191 0 0
*
Performance Reporter Report: OS400P04
Figure 53. Example of OS/400 Perf Disk Capacity Statistics, Hourly Trend
93AS/400 System Performance Feature Guide and Reference
5.R
epo
rts
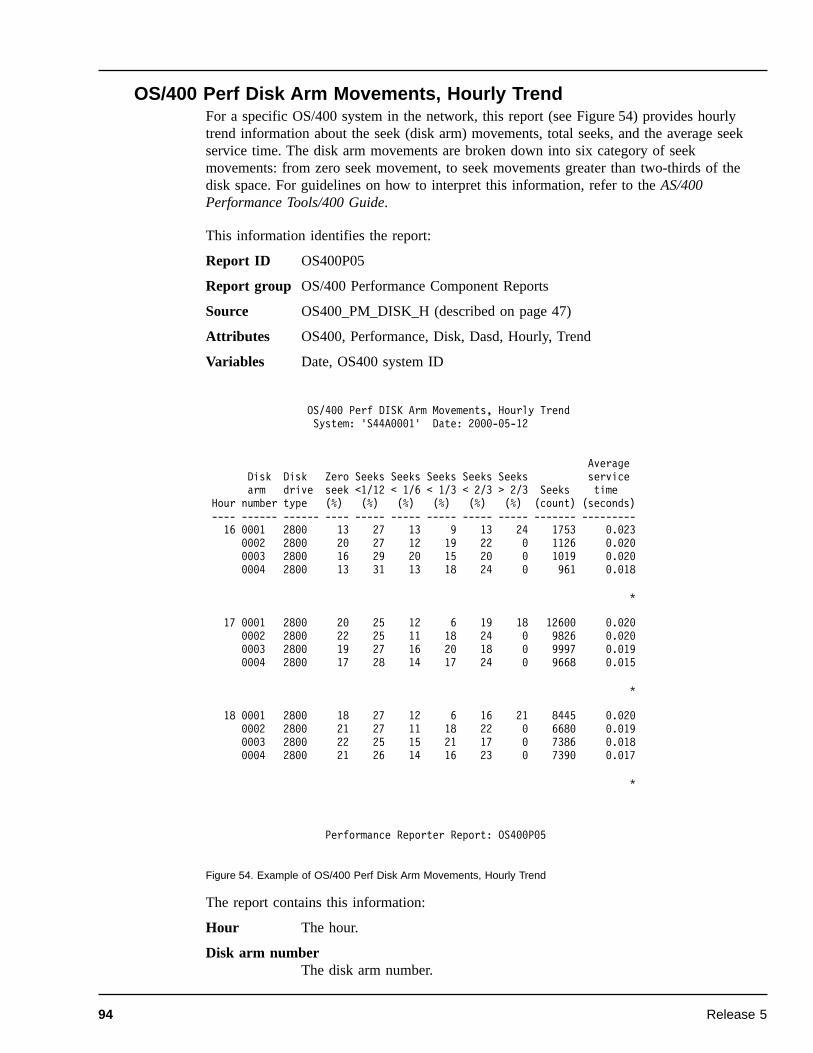
OS/400 Perf Disk Arm Movements, Hourly TrendFor a specific OS/400 system in the network, this report (see Figure 54) provides hourlytrend information about the seek (disk arm) movements, total seeks, and the average seekservice time. The disk arm movements are broken down into six category of seekmovements: from zero seek movement, to seek movements greater than two-thirds of thedisk space. For guidelines on how to interpret this information, refer to the AS/400Performance Tools/400 Guide.
This information identifies the report:
Report ID OS400P05
Report group OS/400 Performance Component Reports
Source OS400_PM_DISK_H (described on page 47)
Attributes OS400, Performance, Disk, Dasd, Hourly, Trend
Variables Date, OS400 system ID
The report contains this information:
Hour The hour.
Disk arm numberThe disk arm number.
OS/400 Perf DISK Arm Movements, Hourly TrendSystem: 'S44A0001' Date: 2000-05-12
AverageDisk Disk Zero Seeks Seeks Seeks Seeks Seeks servicearm drive seek <1/12 < 1/6 < 1/3 < 2/3 > 2/3 Seeks time
Hour number type (%) (%) (%) (%) (%) (%) (count) (seconds)---- ------ ------ ---- ----- ----- ----- ----- ----- ------- ---------
16 0001 2800 13 27 13 9 13 24 1753 0.0230002 2800 20 27 12 19 22 0 1126 0.0200003 2800 16 29 20 15 20 0 1019 0.0200004 2800 13 31 13 18 24 0 961 0.018
*
17 0001 2800 20 25 12 6 19 18 12600 0.0200002 2800 22 25 11 18 24 0 9826 0.0200003 2800 19 27 16 20 18 0 9997 0.0190004 2800 17 28 14 17 24 0 9668 0.015
*
18 0001 2800 18 27 12 6 16 21 8445 0.0200002 2800 21 27 11 18 22 0 6680 0.0190003 2800 22 25 15 21 17 0 7386 0.0180004 2800 21 26 14 16 23 0 7390 0.017
*
Performance Reporter Report: OS400P05
Figure 54. Example of OS/400 Perf Disk Arm Movements, Hourly Trend
94 Release 5

Disk drive typeThe disk drive type.
Zero seeks (%)The percentage of zero seeks. This is calculated as SEEK_EQ_0_CNT*100/(SEEK_GT_2_3_CNT+SEEK_GT_1_3_CNT+SEEK_GT_1_6_CNT +SEEK_GT_1_12_CNT+SEEK_LT_1_12_CNT+SEEK_EQ_0_CNT).
Seeks <1/12 (%)The percentage of seeks less than 1/12. This is calculated asSEEK_LT_1_12_CNT*100/(SEEK_GT_2_3_CNT+SEEK_GT_1_3_CNT+SEEK_GT_1_6_CNT + SEEK_GT_1_12_CNT+SEEK_LT_1_12_CNT+SEEK_EQ_0_CNT).
Seeks < 1/6 (%)The percentage of seeks less than 1/6. This is calculated asSEEK_LT_1_6_CNT*100/(SEEK_GT_2_3_CNT+SEEK_GT_1_3_CNT+SEEK_GT_1_6_CNT + SEEK_GT_1_12_CNT+SEEK_LT_1_12_CNT+SEEK_EQ_0_CNT).
Seeks < 1/3 (%)The percentage of seeks less than 1/3. This is calculated asSEEK_LT_1_3_CNT*100/(SEEK_GT_2_3_CNT+SEEK_GT_1_3_CNT+SEEK_GT_1_6_CNT + SEEK_GT_1_12_CNT+SEEK_LT_1_12_CNT+SEEK_EQ_0_CNT).
Seeks < 2/3 (%)The percentage of seeks less than 2/3. This is calculated asSEEK_LT_2_3_CNT*100/(SEEK_GT_2_3_CNT+SEEK_GT_1_3_CNT+SEEK_GT_1_6_CNT + SEEK_GT_1_12_CNT+SEEK_LT_1_12_CNT+SEEK_EQ_0_CNT).
Seeks > 2/3 (%)The percentage of seeks greater than 2/3. This is calculated asSEEK_GT_2_3_CNT*100/(SEEK_GT_2_3_CNT+SEEK_GT_1_3_CNT+SEEK_GT_1_6_CNT + SEEK_GT_1_12_CNT+SEEK_LT_1_12_CNT+SEEK_EQ_0_CNT).
Seeks (count) The total number of seeks.(SEEK_GT_2_3_CNT+SEEK_GT_1_3_CNT+SEEK_GT_1_6_CNT+SEEK_GT_1_12_CNT + SEEK_LT_1_12_CNT+SEEK_EQ_0_CNT).
OS/400 Perf CPU & Trans by Job Group, Hourly TrendFor a specific OS/400 system in the network, this report (see Figure 55 on page 96) providesthe following hourly trend information about job groups on the OS/400 system:
¶ Processor utilization
¶ Average and maximum response times
¶ Average and maximum transaction rates
¶ Total number of transactions
The information shows how the system is being used, and what type of jobs are being runover a specified time period. A graphical representation of the processor utilization for jobgroups, together with an explanation of job group types, are given in “OS/400 Perf CPU byJob Group, Hourly Trend” on page 97.
95AS/400 System Performance Feature Guide and Reference
5.R
epo
rts

This information identifies the report:
Report ID OS400P06
Report group OS/400 Performance Component Reports
Source OS400_PM_SYS_JGR_H, OS400_JOBGROUP (described on pages 55, and60 respectively)
Attributes OS400, Performance, CPU, Transaction, Hourly, Trend
Variables Date, OS400 system ID
The report contains this information:
Hour The hour.
Job group The job group.
CPU Avg (%) The average processor time used, as a percentage. This iscalculated as CPU.MILLISEC/MEASURED.SEC/10.
CPU Max (%) The maximum processor time used, as a percentage.
Resp time Avg (seconds) The average response time, in seconds. This is calculated asTRAN.MILLISEC/TRANSACTIONS.
OS/400 Perf CPU and Trans by Job Group, Hourly TrendSystem: 'S44A0001' Date: 2000-05-12
Resp Resp Trans TransCPU CPU time time rate rate
Job Avg Max Avg Max Avg Max TransHour group (%) (%) (seconds) (seconds) (/second) (/second) (count)---- ------ ----- ----- --------- --------- --------- --------- -------
16 A-PCS 1.3 5.1 1.6 3.7 0.2 0.5 142B-AUTO 0.0 0.0 0.0 0.0 0.0 0.0 0B-BTCH 2.6 2.6 0.0 0.0 0.0 0.0 0B-COMM 0.4 0.4 0.0 0.0 0.0 0.0 0B-CPF 0.2 0.2 0.0 0.0 0.0 0.0 0
*
17 A-PCS 2.9 13.1 1.2 4.7 0.3 0.7 248B-AUTO 0.1 1.2 0.0 0.0 0.0 0.0 0B-BTCH 3.1 6.1 0.0 0.0 0.0 0.0 0B-COMM 0.3 1.3 0.0 0.0 0.0 0.0 0B-CPF 0.1 0.3 0.0 0.0 0.0 0.0 0
*
18 A-PCS 2.4 13.9 2.8 6.6 0.1 0.3 67B-BTCH 2.6 3.4 0.0 0.0 0.0 0.0 0B-COMM 0.1 1.4 0.0 0.0 0.0 0.0 0B-CPF 0.0 0.3 0.0 0.0 0.0 0.0 0
*
Performance Reporter Report: OS400P06
Figure 55. Example of OS/400 Perf CPU & Trans by Job Group, Hourly Trend
96 Release 5

Resp time Max (seconds) The maximum response time, in seconds.
Trans rate Avg (/second) The average transaction rate, in seconds. This is calculatedas TRANSACTIONS/MEASURED.SEC.
Trans rate Max (/second) The maximum number of transaction per seconds.
Trans (count) The number of transactions.
OS/400 Perf CPU by Job Group, Hourly TrendFor a specific OS/400 system in the network, this graphical display (see Figure 56) showsthe processor utilization by job group, over a specified time period. The information used inthis display is also included in the report “OS/400 Perf CPU & Trans by Job Group, HourlyTrend” on page 95.
This information identifies the report:
Report ID OS400P07
Report group OS/400 Performance Component Reports
Source OS400_PM_SYS_JGR_H, OS400_JOBGROUP (described on pages 55, and60 respectively)
Chart format DRLG4P07
Attributes OS400, Performance, CPU, Utilization, Hourly, Trend
Variables Date, OS400 system ID
The report contains this information:
Hour The hour.
CPU Avg (%) The average percentage processor time used. This iscalculated as (CPU.MILLISEC/MEASURED.SEC/10).
Job group The job group.
Explanation of job group typesJobs are assigned to one of the job groups under the following circumstances:
B-S/36
B-MRT
B-CPF
B-COMM
B-BTCH
B-AUTO
B-PTT
A-PCS
A-INT
A-DDM
CP
U u
tiliz
atio
n
Time of day16 17 18 19 20
7
6
OS/400 Perf CPU uti by job group, Hourly TrendSystem: S44A0001' Date: 2000-05-12
Figure 56. Example of OS/400 Perf CPU by Job Group, Hourly Trend
97AS/400 System Performance Feature Guide and Reference
5.R
epo
rts
B-S/36 A System/36 job runs on the AS/400.
B-MRT A multiple terminal request job is run.
B-CPF A control program facility job (one that is “owned” by the OS/400 system)is run.
B-COMM A session is started between a workstation and an AS/400.
B-BTCH An OS/400 batch job is submitted.
B-AUTO A job is automatically started by a action on the system (for example, anIPL).
A-PCS A workstation supported function is started (for example, terminal emulation,shared folder, or virtual printer).
A-INT An interactive session is started.
A-DDM A distributed data management job is started.
A-PTT A passthrough target job is started.
OS/400 Perf Paging Statistics, Hourly TrendFor a specific OS/400 system in the network, this report (see Figure 57 on page 99) provideshourly trend information about the system paging. For each of the five main storage pools(operating system, base, interactive, batch, and spool), information is given about:
¶ Total number of faults
¶ Database and non-database fault rates (maximum and average)
¶ Database and non-database paging rates (maximum and average)
For guidelines on how to interpret this information, refer to the AS/400 PerformanceTools/400 Guide.
This information identifies the report:
Report ID OS400P08
Report group OS/400 Performance Component Reports
Source OS400_PM_POOL_H (described on page 49)
Attributes OS400, Performance, Page, Paging, Hourly, Trend
Variables Date, OS400 system ID
98 Release 5

The report contains this information:
Hour The hour.
Pool nbr The pool number.
Faults (/second) The number of database faults, per second. This is calculatedasDB_FAULT_SUM+NDB_FAULT_SUM/MEASURED_SEC.
Maximum db faults (/second)The maximum number of database faults, per second.
Average db faults (/second) The average number of database faults, per second. This iscalculated as DB_FAULT_SUM/MEASURED_SEC.
Maximum nondb faults (/second)The maximum number of non-database faults, per second.
Average nondb faults (/second)The average number of non-data base faults, per second.This is calculated asNDB_FAULT_SUM/MEASURED_SEC.
OS/400 Perf Paging Statistics, Hourly TrendSystem: 'S44A0001' Date: 2000-05-12
Maximum Average Maximum Average Maximum Average Maximum Averagedb db nondb nondb db db nondb nondb
Pool Faults faults faults faults faults pg reads pg reads pg reads pg readsHour nbr (/second) (/second) (/second) (/second) (/second) (/second) (/second) (/second) (/second)---- ---- --------- --------- --------- --------- --------- --------- --------- --------- ---------
16 01 3.2 0.0 0.0 3.2 3.2 0.0 0.0 7.6 7.602 7.2 0.5 0.5 6.7 6.7 0.9 0.9 29.0 29.003 0.0 0.0 0.0 0.0 0.0 0.0 0.0 0.0 0.004 0.0 0.0 0.0 0.0 0.0 0.0 0.0 0.1 0.105 0.9 0.0 0.0 0.9 0.9 0.1 0.1 6.0 6.0
*
17 01 0.9 0.0 0.0 2.3 0.9 0.0 0.0 5.6 2.702 4.5 1.2 0.8 5.7 3.7 2.5 1.3 27.8 14.303 0.0 0.0 0.0 0.0 0.0 0.0 0.0 0.0 0.004 1.5 0.2 0.0 4.9 1.4 2.7 0.4 29.8 7.205 1.1 0.3 0.0 8.0 1.0 1.0 0.1 40.5 5.4
*
18 01 0.6 0.0 0.0 2.6 0.6 0.0 0.0 5.9 1.502 4.0 1.5 0.8 9.5 3.2 3.0 1.2 41.1 13.203 0.0 0.0 0.0 0.0 0.0 0.0 0.0 0.0 0.004 1.1 0.2 0.0 5.5 1.0 1.4 0.2 34.2 6.205 0.1 0.0 0.0 0.5 0.1 0.0 0.0 2.6 0.3
*
Performance Reporter Report: OS400P08
Figure 57. Example of OS/400 Perf Paging Statistics, Hourly Trend
99AS/400 System Performance Feature Guide and Reference
5.R
epo
rts
Maximum db pg reads (/second)The maximum database page read rate, per second.
Average db pg reads (/second)The average database page read rate, per second. This iscalculated as DBPG_READ_SUM/MEASURED_SEC.
Maximum nondb pg reads (/second)The maximum non-database page read rate, per second.
Average nondb pg reads (/second)The average non-database page read rate, per second. This iscalculated as NDBPG_READ_SUM/MEASURED_SEC.
OS/400 Perf Storage Pool & Act Level, Hourly TrendFor a specific OS/400 system in the network, this report (see Figure 58 on page 101)provides hourly trend information about the OS/400 storage pools. For each of the five mainstorage pools (operating system, base, interactive, batch, and spool), information is givenabout:
¶ Activity levels (maximum, average, minimum)
¶ Pool sizes (maximum, average, minimum)
¶ Reserved pool sizes (maximum, average, minimum)
For guidelines on how to interpret this information, refer to the AS/400 PerformanceTools/400 Guide.
This information identifies the report:
Report ID OS400P09
Report group OS/400 Performance Component Reports
Source OS400_PM_POOL_H (described on page 49)
Attributes OS400, Performance, Storage, Hourly, Trend
Variables Date, OS400 system ID
100 Release 5

The report contains this information:
Hour The hour.
Pool nbr The pool number.
Maximum activity level (count)The number of maximum activity levels.
Average activity level (count)The average number of maximum activity levels. This iscalculated as ACT_LVL_SET_SUM/SAMPLES.
Minimum activity level (count)The number of minimum activity levels.
Maximum poolsize (KB) The maximum pool size, in kilobytes.
Average poolsize (KB) The average pool size, in kilobytes. This is calculated asPOOL_SIZE_SUM/SAMPLES.
Minimum poolsize (KB) The minimum pool size, in kilobytes.
Maximum reserved poolsize (KB)The maximum reserved pool size, in kilobytes.
OS/400 Perf Storage Pool & Act Level, Hourly TrendSystem: 'S44A0001' Date: 2000-05-12
Maximum Average Minimum Maximum Average Minimumactivity activity activity Maximum Average Minimum reserved reserved reserved
Pool level level level poolsize poolsize poolsize poolsize poolsize poolsizeHour nbr (count) (count) (count) (KB) (KB) (KB) (KB) (KB) (KB)---- ---- -------- -------- -------- -------- -------- -------- -------- -------- --------
16 01 0 0 0 3500 3500 3500 1828 1828 182802 4 4 4 1112 1112 1112 0 0 003 1 1 1 80 80 80 0 0 004 4 4 4 3000 3000 3000 0 0 005 5 5 5 500 500 500 0 0 0
*
17 01 0 0 0 3500 3500 3500 1844 1830 182702 4 4 4 1112 1112 1112 0 0 003 1 1 1 80 80 80 0 0 004 4 4 4 3000 3000 3000 0 0 005 5 5 5 500 500 500 0 0 0
*
18 01 0 0 0 3500 3500 3500 1839 1825 181702 4 4 4 1112 1112 1112 0 0 003 1 1 1 80 80 80 0 0 004 4 4 4 3000 3000 3000 0 0 005 5 5 5 500 500 500 0 0 0
*
Performance Reporter Report: OS400P09
Figure 58. Example of OS/400 Perf Storage Pool & Act Level, Hourly Trend
101AS/400 System Performance Feature Guide and Reference
5.R
epo
rts
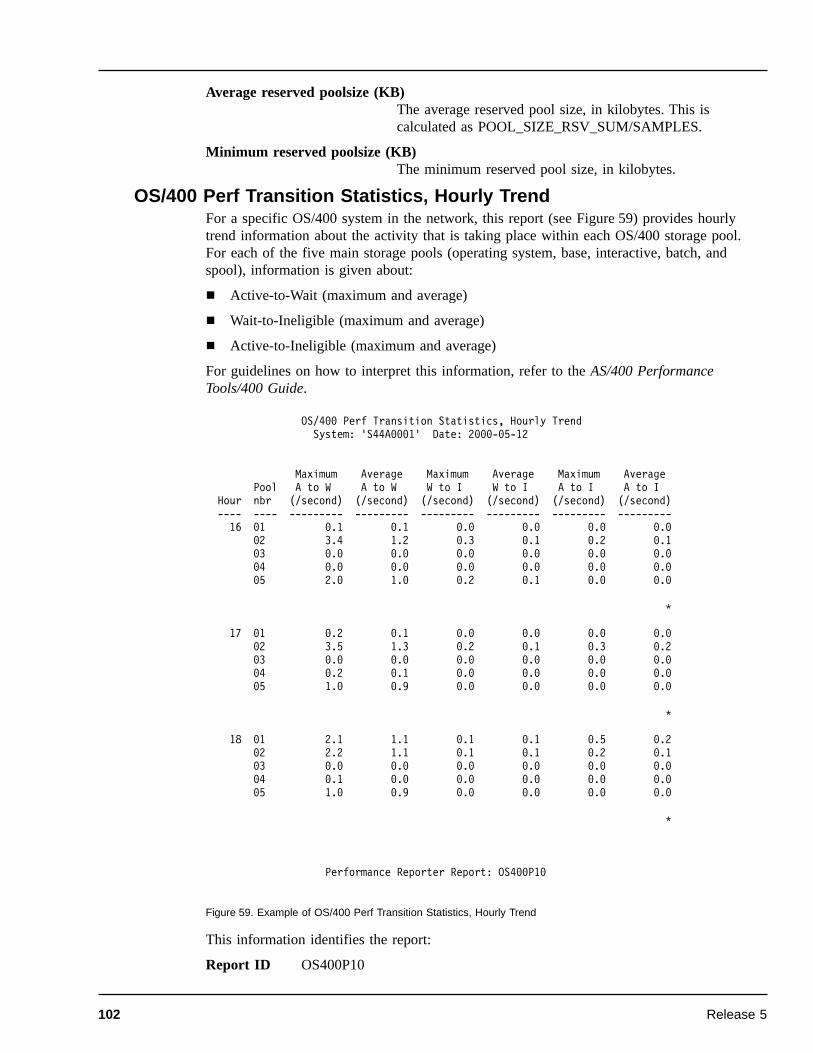
Average reserved poolsize (KB)The average reserved pool size, in kilobytes. This iscalculated as POOL_SIZE_RSV_SUM/SAMPLES.
Minimum reserved poolsize (KB)The minimum reserved pool size, in kilobytes.
OS/400 Perf Transition Statistics, Hourly TrendFor a specific OS/400 system in the network, this report (see Figure 59) provides hourlytrend information about the activity that is taking place within each OS/400 storage pool.For each of the five main storage pools (operating system, base, interactive, batch, andspool), information is given about:
¶ Active-to-Wait (maximum and average)
¶ Wait-to-Ineligible (maximum and average)
¶ Active-to-Ineligible (maximum and average)
For guidelines on how to interpret this information, refer to the AS/400 PerformanceTools/400 Guide.
This information identifies the report:
Report ID OS400P10
OS/400 Perf Transition Statistics, Hourly TrendSystem: 'S44A0001' Date: 2000-05-12
Maximum Average Maximum Average Maximum AveragePool A to W A to W W to I W to I A to I A to I
Hour nbr (/second) (/second) (/second) (/second) (/second) (/second)---- ---- --------- --------- --------- --------- --------- ---------
16 01 0.1 0.1 0.0 0.0 0.0 0.002 3.4 1.2 0.3 0.1 0.2 0.103 0.0 0.0 0.0 0.0 0.0 0.004 0.0 0.0 0.0 0.0 0.0 0.005 2.0 1.0 0.2 0.1 0.0 0.0
*
17 01 0.2 0.1 0.0 0.0 0.0 0.002 3.5 1.3 0.2 0.1 0.3 0.203 0.0 0.0 0.0 0.0 0.0 0.004 0.2 0.1 0.0 0.0 0.0 0.005 1.0 0.9 0.0 0.0 0.0 0.0
*
18 01 2.1 1.1 0.1 0.1 0.5 0.202 2.2 1.1 0.1 0.1 0.2 0.103 0.0 0.0 0.0 0.0 0.0 0.004 0.1 0.0 0.0 0.0 0.0 0.005 1.0 0.9 0.0 0.0 0.0 0.0
*
Performance Reporter Report: OS400P10
Figure 59. Example of OS/400 Perf Transition Statistics, Hourly Trend
102 Release 5

Report group OS/400 Performance Component Reports
Source OS400_PM_POOL_H (described on page 49)
Attributes OS400, Performance, Transition, Hourly, Trend
Variables Date, OS400 system ID
The report contains this information:
Hour The hour.
Pool nbr The pool number.
Maximum A to W (/second) The maximum active-to-wait transitions rate, in seconds.
Average A to W (/second) The average active-to-wait transitions rate, in seconds. Thisis calculated as ACT_WAIT_SUM/MEASURED_SEC.
Maximum W to I (/second) The maximum wait-to-ineligible transitions rate, in seconds.
Average W to I (/second) The average wait-to-ineligible transitions rate, in seconds.This is calculated as WAIT_INEL_SUM/MEASURED_SEC.
Maximum A to I (/second) The maximum active-to-ineligible transition rate, in seconds.
Average A to I (/second) The average active-to-ineligible transition rate, in seconds.This is calculated as ACT_INEL_SUM/MEASURED_SEC.
OS/400 Perf Max & Avg CPU Usage, Hourly TrendFor a specific OS/400 system in the network, this graphical representation (see Figure 60 onpage 104) shows the hourly trend of processor utilization, over a specified time period. Agraphical display of average processor usage for all OS/400 systems in the network, is givenin “OS/400 Perf CPU Usage all Systems, Daily Overview” on page 104.
This information identifies the report:
Report ID OS400P11
Report group OS/400 Performance Component Reports
Source OS400_PERF_SUM_H (described on page 57)
Chart format DRLG4P11
Attributes OS400, Performance, CPU, Utilization, Hourly, Trend
Variables Date, OS400 system ID
103AS/400 System Performance Feature Guide and Reference
5.R
epo
rts
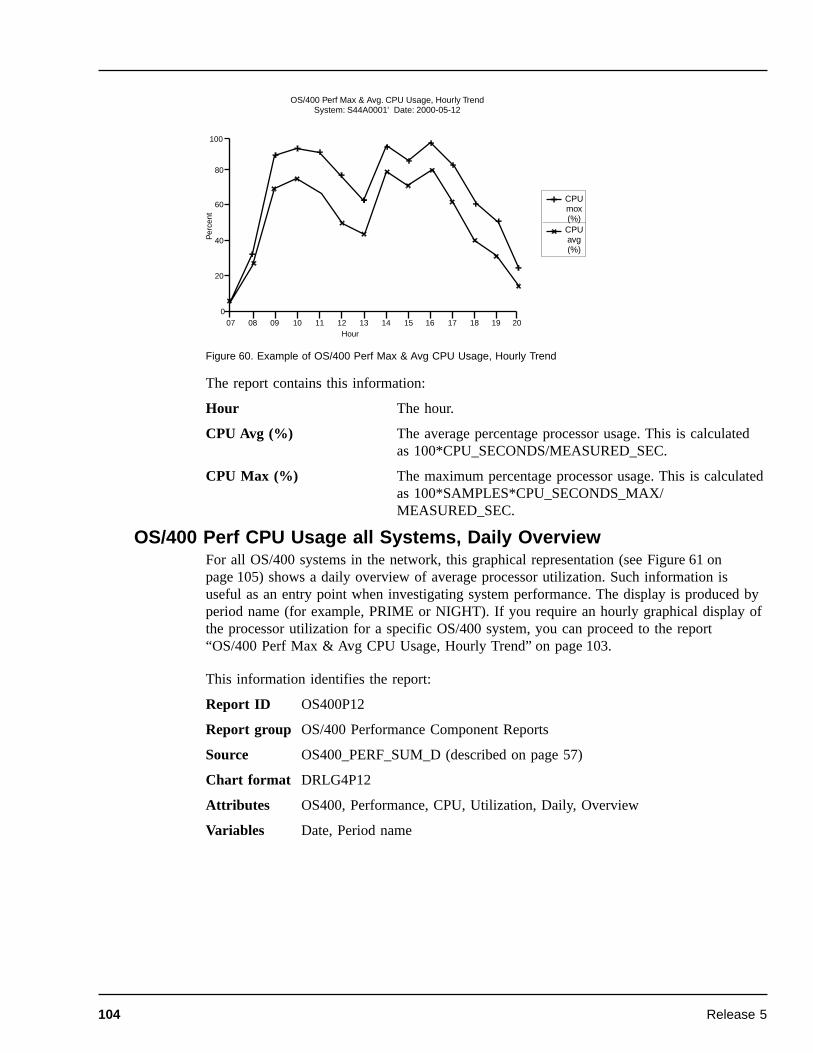
The report contains this information:
Hour The hour.
CPU Avg (%) The average percentage processor usage. This is calculatedas 100*CPU_SECONDS/MEASURED_SEC.
CPU Max (%) The maximum percentage processor usage. This is calculatedas 100*SAMPLES*CPU_SECONDS_MAX/MEASURED_SEC.
OS/400 Perf CPU Usage all Systems, Daily OverviewFor all OS/400 systems in the network, this graphical representation (see Figure 61 onpage 105) shows a daily overview of average processor utilization. Such information isuseful as an entry point when investigating system performance. The display is produced byperiod name (for example, PRIME or NIGHT). If you require an hourly graphical display ofthe processor utilization for a specific OS/400 system, you can proceed to the report“OS/400 Perf Max & Avg CPU Usage, Hourly Trend” on page 103.
This information identifies the report:
Report ID OS400P12
Report group OS/400 Performance Component Reports
Source OS400_PERF_SUM_D (described on page 57)
Chart format DRLG4P12
Attributes OS400, Performance, CPU, Utilization, Daily, Overview
Variables Date, Period name
CPUmox(%)
CPUavg(%)
Per
cent
Hour
100
80
60
40
20
07 08 09 10 11 12 13 14 15 16 17 18 19 200
OS/400 Perf Max & Avg. CPU Usage, Hourly TrendSystem: S44A0001' Date: 2000-05-12
Figure 60. Example of OS/400 Perf Max & Avg CPU Usage, Hourly Trend
104 Release 5

The report contains this information:
OS/400 system ID The system identification.
CPU Avg (%) The average percentage processor usage. This is calculatedas 100*CPU_SECONDS/MEASURED_SEC.
OS/400 Perf Summary all Systems, Daily OverviewFor each OS/400 system in the network, this report (see Figure 62 on page 106) providesdaily overview information about:
¶ Processor usage (average and maximum)
¶ The number of I/Os (average and maximum)
¶ The amount of paging per second (average and maximum)
¶ The average number of jobs
¶ The total auxiliary storage used
¶ The percentage of auxiliary storage used
The report is produced by period name (for example, PRIME or NIGHT). For guidelines onhow to interpret this information, refer to the AS/400 Performance Tools/400 Guide If yourequire more detail about a specific OS/400 system, you can proceed to the report “OS/400Perf Summary for a System, Daily Trend” on page 106.
This information identifies the report:
Report ID OS400P13
Report group OS/400 Performance Component Reports
Source OS400_PERF_SUM_D (described on page 57)
Attributes OS400, Performance, Summary, Daily, Overview
Variables Date, Period name
CPUavg(%)
System Home
70
60
50
40
30
20
10
S44A0001 S44A0002 s44a0003 s44a0004 s44a0005 s44a0006
0
OS/400 Perf CPU Usage all Systems, Daily OverviewDate 2000-07-05
Figure 61. Example of OS/400 Perf CPU Usage all Systems, Daily Overview
105AS/400 System Performance Feature Guide and Reference
5.R
epo
rts
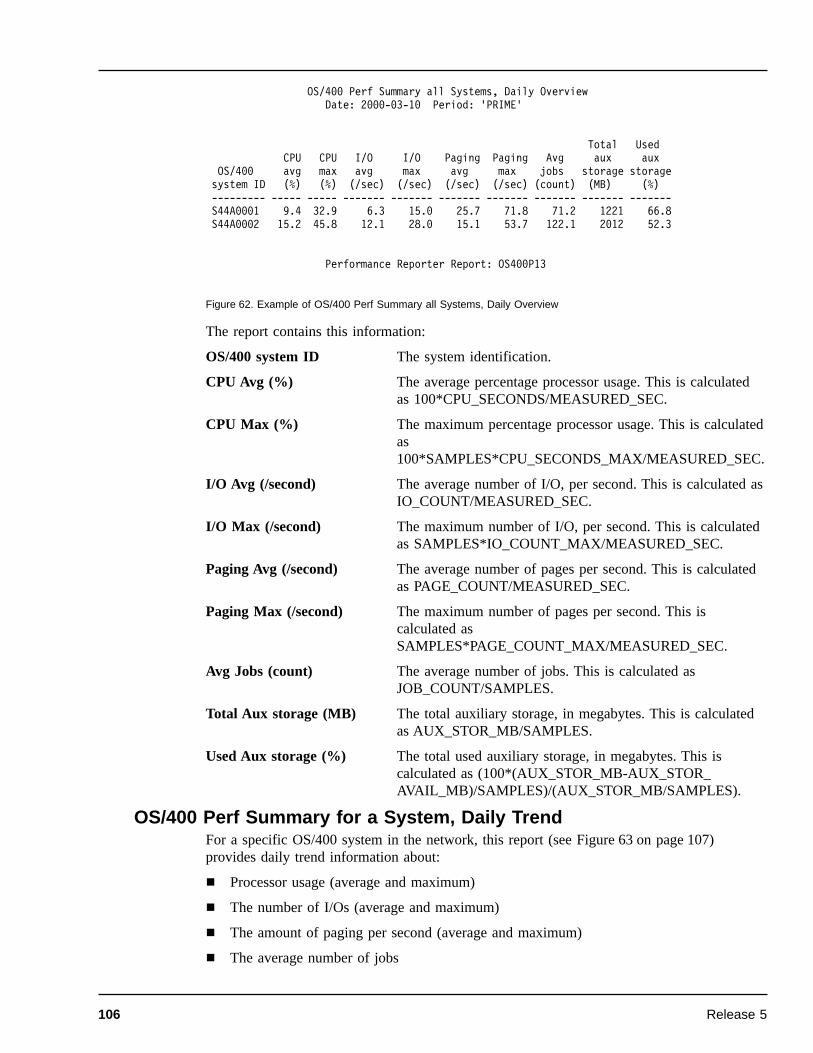
The report contains this information:
OS/400 system ID The system identification.
CPU Avg (%) The average percentage processor usage. This is calculatedas 100*CPU_SECONDS/MEASURED_SEC.
CPU Max (%) The maximum percentage processor usage. This is calculatedas100*SAMPLES*CPU_SECONDS_MAX/MEASURED_SEC.
I/O Avg (/second) The average number of I/O, per second. This is calculated asIO_COUNT/MEASURED_SEC.
I/O Max (/second) The maximum number of I/O, per second. This is calculatedas SAMPLES*IO_COUNT_MAX/MEASURED_SEC.
Paging Avg (/second) The average number of pages per second. This is calculatedas PAGE_COUNT/MEASURED_SEC.
Paging Max (/second) The maximum number of pages per second. This iscalculated asSAMPLES*PAGE_COUNT_MAX/MEASURED_SEC.
Avg Jobs (count) The average number of jobs. This is calculated asJOB_COUNT/SAMPLES.
Total Aux storage (MB) The total auxiliary storage, in megabytes. This is calculatedas AUX_STOR_MB/SAMPLES.
Used Aux storage (%) The total used auxiliary storage, in megabytes. This iscalculated as (100*(AUX_STOR_MB-AUX_STOR_AVAIL_MB)/SAMPLES)/(AUX_STOR_MB/SAMPLES).
OS/400 Perf Summary for a System, Daily TrendFor a specific OS/400 system in the network, this report (see Figure 63 on page 107)provides daily trend information about:
¶ Processor usage (average and maximum)
¶ The number of I/Os (average and maximum)
¶ The amount of paging per second (average and maximum)
¶ The average number of jobs
OS/400 Perf Summary all Systems, Daily OverviewDate: 2000-03-10 Period: 'PRIME'
Total UsedCPU CPU I/O I/O Paging Paging Avg aux aux
OS/400 avg max avg max avg max jobs storage storagesystem ID (%) (%) (/sec) (/sec) (/sec) (/sec) (count) (MB) (%)--------- ----- ----- ------- ------- ------- ------- ------- ------- -------S44A0001 9.4 32.9 6.3 15.0 25.7 71.8 71.2 1221 66.8S44A0002 15.2 45.8 12.1 28.0 15.1 53.7 122.1 2012 52.3
Performance Reporter Report: OS400P13
Figure 62. Example of OS/400 Perf Summary all Systems, Daily Overview
106 Release 5

¶ The total auxiliary storage used
¶ The percentage of auxiliary storage used
The report is produced by period name (for example, PRIME or NIGHT). For guidelines onhow to interpret this information, refer to the AS/400 Performance Tools/400 Guide If yourequire hourly trend information about a specific OS/400 system, you can proceed to thereport “OS/400 Perf Summary for a System, Hourly Trend” on page 108.
This information identifies the report:
Report ID OS400P14
Report group OS/400 Performance Component Reports
Source OS400_PERF_SUM_D (described on page 57)
Attributes OS400, Performance, Summary, Daily, Trend
Variables From date, To date, Period name, OS400 system ID
The report contains this information:
CPU Avg (%) The average percentage processor usage. This is calculatedas 100*CPU_SECONDS/MEASURED_SEC.
CPU Max (%) The maximum percentage processor usage. This is calculatedas100*SAMPLES*CPU_SECONDS_MAX/MEASURED_SEC.
I/O Avg (/second) The average number of I/O, per second. This is calculated asIO_COUNT/MEASURED_SEC.
I/O Max (/second) The maximum number of I/O, per second. This is calculatedas SAMPLES*IO_COUNT_MAX/MEASURED_SEC.
Paging Avg (/second) The average number of pages per second. This is calculatedas PAGE_COUNT/MEASURED_SEC.
Paging Max (/second) The maximum number of pages per second. This iscalculated asSAMPLES*PAGE_COUNT_MAX/MEASURED_SEC.
OS/400 Perf Summary for A System, Daily TrendSystem: 'S44A0001' Date: '2000-03-01' to '2000-05-01'
Period: 'PRIME'
Total UsedCPU CPU I/O I/O Paging Paging Avg aux auxavg max avg max avg max jobs storage storage
Date (%) (%) (/sec) (/sec) (/sec) (/sec) (count) (MB) (%)---------- ----- ----- ------ ------ ------ ------ ------- ------- -------1993-03-10 9.4 32.9 6.0 15.0 25.3 71.8 71.1 1221 66.81993-05-10 9.4 32.9 6.0 15.0 25.3 71.8 71.1 1221 66.8
Performance Reporter Report: OS400P14
Figure 63. Example of OS/400 Perf Summary for a System, Daily Trend
107AS/400 System Performance Feature Guide and Reference
5.R
epo
rts
Avg Jobs (count) The average number of jobs. This is calculated asJOB_COUNT/SAMPLES.
Total Aux storage (MB) The total auxiliary storage, in megabytes. This is calculatedas AUX_STOR_MB/SAMPLES.
Used Aux storage (%) The total used auxiliary storage, in megabytes. This iscalculated as (100*(AUX_STOR_MB-AUX_STOR_AVAIL_MB)/SAMPLES)/(AUX_STOR_MB/SAMPLES).
OS/400 Perf Summary for a System, Hourly TrendFor a specific OS/400 system in the network, this report (see Figure 64 on page 109)provides hourly trend information about:
¶ Processor usage (average and maximum)
¶ The number of I/Os (average and maximum)
¶ The amount of paging per second (average and maximum)
¶ The average number of jobs
¶ The total auxiliary storage used
¶ The percentage of auxiliary storage used
The report is produced by period name (for example, PRIME or NIGHT). For guidelines onhow to interpret this information, refer to theAS/400 Performance Tools/400 Guide.
This information identifies the report:
Report ID OS400P15
Report group OS/400 Performance Component Reports
Source OS400_PERF_SUM_H (described on page 57)
Attributes OS400, Performance, Summary, Hourly, Trend
Variables Date, OS400 system ID
108 Release 5

The report contains this information:
Hour The hour.
CPU Avg (%) The average percentage processor usage. This is calculatedas 100*CPU_SECONDS/MEASURED_SEC.
CPU Max (%) The maximum percentage processor usage. This is calculatedas 100*SAMPLES*CPU_SECONDS_MAX/MEASURED_SEC.
I/O Avg (/second) The average number of I/O, per second. This is calculated asIO_COUNT/MEASURED_SEC.
I/O Max (/second) The maximum number of I/O, per second. This is calculatedas SAMPLES*IO_COUNT_MAX/MEASURED_SEC.
Paging Avg (/second) The average number of pages per second. This is calculatedas PAGE_COUNT/MEASURED_SEC.
Paging Max (/second) The maximum number of pages per second. This iscalculated asSAMPLES*PAGE_COUNT_MAX/MEASURED_SEC.
Avg Jobs (count) The average number of jobs. This is calculated asJOB_COUNT/SAMPLES.
Total Aux storage (MB) The total auxiliary storage, in megabytes. This is calculatedas AUX_STOR_MB/SAMPLES.
Used Aux storage (%) The total used auxiliary storage, in megabytes. This iscalculated as (100*(AUX_STOR_MB-AUX_STOR_AVAIL_MB)/SAMPLES)/(AUX_STOR_MB/SAMPLES).
OS/400 Perf Summary for a System, Hourly TrendSystem: 'S44A0001' Date: '2000-03-10'
Total UsedCPU CPU I/O I/O Paging Paging Avg Aux AuxAvg Max Avg Max Avg Max Jobs storage storage
Hour (%) (%) (/sec) (/sec) (/sec) (/sec) (count) (MB) (%)---- ----- ----- ------- ------- ------- ------- ------- ------- -------
14 13.0 13.1 6.7 6.7 27.3 27.3 72.0 1221 67.215 14.9 32.9 9.1 15.0 38.8 71.8 72.4 1221 67.016 3.6 8.2 3.4 12.2 12.6 43.0 70.0 1221 66.617 0.6 2.0 0.4 3.2 1.5 11.8 64.0 1221 66.418 0.4 0.8 0.1 0.5 0.5 2.2 64.0 1221 66.419 0.4 1.0 0.1 0.6 0.4 2.3 64.0 1221 66.420 0.4 0.8 0.1 0.5 0.3 2.2 64.0 1221 66.421 0.4 1.0 0.1 0.5 0.4 2.3 64.0 1221 66.422 6.5 30.8 5.2 25.6 20.2 98.3 64.1 1221 66.7
Performance Reporter Report: OS400P15
Figure 64. Example of OS/400 Perf Summary for a System, Hourly Trend
109AS/400 System Performance Feature Guide and Reference
5.R
epo
rts

110 Release 5
III — Appendixes
111AS/400 System Performance Feature Guide and Reference

112 Release 5

AS/400 system performance commands
This Appendix describes the AS/400 System Performance Feature (SP400) commands. Youcan use this information as a reference to request functions from the SP400 feature.
How to read syntax diagramsThis chapter uses syntax diagrams to illustrate the required syntax of commands andstatements. This section describes how to use these diagrams.
Reading syntax diagramsThe syntax diagrams start with double arrowheads on the left (QQ) and move along the mainline until you end with two arrowheads facing each other (QR). To use a syntax diagram,follow any path from left to right. When you reach the end of a line, go to the beginning ofthe next line, if there is one. For whatever path you choose, code every item that appears onthe path. All spaces, commas, and other characters are significant.
Abbreviating keywordsIn a syntax diagram, keywords are all or partly in uppercase. Where an abbreviation ispossible, the abbreviation is shown in uppercase and the rest of the keyword is shown inlowercase. Variable values that you provide are shown in italics.
QQ SEnd 'message text' QR
The previous diagram shows that you can code the SEND command in either of thefollowing ways:SE ‘message text’SEND ‘message text’
ParametersThe following are types of parameters used in syntax diagrams:
Parameter DescriptionRequired Required parameters are displayed on the main path.Optional Optional parameters are displayed below the main path.Default Default parameters are displayed above the main path.
Parameters are classified as keywords or variables. Keywords are displayed in uppercaseletters and can be typed in uppercase or lowercase. For example, a command is a keyword.
Variables are italicized, appear in lowercase letters, and represent names or values yousupply. For example, a file name is a variable.
A
113AS/400 System Performance Feature Guide and Reference
A.
AS
/400system
perfo
rman
ceco
mm
and
s

In the following example, NSASOLCT is a command, the variable parameter is ncp_name,the keyword is CLOCK, and CLOCK’s variable is time. You replace the variables with yourown values.
QQ NSASOLCT ncp_name,CLOCK=time
QR
Required parametersA stack of parameters with the first parameter on the main path means that you must chooseonly one from the stack.
In the following example, the required parameters are LU, GROUP, CDRM, or APPL.
QQ SESSCOLL LU=lunameGROUP=gnameCDRM=cnameAPPL=applname
QR
Default and optional parametersItems shown above the main line are defaults. Items shown below the main line are optional.
QQ SEnd 'message text',HOST=LOCAL
,HOST=hostnameQR
The previous diagram shows that if you do not specify a host, HOST=LOCAL is used. Tosend a message to a different host, for example NYC, code the SEND command as follows:SEND ‘message text’,HOST=NYC
Repeating parametersItems that can be repeated are shown as follows:
QQ CRITERIA U
,
'expression'QR
The previous diagram shows that the following are all valid ways of coding the CRITERIAstatement:CRITERIACRITERIA ‘expression’CRITERIA ‘expression1’,‘expression2’CRITERIA ‘expression1’,‘expression2’,‘expression3’CRITERIA ‘expression1’,‘expression2’,‘expression3’,‘expression4’
and so on.
Reading fragmentsSyntax diagrams can contain fragments. A fragment is indicated by vertical bars with thename of the fragment between the bars. The fragment appears after the main diagram, asshown in the following example.
114 Release 5

QQ SEnd 'message text' Route QR
Route:
,ROUTE=GLOBAL
,ROUTE= ALLCONSOLEEXTERNAL
The previous diagram shows that the following are all valid ways of coding the SENDcommand:SE ‘message text’SE ‘message text’,ROUTE=GLOBALSE ‘message text’,ROUTE=ALLSE ‘message text’,ROUTE=CONSOLESE ‘message text’,ROUTE=EXTERNAL
Long syntax diagramsWhen more than one row is needed for a syntax diagram, the continued line ends with asingle arrowhead (Q) and following line begins with a single arrowhead (Q), as shown in thefollowing example.
QQ SELECTDATES=(50-01-01,49-12-31)
DATES=( start )start,end,end
,TIMES=(00:00:00,24:00:00)
,TIMES=( start )start,end,end
,DAILY=Yes
,DAILY=NoQR
STRSPSRV (Start SP400 Server) commandQQ STRSPSRV
5INTERVAL ( time interval )
Q
Q*LIBL/ QCTL
JOBQ job queue )
*CURLIB/
library name/
QR
Note: You can specify all the parameters in positional form.
PurposeThe Start SP400 Server (STRSPSRV) command is used to start the SP400 monitoring job.The SP400 job sends the DRL8003 message to the system history log. The DRL8003message includes performance information on the system, such as CPU utilization, auxiliarystorage available, I/O, and paging.
115AS/400 System Performance Feature Guide and Reference
A.
AS
/400system
perfo
rman
ceco
mm
and
s
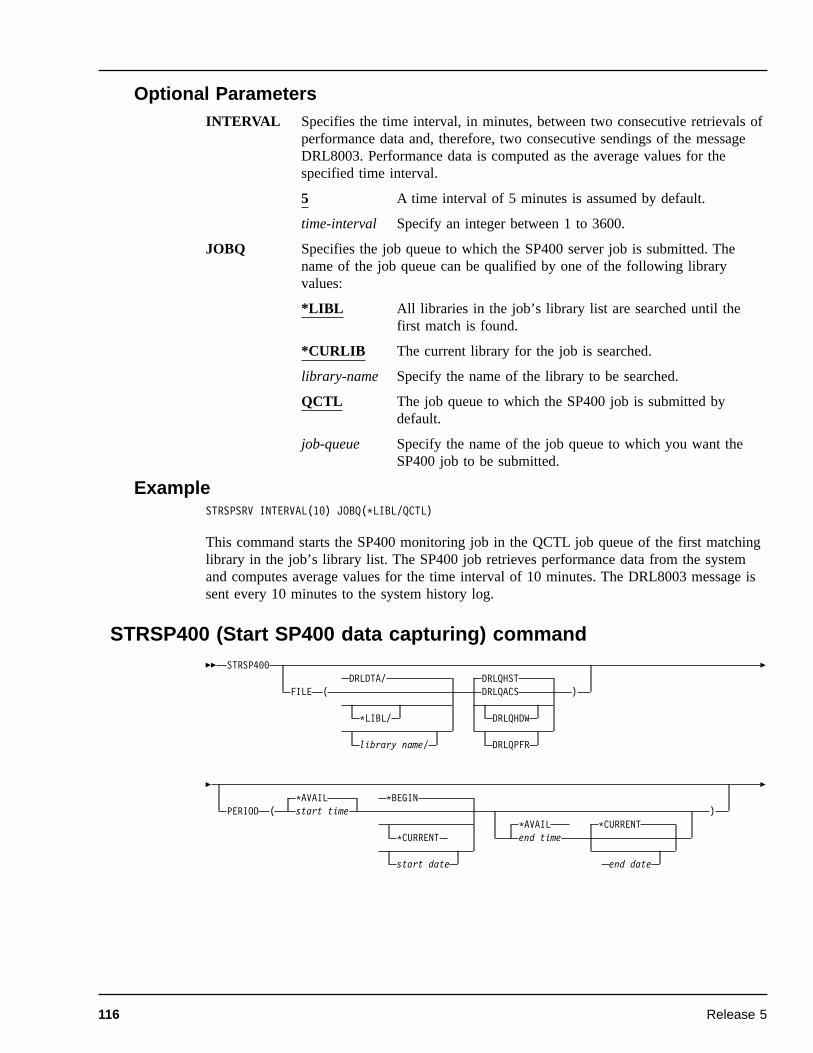
Optional ParametersINTERVAL Specifies the time interval, in minutes, between two consecutive retrievals of
performance data and, therefore, two consecutive sendings of the messageDRL8003. Performance data is computed as the average values for thespecified time interval.
5 A time interval of 5 minutes is assumed by default.
time-interval Specify an integer between 1 to 3600.
JOBQ Specifies the job queue to which the SP400 server job is submitted. Thename of the job queue can be qualified by one of the following libraryvalues:
*LIBL All libraries in the job’s library list are searched until thefirst match is found.
*CURLIB The current library for the job is searched.
library-name Specify the name of the library to be searched.
QCTL The job queue to which the SP400 job is submitted bydefault.
job-queue Specify the name of the job queue to which you want theSP400 job to be submitted.
ExampleSTRSPSRV INTERVAL(10) JOBQ(*LIBL/QCTL)
This command starts the SP400 monitoring job in the QCTL job queue of the first matchinglibrary in the job’s library list. The SP400 job retrieves performance data from the systemand computes average values for the time interval of 10 minutes. The DRL8003 message issent every 10 minutes to the system history log.
STRSP400 (Start SP400 data capturing) commandQQ STRSP400
DRLDTA/ DRLQHSTFILE ( DRLQACS )
*LIBL/ DRLQHDW
library name/ DRLQPFR
Q
Q*AVAIL *BEGIN
PERIOD ( start time )*AVAIL *CURRENT
*CURRENT end time
start date end date
Q
116 Release 5
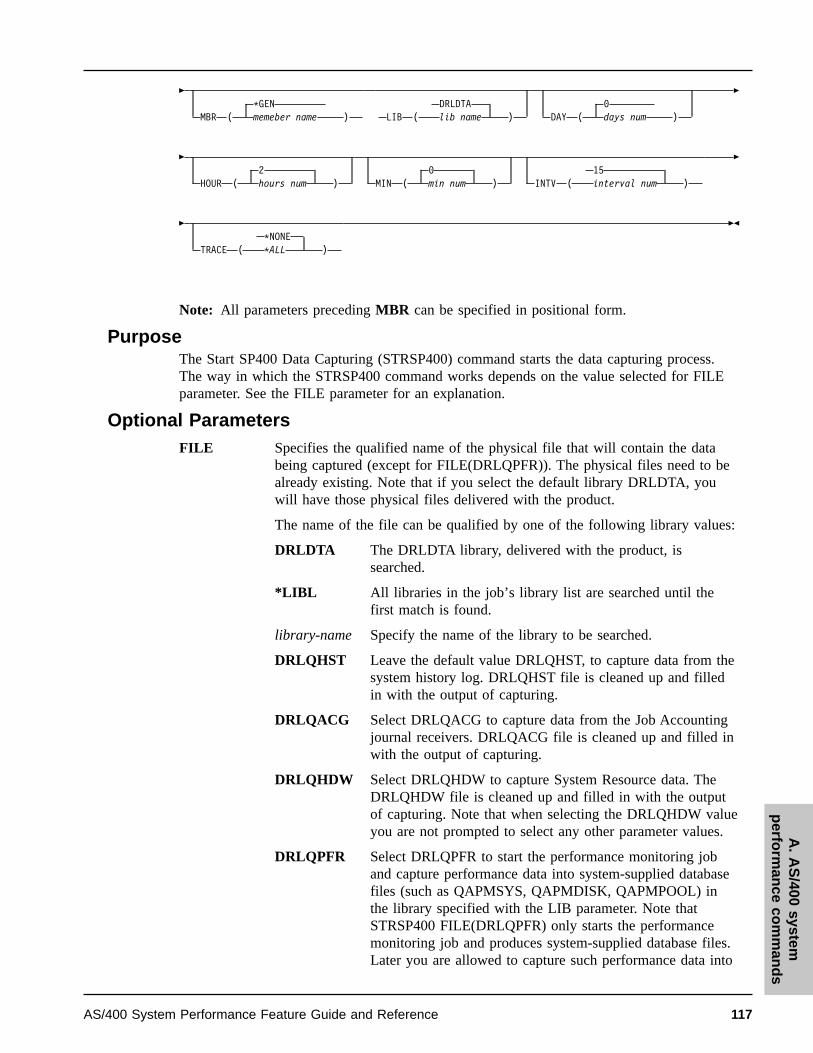
Q*GEN
MBR ( memeber name )DRLDTA
LIB ( lib name )0
DAY ( days num )
Q
Q2
HOUR ( hours num )0
MIN ( min num )15
INTV ( interval num )
Q
Q*NONE
TRACE ( *ALL )
QR
Note: All parameters preceding MBR can be specified in positional form.
PurposeThe Start SP400 Data Capturing (STRSP400) command starts the data capturing process.The way in which the STRSP400 command works depends on the value selected for FILEparameter. See the FILE parameter for an explanation.
Optional ParametersFILE Specifies the qualified name of the physical file that will contain the data
being captured (except for FILE(DRLQPFR)). The physical files need to bealready existing. Note that if you select the default library DRLDTA, youwill have those physical files delivered with the product.
The name of the file can be qualified by one of the following library values:
DRLDTA The DRLDTA library, delivered with the product, issearched.
*LIBL All libraries in the job’s library list are searched until thefirst match is found.
library-name Specify the name of the library to be searched.
DRLQHST Leave the default value DRLQHST, to capture data from thesystem history log. DRLQHST file is cleaned up and filledin with the output of capturing.
DRLQACG Select DRLQACG to capture data from the Job Accountingjournal receivers. DRLQACG file is cleaned up and filled inwith the output of capturing.
DRLQHDW Select DRLQHDW to capture System Resource data. TheDRLQHDW file is cleaned up and filled in with the outputof capturing. Note that when selecting the DRLQHDW valueyou are not prompted to select any other parameter values.
DRLQPFR Select DRLQPFR to start the performance monitoring joband capture performance data into system-supplied databasefiles (such as QAPMSYS, QAPMDISK, QAPMPOOL) inthe library specified with the LIB parameter. Note thatSTRSP400 FILE(DRLQPFR) only starts the performancemonitoring job and produces system-supplied database files.Later you are allowed to capture such performance data into
117AS/400 System Performance Feature Guide and Reference
A.
AS
/400system
perfo
rman
ceco
mm
and
s

the physical files DRLQSYS, DRLQDSK, DRLQPOL byusing the Save SP400 Data (SAVSPDTA) command. Unlikethe other choices, no physical file DRLQPFR is produced.
PERIOD This parameter is only prompted for DRLQHST and DRLQACG values ofthe FILE parameter. It specifies the time period covered by the loggedmessage data, if FILE(DRLQHST), or by the Job Accounting data, ifFILE(DRLQACG), being captured. The values that can be coded for thisparameter are specified as a list of three elements, the last of which is a listof two elements. If PERIOD is not specified, the following values areassumed:
PERIOD((*AVAIL *BEGIN (*AVAIL *CURRENT)))
Note that if the defaults are used, the command will go back to the last timeit was run and start there to capture data to the present. The first time thecommand is executed with the defaults, data will be collected from thebeginning of all of the history files if FILE(DRLQHST), or from thebeginning of all of the Job Accounting journal receivers ifFILE(DRLQACG).
Element 1: Starting TimeOne of the following is used to specify the starting time atwhich or after which the history data must have been loggedor the accounting data must have been journaled. Entrieslogged or journaled before the specified time and date arenot captured.
The logged or journaled data that is available starting fromthe specified starting date and since the last time thiscommand was run is captured. The first time this commandis run the data that is available since the specified startingdate is captured.
starting-time Specify the starting time on the specified starting date thatindicates the logged or journaled data to start to be captured.The time is specified in 24-hour format with or without atime separator as follows:
¶ With a time separator, specify a string of 5 or 8 digitswhere the time separator separates the hours, minutesand seconds. If this command is entered from thecommand line, the string must be enclosed inapostrophes. If a time separator other than the separatorspecified for your job is used, this command fails.
¶ Without a time separator, specify a string of 4 or 6 digits(hhmm or hhmmss) where hh = hours, mm = minutesand ss = seconds. Valid values for hh range from 00through 23. Valid values for mm and ss range from 00through 59.
Element 2: Starting DateOne of the following is used to specify the starting date onwhich or after which the history data must have been logged
118 Release 5
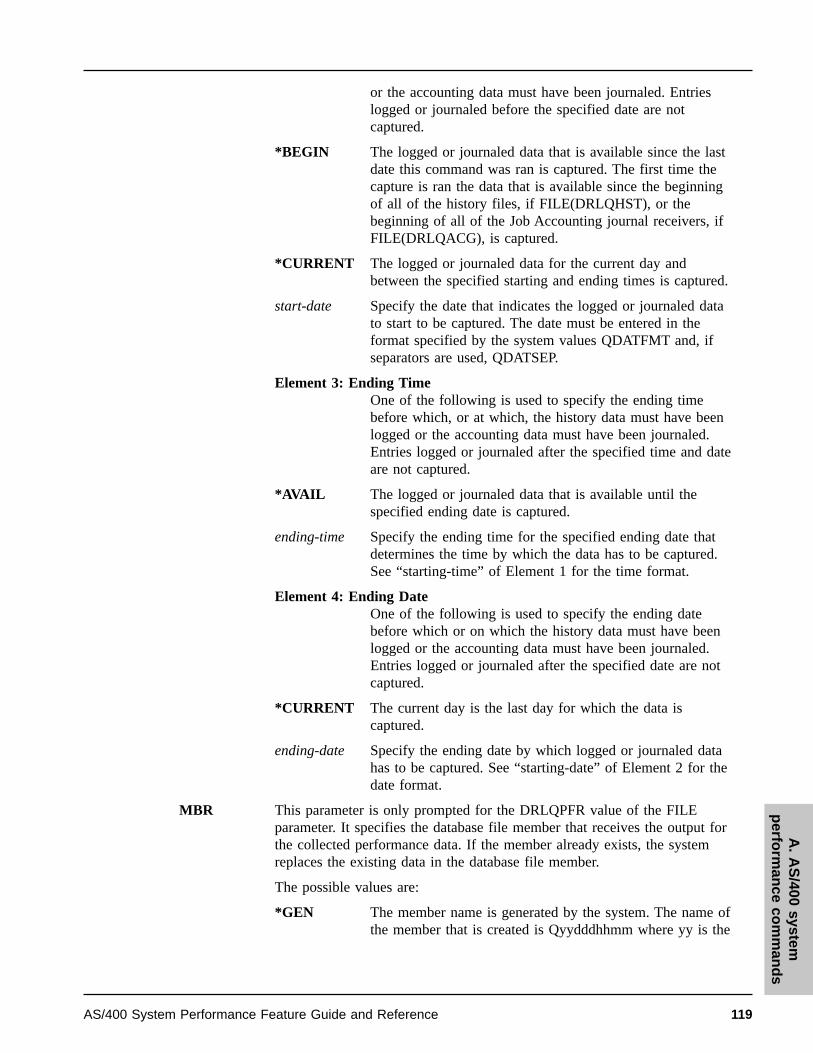
or the accounting data must have been journaled. Entrieslogged or journaled before the specified date are notcaptured.
*BEGIN The logged or journaled data that is available since the lastdate this command was ran is captured. The first time thecapture is ran the data that is available since the beginningof all of the history files, if FILE(DRLQHST), or thebeginning of all of the Job Accounting journal receivers, ifFILE(DRLQACG), is captured.
*CURRENT The logged or journaled data for the current day andbetween the specified starting and ending times is captured.
start-date Specify the date that indicates the logged or journaled datato start to be captured. The date must be entered in theformat specified by the system values QDATFMT and, ifseparators are used, QDATSEP.
Element 3: Ending TimeOne of the following is used to specify the ending timebefore which, or at which, the history data must have beenlogged or the accounting data must have been journaled.Entries logged or journaled after the specified time and dateare not captured.
*AVAIL The logged or journaled data that is available until thespecified ending date is captured.
ending-time Specify the ending time for the specified ending date thatdetermines the time by which the data has to be captured.See “starting-time” of Element 1 for the time format.
Element 4: Ending DateOne of the following is used to specify the ending datebefore which or on which the history data must have beenlogged or the accounting data must have been journaled.Entries logged or journaled after the specified date are notcaptured.
*CURRENT The current day is the last day for which the data iscaptured.
ending-date Specify the ending date by which logged or journaled datahas to be captured. See “starting-date” of Element 2 for thedate format.
MBR This parameter is only prompted for the DRLQPFR value of the FILEparameter. It specifies the database file member that receives the output forthe collected performance data. If the member already exists, the systemreplaces the existing data in the database file member.
The possible values are:
*GEN The member name is generated by the system. The name ofthe member that is created is Qyydddhhmm where yy is the
119AS/400 System Performance Feature Guide and Reference
A.
AS
/400system
perfo
rman
ceco
mm
and
s

year, ddd is the date in Julian format and hhmm is the time(in hours and minutes) at which the Performance Monitorjob creates the member.
member-name Specify the name of the member that is used by thePerformance Monitor. If a member does not exist, the systemcreates a member that has the specified name.
LIB This parameter is only prompted for the DRLQPFR value of the FILEparameter. It specifies the library where the database files for performancedata are collected. Each file that is not found in the specified library isautomatically created by the system in the specified library.
The possible values are:
DRLDTA The default library supplied with the product.
library-name Specify the name of the library where the database files arelocated.
DAY This parameter is only prompted for the DRLQPFR value of the FILEparameter. It specifies the number of days from the current day untilcollection ends.
0 Performance data is collected for 0 full days. Data can becollected for less than one full day using the HOUR andMINUTE parameters.
number-of-daysSpecify the number of days from the current day until datacollection ends. Valid values range from 0 through 7.
HOUR This parameter is only prompted for the DRLQPFR value of the FILEparameter. It specifies the number of hours to collect data.
2 The Performance Monitor job runs for 2 hours by default.
hour-number Specify the number of hours to collect data. You can specify a value rangingfrom 0 through 999.
MIN This parameter is only prompted for the DRLQPFR value of the FILE parameter. Itspecifies the number of minutes to collect data.
0 Performance data is collected for 0 minutes by default.
number-of-minutesSpecify the number of minutes to collect data. You can specify avalue ranging from 0 through 99.
INTV This parameter is only prompted for the DRLQPFR value of the FILE parameter. Itspecifies the time interval, in minutes, between each collection of systemperformance data.
15 Performance data is collected every 15 minutes by default.
number-of-minutesSpecify a collection interval value between 5 and 60 minutes. Thisvalue must be a multiple of 5.
120 Release 5

TRACEThis parameter is only prompted for the DRLQPFR value of the file parameter.Specifies the type of internal trace that is started.
*NONE By default a trace is not started.
*ALL All of the internal traces that contain performance relatedinformation are started. Note that if another trace is running, then theother trace is canceled.
ExamplesSTRSP400 PERIOD((000000 970101))
This command captures data from the history logged data available from the midnight of1997 January 1st until the current date and time. The data is captured into the DRLQHSTphysical file of the DRLDTA library.STRSP400 FILE(DRLQPFR) LIB(MYLIB) HOUR(0) MIN(30)
This command starts the Performance Monitor job. It will run for 30 minutes and willproduce database files with system-supplied names, such as QAPMSYS, QAPMDISK, andQAPMPOOL, into the MYLIB library. Members with names Qyydddhhmm will be createdinto the above files every 15 minutes.
INZTAP (Initialize Tape) command
QQ INZTAP ( DEVTAP01device name) SP400
NEWVOL ( *NONE )
*CTGID
new vol id
Q
121AS/400 System Performance Feature Guide and Reference
A.
AS
/400system
perfo
rman
ceco
mm
and
s

Q*DEVTYPE
DENSITY ( *QIC120 )
10000
*QIC525
16000
*QIC1000
*QIC2GB
*QIC3040
*QIC5010
*FMT3480
38000
*FMT3490E
*FMT3570
*FMT3570E
*FMT3590
*FMT3590E
1600
3200
6250
*FMT2GB
43200
*FMT5GB
*FMT7GB
QR
Note: All parameters preceding DENSITY can be specified in positional form.
PurposeThe Initialize Tape (INZTAP) command prepares magnetic tapes for later use of savingcaptured data, by means of the Save SP400 Data (SAVSPDTA) command. This command isused to write volume labels on standard-labeled magnetic tapes so the tape device supportcan do standard-label processing. Unlabeled tapes must also be initialized by this commandor by a similar process on another system before these tapes can be used on the AS/400system.
Required parameterDEV Specifies the name of the device in which the volume being initialized is placed.
TAP01 has been set as default value.
122 Release 5

Optional ParametersNEWVOL
Specifies the volume identifier for a tape being initialized for use as a standardlabeled tape.
SP400 This is the default value.
*NONE The tape is initialized for use as an unlabeled tape. Only tape marksare used to indicate the beginning and the end of the volume itself.
*CTGID The tape is initialized as a standard labeled tape. The new logicalvolume identifier is the same as the external identifier of the tapecartridge. Each tape within a library device must have a uniqueexternal identifier.
new-volume-identifierSpecify no more than 6 characters to identify the new volume. Theidentifier must contain only alphanumeric characters (A through Z, $,#, @, and 0 through 9), and cannot have a prefix or contain blanks.
DENSITYSpecifies the recording format in which to write the data on the tape.
*DEVTYPE The data that is written on the tape volume is based on the type oftape unit being used.
Tape Device Default Density2440 62503422 62503430 62503480 *FMT34803490E *FMT3490E3570-BXX *FMT35703570-CXX *FMT3570E3590 *FMT35906335 *QIC30406341 *QIC1206342 *QIC5256343 *QIC10006344 *QIC2GB6346 *QIC1206347 *QIC5256348 *QIC10006349 *QIC2GB6366 *QIC1206368 *QIC10006369 *QIC2GB6378 *QIC5256379 *QIC10006380 *QIC2GB6385 *QIC50106390 *FMT7GB7208-002 *FMT2GB7208-012 *FMT5GB7208-222 *FMT7GB9346 *QIC1209347 32009348 6250
1600 The data density on this tape volume is 1,600 bits per inch. Thisdensity is used for 1/2 inch reel tapes.
123AS/400 System Performance Feature Guide and Reference
A.
AS
/400system
perfo
rman
ceco
mm
and
s

3200 The data density on this tape volume is 3,200 bits per inch. Thisdensity is used for 1/2 inch reel tapes on devices that support thisdensity.
6250 The data density on this tape volume is 6,250 bits per inch. Thisdensity is used for 1/2 inch reel tapes on devices that support thisdensity.
*FMT3480 The format of this tape is FMT3480. The data density on this tapevolume is formatted to support a 3480 device. This density is usedfor 1/2 inch cartridge tapes.
*FMT3490E The format of this tape is FMT3490E. The data density on this tapevolume is formatted to support a 3490E device. This density is usedfor 1/2 inch cartridge tapes.
*FMT3570 The format of this tape is FMT3570. The data format is written onthe tape volume with a 3570-BXX device.
*FMT3570E The format of this tape is FMT3570E. The data format is written onthe tape volume with a 3570-CXX device.
*FMT3590 The format of this tape is FMT3590. The data format is written onthe tape volume with a 3590 device. This density is used for 1/2inch cartridge tapes.
*QIC120 The format of this tape is QIC120. This density is used for 1/4 inchcartridge tapes that can hold 120 megabyte of data.
*QIC525 The format of this tape is QIC525. This density is used for 1/4 inchcartridge tapes that can hold 525 megabytes of data.
*QIC1000 The format of this tape is QIC1000. This density is used for 1/4 inchcartridge tapes that can hold 1200 megabytes of data.
*QIC2GB The format of this tape is QIC2GB, which is used for 1/4 inchcartridge tapes that can hold 2.5 gigabytes of data.
*QIC3040 The format of this tape is QIC3040, which is used for 1/4 inchcartridge tapes that can hold 840 megabytes of data.
*QIC5010 The format of this tape is QIC5010, which is used for 1/4 inchcartridge tapes that can hold 13.5 gigabytes of data.
*FMT2GB The format of this tape is FMT2GB, which is used for 8 millimetercartridge tapes that can hold 2 gigabytes of data.
*FMT5GB The format of this tape is FMT5GB, which is used for 8 millimetercartridge tapes that can hold 5 gigabytes of data.
*FMT7GB The format of this tape is FMT7GB, which is used for 8 millimetercartridge tapes that can hold 7 gigabytes of data.
Example.INZTAP DEV(TAP01) NEWVOL(SP400) DENSITY(*DEVTYPE)
This command initializes the volume on the tape device named TAP01 with new volumeidentifier SP400 with a density based on the device type.
124 Release 5
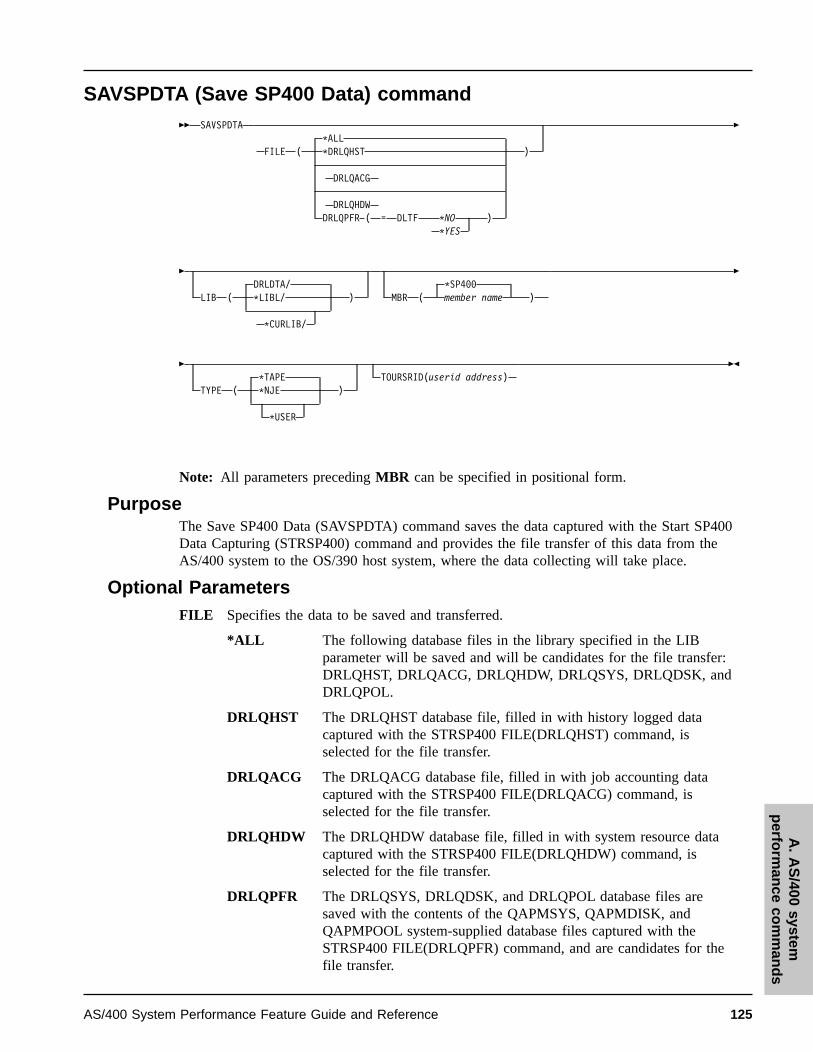
SAVSPDTA (Save SP400 Data) commandQQ SAVSPDTA
*ALLFILE ( *DRLQHST )
DRLQACG
DRLQHDWDRLQPFR ( = DLTF *NO )
*YES
Q
QDRLDTA/
LIB ( *LIBL/ )
*CURLIB/
*SP400MBR ( member name )
Q
Q*TAPE
TYPE ( *NJE )
*USER
TOURSRID(userid address)QR
Note: All parameters preceding MBR can be specified in positional form.
PurposeThe Save SP400 Data (SAVSPDTA) command saves the data captured with the Start SP400Data Capturing (STRSP400) command and provides the file transfer of this data from theAS/400 system to the OS/390 host system, where the data collecting will take place.
Optional ParametersFILE Specifies the data to be saved and transferred.
*ALL The following database files in the library specified in the LIBparameter will be saved and will be candidates for the file transfer:DRLQHST, DRLQACG, DRLQHDW, DRLQSYS, DRLQDSK, andDRLQPOL.
DRLQHST The DRLQHST database file, filled in with history logged datacaptured with the STRSP400 FILE(DRLQHST) command, isselected for the file transfer.
DRLQACG The DRLQACG database file, filled in with job accounting datacaptured with the STRSP400 FILE(DRLQACG) command, isselected for the file transfer.
DRLQHDW The DRLQHDW database file, filled in with system resource datacaptured with the STRSP400 FILE(DRLQHDW) command, isselected for the file transfer.
DRLQPFR The DRLQSYS, DRLQDSK, and DRLQPOL database files aresaved with the contents of the QAPMSYS, QAPMDISK, andQAPMPOOL system-supplied database files captured with theSTRSP400 FILE(DRLQPFR) command, and are candidates for thefile transfer.
125AS/400 System Performance Feature Guide and Reference
A.
AS
/400system
perfo
rman
ceco
mm
and
s

DLTF DRLQPFR has an additional parameter, DLTF (deleteperformance files). The default value is *NO, which meansthat the unused performance files are not deleted from thedata library. If you specify a value of *YES, the unusedperformance files are deleted from the data library.
LIB Specifies the library containing the files being saved and transferred. It has to be thesame library where the files have been captured with the STRSP400 command.
DRLDTA The DRLDTA library, delivered with the product, is searched for thefiles being saved and transferred.
*LIBL All libraries in the job’s library list are searched until the first matchis found.
*CURLIB The current library for the job is searched.
library-name Specify the name of the library to be searched.
MBR This parameter is prompted only when DRLQPFR value is selected for FILEparameter. Specifies the members to be saved from the performance files(QAPMSYS, QAPMDISK and QAPMPOOL database files) to the SP400 files(DRLQSYS, DRLQDSK and DRLQPOL database files).
*SP400 All members of the performance files are saved into the SP400 files.
member-name Specify the name of the member to be saved from the performancefiles to the SP400 files.
TYPE Specifies the file transfer method to transfer the saved files to the OS/390 host side.
*TAPE The saved files are transferred to tape.
*NJE The saved files are transferred through Network Job Entry. Theselected database files will be sent to the TSO user at the host sitespecified in the TOUSRID parameter.
*USER The saved files are sent with a file transfer method other than*TAPE or *NJE. When you use the *USER value, you must havecreated a user exit program and a data area. The user exit programmust reside in a library of the library list. It must define twoparameters: LIBRARY and FILE, since it will be called from theSP400 feature with the different qualified file names selected fortransferring. The user data area must have the nameDRLDTA/USERDTAARA and the program name must reside in thefirst 10 characters of the user data area. However, executing theSAVSPDTA command the first time with *USER will create theDRLDTA/USERDTAARA. Since it is blank, the program name mustbe added.
TOUSRIDThis parameter is only prompted when *NJE is selected for TYPE parameter.Specify the Userid and Address of the TSO user to which The data is being sent.
ExamplesSAVSPDTA FILE(DRLQPFR) TYPE(*NJE) TOUSRID(TRAMO ROMEPPC)
126 Release 5

This command saves the performance files captured with the STRSP400 FILE(DRLQPFR)command into the database files DRLQSYS, DRLQDSK, and DRLQPOL in the DRLDTAlibrary delivered with the product. The command then sends them through the network tothe TSO user TRAMO at ROMEPPC.SAVSPDTA FILE(DRLQHST) LIB(MYLIB) DEV(TAP01)
This command transfers the DRLQHST database file of the MYLIB library, captured withthe STRSP400 FILE(DRLQHST) command, to the tape TAP01. The database file can laterbe transferred from tape to the host OS/390 system, where the collecting will take place.
127AS/400 System Performance Feature Guide and Reference
A.
AS
/400system
perfo
rman
ceco
mm
and
s

128 Release 5
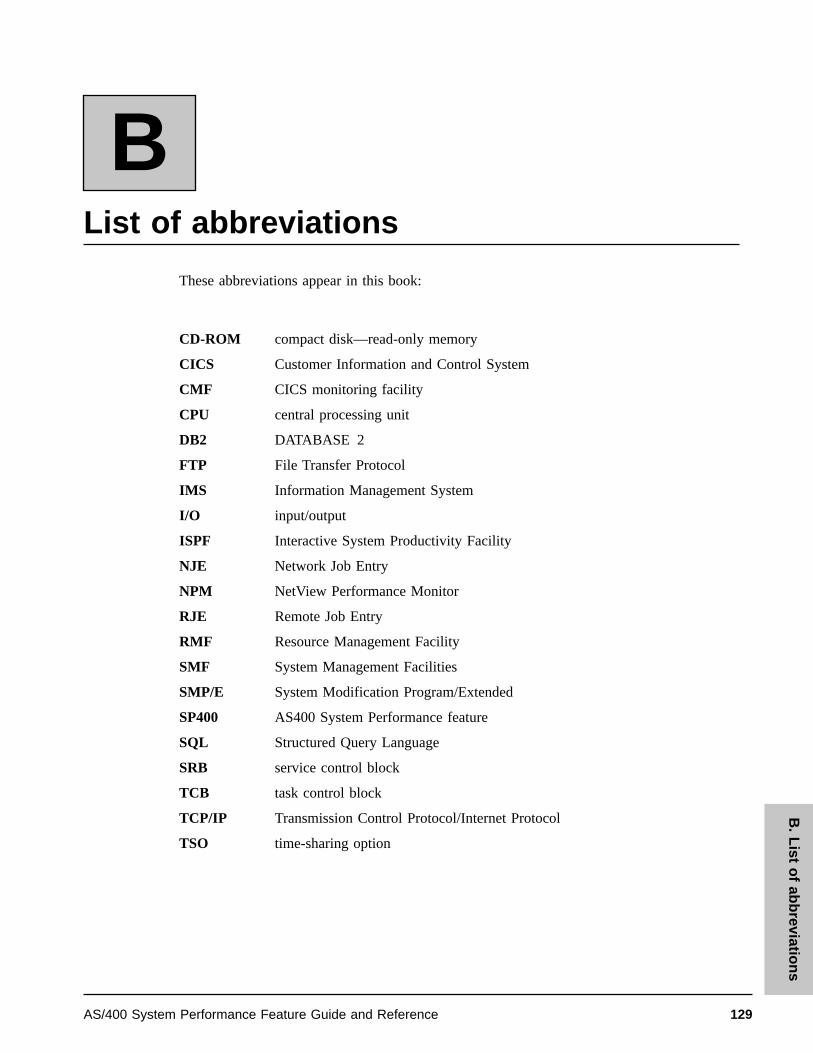
List of abbreviations
These abbreviations appear in this book:
CD-ROM compact disk—read-only memory
CICS Customer Information and Control System
CMF CICS monitoring facility
CPU central processing unit
DB2 DATABASE 2
FTP File Transfer Protocol
IMS Information Management System
I/O input/output
ISPF Interactive System Productivity Facility
NJE Network Job Entry
NPM NetView Performance Monitor
RJE Remote Job Entry
RMF Resource Management Facility
SMF System Management Facilities
SMP/E System Modification Program/Extended
SP400 AS400 System Performance feature
SQL Structured Query Language
SRB service control block
TCB task control block
TCP/IP Transmission Control Protocol/Internet Protocol
TSO time-sharing option
B
129AS/400 System Performance Feature Guide and Reference
B.
List
of
abb
reviation
s

130 Release 5
Glossary
A
administrationA Performance Reporter task that includes maintaining the database, updating environment information, andensuring the accuracy of data collected.
administration dialogThe set of host windows used to administer Performance Reporter.
C
COLLECTA process used by Performance Reporter to read data from input log data sets, interpret records in the data set,and store the data in DB2 tables in the Performance Reporter database.
componentAn optionally installable part of a Performance Reporter feature.
control tableA predefined Performance Reporter table that controls results returned by some log collector functions.
D
Data Language/I (DL/I)An IBM database-management facility.
data tableA Performance Reporter table that contains performance data used to create reports.
distributed transaction processingThe distribution of processing among transactions that communicate synchronously with each other overintersystem or interregion links.
E
environment informationAll of the information that is added to the log data to create reports. This information can include data such asperformance groups, shift periods, installation definitions, and so on.
H
help topicsAn online table of contents for the Performance Reporter online help information.
C
131AS/400 System Performance Feature Guide and Reference
C.
Glo
ssary
K
key columnsThe columns of a DB2 table that together constitute the key.
key valueValue used to sort records into groups.
L
logAny sequential data set used as input to Performance Reporter.
log collectorA Performance Reporter program that processes log data sets and provides other Performance Reporter services.
log collector languagePerformance Reporter statements used to supply definitions to and invoke services of the log collector.
log data setAny sequential data set used as input to Performance Reporter.
log definitionThe description of a log data set processed by the log collector.
log procedureA program module that is used to process all record types in certain log data sets.
logical unit (LU)A port through which a user gains access to the services of a network.
lookup expressionAn expression that specifies how a value is obtained from a lookup table.
lookup tableA Performance Reporter DB2 table that contains grouping, translation, or substitution information.
O
objectAn integral part of a feature component needed for data collection (for example, record definitions, recordprocedures, and update definitions).
P
Performance Reporter databaseA set of DB2 tables that includes data tables, lookup tables, system tables, and control tables.
purge conditionInstruction for purging unneeded data from the Performance Reporter database.
R
record definitionThe description of a record type contained in the log data sets used by Performance Reporter, including detailedrecord layout and data formats.
record procedureA program module that is called to process some types of log records.
record typeThe classification of records in a log data set.
132 Release 5

regionA section of the dynamic area that is allocated to a job step or system task.
report definition languagePerformance Reporter statements used to define reports and report groups.
report groupA collection of Performance Reporter reports that can be referred to by a single name.
reporting dialogA set of host or workstation windows used to request reports.
resourceAny facility of the computing system or operating system required by a job or task, including central storage,input/output devices, the processing unit, data sets, and control or processing programs.
resource groupA collection of resources identified as belonging to a particular department or division. Resources are organizedinto groups to reflect the structure of an organization.
resource informationEnvironment information that describes the elements in a system (for example, a network).
S
sectionA structure within a record that contains one or more fields and may contain other sections.
sourceIn an update definition, the record or DB2 table that contains the data used to update a Performance ReporterDB2 table.
subcomponentAn optionally installable part of a Performance Reporter feature component.
system tableA DB2 table that stores information for controlling log collector processing, Performance Reporter dialogs, andreporting.
T
targetIn an update definition, the DB2 table in which Performance Reporter stores data from the source record or table.
thresholdThe maximum or minimum acceptable level of usage. Usage measurements are compared with threshold levels.
Transmission Control Protocol/Internet Protocol (TCP/IP)A non-proprietary communications protocol for linking workstations to host computers and to other hardware.
U
update definitionInstructions for entering data into DB2 tables from records of different types or from other DB2 tables.
updatesInstructions in Performance Reporter on how to process data from log data sets to DB2 tables.
133AS/400 System Performance Feature Guide and Reference
C.
Glo
ssary

V
viewAn alternative representation of data from one or more tables. A view can include all or some of the columnscontained in the table on which it is defined.
134 Release 5

Index
Aabbreviations used in this book, list of 129accounting component
data flow 33reports 65tables 42
accounting component data tables 42OS400_ACCT_JOB_D 42OS400_ACCT_JOB_M 42OS400_ACCT_PRINT_D 43OS400_ACCT_PRINT_M 43
accounting component reports 65OS/400 Acct Job Accounting, Monthly Overview 65OS/400 Acct Print Accounting, Monthly Overview 66
active to ineligible, on system 102active to wait, on system 102activity levels 100, 102arm movements 94AS/400 system performance commands
INZTAP 121SAVSPDTA 125STRSP400 116STRSPSRV 115
attributes, report 64audience for this book, intended xviiauxiliary storage, used 105, 106, 108
Cchanges to this book xviiicollecting performance data, summary 3collection optimization, data 25commands
INZTAP 121SAVSPDTA 125STRSP400 116STRSPSRV 115
communication between AS/400 and OS/390 7component installation 20configuration component
data flow 34reports 67tables 43
configuration component reports 67capturing data on AS/400 13OS/400 RISC Config all Devices, Overview 68OS/400 RISC Config DASD Capacity Overview 70OS/400 RISC Config Main Storage Overview 70OS/400OS/400 Config Device Count Type/Model,
Overview 71OS/400OS/400 Config Device for Specific Type,
Overview 72
control tables 31CPU utilization 65, 74, 75, 76, 78, 79, 87, 95, 97, 103, 104,
105, 106, 108customizing SP400 feature on the AS/400 12
Ddaily reports
OS/400 Job Statistics all Systems, Daily Trend(OS400J03) 75
OS/400 Messages Most Frequent, Daily Overview(OS400M02) 82
OS/400 Perf CPU Usage all Systems, Daily Overview(OS400P12) 104
OS/400 Perf Summary all Systems, Daily Overview(OS400P13) 105
OS/400 Perf Summary for a System, Daily Trend(OS400P14) 106
datasources of performance 13
data collection, optimizing 25data flow from AS/400 to Performance Reporter
accounting component 33configuration component 34job statistics component 36messages component 37overview 30performance component 39
data tablesin the accounting component 42
OS400_ACCT_JOB_D 42OS400_ACCT_JOB_M 42OS400_ACCT_PRINT_D 43OS400_ACCT_PRINT_M 43
in the job statistics component 45OS400_JOB_STAT_D 45OS400_JOB_STAT_M 45
in the messages component 46OS400_MSG_STAT_D 46OS400_MSG_STAT_DV (View) 46OS400_MSG_STAT_M 46OS400_MSG_STAT_MV (View) 46
in the performance component 47OS400_PERF_SUM_D 57OS400_PERF_SUM_H 57OS400_PM_DISK_D 47OS400_PM_DISK_H 47OS400_PM_POOL_D 49OS400_PM_POOL_H 49OS400_PM_SYS_D 50OS400_PM_SYS_H 50OS400_PM_SYS_JGR_D 55
135AS/400 System Performance Feature Guide and Reference
Ind
ex

data tables (continued)OS400_PM_SYS_JGR_H 55
naming standard 41summarization-level suffixes 41
diskarm movements 90, 94capacity 92
disk capacity 92disk space requirements 7
Eelapsed time 74, 75, 76, 77, 78evaluation and planning 6exceptions, system 89
Fformat, Performance Reporter report 63
Gglossary 131groups, report 4
Hhourly reports
OS/400 Perf CPU & Trans by Job Group, Hourly Trend(OS400P06) 95
OS/400 Perf CPU and RTM Statistics, Hourly Trend(OS400P01) 87
OS/400 Perf CPU by Job Group, Hourly Trend(OS400P07) 97
OS/400 Perf Disk Arm Movements, Hourly Trend(OS400P05) 94
OS/400 Perf Disk Capacity Statistics, Hourly Trend(OS400P04) 92
OS/400 Perf Disk I/O Statistics, Hourly Trend(OS400P03) 90
OS/400 Perf Exception and Lock Stat, Hourly Trend(OS400P02) 89
OS/400 Perf Max & Avg CPU Usage, Hourly Trend(OS400P11) 103
OS/400 Perf Paging Statistics, Hourly Trend(OS400P08) 98
OS/400 Perf Storage Pool & Act Level, Hourly Trend(OS400P09) 100
OS/400 Perf Summary for a System, Hourly Trend(OS400P15) 108
OS/400 Perf Transition Statistics, Hourly Trend(OS400P10) 102
how to use this book xviii
II/Os
number 65, 74, 75, 76, 77, 78, 79, 105trend 90, 106, 108
identifiers, report 63implementing SP400 feature
collecting data under Performance Reporter 24considering components to install 6customizing SP400 feature on AS/400 12installing SP400 feature on AS/400 7installing SP400 feature on the OS/390 system 20planning the process 5putting SP400 feature into production 25testing SP400 feature installation 25updating lookup tables 22
installing SP400 feature on AS/400 7intended audience for this book xviiINZTAP command 121
Jjob statistics component
data flow 36reports 73tables 45
job statistics component data tables 45OS400_JOB_STAT_D 45OS400_JOB_STAT_M 45
job statistics component reports 73OS/400 Job Acct from History Log, Monthly Overview 79OS/400 Job CPU Usage by User, Monthly Overview 74OS/400 Job Statistics all Systems, Daily Trend 75OS/400 Job Statistics all Systems, Monthly Trend 76OS/400 Job Statistics by User, Monthly Overview 74OS/400 Job Type Statistics, Monthly Overview 78OS/400 Jobs Statistics for a User, Monthly Overview 77
jobs, number per system 75, 76, 77, 78, 105, 106jobs, number per user 65, 66, 74jobs,number per user 79
Llibrary, Performance Reporter xixlist of abbreviations used in this book 129list of terms used in this book 131locks, on system 89log files on OS/400 12logs, description 31lookup tables, description 58
OS400_DASDTYPE 43, 58OS400_DATE_FORMAT 60OS400_JOB_ACCTCODE 58
136 Release 5

lookup tables, description 58 (continued)OS400_JOBGROUP 60
lookup tables, updating 22OS400_DASDTYPE 23OS400_DATE_FORMAT 23OS400_JOB_ACCTCODE 22OS400_JOBGROUP 23
Mmeasuring response time 77, 87, 95messages
message lines 81, 84, 86number 81, 82, 83, 84, 85, 86percentage occurrence 82, 83, 84, 85, 86text bytes per 81, 83
messages componentdata flow 37reports 80tables 46
messages component data tables 46OS400_MSG_STAT_D 46OS400_MSG_STAT_DV (View) 46OS400_MSG_STAT_M 46OS400_MSG_STAT_MV (View) 46
messages component reports 80OS/400 Messages All Systems, Monthly Overview 81OS/400 Messages by Sev. Codes, Monthly Overview 84OS/400 Messages by Type, Monthly Overview 85OS/400 Messages by User Name, Monthly Overview 86OS/400 Messages for a User, Monthly Overview 84OS/400 Messages Most Frequent, Daily Overview 82OS/400 Messages Most Frequent, Monthly Overview 83
monthly reportsOS/400 Acct Job Accounting, Monthly Overview
(OS400A01) 65OS/400 Acct Print Accounting, Monthly Overview
(OS400A02) 66OS/400 Job Acct from History Log, Monthly Overview
(OS400J07) 78, 79OS/400 Job CPU Usage by User, Monthly Overview
(OS400J02) 74OS/400 Job Statistics all Systems, Monthly Trend
(OS400J04) 74OS/400 Job Type Statistics, Monthly Overview
(OS400J06) 77OS/400 Jobs Statistics for a User, Monthly Overview
(OS400J05) 76OS/400 Messages All Systems, Monthly Overview
(OS400M01) 81OS/400 Messages by Sev. Codes, Monthly Overview
(OS400M04) 84OS/400 Messages by Type, Monthly Overview
(OS400M06) 85OS/400 Messages by User Name, Monthly Overview
(OS400M07) 86OS/400 Messages for a User, Monthly Overview
(OS400M05) 84
monthly reports (continued)OS/400 Messages Most Frequent, Monthly Overview
(OS400M03) 83
Nnaming standards for tables 41
Ooptimizing data collection 25OS/400 log files 12
Ppaging
per second 105, 106, 108trend 98
performance componentdata flow 39reports 87tables 47
performance component data tables 47OS400_PERF_SUM_D 57OS400_PERF_SUM_H 57OS400_PM_DISK_D 47OS400_PM_DISK_H 47OS400_PM_POOL_D 49OS400_PM_POOL_H 49OS400_PM_SYS_D 50OS400_PM_SYS_H 50OS400_PM_SYS_JGR_D 55OS400_PM_SYS_JGR_H 55
performance component reports 87OS/400 Perf CPU & Trans by Job Group, Hourly Trend 95OS/400 Perf CPU and RTM Statistics, Hourly Trend 87OS/400 Perf CPU by Job Group, Hourly Trend 97OS/400 Perf CPU Usage all Systems, Daily Overview 104OS/400 Perf Disk Arm Movements, Hourly Trend 94OS/400 Perf Disk Capacity Statistics, Hourly Trend 92OS/400 Perf Disk I/O Statistics, Hourly Trend 90OS/400 Perf Exception and Lock Stat, Hourly Trend 89OS/400 Perf Max & Avg CPU Usage, Hourly Trend 103OS/400 Perf Paging Statistics, Hourly Trend 98OS/400 Perf Storage Pool & Act Level, Hourly Trend 100OS/400 Perf Summary all Systems, Daily Overview 105OS/400 Perf Summary for a System, Daily Trend 106OS/400 Perf Summary for a System, Hourly Trend 108OS/400 Perf Transition Statistics, Hourly Trend 102
performance managementcollecting data 3concepts xx
Performance Reporter, structure of 3Performance Reporter product library xixprerequisites to reading this book xvii
137AS/400 System Performance Feature Guide and Reference
Ind
ex

printed pagesnumber 66
product library, Performance Reporter xix
Rrecord definitions, description 31report groups 4report IDs 63
OS400A01 (OS/400 Acct Job Accounting, MonthlyOverview) 65
OS400A02 (OS/400 Acct Print Accounting, MonthlyOverview) 66
OS400J01 (OS/400 Job Statistics by User, MonthlyOverview) 74
OS400J02 (OS/400 Job CPU Usage by User, MonthlyOverview) 74
OS400J03 (OS/400 Job Statistics all Systems, DailyTrend) 75
OS400J04 (OS/400 Job Statistics all Systems, MonthlyTrend) 76
OS400J05 (OS/400 Jobs Statistics for a User, MonthlyOverview) 77
OS400J06 (OS/400 Job Type Statistics, MonthlyOverview) 78
OS400J07 (OS/400 Job Acct from History Log, MonthlyOverview) 79
OS400M01 (OS/400 Messages All Systems, MonthlyOverview) 81
OS400M02 (OS/400 Messages Most Frequent, DailyOverview) 82
OS400M03 (OS/400 Messages Most Frequent, MonthlyOverview) 83
OS400M04 (OS/400 Messages by Sev. Codes, MonthlyOverview) 84
OS400M05 (OS/400 Messages for a User, MonthlyOverview) 84
OS400M06 (OS/400 Messages by Type, MonthlyOverview) 85
OS400M07 (OS/400 Messages by User Name, MonthlyOverview) 86
OS400P01 (OS/400 Perf CPU and RTM Statistics, HourlyTrend) 87
OS400P02 (OS/400 Perf Exception and Lock Stat, HourlyTrend) 89
OS400P03 (OS/400 Perf Disk I/O Statistics, HourlyTrend) 90
OS400P04 (OS/400 Perf Disk Capacity Statistics, HourlyTrend) 92
OS400P05 (OS/400 Perf Disk Arm Movements, HourlyTrend) 94
OS400P06 (OS/400 Perf CPU & Trans by Job Group,Hourly Trend) 95
OS400P07 (OS/400 Perf CPU by Job Group, HourlyTrend) 97
OS400P08 (OS/400 Perf Paging Statistics, HourlyTrend) 98
OS400P09 (OS/400 Perf Storage Pool & Act Level, HourlyTrend) 100
report IDs 63 (continued)OS400P10 (OS/400 Perf Transition Statistics, Hourly
Trend) 102OS400P11 (OS/400 Perf Max & Avg CPU Usage, Hourly
Trend) 103OS400P12 (OS/400 Perf CPU Usage all Systems, Daily
Overview) 104OS400P13 (OS/400 Perf Summary all Systems, Daily
Overview) 105OS400P14 (OS/400 Perf Summary for a System, Daily
Trend) 106OS400P15 (OS/400 Perf Summary for a System, Hourly
Trend) 108OS436C01 (OS/400 RISC Config all Devices,
Overview) 68OS436C02 (OS/400 RISC Config DASD Capacity
Overview) 70OS436C03 (OS/400 RISC Config Main Storage
Overview) 70OS436C04 (OS/400 Config Device Count Type/Model,
Overview) 71OS436C04 (OS/400 RISC Config Device Count
Type/Model, Overview) 71OS436C05 (OS/400 Config Device for Specific Type,
Overview) 72OS436C05 (OS/400 RISC Config Device for Specific Type,
Overview) 72reporting dialogs xixreports
attributes 64format and general description 63identifiers, unique 63in the accounting component 65
OS/400 Acct Job Accounting, Monthly Overview 65OS/400 Acct Print Accounting, Monthly Overview 66
in the configuration component 67OS/400 RISC Config all Devices, Overview 68OS/400 RISC Config DASD Capacity Overview 70OS/400 RISC Config Device Count Type/Mode 71OS/400 RISC Config Device for Specific Type,
Overview 72OS/400 RISC Config Main Storage Overview 70OS/400OS/400 Config Device Count Type/Model,
Overview 71OS/400OS/400 Config Device for Specific Type,
Overview 72in the job statistics component 73
OS/400 Job Acct from History Log, MonthlyOverview 79
OS/400 Job CPU Usage by User, Monthly Overview 74OS/400 Job Statistics all Systems, Daily Trend 75OS/400 Job Statistics all Systems, Monthly Trend 76OS/400 Job Statistics by User, Monthly Overview 74OS/400 Job Type Statistics, Monthly Overview 78OS/400 Jobs Statistics for a User, Monthly
Overview 77in the messages component 80
OS/400 Messages All Systems, Monthly Overview 81OS/400 Messages by Sev. Codes, Monthly Overview 84OS/400 Messages by Type, Monthly Overview 85
138 Release 5
reports (continued)OS/400 Messages by User Name, Monthly
Overview 86OS/400 Messages for a User, Monthly Overview 84OS/400 Messages Most Frequent, Daily Overview 82OS/400 Messages Most Frequent, Monthly
Overview 83in the performance component 87
OS/400 Perf CPU & Trans by Job Group, HourlyTrend 95
OS/400 Perf CPU and RTM Statistics, Hourly Trend 87OS/400 Perf CPU by Job Group, Hourly Trend 97OS/400 Perf CPU Usage all Systems, Daily
Overview 104OS/400 Perf Disk Arm Movements, Hourly Trend 94OS/400 Perf Disk Capacity Statistics, Hourly Trend 92OS/400 Perf Disk I/O Statistics, Hourly Trend 90OS/400 Perf Exception and Lock Stat, Hourly Trend 89OS/400 Perf Max & Avg CPU Usage, Hourly
Trend 103OS/400 Perf Paging Statistics, Hourly Trend 98OS/400 Perf Storage Pool & Act Level, Hourly
Trend 100OS/400 Perf Summary all Systems, Daily
Overview 105OS/400 Perf Summary for a System, Daily Trend 106OS/400 Perf Summary for a System, Hourly Trend 108OS/400 Perf Transition Statistics, Hourly Trend 102
source tables 64variables 64
requirements on OS/400 software 7response time 77, 87, 95
SSAVSPDTA command 125seek times, disk 94source tables 64storage pools 98, 100STRSP400 command 116STRSPSRV command 115suffixes, data-table 41syntax diagrams, how to use 113system performance commands
INZTAP 121SAVSPDTA 125STRSP400 116STRSPSRV 115
SystemView and Performance Reporter xvii
Ttables
lookup 58OS400_ACCT_JOB_D 42OS400_ACCT_JOB_M 42OS400_ACCT_PRINT_D 43
tables (continued)OS400_ACCT_PRINT_M 43OS400_DASDTYPE 58OS400_DATE_FORMAT 60OS400_JOB_ACCTCODE 58OS400_JOB_STAT_D 45OS400_JOB_STAT_M 45OS400_JOBGROUP 60OS400_MSG_STAT_D 46OS400_MSG_STAT_DV (View) 46OS400_MSG_STAT_M 46OS400_MSG_STAT_MV (View) 46OS400_PERF_SUM_D 57OS400_PERF_SUM_H 57OS400_PM_DISK_D 47OS400_PM_DISK_H 47OS400_PM_POOL_D 49OS400_PM_POOL_H 49OS400_PM_SYS_D 50OS400_PM_SYS_H 50OS400_PM_SYS_JGR_D 55OS400_PM_SYS_JGR_H 55
terms used in this book 131testing the installation 25transactions
number 74, 75, 76, 77, 78, 95rate 95
transfer of files to OS/390 3, 17trend reports
OS/400 Job Statistics all Systems, Daily Trend 74, 75OS/400 Job Statistics all Systems, Monthly Trend 74, 76OS/400 Perf CPU & Trans by Job Group, Hourly Trend 95OS/400 Perf CPU and RTM Statistics, Hourly Trend 87OS/400 Perf CPU by Job Group, Hourly Trend 97OS/400 Perf Disk Arm Movements, Hourly Trend 94OS/400 Perf Disk Capacity Statistics, Hourly Trend 92, 98OS/400 Perf Disk I/O Statistics, Hourly Trend 90, 97OS/400 Perf Exception and Lock Stat, Hourly Trend 89OS/400 Perf Max & Avg CPU Usage, Hourly Trend 103OS/400 Perf Paging Statistics, Hourly Trend 98OS/400 Perf Storage Pool & Act Level, Hourly Trend 100OS/400 Perf Summary for a System, Daily Trend 106OS/400 Perf Summary for a System, Hourly Trend 108OS/400 Perf Transition Statistics, Hourly Trend 102
Uupdating lookup tables 22use of this book, intended xvii
Vvariables, report 64view tables for message component 46
139AS/400 System Performance Feature Guide and Reference
Ind
ex
Wwait to ineligible, on system 102what you need to know to understand this book xviiwho should use this book xvii
140 Release 5

Program Number: 5695-101
Printed in Denmark by IBM Danmark A/S
SH19-4019-04


![Tivoli Workload Scheduler - IBMpublib.boulder.ibm.com/tividd/td/TWS/SH19-4557-00/ja_JA/PDF/SH19... · ^(,-vii \qNP]IT ..... vii \qNbF ..... vii](https://static.documents.pub/doc/80x56/5bb8a65f09d3f2931b8c6ca1/tivoli-workload-scheduler-vii-qnpit-vii-qnbf-vii.jpg)


