Asahi Broadcasting Corporation
Earnings Reference for the Third Quarter
(Cumulative) of FISCAL 2017(The fiscal year ending March 31, 2018)
February 7, 2018
Securities Code:9405
©ABC2018
Note:The following document is an English translation of the Japanese-language original.
©ABC20181
Consolidated Earnings
FY2017 3Q(Apr-Dec, 2017)
FY2016 3Q(Apr-Dec, 2016)
Growth % change
Net sales 60,813 61,982 △1,169 △1.9%
Operating income 2,800 3,306 △505 △15.3%
Ordinary income 3,081 3,578 △497 △13.9%
Profit attributable to owners of
parent1,879 2,312 △433 △18.7%
©ABC20182
Consolidated Net Sales in the Past 5 Years
Full year3rd quarter (Apr-Dec)
61,055 60,559 60,462 61,892 60,813
81,484 80,691 81,059 82,302
0
10,000
20,000
30,000
40,000
50,000
60,000
70,000
80,000
90,000
2013 2014 2015 2016 2017 (FY)
©ABC2018
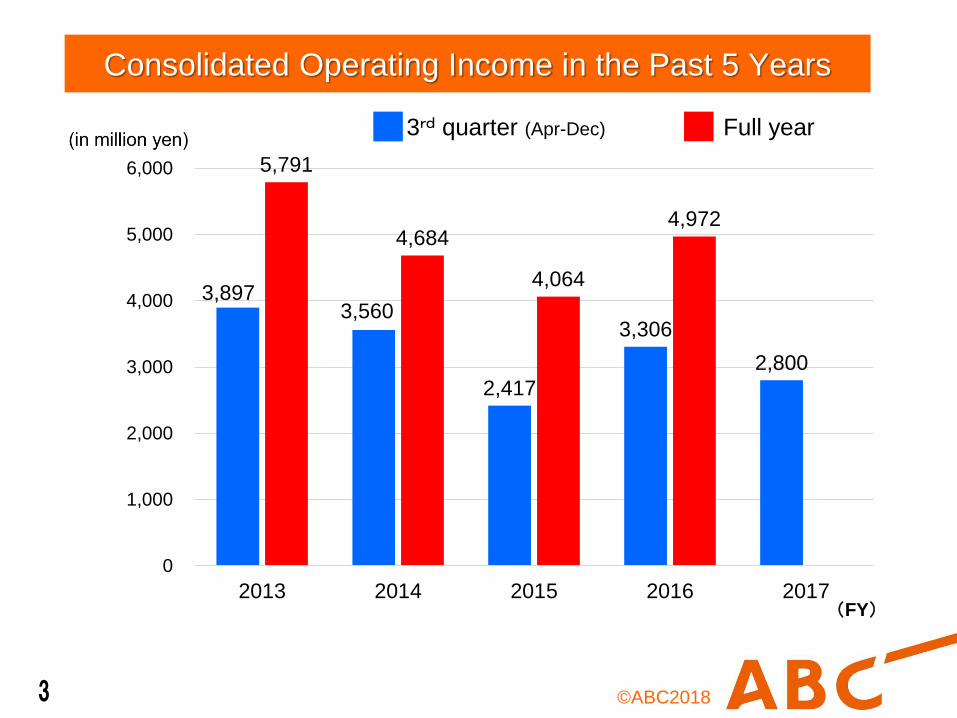
Consolidated Operating Income in the Past 5 Years
3
Full year
3,897 3,560
2,417
3,306
2,800
5,791
4,684
4,064
4,972
0
1,000
2,000
3,000
4,000
5,000
6,000
2013 2014 2015 2016 2017(FY)
3rd quarter (Apr-Dec)
©ABC20184
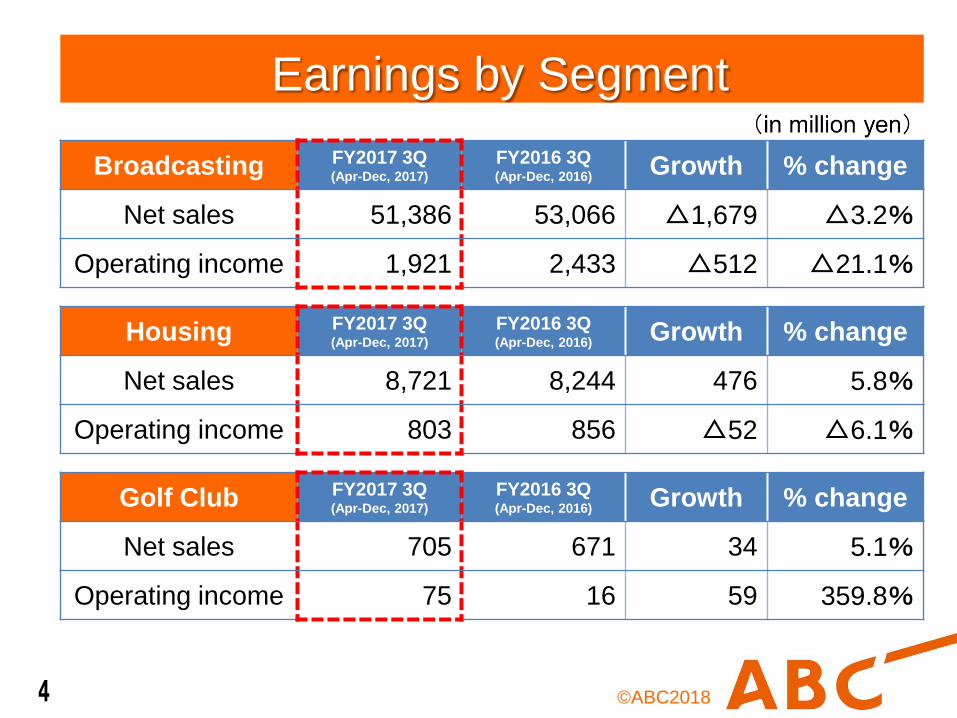
Earnings by Segment
Broadcasting FY2017 3Q(Apr-Dec, 2017)
FY2016 3Q(Apr-Dec, 2016)
Growth % change
Net sales 51,386 53,066 △1,679 △3.2%
Operating income 1,921 2,433 △512 △21.1%
Housing FY2017 3Q(Apr-Dec, 2017)
FY2016 3Q(Apr-Dec, 2016) Growth % change
Net sales 8,721 8,244 476 5.8%
Operating income 803 856 △52 △6.1%
Golf Club FY2017 3Q(Apr-Dec, 2017)
FY2016 3Q(Apr-Dec, 2016)
Growth % change
Net sales 705 671 34 5.1%
Operating income 75 16 59 359.8%
©ABC20185
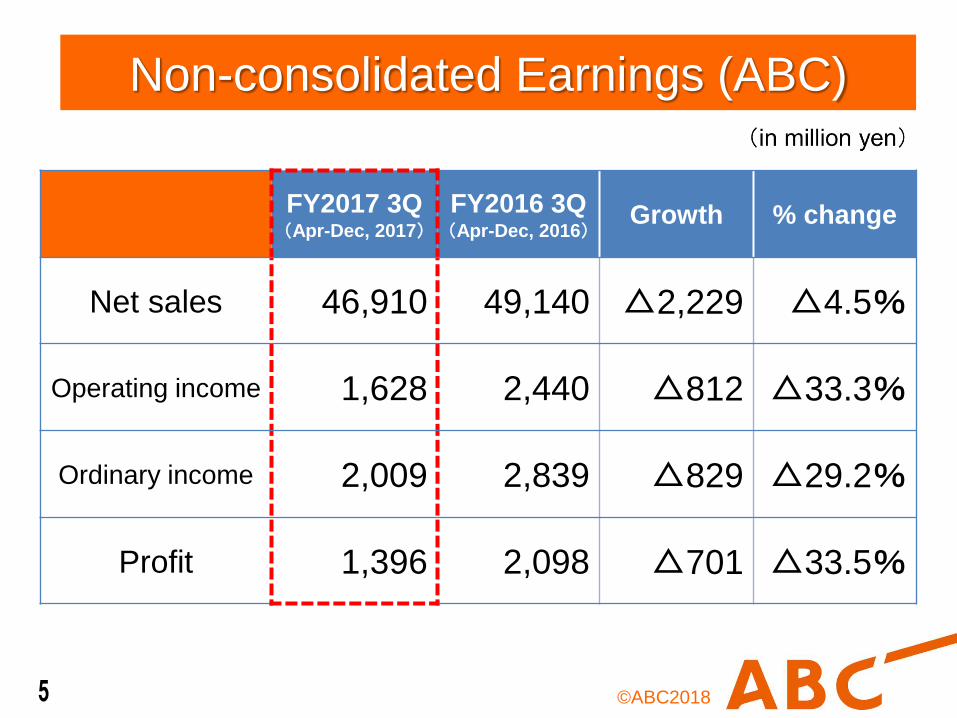
Non-consolidated Earnings (ABC)
FY2017 3Q(Apr-Dec, 2017)
FY2016 3Q(Apr-Dec, 2016)
Growth % change
Net sales 46,910 49,140 △2,229 △4.5%
Operating income 1,628 2,440 △812 △33.3%
Ordinary income 2,009 2,839 △829 △29.2%
Profit 1,396 2,098 △701 △33.5%
©ABC20186
FY2017 3Q(Apr-Dec, 2017)
FY2016 3Q(Apr-Dec, 2016)
Growth % change
Television broadcasting
business revenue42,630 43,608 △977 △2.2%
Time
Network time
advertising
revenue10,306 11,142 △836 △7.5%
Local time
advertising
revenue4,500 4,277 223 5.2%
Spot sales revenue 26,157 26,482 △325 △1.2%
Program sales revenue 1,666 1,706 △39 △2.3%
Television Broadcasting Business Revenue(Terrestrial broadcast)
<Revenue>
Breakdowns
©ABC2018
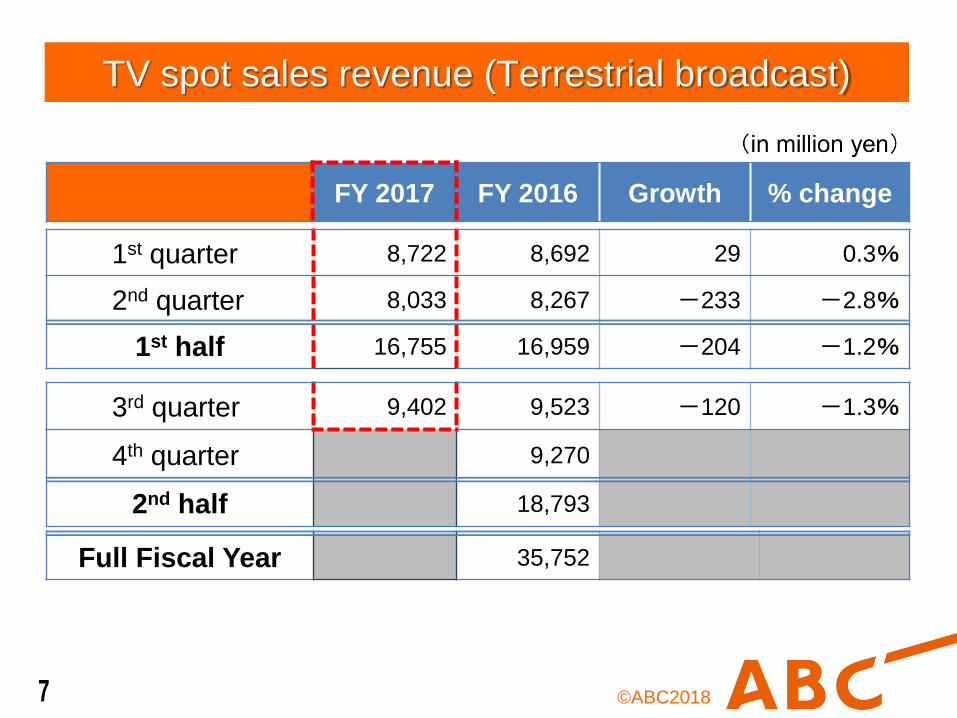
TV spot sales revenue (Terrestrial broadcast)
7
FY 2017 FY 2016 Growth % change
1st quarter 8,722 8,692 29 0.3%
2nd quarter 8,033 8,267 -233 -2.8%
1st half 16,755 16,959 -204 -1.2%
3rd quarter 9,402 9,523 -120 -1.3%
4th quarter 9,270
2nd half 18,793
Full Fiscal Year 35,752
©ABC2018
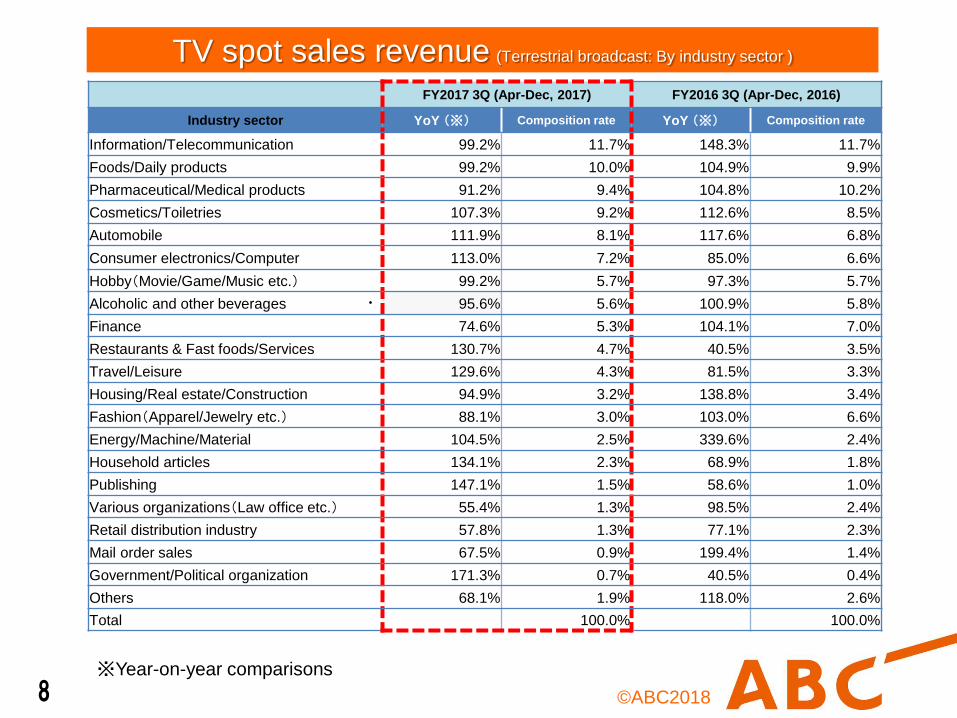
TV spot sales revenue (Terrestrial broadcast: By industry sector )
8※Year-on-year comparisons
FY2017 3Q (Apr-Dec, 2017) FY2016 3Q (Apr-Dec, 2016)
Industry sector YoY (※) Composition rate YoY (※) Composition rate
Information/Telecommunication 99.2% 11.7% 148.3% 11.7%
Foods/Daily products 99.2% 10.0% 104.9% 9.9%
Pharmaceutical/Medical products 91.2% 9.4% 104.8% 10.2%
Cosmetics/Toiletries 107.3% 9.2% 112.6% 8.5%
Automobile 111.9% 8.1% 117.6% 6.8%
Consumer electronics/Computer 113.0% 7.2% 85.0% 6.6%
Hobby(Movie/Game/Music etc.) 99.2% 5.7% 97.3% 5.7%
Alcoholic and other beverages 95.6% 5.6% 100.9% 5.8%
Finance 74.6% 5.3% 104.1% 7.0%
Restaurants & Fast foods/Services 130.7% 4.7% 40.5% 3.5%
Travel/Leisure 129.6% 4.3% 81.5% 3.3%
Housing/Real estate/Construction 94.9% 3.2% 138.8% 3.4%
Fashion(Apparel/Jewelry etc.) 88.1% 3.0% 103.0% 6.6%
Energy/Machine/Material 104.5% 2.5% 339.6% 2.4%
Household articles 134.1% 2.3% 68.9% 1.8%
Publishing 147.1% 1.5% 58.6% 1.0%
Various organizations(Law office etc.) 55.4% 1.3% 98.5% 2.4%
Retail distribution industry 57.8% 1.3% 77.1% 2.3%
Mail order sales 67.5% 0.9% 199.4% 1.4%
Government/Political organization 171.3% 0.7% 40.5% 0.4%
Others 68.1% 1.9% 118.0% 2.6%
Total 100.0% 100.0%
©ABC20189
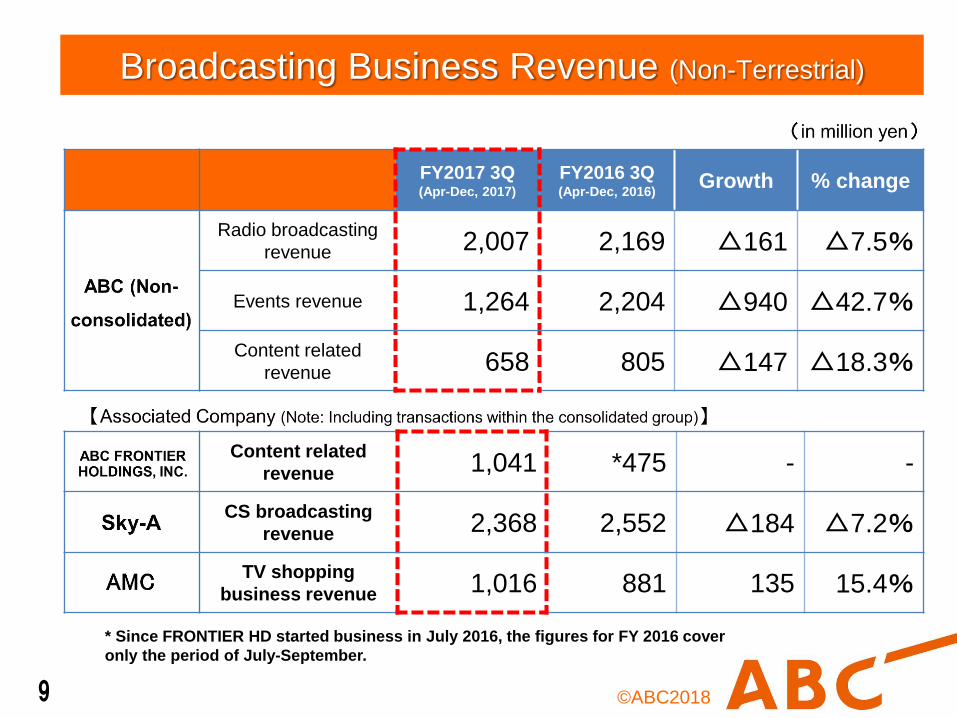
FY2017 3Q(Apr-Dec, 2017)
FY2016 3Q(Apr-Dec, 2016)
Growth % change
Radio broadcasting
revenue 2,007 2,169 △161 △7.5%
Events revenue 1,264 2,204 △940 △42.7%
Content related
revenue 658 805 △147 △18.3%
Content related
revenue 1,041 *475 - -
CS broadcasting
revenue 2,368 2,552 △184 △7.2%
TV shopping
business revenue 1,016 881 135 15.4%
Broadcasting Business Revenue (Non-Terrestrial)
* Since FRONTIER HD started business in July 2016, the figures for FY 2016 cover
only the period of July-September.
©ABC201810
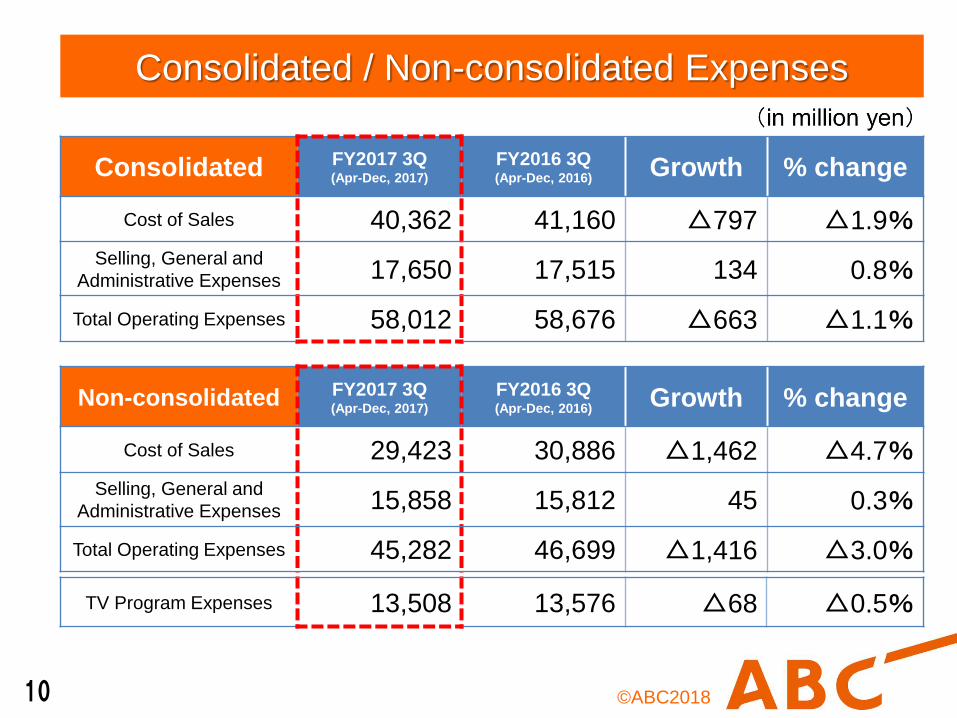
Consolidated / Non-consolidated Expenses
Non-consolidated FY2017 3Q(Apr-Dec, 2017)
FY2016 3Q(Apr-Dec, 2016)
Growth % change
Cost of Sales 29,423 30,886 △1,462 △4.7%
Selling, General and
Administrative Expenses 15,858 15,812 45 0.3%
Total Operating Expenses 45,282 46,699 △1,416 △3.0%
TV Program Expenses 13,508 13,576 △68 △0.5%
Consolidated FY2017 3Q(Apr-Dec, 2017)
FY2016 3Q(Apr-Dec, 2016)
Growth % change
Cost of Sales 40,362 41,160 △797 △1.9%
Selling, General and
Administrative Expenses 17,650 17,515 134 0.8%
Total Operating Expenses 58,012 58,676 △663 △1.1%
©ABC201811
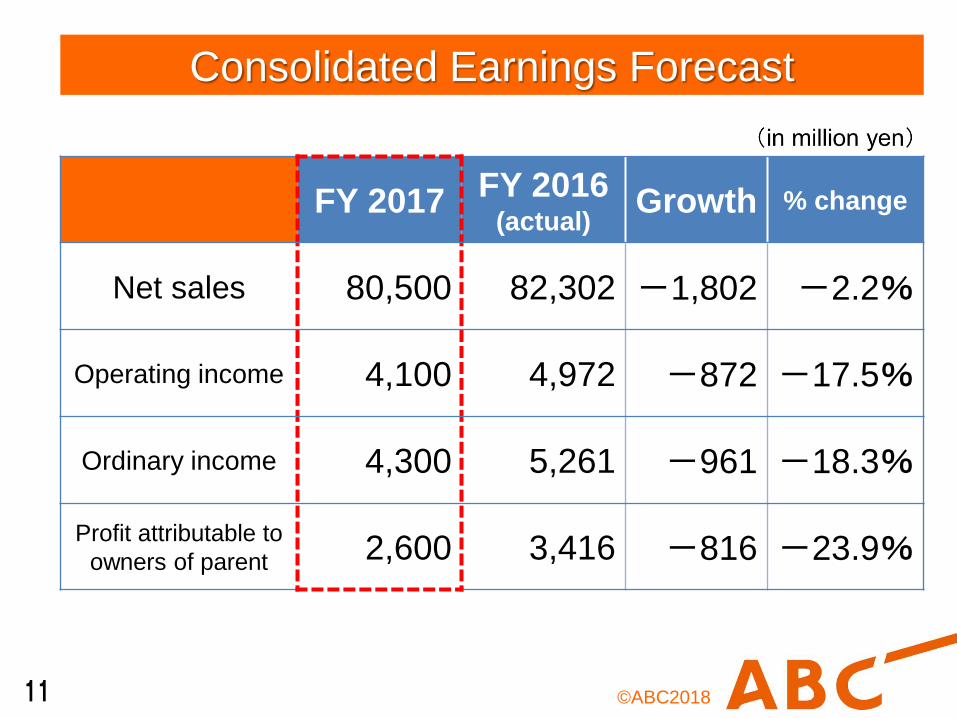
Consolidated Earnings Forecast
FY 2017 FY 2016(actual)
Growth % change
Net sales 80,500 82,302 -1,802 -2.2%
Operating income 4,100 4,972 -872 -17.5%
Ordinary income 4,300 5,261 -961 -18.3%
Profit attributable to
owners of parent 2,600 3,416 -816 -23.9%
©ABC201812
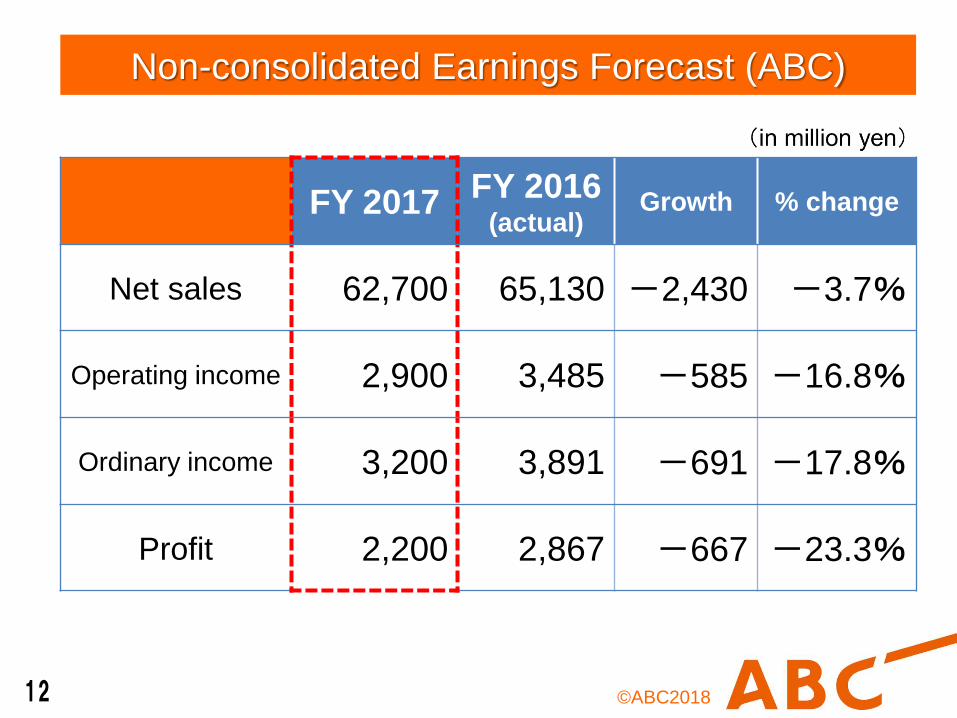
Non-consolidated Earnings Forecast (ABC)
FY 2017 FY 2016(actual)
Growth % change
Net sales 62,700 65,130 -2,430 -3.7%
Operating income 2,900 3,485 -585 -16.8%
Ordinary income 3,200 3,891 -691 -17.8%
Profit 2,200 2,867 -667 -23.3%
©ABC201813
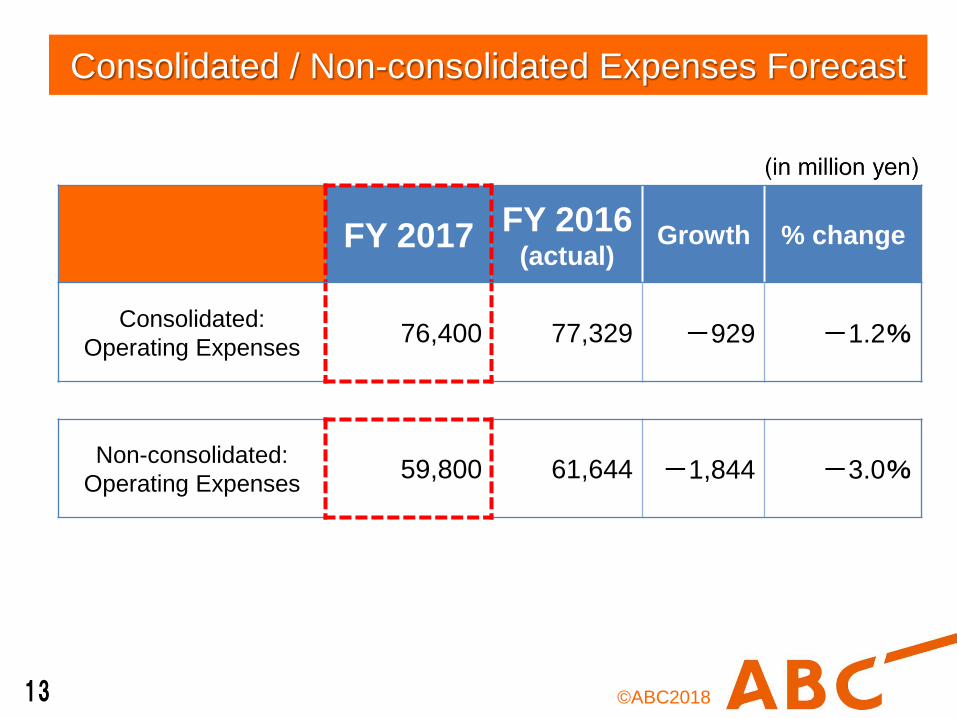
Consolidated / Non-consolidated Expenses Forecast
FY 2017 FY 2016(actual)
Growth % change
Consolidated:
Operating Expenses76,400 77,329 -929 -1.2%
Non-consolidated:
Operating Expenses59,800 61,644 -1,844 -3.0%
©ABC2018
Television Viewer Ratings for April-December 2017 (Kansai region)
14
All-day
(6:00-24:00)Golden time
(19:00-22:00)Prime
(19:00-23:00)Prime 2
(23:00-25:00)
1YTV
8.0
YTV
12.0
YTV
12.0
ABC
7.7
2ABC
7.4
ABC・MBS
10.6
ABC
11.1
YTV
7.5
3MBS
7.3
******
MBS
10.7
MBS
5.8
4KTV
7.2
NHK
10.1
KTV
9.7
KTV
5.4
5NHK
5.6
KTV
9.8
NHK
8.8
NHK
2.7
©ABC2018
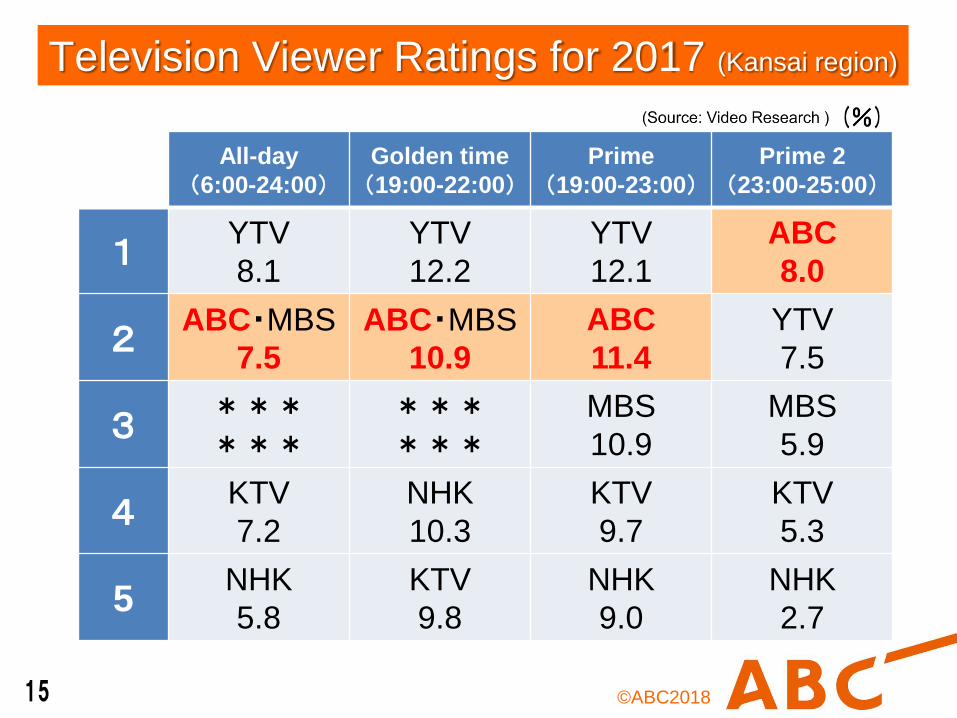
Television Viewer Ratings for 2017 (Kansai region)
15
All-day
(6:00-24:00)Golden time
(19:00-22:00)Prime
(19:00-23:00)Prime 2
(23:00-25:00)
1YTV
8.1
YTV
12.2
YTV
12.1
ABC
8.0
2ABC・MBS
7.5
ABC・MBS
10.9
ABC
11.4
YTV
7.5
3******
******
MBS
10.9
MBS
5.9
4KTV
7.2
NHK
10.3
KTV
9.7
KTV
5.3
5NHK
5.8
KTV
9.8
NHK
9.0
NHK
2.7
©ABC2018
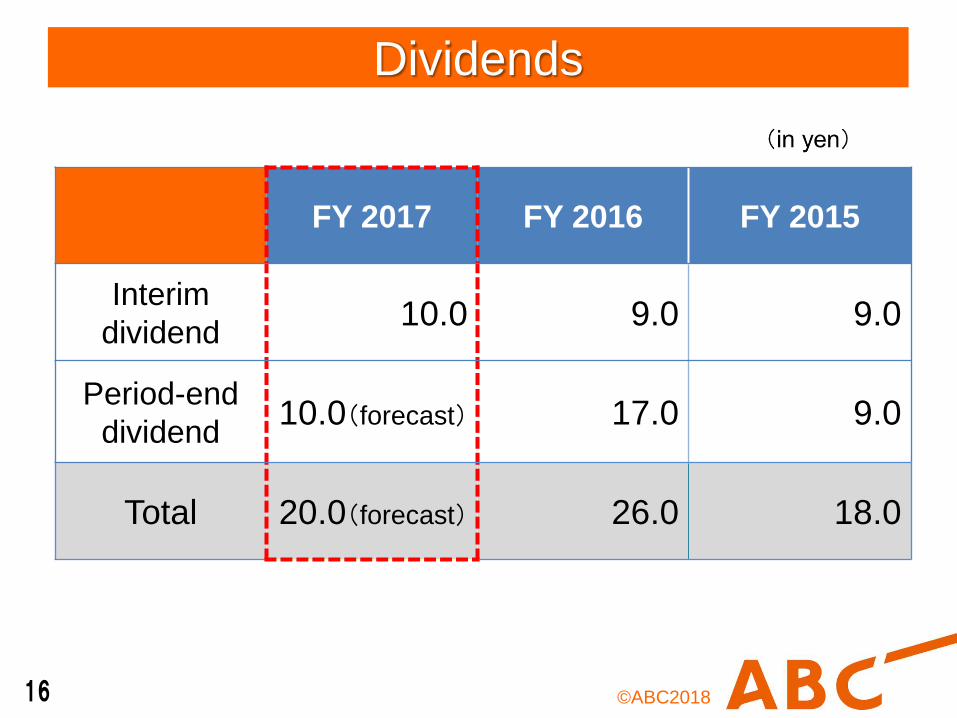
Dividends
16
FY 2017 FY 2016 FY 2015
Interim
dividend10.0 9.0 9.0
Period-end
dividend10.0(forecast) 17.0 9.0
Total 20.0(forecast) 26.0 18.0
©ABC2018
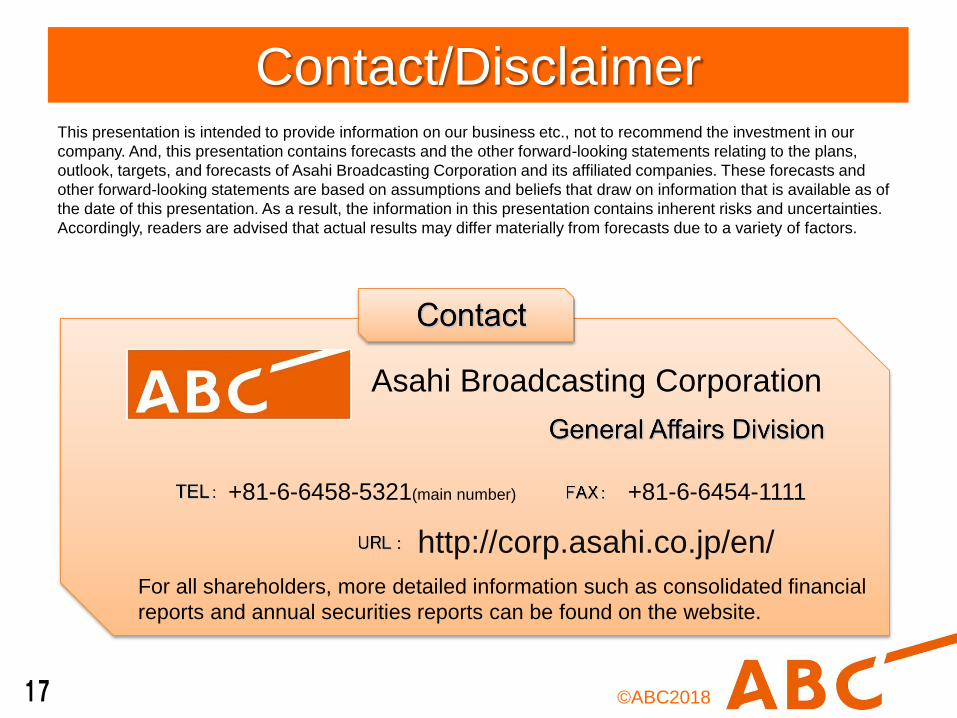
Contact/DisclaimerThis presentation is intended to provide information on our business etc., not to recommend the investment in our
company. And, this presentation contains forecasts and the other forward-looking statements relating to the plans,
outlook, targets, and forecasts of Asahi Broadcasting Corporation and its affiliated companies. These forecasts and
other forward-looking statements are based on assumptions and beliefs that draw on information that is available as of
the date of this presentation. As a result, the information in this presentation contains inherent risks and uncertainties.
Accordingly, readers are advised that actual results may differ materially from forecasts due to a variety of factors.
Asahi Broadcasting Corporation
+81-6-6458-5321(main number) +81-6-6454-1111
http://corp.asahi.co.jp/en/
For all shareholders, more detailed information such as consolidated financial
reports and annual securities reports can be found on the website.
17