Settlement of the Kansai International Airport IslandsG. Mesri, M.ASCE1; and J. R. Funk, S.M.ASCE2
Abstract: The Kansai International Airport was constructed in Osaka Bay in 18- to 20-m-deep seawater to avoid noise pollution and landacquisition disputes. Construction of the 511-ha Island I began in 1987 and Runway I began operation in 1994. Construction of the 545-haIsland II began in 1999, and Runway II began operation in 2007. Using more than 2.2 million vertical sand drains fully penetrating into the17.3- to 24.1-m-thick Holocene clay layer and 430 million cubic meters of fill material, the project is viewed as an engineering marvel. Onthe basis of a detailed review of the geology of Osaka Bay, construction of the Airport Islands, and the permeability and compressibility oftheHolocene and Pleistocene subseabed deposits that reached a depth of 400m below the seafloor at theKansai Airport site, settlement analyseswere conducted assuming the uniqueness of end-of-primary void ratio–effective vertical stress relationship and the Ca=Cc law of compress-ibility. Airport Island I has already settled below the 4-m above sea level surface elevation required by the design specification, and the surfaceelevation of Island II is predicted to be 4 m above sea level by 2023–2036. Airport Islands I and II will be at sea level, respectively, by 2067 orsooner and by 2058–2100. By the end of the 21st century, Island I and Island II are predicted to settle, respectively, 17.6 and 24.4 m. DOI:10.1061/(ASCE)GT.1943-5606.0001224. This work is made available under the terms of the Creative Commons Attribution 4.0 Internationallicense, http://creativecommons.org/licenses/by/4.0/.
Author keywords: Kansai Airport; Osaka Bay; Offshore reclamation; Holocene and Pleistocene clay deposits; Pleistocene sand deposits;Primary and secondary settlements.
Introduction
Japan’s extensive reclamation history stems from a need for addi-tional land in coastal areas (Mikasa and Ohnishi 1981; Sasaki et al.1987). Reclamation has taken place in Osaka Bay at least as early asthe Edo era (1600–1867), when it was used for rice cultivation.
The Kansai International Airport was constructed 5 km off thecoast of Senshu in 18- to 20-m-deep seawater to avoid noise pol-lution and land-acquisition disputes that were experienced at theItami andNarita airports. Construction of Island I began in 1987, andRunway I began operation in 1994. Construction of Island II beganin 1999, andRunway II began operation in 2007 [Nakase 1987; NewKansai International Airport Company (NKIAC) 2012].
As a part of the original design considerations, the surface ele-vation of the Kansai Airport islands were to remain above 14-mchart datum level (CDL) to avoid the erosive action of wavesovertopping the seawall (Arai 1991). As of December 2012, theaverage seabed settlement has exceeded 12.9 and 14.2 m, re-spectively, for Airport Islands I and II (NKIAC 2012).
The Kansai Airport project has received considerable attention inthe geotechnical engineering literature in part because of the scale ofthe project; Island I is 511 ha in approximately 18-m-deep seawaterand Island II is 545 ha in approximately 20-m-deep seawater. Theproject is also significant because of the sufficiently detailed sub-seabed information and observations of settlement and pore-water
pressure reaching depths up to 350 m below the seabed. The pro-jected or observed consolidation behavior of the subseabed has beenused in an ongoing debate on the uniqueness (Mesri and Choi 1985b;Mesri et al. 1995) of the end of primary (EOP) void ratio–effectivevertical stress relationship of clay and silt deposits. Hight andLeroueil (2003) claimed that the Kansai reclamation project con-firms that, under a given effective stress, the in situ strain, and thussettlement, is larger than that deduced from laboratory tests, thusconcluding that a settlement analysis based on the assumption ofuniquenesswill lead to an underestimate of settlement resulting fromprimary consolidation. Rocchi et al. (2006), attributing observationsin the Osaka Bay to an unusual settlement behavior of clays, statedthat the field behavior of Osaka clays at these two sites demonstratesthat primary compression settlements predicted by conventionalinterpretation of oedometer tests may be substantially lower thanobserved, casting doubt on the uniqueness of the EOP void ratio–effective stress relationship, which is found to provide reliablepredictions only under special circumstances.
Mimura and Jang (2005) proposed that the phenomenon takingplace because of the reclamation project is far from the conventionalconcept of consolidation in which deformation is primarily causedby dissipation of excess pore-water pressure. Imai et al. (2005)highlighted the confusion in connection to consolidation behavior ofOsaka Bay Pleistocene clays by stating that “The most shockingfinding is that a large compression endlessly takes place for [a] longtime even when an applied load is smaller than pc [preconsolidationpressure]. Why does such abnormal behavior take place?” Inconnection to modeling of consolidation characteristics of clays forsettlement prediction of Kansai International Airport, Kobayashiet al. (2005) reported compression of a specimen of Ma3 claysubjected to a consolidation pressure in the recompression range,commenting that settlement continued “without showing a tendencyof decreasing coefficient of secondary compression. . . . No definiteanswer for such large settlement under the overburden pressure canbe given and this point needs more investigation in the future.”
In this paper, detailed settlement analyses are reported for theKansai Airport islands, based on the assumption of the uniqueness of
1Ralph B. Peck Professor of Civil Engineering, Dept. of Civil andEnvironmental Engineering, Univ. of Illinois at Urbana–Champaign,Urbana, IL 61801 (corresponding author). E-mail: [email protected]
the EOP e-sv9 relationship of Holocene and Pleistocene Osaka Bayclays, together with theCa=Cc law of compressibility for evaluatingsecondary compression and associated settlements (Funk 2013).
Geology of Osaka Bay
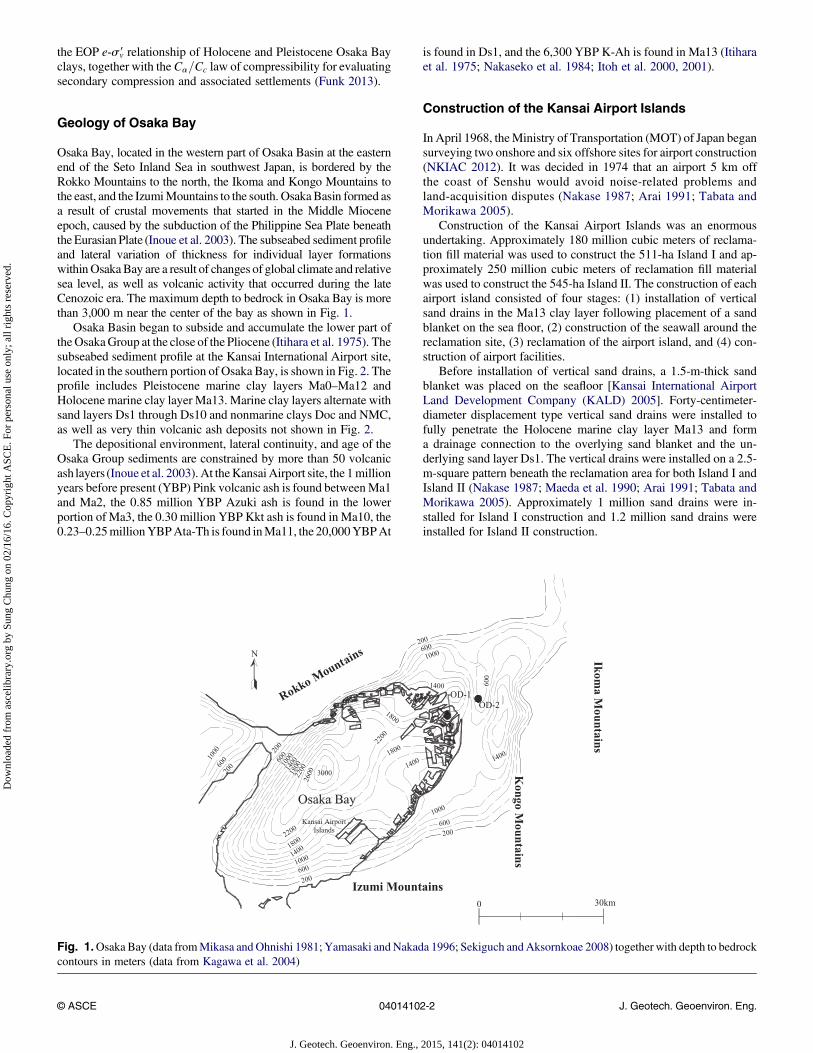
Osaka Bay, located in the western part of Osaka Basin at the easternend of the Seto Inland Sea in southwest Japan, is bordered by theRokko Mountains to the north, the Ikoma and Kongo Mountains tothe east, and the IzumiMountains to the south. OsakaBasin formed asa result of crustal movements that started in the Middle Mioceneepoch, caused by the subduction of the Philippine Sea Plate beneaththe Eurasian Plate (Inoue et al. 2003). The subseabed sediment profileand lateral variation of thickness for individual layer formationswithinOsakaBay are a result of changes of global climate and relativesea level, as well as volcanic activity that occurred during the lateCenozoic era. The maximum depth to bedrock in Osaka Bay is morethan 3,000 m near the center of the bay as shown in Fig. 1.
Osaka Basin began to subside and accumulate the lower part oftheOsakaGroup at the close of the Pliocene (Itihara et al. 1975). Thesubseabed sediment profile at the Kansai International Airport site,located in the southern portion of Osaka Bay, is shown in Fig. 2. Theprofile includes Pleistocene marine clay layers Ma0–Ma12 andHolocene marine clay layer Ma13. Marine clay layers alternate withsand layers Ds1 through Ds10 and nonmarine clays Doc and NMC,as well as very thin volcanic ash deposits not shown in Fig. 2.
The depositional environment, lateral continuity, and age of theOsaka Group sediments are constrained by more than 50 volcanicash layers (Inoue et al. 2003). At theKansai Airport site, the 1millionyears before present (YBP) Pink volcanic ash is found betweenMa1and Ma2, the 0.85 million YBP Azuki ash is found in the lowerportion of Ma3, the 0.30 million YBP Kkt ash is found in Ma10, the0.23–0.25millionYBPAta-Th is found inMa11, the 20,000YBPAt
is found in Ds1, and the 6,300 YBP K-Ah is found in Ma13 (Itiharaet al. 1975; Nakaseko et al. 1984; Itoh et al. 2000, 2001).
Construction of the Kansai Airport Islands
In April 1968, theMinistry of Transportation (MOT) of Japan begansurveying two onshore and six offshore sites for airport construction(NKIAC 2012). It was decided in 1974 that an airport 5 km offthe coast of Senshu would avoid noise-related problems andland-acquisition disputes (Nakase 1987; Arai 1991; Tabata andMorikawa 2005).
Construction of the Kansai Airport Islands was an enormousundertaking. Approximately 180 million cubic meters of reclama-tion fill material was used to construct the 511-ha Island I and ap-proximately 250 million cubic meters of reclamation fill materialwas used to construct the 545-ha Island II. The construction of eachairport island consisted of four stages: (1) installation of verticalsand drains in the Ma13 clay layer following placement of a sandblanket on the sea floor, (2) construction of the seawall around thereclamation site, (3) reclamation of the airport island, and (4) con-struction of airport facilities.
Before installation of vertical sand drains, a 1.5-m-thick sandblanket was placed on the seafloor [Kansai International AirportLand Development Company (KALD) 2005]. Forty-centimeter-diameter displacement type vertical sand drains were installed tofully penetrate the Holocene marine clay layer Ma13 and forma drainage connection to the overlying sand blanket and the un-derlying sand layer Ds1. The vertical drains were installed on a 2.5-m-square pattern beneath the reclamation area for both Island I andIsland II (Nakase 1987; Maeda et al. 1990; Arai 1991; Tabata andMorikawa 2005). Approximately 1 million sand drains were in-stalled for Island I construction and 1.2 million sand drains wereinstalled for Island II construction.
Fig. 1.Osaka Bay (data fromMikasa andOhnishi 1981; Yamasaki andNakada 1996; Sekiguch andAksornkoae 2008) together with depth to bedrockcontours in meters (data from Kagawa et al. 2004)
J. Geotech. Geoenviron. Eng., 2015, 141(2): 04014102
Dow
nloa
ded
from
asc
elib
rary
.org
by
Sung
Chu
ng o
n 02
/16/
16. C
opyr
ight
ASC
E. F
or p
erso
nal u
se o
nly;
all
righ
ts r
eser
ved.
The reclamation fill with a maximum particle size of 300 mm(Tabata and Morikawa 2005; Furudoi 2010) was obtained fromMisaki, Kada, Tsuna, and Sumoto, located 10–30 km from theKansai Airport site. The total unit weight of reclamation fill abovewater was in the range of 19:6e22:8 kN=m3, and submerged unitweight of fill below water was in the range of 11:8e12:4 kN=m3
(Arai 1991; Endo et al. 1991; Yamane et al. 2003; KALD 2005;Tabata and Morikawa 2005; Funk 2013).
Nakase (1987) reported the planned height of reclamation fillabove the seafloor to be 30 m for Island I. Arai (1991) reported thatfill height was increased to 33 m to accommodate settlementforecasts, and Nishimura (N. Nishimura, personal communication,2011) reported the final height of reclamation fill above seafloor forIsland I to be 36.7 m. For Island II, the height of reclamation fillabove seafloor was reported by Shinohara (2003) to be 40–43 m andby Tabata and Morikawa (2005) and Furudoi (2010) as “more than40 m.”
The present settlement analyses were carried out for five loca-tions on the airport islands, where detailed settlement and pore-waterpressure observations were available. The load applied to the sea
floor by the reclamation process has previously been either com-puted using the unit weight and thickness of the fill, taking intoaccount the submergence effect (Shibata and Karube 2005;Kobayashi et al. 2005; Tabata and Morikawa 2005; Furudoi andKobayashi 2009; Furudoi 2010; N. Nishimura, personal commu-nication, 2011), or load cell measurements at the seafloor (Tabataand Morikawa 2005; Kobayashi et al. 2005; Furudoi 2010; N.Nishimura, personal communication, 2011). The reported seafloorreclamation loads are shown subsequently together with settlementand pore-water pressure observation and present predictions. Al-though the load cell measurements for MP2-II are relatively con-sistent, reaching a maximum value equal to 540 kPa, the load cellmeasurements for MP1-II were 485 kPa measured by Load Cell 1and 640 kPa measured by Load Cell 2 in April 2008.
The decrease in reclamation load associated with settlementand the resulting submergence of reclamation fill below sea levelare important considerations for settlement analyses of KansaiAirport because of the large seabed settlements. The reportedreclamation loads, however, reach relatively constant values duringthe period of observation. According to M. Kobayashi (personal
Fig. 2. (a) Subseabed profile at the Kansai International Airport site (10:1 vertical to horizontal exaggeration); (b) subseabed profile at the KansaiInternational Airport site (10:1 vertical to horizontal exaggeration)
J. Geotech. Geoenviron. Eng., 2015, 141(2): 04014102
Dow
nloa
ded
from
asc
elib
rary
.org
by
Sung
Chu
ng o
n 02
/16/
16. C
opyr
ight
ASC
E. F
or p
erso
nal u
se o
nly;
all
righ
ts r
eser
ved.
communication, 2007), the reported reclamation loads reach a con-stant value because reclamation fill was added in small steps evenafter the main reclamation was completed. This is evidenced by theload cell measurements between July 2004 and January 2010 atMP1-II. However, in the present settlement analyses, subsequent toJanuary 2010, the reclamation load at the seafloor was reduced withtime according to the submergence effect of airport settlement.
Calculated reclamation load at seafloor versus time reported byFurudoi and Kobayashi (2009), Furudoi (2010), and Shibata andKarube (2005) was used in the present settlement analyses at CT,K-I, and MP1-I, respectively. The average of the reported load cellmeasurements versus time at the seafloor was used for the presentsettlement analyses at MP1-II and MP2-II.
Permeability and Compressibility of SubseabedDeposits at the Kansai Airport Site
The initial subseabed investigation for the Kansai InternationalAirport project began in 1977. Sixty-three borings were made toseabed depths ranging from 100 to 200 m, and two borings, one onthe offshore side of Island I and one on the sea side of Island II, were
made to a seabed depth of 400 m. Four additional 400-m-deepborings were made in 1994 and 1995 (Nakase 1987; Tabata andMorikawa 2005; Furudoi and Kobayashi 2009).
The subseabed stratigraphy across the Kansai Airport site, shownin Fig. 2, was constructed based on borehole data reported in theliterature (Arai 1991; Akai and Tanaka 1999; Tanaka and Locat1999; Itoh et al. 2001; Tanaka et al. 2004; Imai et al. 2005; Mimuraand Jang 2005; Furudoi and Kobayashi 2009; Furudoi 2010). Theseawater depth, referenced to CDL, increases gradually with dis-tance from the shoreline and is approximately 17.0 m at the onshoreside of Island I, 20.0 m at the offshore side of Island II, and 21.5 minto Osaka Bay, approximately 1 km from the offshore side of IslandII (Arai 1991; Kanda et al. 1991; Akai and Tanaka 1999; Tanaka andLocat 1999; Itoh et al. 2001; Tanaka et al. 2004; Imai et al. 2005).
Representative values of index properties, including naturalwater content, Atterberg limits, clay-size fraction, and activity, arelisted in Table 1. The water content and Atterberg limit values inTable 1 represent the average of all available data at the KansaiAirport site and are used for subsequent settlement analyses atMP1-Iand MP2-II. Values specific to MP1-II were used for subsequentsettlement analysis at MP1-II.
J. Geotech. Geoenviron. Eng., 2015, 141(2): 04014102
Dow
nloa
ded
from
asc
elib
rary
.org
by
Sung
Chu
ng o
n 02
/16/
16. C
opyr
ight
ASC
E. F
or p
erso
nal u
se o
nly;
all
righ
ts r
eser
ved.
The entire water content data for Ma13 and Ma10 are plotted inFig. 3. The data are shown with respect to the depth into the layer (z)divided by the prereclamation layer thickness (Lo) so that com-parisons can be made at various boreholes at the Kansai Airport site.Thiswas a practical and convenientway to subdivide themarine claylayers at the airport site, especially because the distance betweenboreholes (e.g., maximum distance of approximately 8.5 km) acrossthe site is relatively small for a marine depositional environment. Aplot of available data similar to Fig. 3 was prepared for all the 21Pleistocene clay layers from Dtc to NMC-5 listed in Table 1.
Permeability of Osaka Bay Sediments
The literature on Kansai Airport does not appear to include anypermeability data from direct permeability tests on Osaka Bay clayor sand layers.
For the present settlement analyses, the values of kvo for thePleistocene clay layers were computed using the Mesri et al. (1994)equation together with representative values of prereclamation voidratio (eo), clay-size fraction (CF), and activity (Ac 5 Ip=CF) inTable 1. Rocchi et al. (2006) compared permeability data for OsakaBay clays with kvo computed using the Mesri et al. (1994) equation,concluding that the empirical relationship provides a good fit to theexperimental data for Osaka clays. The values of kvo for Pleistoceneclays computed using the Mesri et al. (1994) equation are listed inTable 1.
The values of kvo for Ma13 clay sublayers, in the absence ofreliable data on CF, were based on permeability data determined byTanaka et al. (2003) by interpreting, using the Terzaghi theory ofconsolidation, compression rates observed in incremental loadingoedometer tests. However,Mesri et al. (1994) showed that the valuesof permeability computed from cv andmv typically underestimate kv
Table 1. Representative Values of Soil Properties for Each Sublayer
Layer Sublayer wo (%) wp (%) wl (%) Ip (%) CFa (%) Ac sp9=svo9 eo kvo (m=s) Ck
Note: Natural water content, Atterberg limits, and clay-size fraction values are the average of all available data at the Kansai Airport site and are used to computeeo and kvo for settlement analyses at MP1-I and MP2-II.aCF values for Ma13 represent percentage ,5mm.
J. Geotech. Geoenviron. Eng., 2015, 141(2): 04014102
Dow
nloa
ded
from
asc
elib
rary
.org
by
Sung
Chu
ng o
n 02
/16/
16. C
opyr
ight
ASC
E. F
or p
erso
nal u
se o
nly;
all
righ
ts r
eser
ved.
by a factor of 2. Therefore, the values of kvo forMa13 in Table 1wereobtained by increasing the Tanaka et al. (2003) data by a factor of 2.
Permeability is expected to decrease with the decrease in voidratio, and for clays, the e-log kv, with slope Ck 5De=Dlog k, iscommonly used (Tavenas et al. 1983;Mesri et al. 1994). The value ofCk for each sublayer listed in Table 1 was computed usingCk 5 0:5eo proposed by Tavenas et al. (1983) and confirmed byMesri et al. (1994). Tanaka et al. (2003) showed that Ck 5 0:5eo isalso applicable to Osaka Bay clays.
The sand layers in Osaka Bay play a significant role on the rate ofconsolidation of the clay layers and therefore on rate of settlement ofthe airport islands. Nakase (1987) listed the range of permeabilitiesfor Pleistocene sand layers as 1028 to 1025 m=s. Mimura and Jang(2005) attributed the existence of undissipated pore-water pressuresto low permeability and discontinuity of sand layers, considering thepermeability question unresolved. For a settlement analysis of IslandI, Mimura and Jang (2005) assumed Ds10 to be freely draining, Ds1to have a high permeability of 1022 m=s, and assigned permeabilityvalues in the range of 2:53 1027 to 4:53 1025 m=s to the re-maining sand layers. In settlement analyses of Kansai AirportIslands, Shibata and Karube (2005) assumed permeability valuesin the range of 13 1025 to 8:53 1025 m=s for the sand layers.Kobayashi et al. (2005), in terms of thickness and continuity,considered Ds1 and Ds10 to function as drainage layers.
The permeability of the Pleistocene sand layers was back-calculated for the present settlement analyses of Islands I and IIusing observed settlements and pore-water pressures. The sameILLICON procedure (Funk and Mesri 2014) to be described later,which was used for the long-term settlement analyses of thePleistocene clay layers, was used for the back-analyses. In bothback-analyses, to compute the permeability of the sand layers andlong-term settlement analyses, one-dimensional vertical compres-sion in clay layers and vertical and horizontal water flow in the claylayers were assumed. Horizontal flow in the sand layers was as-sumed. The horizontal drainage boundary is set at points where Dsv
from reclamation load and therefore uo9 is small (influence factor forthe vertical stress increase using the Boussinesq solution is less than0.001). Sand layers Ds1 and Ds10 were assumed to be freelydraining, and the back-analyses resulted in permeability of the re-maining sand layers in the range of 1027 to 1024 m=s (Funk 2013),
comparable to the range of values reported by Nakase (1987),Mimura and Jang (2005), and Shibata and Karube (2005).
Compressibility of Osaka Bay Clay Layers
The ILLICON procedure used here for settlement analyses of theKansai International Airport Islands is based on the assumption ofuniqueness of the EOP void ratio–effective vertical stress re-lationship and the Ca=Cc law of compressibility. For each sublayer,such as those in Table 1, an EOP e-logsv9 relationship and a singlevalue of Ca=Cc are required for settlement analysis. All publishedincremental loading and constant rate of deformation oedometer testdata were used to define compressibility of the clay layers at theKansai Airport site (Kanda et al. 1991; Tanaka et al. 2003, 2004;Tanaka 2005a, b; Furudoi and Kobayashi 2009). For the Pleistoceneclay samples from depths below the seafloor range of 60–400 m, thevalues of ɛvo, according to oedometer compression data, are in therange of 1.8–4.0%, suggesting a specimen quality designation of Bto C (Terzaghi et al. 1996).
Published data on eo, svo9 , Cr=Cc, sp9=svo9 , and the nonlineare-logsv9 relationship in the compression range beyondsp9were used toconstruct for each sublayer the EOP e-logsv9 relationship, which wasinput into the ILLICON computer program. The EOP e-logsv9 re-lationship of all clay layers starts at (eo, svo9 ) in the recompressionrange. The representative values of eo in Table 1 were calculated frompublishedwo data (Maeda et al. 1990; Akai and Tanaka 1999; TanakaandLocat 1999;Tanaka et al. 2003, 2004; Imai et al. 2005) andGs data(Akai and Tanaka 1999). Prereclamation hydrostatic pore-waterpressure from sea level was used to compute svo9 and to interpretpostreclamationpore-water pressuremeasurements. The values ofsvo9atMP2-II are shown in Fig. 4. The published total unit weight data forthe clay and sand layers were used to calculate svo and therefore svo9 .
The values ofsp9=svo9 for the clay layers at the Kansai Airport sitewere obtained from incremental loading (IL) and constant rate ofstrain (CRS) oedometer tests on undisturbed specimens. The valueofsp9 for IL tests was obtained using the EOP e-logsv9 relationship. Itis well established that the value of sp9 from CRS tests is a function ofthe imposed strain rate. Mesri and Feng (1986) recommended theEOP strain rate _ɛp to obtain the EOP e-logsv9 relationship from theCRS oedometer tests. For typical soft clay deposits, the value of _ɛp is
Fig. 3. Atterberg limits and natural water content for (a) Ma13; (b) Ma10
J. Geotech. Geoenviron. Eng., 2015, 141(2): 04014102
Dow
nloa
ded
from
asc
elib
rary
.org
by
Sung
Chu
ng o
n 02
/16/
16. C
opyr
ight
ASC
E. F
or p
erso
nal u
se o
nly;
all
righ
ts r
eser
ved.
2:73 1027 s21 (Mesri et al. 1994). The sp9=svo9 data for Osaka Bayclays include CRS tests with _ɛI 5 3:33 1026 s21 (Tanaka et al.2003; Tanaka 2005a, b) and _ɛI 5 1:63 1026 s21 (Watabe et al.2002). Therefore, the reported values of sp9=svo9 were reduced bya factor of 0.90 and 0.93, respectively, according to the empiricalequation by Mesri and Feng (1986).
The values of sp9=svo9 for Holocene Clay Layer Ma13 are shownin Fig. 5 together with vertical line segments indicating the valuesthat were used in the ILLICON settlement analyses. Similar plotswere prepared for all Pleistocene clay layers, with four examplesshown in Fig. 6. In Pleistocene clay layers, the values ofsp9=svo9 usedfor ILLICON analyses, listed in Table 1, ranged from 1.28 to 1.50.The preconsolidation pressure of Osaka Bay clays has mainlyresulted from aging including secondary compression and thixo-tropic hardening and, possibly, some carbonate cementation (Mesriand Choi 1979; Tsuchida 2005).
The compression of Osaka Bay clays beyond the preconsoli-dation pressure, from IL and CRS oedometer tests, was summarizedin terms of the secant compression indexCc9 versus logsv9=sp9, wheresv9 is the effective vertical stress for which Cc9 is defined (Mesri andChoi 1985a; Terzaghi et al. 1996, Fig. 16.6). The Cc9-logsv9=sp9 plotfor HoloceneMarine Clay Layer Ma13 and the Pleistocene clays areshown in Figs. 7 and 8, respectively.
The EOP e-logsv9 relationship for each sublayer listed in Table 1was constructed (Funk 2013) starting from point (eo, svo9 ) witha recompression curve defined by Cr=Cc 5 0:1, where Cc is thecompression index from sp9 to 2sp9, up to sp9, and then defining thenonlinear compression curve using four to six values of (Cc9, sv9=sp9).
The secondary compression ofOsakaBay clays following primaryconsolidation was defined using the Ca=Cc law of compressibility,which requires for each sublayer the EOP e-logsv9 relationship to-gether with Ca=Cc, where at any consolidation pressure sv9, Cc isa tangent compression index (Mesri andGodlewski 1977; Mesri andCastro 1987; Mesri 2001; Mesri and Ajlouni 2007). The values ofCa=Cc for Osaka Bay clays were determined from the published ILoedometer test data (Imai et al. 2005; Tanaka 2005a, b;Watabe et al.
2008; Funk 2013). A special procedure was also used to computeCa=Cc for 11 Pleistocene clay layers using long-term incrementalloading compression data by Tanaka (2005a, b). For each Pleisto-cene clay specimen, the EOP e-logsv9 curve and e-log t curves for twopressures in the recompression range were available. As is predictedby theCa=Cc law of compressibility, the e-log t curve for the pressurenear the preconsolidation pressure started with a small Ca pro-portional to the recompression index, rapidly increased to a maxi-mum proportional to the maximum Cc on the EOP e-logsv9 curve,and gradually decreased with time in accordance with the decrease inCc in the compression range. Therefore, the maximum Ca was usedtogether with the maximum Cc to define Ca=Cc. The values ofCa=Cc for 11 clay layers from Dtc to Ma2 were in the range of0.024–0.042, with an average value of 0.033, which is quite similarto the value from the published IL oedometer test data. The resultingvalue of Ca=Cc for each clay layer together with the EOP e-logsv9curve were used to construct e-logsv9 curves for t=tp . 1. Fourexamples for the laboratory specimens are shown in Fig. 9, whichalso includes secondary compression measurements by Tanaka(2005b) at two consolidation pressures in the recompression range.
For reclamation loading in Osaka Bay, secondary settlement isexpected to be a significant factor only for clay layers with a shortduration of primary consolidation (tp). This is only true for HoloceneMarine Clay Layer Ma13 because of the use of vertical drains and forPleistocene clay layers at great depth, e.g., Ma3 and lower in Fig. 2,where sv9 is in the recompression range (Fig. 4) and therefore tp issmall.
Settlement Analyses for the Kansai Airport Islands
The ILLICON computer program was rebuilt especially to accom-modate the sand layers at Osaka Bay as incompressible impededdrainage boundaries that discharge water in the horizontal direction.Detailed reclamation load history and settlement observations for theHolocene clay layer (Ma13) were available at Monitoring Point 1 ofIsland II (MP1-II), Monitoring Point 2 of Island II (MP2-II), the
Fig. 4.Vertical profile of preconstruction effective vertical stress (svo9 ),preconsolidation pressure (sp9), and maximum final effective verticalstress (svf9 ) at MP2-II
J. Geotech. Geoenviron. Eng., 2015, 141(2): 04014102
Dow
nloa
ded
from
asc
elib
rary
.org
by
Sung
Chu
ng o
n 02
/16/
16. C
opyr
ight
ASC
E. F
or p
erso
nal u
se o
nly;
all
righ
ts r
eser
ved.
Connecting Taxiway (CT), Point K of Island I (K-I), andMonitoringPoint 1 of Island I (MP1-I). Therefore, settlement analyses of theMa13 clay layer were carried out at these locations. Detailed set-tlement and pore-water pressure observations for the Pleistoceneclay layers were available at MP1-II, MP2-II, and MP1-I, andsettlement analyses at these locationswere carried out to include claylayers to a depth of up to 400 m below the seafloor.
ILLICON Computer Program
The ILLICON computer programwas rebuilt usingMicrosoft VisualStudio 2010 (Redmond, Washington) to facilitate settlement andpore-water pressure calculation for the Kansai International Airport.A user interface that provides graphical output was created asa Windows Form Application, and the computational core wascoded using Microsoft Visual C11. The current version ofILLICON, which is based on the Darcy flow equation, uniqueness ofEOP e-logsv9 relationship, and the Ca=Cc law of compressibility,retains all features listed in Mesri and Khan (2012).
The hydrodynamic equation used for the Holocene Ma13 claylayer with vertical water flow into the sand blanket overlying Ma13,as well as the sand layer Ds1 underlyingMa13 and radial water flowinto the vertical drain is
dedt
¼ 1gw
�1þ eo1þ e
�2�ð1þ eÞ
�kz∂2u9∂z2
þ ∂kz∂z
∂u9∂z
�2 kz
∂u9∂z
∂e∂z
�
þ 1þ egw
�kr
�1r∂u9∂r
þ ∂2u9∂r2
�þ ∂kr
∂r∂u9∂r
�
(1)
The hydrodynamic equation used for the Pleistocene clay layerswith vertical water flow into sand layers that are treated as impeded
Fig. 6. sp9=svo9 for Pleistocene marine clay layers Ma10, Ma9, Ma8, and Ma7 (symbols defined in Fig. 5)
J. Geotech. Geoenviron. Eng., 2015, 141(2): 04014102
Dow
nloa
ded
from
asc
elib
rary
.org
by
Sung
Chu
ng o
n 02
/16/
16. C
opyr
ight
ASC
E. F
or p
erso
nal u
se o
nly;
all
righ
ts r
eser
ved.
drainage boundaries and horizontal water flow within the consoli-dating clay layer is (Funk 2013)
dedt
¼ 1gw
�1þ eo1þ e
�2�ð1þ eÞ
�kz∂2u9∂z2
þ ∂kz∂z
∂u9∂z
�2 kz
∂u9∂z
∂e∂z
�
þ 1þ egw
�kx∂2u9∂x2
þ ∂kx∂x
∂u9∂x
�
(2)
Because the length to width ratio of Kansai Airport Island I andKansai Airport Island II is more than 3.5, the hydrodynamic equa-tion for the Pleistocene clay layers was developed assuming verticalwater flow plus horizontal water flow perpendicular to the length ofeach Airport Island (i.e., the x-direction).
The constitutive equation used in the ILLICON approach is(Mesri 2001)
∂e∂t
¼�∂e∂sv9
�t
∂sv9∂t
þ�∂e∂t
�sv9
(3)
The compressibility parameters ð∂e=∂sv9Þt and ð∂e=∂tÞsv9are eval-
uated assuming the uniqueness of the EOP e-sv9 relationship to-gether with the Ca=Cc law of compressibility (Funk 2013). The
explicit finite-difference approximation was used to solve the hy-drodynamic and constitutive equations together (Funk 2013).
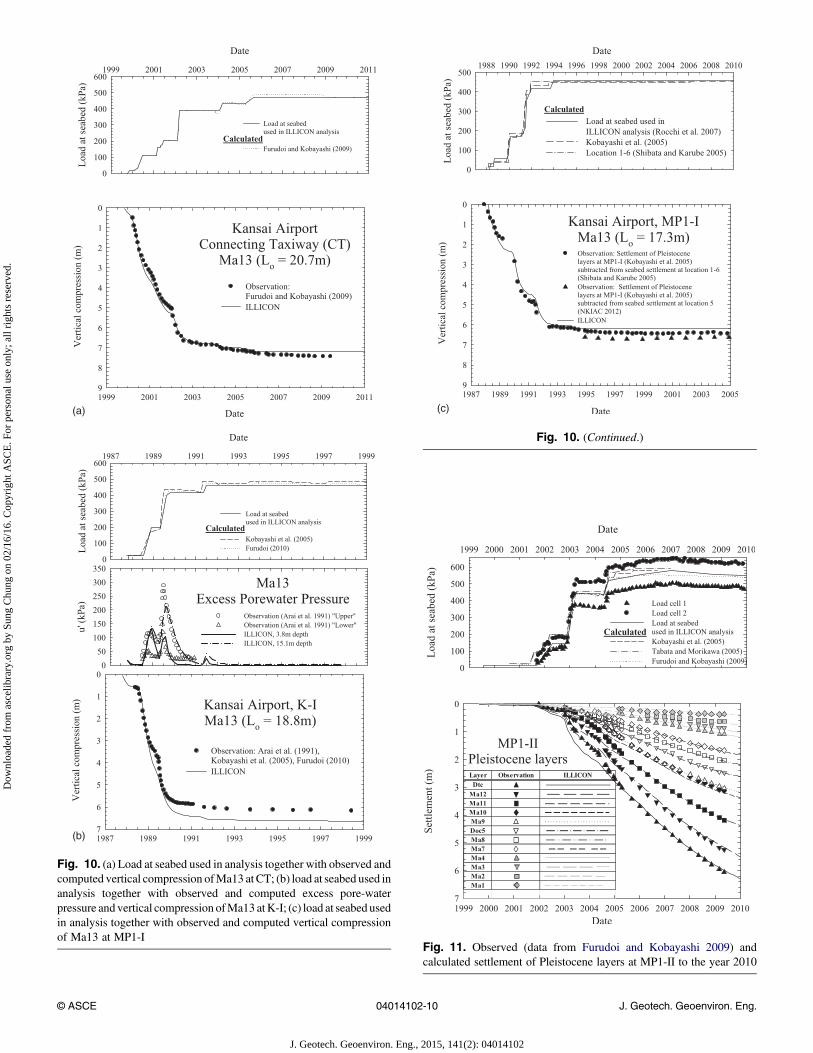
The compression of the Holocene Ma13 clay layer observed atCT,K-I, andMP1-I, togetherwith ILLICON predictions, is shown inFigs. 10(a–c), respectively [for MP1-II and MP2-II, see Funk(2013)]. The settlements of the Pleistocene clay layers observed atMP1-II, together with ILLICON predictions, are shown in Fig. 11.The excess pore-water pressure observations in the Pleistocene sandlayers at MP1-II, together with ILLICON predictions, are shown inFig. 12. The settlements of Pleistocene clay layers observed at MP1-I, together with ILLICON predictions, are shown in Fig. 13. Theexcess pore-water pressure observations in the Pleistocene sandlayers, togetherwith ILLICON predictions, are shown in Fig. 14. Thepore-water pressure increases in the Pleistocene sand layers throughredistribution from the reclamation of Airport Island II. This pore-water pressure redistribution is expected to somewhat slow downsettlement of Airport Island I, as suggested by the open and solidcircles in Fig. 13.
Interpretations of Field Observations Togetherwith ILLICON Predictions
Large settlements of the Kansai International Airport islands haveresulted from the large total thickness of Holocene plus Pleistocene
Fig. 9. e-logsv9 curves for t=tp . 1 for Pleistocene clay layer (a) Ma10, (b) Ma4, (c) Ma3, and (d) Ma2, constructed using the EOP e-logsv9 curvetogether with Ca=Cc; the data points are from the long-term IL compression measurements by Tanaka (2005b)
J. Geotech. Geoenviron. Eng., 2015, 141(2): 04014102
Dow
nloa
ded
from
asc
elib
rary
.org
by
Sung
Chu
ng o
n 02
/16/
16. C
opyr
ight
ASC
E. F
or p
erso
nal u
se o
nly;
all
righ
ts r
eser
ved.
Fig. 10. (a) Load at seabed used in analysis together with observed andcomputed vertical compression ofMa13 at CT; (b) load at seabed used inanalysis together with observed and computed excess pore-waterpressure and vertical compression ofMa13 atK-I; (c) load at seabed usedin analysis together with observed and computed vertical compressionof Ma13 at MP1-I
Fig. 10. (Continued.)
Fig. 11. Observed (data from Furudoi and Kobayashi 2009) andcalculated settlement of Pleistocene layers at MP1-II to the year 2010
J. Geotech. Geoenviron. Eng., 2015, 141(2): 04014102
Dow
nloa
ded
from
asc
elib
rary
.org
by
Sung
Chu
ng o
n 02
/16/
16. C
opyr
ight
ASC
E. F
or p
erso
nal u
se o
nly;
all
righ
ts r
eser
ved.
clay layers and large reclamation loads. According to the ILLICONanalyses shown in Fig. 15 andTable 2, by the end of the 21st century,MP1-II on Airport Island II will settle 24.4 m. Table 2 shows that atMP1-II a combined 185.3 m thickness of clay (Ma13 to Doc6) wasloaded to the compression range with maximum svf9 =sp9 in the rangeof 1.05–2.15, and a combined 102.0-m thickness of Pleistocene clay(Ma4 to NMC-5) was loaded to the recompression range withmaximumsvf9 =sp9 in the range of 0.83–1.01. The clay layersMa13to Doc6 contribute significant primary settlement, whereas Ma4to NMC-5 because of short duration of primary consolidation (tp)in the recompression range (together with rapid increase in Ca
with time near sp9) andMa13with small tp because of vertical sanddrains contribute significant secondary settlement. A similarbehavior is displayed in Fig. 16 for MP2-II and in Fig. 17 andTable 3 for MP1-I.
The comparison of observations of settlement and pore-waterpressure with those predicted by the ILLICON analyses suggestthat the phenomenon taking place at Osaka Bay because of theairport reclamation can be explained according to conventionalconcepts of primary compression followed by secondary com-pression (Mesri and Godlewski 1977, 1979; Mesri and Choi
1985a, b; Mesri et al. 1994; Mesri 2001). The observed in situstrain and thus settlement are similar to values predicted byILLICON analyses almost entirely based on input data fromlaboratory tests. According to the Ca=Cc law of compressibility,clay layers subjected to values of svf9 =sp9 in the range of 0.75–1.0are expected to rapidly complete primary consolidation and thendisplay secondary compression, initially without showinga tendency of decreasing coefficient of secondary compressionsuch as shown in Fig. 9.
The behavior of Holocene and Pleistocene clay layers at theKansai International Airport site is not different in any fundamentalway from the experience that has been available for clays fromthroughout the world. The total thickness of clay layers, the mag-nitude of reclamation loads, and impeded drainage boundary con-ditions provided by the Pleistocene sand layers combine together tolead to large time-dependent settlement of the airport. According toFig. 17, Airport Island I exceeded the design requirement of 4 mabove sea level in 2001 and will be at sea level by 2067 or possiblymuch sooner. Airport Island II, according to Figs. 15 and 16, will beat the design requirement of 4 m above sea level by 2023–2036 andwill be at sea level by 2058–2100.
Summary and Conclusions
The following summary and conclusions are based on the data,analyses, and interpretation presented in this paper:1. The basement rock, located at depths greater than 1,000 m at
the Kansai Airport site, is overlain by freshwater depositsfollowed by an alternating sequence of Pleistocenemarine and
Fig. 12. Observed (data from Furudoi 2010) and calculated excesspore-water pressures at MP1-II
Fig. 13.Observed (data fromKobayashi et al. 2005; Rocchi et al. 2007;Jeon et al. 2012) and calculated compression of Pleistocene layers atMP1-I to the year 2010
J. Geotech. Geoenviron. Eng., 2015, 141(2): 04014102
Dow
nloa
ded
from
asc
elib
rary
.org
by
Sung
Chu
ng o
n 02
/16/
16. C
opyr
ight
ASC
E. F
or p
erso
nal u
se o
nly;
all
righ
ts r
eser
ved.
nonmarine clay and sand layers. The Pleistocenemarine andnonmarine clay and sand deposits together with an over-lying 17- to 25-m-thick Holocene marine clay layer con-stitute the upper 400m of the subseabed profile at the airportsite. The upper 400m of the subseabed profile at MonitoringPoint 1 of Airport Island II (MP1-II) consists of 22 claylayers with a combined total thickness of 290 m and 19 sandlayers with a combined total thickness of 110 m. Thelowermost Pleistocene clay layer was deposited 1 millionYBP, and deposition of the Holocene clay layer began10,000–12,000 YBP.
2. The prereclamation subseabed condition at the Kansai Airportsite was defined by 63 borings made to depths of 100–200 mbelow seabed and six borings made to a depth of 400 m belowthe seabed. Representative values of natural water content,plastic limit, liquid limit, clay-size fraction, and activity for 22clay layers are in the range of 19 (lowermost Pleistocenenonmarine clay layer NMC-5) to 110% (uppermost sublayerof Holocene marine clay layer Ma13), 18–41%, 35–110%, 6–52%, and 0.99 to 3.04, respectively.
3. For the ILLICON settlement analyses, in the absence ofreported direct measurements of permeability, vertical perme-ability (kvo) of the Pleistocene clay layers in the range of7:83 10211 to 4:63 1029 m=s was calculated using the em-pirical equation by Mesri et al. (1994) together with repre-sentative values of prereclamation void ratio, clay-sizefraction, and activity for each sublayer. Vertical permeabilityvalues for the Holocene clay sublayers, in the range of1:03 1029 to 2:33 1028 m=s, were determined based oncompression rates in incremental loading oedometer testsinterpreted using the Terzaghi theory of consolidation. Forall clay layers, the decrease in permeability during consoli-dationwas calculated using the empirical equationCk 5 0:5eo.
4. In the absence of reported direct measurements, values ofkv 5 kh for the Pleistocene sand layers were back-calculatedusing the ILLICON computer program together with settle-ment and pore-water pressure observations, assuming one-directional horizontal flow within the sand layers that isperpendicular to the long dimension of each airport island.The back-calculated permeability values were in the range of1027 to 1024 m=s, which is comparable to values used insettlement analyses performed by others in the literature forthe Kansai Airport islands.
5. The compressibility of each clay sublayer was defined in termsof an EOP e-logsv9 relationship together with a single value ofCa=Cc. The EOP e-logsv9 relationship of each sublayer startedfrom the prereclamation point (eo, svo9 ) continued alonga recompression curve assuming Cr=Cc 5 0:1 to a preconso-lidation pressure computed from sp9=svo9 data in the range of1.28–2.10 forHolocene and Pleistocene clay layers and then toa nonlinear compression curve constructed usingCc9-logsv9=sp9data from all published IL and CRS oedometer tests onHolocene and Pleistocene clays from the Kansai Airport site.
6. Computed EOP compression ofMa13 is 5.8m atMP1-I, 8.1matMP2-II, and 8.3m atMP1-II. According to observations andILLICON analyses, primary consolidation of the HoloceneMa13 clay layer was realized soon after reclamation wascompleted in each location because of the presence of verticaldrains. As of December 2012, the average observed seabedsettlement has exceeded 12.9 and 14.2 m, respectively, forAirport Islands I and II.
7. According to the ILLICON analyses, by the end of the 21stcentury, MP1-I on Island I will settle 17.6 m and MP1-II andMP2-II on Island II will settle 24.4 and 22.9 m, respectively.
Fig. 14. Observed (data from Kobayashi et al. 2005; Jeon et al. 2012)and calculated excess pore-water pressures at MP1-I
Fig. 15. Seabed settlement at MP1-II, including compression of Ho-locene and Pleistocene clay layers
J. Geotech. Geoenviron. Eng., 2015, 141(2): 04014102
Dow
nloa
ded
from
asc
elib
rary
.org
by
Sung
Chu
ng o
n 02
/16/
16. C
opyr
ight
ASC
E. F
or p
erso
nal u
se o
nly;
all
righ
ts r
eser
ved.
8. At MP1-II, 185.3-m combined thickness of clay (Ma13 toDoc6) was loaded to the compression range with maximumsvf9 =sp9 in the range of 1.05–2.15 and has experiencedsignificant primary compression. On the other hand,102.0-m combined thickness of Pleistocene clay (Ma4 toNMC-5) was loaded to the recompression range with max-imum svf9 =sp9 in the range of 0.83–1.01, and because of theshort duration of primary consolidation together with rapidincrease inCawith time, is expected to experience significantsecondary compression.
9. In 2001, Airport Island I exceeded the design specificationrequiring that the surface elevation of the airport islands
should remain 4 m above sea level. By 2067 or sooner,Island I is predicted to be at sea level. The surface elevationof Airport Island II is predicted to be at the design re-quirement of 4 m above sea level by 2023–2036, andAirport Island II is predicted to be at sea level by 2058–2100.
10. According to the ILLICON predictions, 100 years afterconstruction of Airport Island II, the degree of primarycompression of the 24.5- to 25.6-m-thick Ma10 Pleistoceneclay layer with impeded drainage boundaries will be 54–57%.
Table 2. Summary of Calculations for Compression of Pleistocene Clay Layers at MP1-II
Note: EOP compression calculated from EOP void ratio for Ma11L through Doc5.aEOP compression corresponds to bavg 5 95% for Ma13 through Ma11U and Ma8 through NMC-5.
Fig. 16. Seabed settlement at MP2-II, including compression of Ho-locene and Pleistocene clay layers
Fig. 17. Seabed settlement at MP1-I, including compression of Ho-locene and Pleistocene clay layers
J. Geotech. Geoenviron. Eng., 2015, 141(2): 04014102
Dow
nloa
ded
from
asc
elib
rary
.org
by
Sung
Chu
ng o
n 02
/16/
16. C
opyr
ight
ASC
E. F
or p
erso
nal u
se o
nly;
all
righ
ts r
eser
ved.
Acknowledgments
The authors gratefully acknowledge Mr. Naoki Nishimura for pro-viding settlement and pore-water pressure observations at MP2-IIand Mr. Hiroyuki Tanaka for providing laboratory oedometer datafor Osaka Bay Pleistocene clays. Additionally, the authors acknowl-edge Mr. Yoshiyuki Morikawa, Mr. Masaki Kobayashi, and Mr.Mamoru Mimura for useful email communications regarding theKansai Airport project.
Notation
The following symbols and abbreviations are used in this paper:Ac 5 activity;Cc 5 compression index;Cc9 5 secant compression index;Ck 5 change in permeability index;Cr 5 recompression index;Ca 5 secondary compression index;e 5 void ratio;eo 5 initial or preconstruction void ratio;ep 5 end of primary void ratio;Gs 5 specific gravity of solids;Ip 5 plasticity index;kvo 5 initial or prereclamation coefficient of permeability in
the vertical direction;Lo 5 initial layer thickness;tp 5 time to end of primary consolidation;u9 5 excess pore-water pressure;wo 5 natural or prereclamation water content;wp 5 plastic limit;wl 5 liquid limit;g 5 total unit weight;
gw 5 unit weight of water;Dsv 5 increase in vertical stress;
_ɛI 5 imposed strain rate for CRS test;_ɛp 5 imposed strain rate for CRS test that produces the EOP
e-logsv9 relationship;sp9 5 preconsolidation pressure;sv9 5 effective vertical stress; and
svo9 5 initial or prereclamation effective vertical stress.
References
Akai, K., and Tanaka, Y. (1999). “Settlement behaviour of an off-shoreairport KIA.”Geotechnical engineering for transportation infrastructure,F.B. J. Barends, J. Lindenberg,H. J. Luger,A.Verruijt, andL. deQuelerij,eds., Taylor & Francis, Tokyo, 1041–1046.
Arai, Y. (1991). “Construction of an artificial offshore island for the KansaiInternational Airport.” Proc., GEO-COAST ’91: Int. Conf. on Geo-technical Engineering for Coastal Development: Theory and Practiceon Soft Ground, Coastal Development Institute of Technology,Yokohama, Japan, 927–943.
Endo, H., Oikawa, K., and Komatsu, A. (1991). “Settlement of diluvial claylayers caused by a large scale man-made island.” Proc., GEO-COAST ’91:Int. Conf. on Geotechnical Engineering for Coastal Development, CoastalDevelopment Institute of Technology: Theory and Practice on Soft Ground,Coastal Development Institute of Technology, Yokohama, Japan, 177–182.
Funk, J. R. (2013). “Settlement of the Kansai International Airport Islands.”Ph.D. thesis, Univ. of Illinois at Urbana–Champaign, Urbana, IL.
Funk, J. R., andMesri, G. (2014). ILLICON user guide, Department of Civiland Environmental Engineering, Univ. of Illinois at Urbana–Champaign,Urbana, IL.
Furudoi, T. (2010). “The second phase construction of Kansai InternationalAirport considering the large and long-term settlement of the claydeposits.” Soils Found., 50(6), 805–816.
Furudoi, T., and Kobayashi, M. (2009). “Geotechnical issues and approachon Kansai International Airport Project—Prediction and performance ofsettlement.” J. Soc. Civ. Eng. Ser. C, 65(4), 998–1017.
Hight, D. W., and Leroueil, S. (2003). “Characterisation of soils for en-gineering purposes.” Characterisation and engineering properties ofnatural soils, T. S. Tan, K. K. Phoon, D.W. Hight, and S. Leroueil, eds.,Vol. 1, Swets & Zeitlinger, Lisse, Netherlands, 255–362.
Table 3. Summary of Calculations for Compression of Pleistocene Clay Layers at MP1-I
NMC-1 3.6 16.2 Mar. 2003 0.99 0.02 0.02 0.09Ma1 9.0 16.2 Mar. 2003 1.02 0.05 0.05 0.22Ma0 7.6 16.2 Mar. 2003 0.94 0.04 0.04 0.26NMC-5 6.6 16.2 Mar. 2003 0.93 0.05 0.05 0.28P
15.76 15.66 1.98
Note: EOP compression calculated from EOP void ratio for Ma4 through Ma2.aEOP compression corresponds to bavg 5 95% for Ma13 through Doc6 and NMC-1 through NMC-5.
Imai, G., Ohmukai, N., and Tanaka, H. (2005). “An isotaches-type com-pression model for predicting long term consolidation of KIA clays.”Proc., Symp. on Geotechnical Aspects of Kansai International Airport,Port and Harbor Institute, Yokosuka, Japan, 49–64.
Inoue, N., Kitada, N., Itoh, Y., Takemura, K., and Nakagawa, K. (2003).“Integrated study of high resolution geophysical and geological informa-tion of Osaka Bay, Southwest Japan.” J. Asian Earth Sci., 22(1), 1–11.
Itihara, M., Yoshikawa, S., Inoue, K., Hayashi, T., Tateishi, M., andNakajima, K. (1975). “Stratigraphy of the Plio-Pleistocene Osaka Groupin Sennan-Senpoku area, south of Osaka, Japan—A standard stratig-raphy of the Osaka Group.” J. Geosci. Osaka City Univ., 19, 1–29.
Itoh, Y., Takemura, K., Ishiyama, T., Tanaka, Y., and Iwaki, H. (2000).“Basin formation at a contractional bend of a large transcurrent fault:Plio-Pleistocene subsidence of the Kobe and northern Osaka Basins,Japan.” Tectonophysics, 321(3), 327–341.
Itoh, Y., Takemura, K., Kawabata, D., Tanaka, Y., andNakaseko, K. (2001).“Quaternary tectonic warping and strata formation in the southern OsakaBasin inferred from reflection seismic interpretation and borehole se-quence.” J. Asian Earth Sci., 20(1), 45–58.
Jeon, B., Mimura, M., and Saitsu, Y. (2012). “Numerical assessment of thepermeability for the Pleistocene sandy gravel deposits considering thesubsurface stratigraphy of Kansai International Airport.” Disaster Pre-vention Research Institute, Kyoto Univ., Kyoto, Japan, 215–224.
Kagawa, T., Zhao, B., Miyakoshi, K., and Irikura, K. (2004). “Modeling of3D basin structures for seismic wave simulations based on availableinformation on the target area: case study of the Osaka Basin, Japan.”Bull. Seismol. Soc. Am., 94(4), 1353–1368.
Kanda, K., Suzuki, S., and Yamagata, N. (1991). “Offshore investigation atthe Kansai International Airport.” Proc., GEO-COAST ’91: Int. Conf. onGeotechnical Engineering for Coastal Development: Theory andPractice on Soft Ground, Coastal Development Institute of Technology,Yokohama, Japan, 33–38.
Kansai International Airport LandDevelopment Company (KALD). (2005).2nd phase construction in progress: Final stage of reclamation andbackground of the Kansai International Airport: Environmentally-friendly air traffic gateway to the world (DVD-ROM), Yokohama, Japan.
Kobayashi, M., Furudoi, T., Suzuki, S., and Watabe, Y. (2005). “Modelingof consolidation characteristics of clays for settlement prediction ofKansai International Airport.” Proc., Symp. on Geotechnical Aspects ofKansai International Airport, Japanese Geotechnical Society, Tokyo,65–76.
Maeda, S., Higuchi, Y., and Furuichi, M. (1990). “Large-scale sand drainworks for the Kansai International Airport.” Proc., Airports into the 21stCentury, Hong Kong Institute of Engineers, Hong Kong, 485–496.
Mesri, G. (2001). “Primary compression and secondary compression.”Proc., Soil Behavior and Soft Ground Construction, Geotechnicalspecial publication 119, J. T. Germain, T. C. Sheahan, and R.V.Whitman, eds., ASCE, Reston, VA, 122–166.
Mesri, G., and Ajlouni, M. (2007). “Engineering properties of fibrouspeats.” J. Geotech. Geoenviron. Eng., 10.1061/(ASCE)1090-0241(2007)133:7(850), 850–866.
Mesri, G., and Castro, A. (1987). “Ca=Cc concept and K0 during secondarycompression.” J. Geotech. Engrg., 10.1061/(ASCE)0733-9410(1987)113:3(230), 230–247.
Mesri, G., andChoi, Y.K. (1979). “Discussion: Strain rate behavior of Saint-Jean Vianney clay, by Vaid et al.” Can. Geotech. J., 16(4), 831–834.
Mesri, G., andChoi, Y.K. (1985a). “Settlement analysis of embankments onsoft clays.” J. Geotech. Engrg., 10.1061/(ASCE)0733-9410(1985)111:4(441), 441–464.
Mesri, G., and Choi, Y. K. (1985b). “The uniqueness of the End-Of-Primary(EOP) void ratio-effective stress relationship.” Proc., 11th Int. Conf. onSoil Mechanics and Foundation Engineering, Vol. 2, Balkema, Rot-terdam, Netherlands, 587–590.
Mesri, G., and Feng, T. W. (1986). “Discussion: Stress-strain-strain raterelation for the compressibility of sensitive natural clays, by Leroueilet al.” Géotechnique, 36(2), 283–290.
Mesri, G., Feng, T. W., Ali, S., and Hayat, T. M. (1994). “Permeabilitycharacteristics of soft clays.” Proc., 13th Int. Conf. on Soil Mechanicsand Foundation Engineering, Vol. 2, Japanese Society of Soil Me-chanics and Foundation Engineering, Tokyo, 187–192.
Mesri, G., Feng, T. W., and Shahien, M. (1995). “Compressibilityparameters during primary consolidation. Invited special lecture.”Proc.,Int. Symp. on Compression and Consolidation of Clayey Soils, Balkema,Rotterdam, Netherlands, 201–217.
Mesri, G., and Godlewski, P. M. (1977). “Time and stress compressibilityinterrelationship.” J. Geotech. Engrg. Div., 103(5), 417–430.
Mesri, G., and Godlewski, P. M. (1979). “Time and stress-compressibilityinterrelationships. Closure.” J. Geotech. Engrg. Div., 105(1), 106–113.
Mesri, G., and Khan, A. Q. (2012). “Ground improvement using vacuumloading together with vertical drains.” J. Geotech. Geoenviron. Eng.,10.1061/(ASCE)GT.1943-5606.0000640, 680–689.
Mikasa, M., and Ohnishi, H. (1981). “Soil improvement by dewatering inOsaka South Port.” Proc., 9th Int. Conf. on Soil Mechanics andFoundation Engineering: The Case History Volume, International So-ciety of Soil Mechanics and Foundation Engineering, Tokyo, 639–684.
Mimura, M., and Jang, W. (2005). “Long-term settlement of the Pleistocenedeposits due to construction of KIA.” Proc., Symp. on GeotechnicalAspects of Kansai International Airport, Japanese Geotechnical Society,Tokyo, 77–85.
Nakase, A. (1987). “Kansai International Airport—Construction of man-made island.” Proc., 8th Asian Regional Conference of InternationalSociety of Soil Mechanics and Foundation Engineering, Vol. 2, Inter-national Society of Soil Mechanics and Foundation Engineering,London, 87–101.
Nakaseko, K., Takemura, K., Nishiwaki, N., Nakagawa, Y., Furutani, M.,and Yamauchi, M. (1984). “Stratigraphy of the submarine strata at theKansai International Airport in Osaka Bay off Senshu, central Japan.”Rep. of the Calamity Science Institute, K. Nakaseko, ed., Osaka, Japan,191–198.
New Kansai International Airport Company (NKIAC). (2012). Æhttp://www.nkiac.co.jpæ (Oct. 22, 2012).
Rocchi, G., Vaciago, G., Fontana, M., and Plebani, F. (2006). “Enhancedprediction of settlement in structured clays with examples from OsakaBay.” Geomech. Geoeng., 1(3), 217–237.
Rocchi, G., Vaciago, G., Fontana, M., and Plebani, F. (2007). “Furtherinsight into the behavior of Pleistocene Osaka clays at KIA Phase 1island.” Geomech. Geoeng., 2(3), 159–173.
Sasaki, S., Nakamura, Y., and Tokuhira, T. (1987). “Long-term goals ofOsaka Port Improvement Project.” Proc., Coastal Zone ’87: 5th Symp.on Coastal and Ocean Management, O. T. Magoon, H. Converse, D.Miner, L. T. Tobin, D. Clark, and G. Domurat, eds., Vol. 1, ASCE,Reston, VA, 267–274.
Sekiguch, H., and Aksornkoae, S. (2008). “Environment problems in thecoastal zone.” Asia-Pacific coasts and their management: States ofenvironment, N. Mimura, ed., Springer, Dordrecht, Netherlands, 65–171.
Shibata, T., and Karube, D. (2005). “Settlement prediction of Kansai In-ternational Airport.” Proc., 16th Int. Conf. on Soil Mechanics and Geo-technical Engineering, IOS Press, Amsterdam, Netherlands, 87–96.
Shinohara, M. (2003). “Settlement analysis and intelligent site managementof the second-phase land reclamation works for Kansai InternationalAirport.” Proc., Nakase Memorial Symposium Yokosuka, Japan: SoftGround Engineering in Coastal Areas, Balkema, Rotterdam, Nether-lands, 145–150.
Tabata, T., and Morikawa, Y. (2005). “The second phase construction ofKansai International Airport considering the large and long-term set-tlement of the clay deposits.” Proc., Int. Conf. on Soil Mechanics andGeotechnical Engineering, IOS Press, Amsterdam, Netherlands, 7–16.
Tanaka, H. (2005a). “Consolidation behavior of natural soils around pcvalue—Inter-connected oedometer test.” Soils Found., 45(3), 97–105.
Tanaka, H. (2005b). “Consolidation behavior of natural soils around pcvalue—Long term consolidation test.” Soils Found., 45(3), 83–95.
Tanaka, H., Kang, M., and Watabe, Y. (2004). “Ageing effects on con-solidation properties: Based on the site investigation of Osaka Pleis-tocene clays.” Soils Found., 44(6), 39–51.
Tanaka, H., and Locat, J. (1999). “A microstructural investigation of OsakaBay clay: The impact of microfossils on its mechanical behaviour.”Can.Geotech. J., 36(3), 493–508.
Tanaka,H., Tanaka,M., Suzuki, S., andSakagami, T. (2003). “Developmentof a new cone penetrometer and its application to great depths ofPleistocene clays.” Soils Found., 43(6), 51–61.
Tavenas, F., Jean, P., Leblond, P., andLeroueil, S. (1983). “The permeabilityof natural soft clays. Part II: Permeability characteristics.”Can. Geotech.J., 20(4), 645–660.
Terzaghi, K., Peck, R. B., and Mesri, G. (1996). Soil mechanics in engi-neering practice, 3rd Ed., Wiley, New York.
Tsuchida, T. (2005). “Structure due to cementation of OsakaBay clay and itsmathematical modeling.” Proc., Symp. on Geotechnical Aspects ofKansai International Airport, IOS Press, Amsterdam, Netherlands, 31–40.
Watabe, Y., Tsuchida, T., and Adachi, K. (2002). “Undrained shear strengthof Pleistocene clay in Osaka Bay.” J. Geotech. Geoenviron. Eng.,10.1061/(ASCE)1090-0241(2002)128:3(216), 216–226.
Watabe, Y., Udaka, K., and Morikawa, Y. (2008). “Strain rate effect onlong-term consolidation of Osaka Bay clay.” Soils Found., 48(4), 495–509.
Yamane, N., Fukasawa, T., and Mizukami, J. (2003). “A new constructionmethod for reclamation work in the Kansai International Airport secondphase project.” Proc., Nakase Memorial Symposium, Yokosuka, Japan:Soft Ground Engineering in Coastal Areas.” Balkema, Rotterdam,Netherlands, 201–204.
Yamasaki, T., and Nakada, M. (1996). “Effects of quaternary sea-levelchange on the subsidence of a sedimentary basin: A case study of theOsaka Bay sedimentary basin, Japan.” Tectonophysics, 267(1–4), 229–238.


![Kansai Airports Kobe: Strategy and Vision...Kansai Airports Kobe: Strategy and Vision U For Integrated Operation of Three Airports in Kansai Region ]d September 26. 2017 Kansai Airports](https://static.documents.pub/doc/80x56/5f8641fa32e2c85376466493/kansai-airports-kobe-strategy-and-vision-kansai-airports-kobe-strategy-and.jpg)


