76
C ONSOLIDATED F INANCIAL S TATEMENTS AND S UPPLEMENTARY I NFORMATION Ascension Health Alliance d/b/a Ascension Years Ended June 30, 2014 and 2013 With Reports of Independent Auditors

C O N S O L I D A T E D F I N A N C I A L
S T A T E M E N T S A N D S U P P L E M E N T A R Y
I N F O R M A T I O N
Ascension Health Alliance d/b/a Ascension Years Ended June 30, 2014 and 2013 With Reports of Independent Auditors

1403-1210450
Ascension
Consolidated Financial Statements and Supplementary Information
Years Ended June 30, 2014 and 2013
Contents
Report of Independent Auditors.......................................................................................................1
Consolidated Financial Statements
Consolidated Balance Sheets ...........................................................................................................3 Consolidated Statements of Operations and Changes in Net Assets ...............................................5 Consolidated Statements of Cash Flows ..........................................................................................7 Notes to Consolidated Financial Statements ....................................................................................9
Supplementary Information
Report of Independent Auditors on Supplementary Information ..................................................66 Schedule of Net Cost of Providing Care of Persons
Living in Poverty and Other Community Benefit Programs ......................................................67 Credit Group Consolidated Balance Sheets as of June 30, 2014 and 2013 ...................................68 Credit Group Consolidated Statements of Operations and Changes in Net Assets for the Years Ended June 30, 2014 .............................................................................................70 Schedule of Credit Group Cash and Investments ..........................................................................72 Schedule of Credit Group Statistical Information .........................................................................73
1403-1210450 1
Report of Independent Auditors
The Board of Directors Ascension Health Alliance d/b/a Ascension
We have audited the accompanying consolidated financial statements of Ascension Health Alliance d/b/a Ascension, which comprise the consolidated balance sheets as of June 30, 2014 and 2013, and the related consolidated statements of operations and changes in net assets and cash flows for the years then ended, and the related notes to the consolidated financial statements.
Management’s Responsibility for the Financial Statements
Management is responsible for the preparation and fair presentation of these financial statements in conformity with U.S. generally accepted accounting principles; this includes the design, implementation, and maintenance of internal control relevant to the preparation and fair presentation of financial statements that are free of material misstatement, whether due to fraud or error.
Auditor’s Responsibility
Our responsibility is to express an opinion on these financial statements based on our audits. We conducted our audits in accordance with auditing standards generally accepted in the United States. Those standards require that we plan and perform the audit to obtain reasonable assurance about whether the financial statements are free of material misstatement.
An audit involves performing procedures to obtain audit evidence about the amounts and disclosures in the financial statements. The procedures selected depend on the auditor’s judgment, including the assessment of the risks of material misstatement of the financial statements, whether due to fraud or error. In making those risk assessments, the auditor considers internal control relevant to the entity’s preparation and fair presentation of the financial statements in order to design audit procedures that are appropriate in the circumstances, but not for the purpose of expressing an opinion on the effectiveness of the entity’s internal control. Accordingly, we express no such opinion. An audit also includes evaluating the appropriateness of accounting policies used and the reasonableness of significant accounting estimates made by management, as well as evaluating the overall presentation of the financial statements.
We believe that the audit evidence we have obtained is sufficient and appropriate to provide a basis for our audit opinion.
A member firm of Ernst & Young Global Limited
Ernst & Young LLP The Plaza in Clayton Suite 1300 190 Carondelet Plaza St. Louis, MO 63105-3434
Tel: +1 314 290 1000 Fax: +1 314 290 1882 ey.com

1403-1210450 2
Opinion
In our opinion, the financial statements referred to above present fairly, in all material respects, the consolidated financial position of Ascension Health d/b/a Ascension at June 30, 2014 and 2013, and the consolidated results of their operations and their cash flows for the years then ended in conformity with U.S. generally accepted accounting principles.
ey September 11, 2014
A member firm of Ernst & Young Global Limited
3 1403-1210450
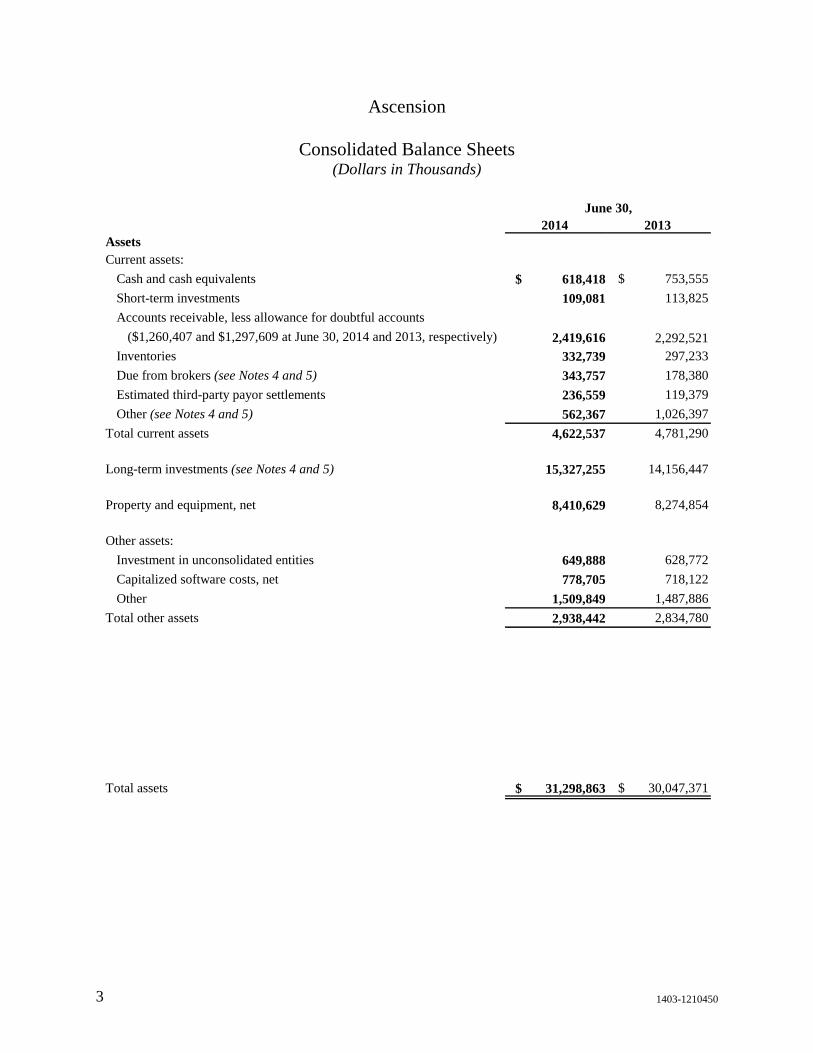
Ascension
Consolidated Balance Sheets (Dollars in Thousands)
2014 2013AssetsCurrent assets:
Cash and cash equivalents $ 618,418 $ 753,555
Short-term investments 109,081 113,825
Accounts receivable, less allowance for doubtful accounts
($1,260,407 and $1,297,609 at June 30, 2014 and 2013, respectively) 2,419,616 2,292,521 Inventories 332,739 297,233
Due from brokers (see Notes 4 and 5) 343,757 178,380
Estimated third-party payor settlements 236,559 119,379
Other (see Notes 4 and 5) 562,367 1,026,397
Total current assets 4,622,537 4,781,290
Long-term investments (see Notes 4 and 5) 15,327,255 14,156,447
Property and equipment, net 8,410,629 8,274,854
Other assets:
Investment in unconsolidated entities 649,888 628,772
Capitalized software costs, net 778,705 718,122
Other 1,509,849 1,487,886
Total other assets 2,938,442 2,834,780
Total assets $ 31,298,863 $ 30,047,371
June 30,

1403-1210450 4
2014 2013
Liabilities and net assets
Current liabilities:
Current portion of long-term debt $ 91,532 $ 89,869
Long-term debt subject to short-term remarketing arrangements* 1,345,530 1,187,125
Accounts payable and accrued liabilities 2,293,663 2,278,242
Estimated third-party payor settlements 450,054 455,432
Due to brokers (see Notes 4 and 5) 332,169 493,420
Current portion of self-insurance liabilities 226,856 210,115
Other (see Notes 4 and 5) 274,645 639,566
Total current liabilities 5,014,449 5,353,769
Noncurrent liabilities:
Long-term debt (senior and subordinated) 4,994,913 5,278,304
Self-insurance liabilities 541,859 553,706
Pension and other postretirement liabilities 428,679 554,368
Other (see Notes 4 and 5) 1,343,826 1,178,597
Total noncurrent liabilities 7,309,277 7,564,975
Total liabilities 12,323,726 12,918,744
Net assets:
Unrestricted
Controlling interest 16,736,190 14,986,302
Noncontrolling interests 1,656,106 1,592,356
Unrestricted net assets 18,392,296 16,578,658
Temporarily restricted 391,226 375,054
Permanently restricted 191,615 174,915
Total net assets 18,975,137 17,128,627
Total liabilities and net assets $ 31,298,863 $ 30,047,371
The accompanying notes are an integral part of the consolidated financial statements.
*Co ns is ts o f variable ra te demand bo nds with put o ptio ns tha t may be exerc is ed a t the o ptio n o f the bo ndho lders , with s ta ted repayment
ins ta llments thro ugh 2047, as well as certa in s eria l mo de bo nds with s cheduled remarke ting/manda to ry tender da tes o ccurring prio r to J une30, 2015. In the event tha t bo nds are no t remarke ted upo n the exerc is e o f put o ptio ns o r the s cheduled manda to ry tenders , managementwo uld utilize o ther s o urces to acces s the neces s ary liquidity. P o tentia l s o urces inc lude liquidating inves tments , drawing upo n the $ 1 billio n line o f c redit, and is s uing co mmerc ia l paper. The co mmerc ia l paper pro gram is s uppo rted by the $ 1 billio n line o f credit.
June 30,

1403-1210450 5
Ascension
Consolidated Statements of Operations and Changes in Net Assets
(Dollars in Thousands)
2014 2013Operating revenue:
Net patient service revenue $ 19,193,307 $ 16,326,684
Less provision for doubtful accounts 1,273,354 1,124,409
Net patient service revenue, less provision
for doubtful accounts 17,919,953 15,202,275
Other revenue 2,229,767 1,334,623
Total operating revenue 20,149,720 16,536,898
Operating expenses:
Salaries and wages 8,202,294 6,974,951
Employee benefits 1,747,739 1,528,119
Purchased services 1,210,276 955,440
Professional fees 1,279,459 1,093,446
Supplies 2,822,102 2,334,427
Insurance 128,535 109,178
Interest 194,616 150,877
Depreciation and amortization 899,389 730,757
Other 2,901,859 2,140,182
Total operating expenses before impairment,
restructuring and nonrecurring losses, net 19,386,269 16,017,377
Income from operations before self-insurance trust fund investment
return and impairment, restructuring, and nonrecurring losses, net 763,451 519,521
Self-insurance trust fund investment return 66,174 34,985
Impairment, restructuring and nonrecurring losses, net (223,834) (103,344)
Income from operations 605,791 451,162
Nonoperating gains (losses):
Investment return 1,515,819 736,300
Loss on extinguishment of debt (1,605) (4,079)
(Loss) gain on interest rate swaps (6,020) 53,746
Income from unconsolidated entities 5,539 8,544
Contributions from business combinations, net – 2,021,963
Other (63,119) (69,524)
Total nonoperating gains, net 1,450,614 2,746,950
Excess of revenues and gains over expenses and losses 2,056,405 3,198,112
Less noncontrolling interests 245,893 131,184
Excess of revenues and gains over expenses
and losses attributable to controlling interest 1,810,512 3,066,928
Continued on next page.
Year Ended June 30,
1403-1210450 6
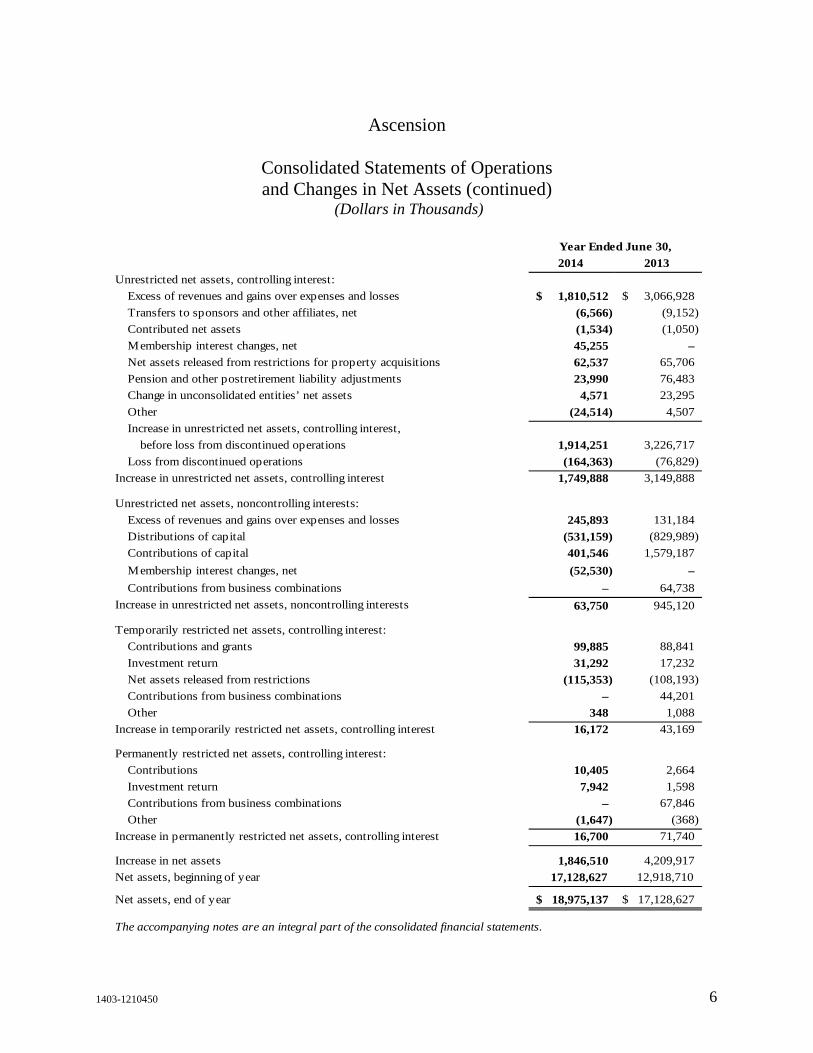
Ascension
Consolidated Statements of Operations and Changes in Net Assets (continued)
(Dollars in Thousands)
2014 2013
Unrestricted net assets, controlling interest:
Excess of revenues and gains over expenses and losses 1,810,512$ 3,066,928$
Transfers to sponsors and other affiliates, net (6,566) (9,152)
Contributed net assets (1,534) (1,050)
Membership interest changes, net 45,255 –
Net assets released from restrictions for property acquisitions 62,537 65,706
Pension and other postretirement liability adjustments 23,990 76,483
Change in unconsolidated entities’ net assets 4,571 23,295
Other (24,514) 4,507
Increase in unrestricted net assets, controlling interest,
before loss from discontinued operations 1,914,251 3,226,717
Loss from discontinued operations (164,363) (76,829)
Increase in unrestricted net assets, controlling interest 1,749,888 3,149,888
Unrestricted net assets, noncontrolling interests:
Excess of revenues and gains over expenses and losses 245,893 131,184
Distributions of capital (531,159) (829,989)
Contributions of capital 401,546 1,579,187
Membership interest changes, net (52,530) –
Contributions from business combinations – 64,738
Increase in unrestricted net assets, noncontrolling interests 63,750 945,120
Temporarily restricted net assets, controlling interest:
Contributions and grants 99,885 88,841
Investment return 31,292 17,232
Net assets released from restrictions (115,353) (108,193)
Contributions from business combinations – 44,201
Other 348 1,088
Increase in temporarily restricted net assets, controlling interest 16,172 43,169
Permanently restricted net assets, controlling interest:
Contributions 10,405 2,664
Investment return 7,942 1,598
Contributions from business combinations – 67,846
Other (1,647) (368)
Increase in permanently restricted net assets, controlling interest 16,700 71,740
Increase in net assets 1,846,510 4,209,917
Net assets, beginning of year 17,128,627 12,918,710
Net assets, end of year 18,975,137$ 17,128,627$
The accompanying notes are an integral part of the consolidated financial statements.
Year Ended June 30,

1403-1210450 7
Ascension
Consolidated Statements of Cash Flows (Dollars in Thousands)
2014 2013Operating activitiesIncrease in net assets 1,846,510$ 4,209,917$ Adjustments to reconcile increase in net assets to net cash
provided by operating activities: Depreciation and amortization 899,389 730,757 Amortization of bond premiums (22,497) (13,948) Loss on extinguishment of debt 1,605 4,079 Provision for doubtful accounts 1,275,961 1,128,717 Pension and other postretirement liability adjustments (23,990) (76,483) Contributed net assets 1,534 1,050 Contributions from business combinations – (1,742,900) Interest, dividends, and net (gains) losses on investments (1,621,227) (790,115) Change in market value of interest rate swaps 1,880 (61,349) Deferred gain on interest rate swaps (303) (303) Gain on sale of assets, net (25,556) (4,008) Impairment and nonrecurring expenses 30,353 17,259
Transfers to sponsor and other affiliates, net 6,566 9,152 Restricted contributions, investment return, and other (122,232) (98,755) Other restricted activity 6,362 15,965 Nonoperating depreciation expense 234 317 (Increase) decrease in:
Short-term investments 4,744 212,624 Accounts receivable (1,393,667) (1,134,828) Inventories and other current assets 437,913 (213,753) Due from brokers (165,377) 610,891 Investments classified as trading 466,353 (959,888) Other assets (186,983) (182,693)
Increase (decrease) in:Accounts payable and accrued liabilities (685) (2,009) Estimated third-party payor settlements, net (124,475) 30,604 Due to brokers (161,251) (387,193) Other current liabilities (357,167) 91,435 Self-insurance liabilities 4,894 (15,342) Other noncurrent liabilities 60,731 (153,420)
Net cash provided by continuing operating activities 839,619 1,225,780 Net cash provided by (used in) and adjustments to reconcile change in
net assets for discontinued operations, including write-down of assets 126,554 (19,386) Net cash provided by operating activities 966,173 1,206,394
Continued on next page.
Year Ended June 30,
1403-1210450 8
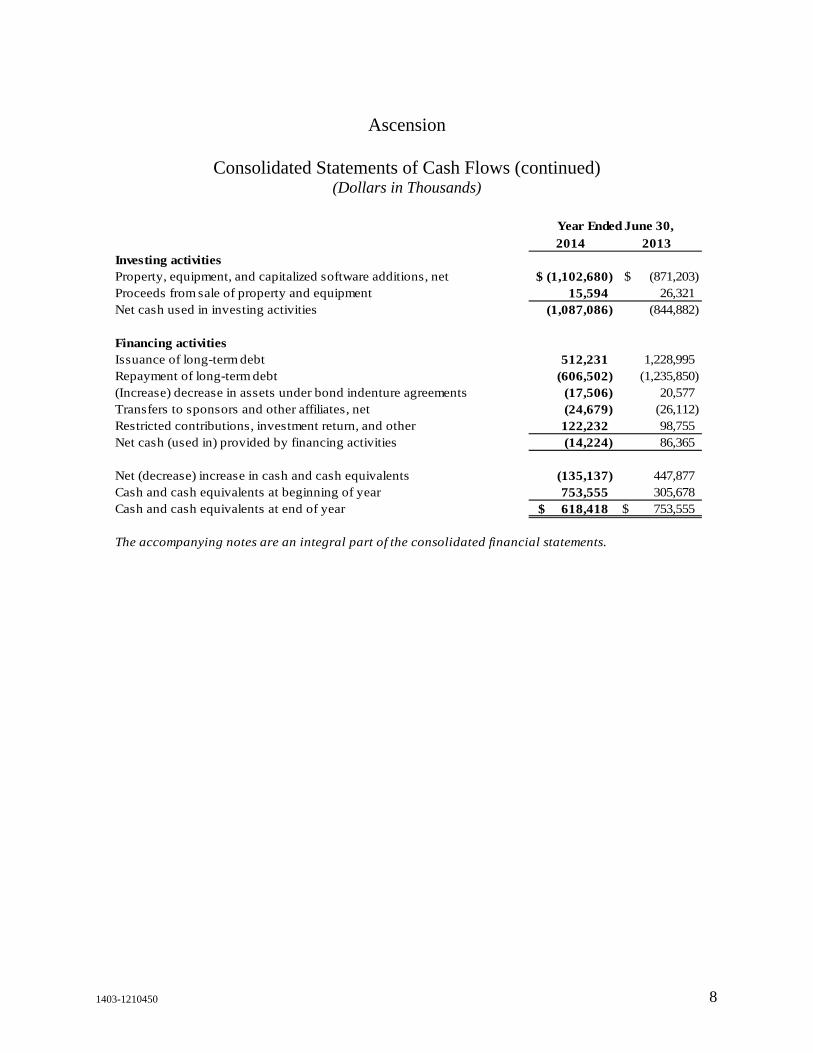
Ascension
Consolidated Statements of Cash Flows (continued) (Dollars in Thousands)
2014 2013Investing activitiesProperty, equipment, and capitalized software additions, net (1,102,680)$ (871,203)$ Proceeds from sale of property and equipment 15,594 26,321 Net cash used in investing activities (1,087,086) (844,882)
Financing activitiesIssuance of long-term debt 512,231 1,228,995 Repayment of long-term debt (606,502) (1,235,850) (Increase) decrease in assets under bond indenture agreements (17,506) 20,577 Transfers to sponsors and other affiliates, net (24,679) (26,112) Restricted contributions, investment return, and other 122,232 98,755 Net cash (used in) provided by financing activities (14,224) 86,365
Net (decrease) increase in cash and cash equivalents (135,137) 447,877 Cash and cash equivalents at beginning of year 753,555 305,678 Cash and cash equivalents at end of year 618,418$ 753,555$
The accompanying notes are an integral part of the consolidated financial statements.
Year Ended June 30,

1403-1210450 9
Ascension
Notes to Consolidated Financial Statements (Dollars in Thousands)
June 30, 2014
1. Organization and Mission
Organizational Structure
Ascension Health Alliance, d/b/a Ascension (Ascension), is a Missouri nonprofit corporation formed on September 13, 2011. Ascension is the sole corporate member and parent organization of Ascension Health, a Catholic national health system consisting primarily of nonprofit corporations that own and operate local healthcare facilities, or Health Ministries, located in 23 of the United States and the District of Columbia.
Ascension serves as the member or shareholder of various subsidiaries as listed below:
AH Holdings, LLC, d/b/a Ascension Holdings, LLC AHV Holding Company, LLC, d/b/a AV Holding Company Ascension Health Ascension Health Clinical Holdings, d/b/a Ascension Clinical Holdings Ascension Health Global Mission, d/b/a Ascension Global Mission Ascension Health Insurance, Ltd. (AHIL) Ascension Health – IS. Inc., d/b/a Ascension Information Services Ascension Health Resource and Supply Management Group, LLC d/b/a The Resource
Group Ascension Health Leadership Academy, d/b/a Ascension Leadership Academy Ascension Health Ventures, d/b/a Ascension Ventures Ascension Investment Management, LLC (AIM) Ascension Alpha Fund, LLC, f/k/a CHIMCO Alpha Fund, LLC (Alpha Fund) Ascension Risk Services, LLC
Ascension and its member organizations are hereafter referred to collectively as the System.
Effective July 15, 2013, Ascension Health Leadership Academy, LLC, Ascension Health Global Mission and Ascension Health Clinical Holdings began doing business as Ascension Leadership Academy, Ascension Global Mission and Ascension Clinical Holdings, respectively. On July 17, 2013, AH Holdings, LLC began doing business as Ascension Holdings. Effective October 14, 2013, CHIMCO Alpha Fund, LLC was renamed Ascension Alpha Fund, LLC.

Ascension
Notes to Consolidated Financial Statements (continued) (Dollars in Thousands)
1403-1210450 10
1. Organization and Mission (continued)
Effective November 4, 2013, Ascension Health Ventures, LLC was renamed Ascension Ventures, LLC and AHV Holding Company, LLC began doing business as AV Holding Company. Effective December 12, 2013, Ascension Health – IS, Inc. began doing business as Ascension Information Services. Effective January 1, 2014, Catholic Healthcare Investment Management Company (CHIMCO) transferred all of its business and assets to AIM, a limited liability company wholly owned by Ascension and CHIMCO’s successor in interest.
Sponsorship
Ascension is sponsored by Ascension Sponsor, a Public Juridic Person. The Participating Entities of Ascension Sponsor are the Daughters of Charity of St. Vincent de Paul, St. Louise Province; the Congregation of St. Joseph; the Congregation of the Sisters of St. Joseph of Carondelet; the Congregation of Alexian Brothers of the Immaculate Conception Province, Inc. – American Province; and the Sisters of the Sorrowful Mother of the Third Order of St. Francis of Assisi – US/Caribbean Province. As more fully described in the Organizational Changes note, Marian Health System, which was previously sponsored by the Sisters of the Sorrowful Mother of the Third Order of St. Francis of Assisi – US/Caribbean Province, became part of Ascension Health on April 1, 2013.
Mission
The System directs its governance and management activities toward strong, vibrant, Catholic Health Ministries united in service and healing, and dedicates its resources to spiritually centered care which sustains and improves the health of the individuals and communities it serves. In accordance with the System’s mission of service to those persons living in poverty and other vulnerable persons, each Health Ministry accepts patients regardless of their ability to pay. The System uses four categories to identify the resources utilized for the care of persons living in poverty and community benefit programs:
• Traditional charity care includes the cost of services provided to persons who cannot afford healthcare because of inadequate resources and/or who are uninsured or underinsured.

Ascension
Notes to Consolidated Financial Statements (continued) (Dollars in Thousands)
1403-1210450 11
1. Organization and Mission (continued)
• Unpaid cost of public programs, excluding Medicare, represents the unpaid cost of services provided to persons covered by public programs for persons living in poverty and other vulnerable persons.
• Cost of other programs for persons living in poverty and other vulnerable persons includes unreimbursed costs of programs intentionally designed to serve the persons living in poverty and other vulnerable persons of the community, including substance abusers, the homeless, victims of child abuse, and persons with acquired immune deficiency syndrome.
• Community benefit consists of the unreimbursed costs of community benefit programs and services for the general community, not solely for the persons living in poverty, including health promotion and education, health clinics and screenings, and medical research.
Discounts are provided to all uninsured patients, including those with the means to pay. Discounts provided to those patients who did not qualify for assistance under charity care guidelines are not included in the cost of providing care of persons living in poverty and other community benefit programs. The cost of providing care to persons living in poverty and other community benefit programs is estimated by reducing charges forgone by a factor derived from the ratio of each entity’s total operating expenses to the entity’s billed charges for patient care.
Certain costs such as graduate medical education and certain other activities are excluded from total operating expenses for purposes of this computation.
The amount of traditional charity care provided, determined on the basis of cost, was $580,606 and $524,605 for the years ended June 30, 2014 and 2013, respectively. The amount of unpaid cost of public programs, cost of other programs for persons living in poverty and other vulnerable persons, and community benefit cost is reported in the accompanying supplementary information.

Ascension
Notes to Consolidated Financial Statements (continued) (Dollars in Thousands)
1403-1210450 12
2. Significant Accounting Policies
Principles of Consolidation
All corporations and other entities for which operating control is exercised by the System or one of its member corporations are consolidated, and all significant inter-entity transactions have been eliminated in consolidation. Investments in entities where the System does not have operating control are recorded under the equity or cost method of accounting. Income from unconsolidated entities is included in consolidated excess of revenues and gains over expenses and losses in the accompanying Consolidated Statements of Operations and Changes in Net Assets as follows:
Year Ended June 30,2014 2013
Other revenue 83,317$ 105,173$ Nonoperating gains, net 5,539 8,544
Use of Estimates
Management has made estimates and assumptions that affect the reported amounts of certain assets, liabilities, revenues, and expenses. Actual results could differ from those estimates.
Fair Value of Financial Instruments
Carrying values of financial instruments classified as current assets and current liabilities approximate fair value. The fair values of other financial instruments are disclosed in the Fair Value Measurements note.
Cash and Cash Equivalents
Cash and cash equivalents consist of cash and interest-bearing deposits with original maturities of three months or less.

Ascension
Notes to Consolidated Financial Statements (continued) (Dollars in Thousands)
1403-1210450 13
2. Significant Accounting Policies (continued)
Short-Term Investments
Short-term investments consist of investments with original maturities exceeding three months and up to one year.
Inventories
Inventories, consisting primarily of medical supplies and pharmaceuticals, are stated at the lower of cost or market value using first-in, first-out (FIFO) or a methodology that closely approximates FIFO.
Long-Term Investments and Investment Return
Investments, excluding investments in unconsolidated entities, are measured at fair value, are classified as trading securities, and include pooled short-term investment funds; U.S. government, state, municipal and agency obligations; corporate and foreign fixed income securities; asset-backed securities; and equity securities. Investments also include alternative investments and other investments which are valued based on the net asset value of the investments, as further discussed in the Fair Value Measurements note. Investments also include derivatives held by the Alpha Fund, also measured at fair value, as discussed in the Pooled Investment Fund note.
Long-term investments include assets limited as to use of approximately $1,431,000 and $1,311,000, at June 30, 2014 and 2013, respectively, comprised primarily of investments placed in trust and held by captive insurance companies for the payment of self-insured claims and investments which are limited as to use, as designated by donors.
Purchases and sales of investments are accounted for on a trade-date basis. Investment returns consist of dividends, interest, and gains and losses. The cost of substantially all securities sold is based on the average cost method. Investment returns on investments, excluding returns of self-insurance trust funds, are reported as nonoperating gains (losses) in the Consolidated Statements of Operations and Changes in Net Assets, unless the return is restricted by donor or law. Investment returns of self-insurance trust funds are reported as a separate component of income from operations in the Consolidated Statements of Operations and Changes in Net Assets.
Ascension
Notes to Consolidated Financial Statements (continued) (Dollars in Thousands)
1403-1210450 14
2. Significant Accounting Policies (continued)
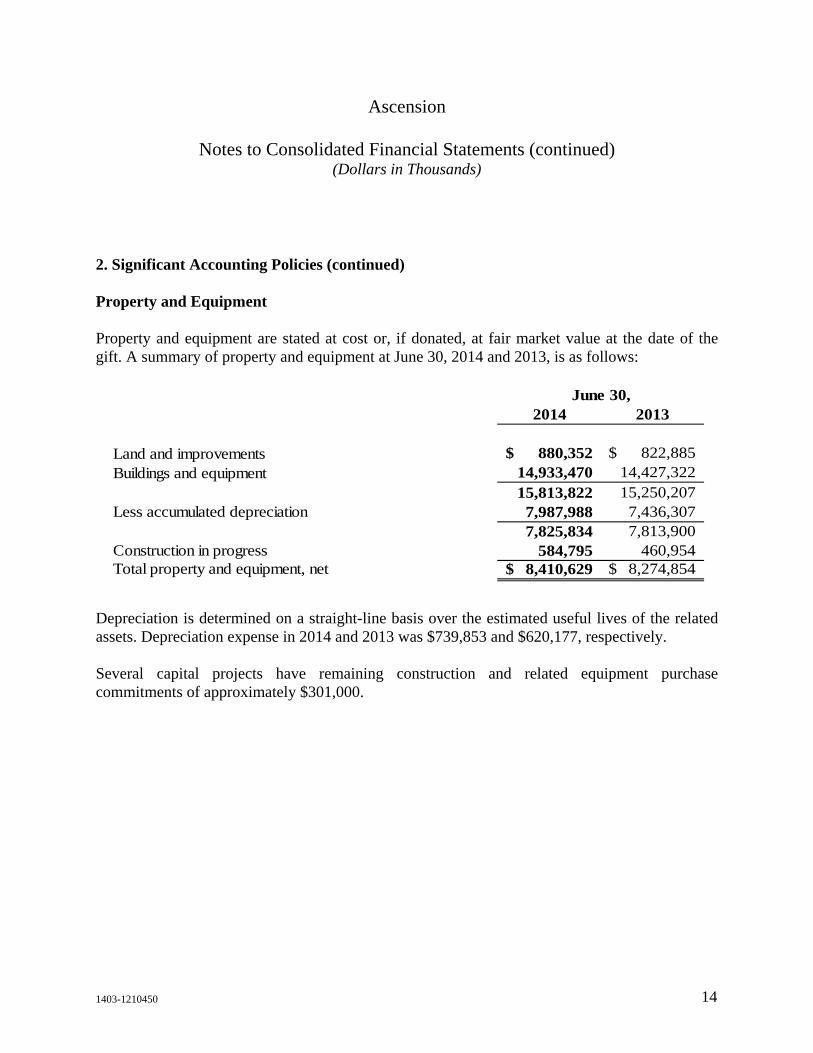
Property and Equipment
Property and equipment are stated at cost or, if donated, at fair market value at the date of the gift. A summary of property and equipment at June 30, 2014 and 2013, is as follows:
2014 2013
Land and improvements 880,352$ 822,885$ Buildings and equipment 14,933,470 14,427,322
15,813,822 15,250,207 Less accumulated depreciation 7,987,988 7,436,307
7,825,834 7,813,900 Construction in progress 584,795 460,954 Total property and equipment, net 8,410,629$ 8,274,854$
June 30,
Depreciation is determined on a straight-line basis over the estimated useful lives of the related assets. Depreciation expense in 2014 and 2013 was $739,853 and $620,177, respectively.
Several capital projects have remaining construction and related equipment purchase commitments of approximately $301,000.

Ascension
Notes to Consolidated Financial Statements (continued) (Dollars in Thousands)
1403-1210450 15
2. Significant Accounting Policies (continued)
Intangible Assets
Intangible assets primarily consist of goodwill and capitalized computer software costs, including internally developed software. Costs incurred in the development and installation of internal use software are expensed or capitalized depending on whether they are incurred in the preliminary project stage, application development stage, or post-implementation stage.
Intangible assets are included in the Consolidated Balance Sheets as presented in the table that follows. Capitalized software costs in the table below include software in progress of $125,451 and $99,048 at June 30, 2014 and 2013, respectively:
2014 2013
Capitalized software costs 1,557,302$ 1,388,880$ Less accumulated amortization 778,597 670,758 Capitalized software costs, net 778,705 718,122
Goodwill 181,490 130,306 Other, net 62,573 71,440 Intangible assets included in other long-term assets 244,063 201,746
Total intangible assets, net 1,022,768$ 919,868$
June 30,
Intangible assets whose lives are indefinite, primarily goodwill, are not amortized and are evaluated for impairment at least annually, while intangible assets with definite lives, primarily capitalized computer software costs, are amortized over their expected useful lives. Amortization expense for these intangible assets in 2014 and 2013 was $157,150 and $108,633, respectively.

Ascension
Notes to Consolidated Financial Statements (continued) (Dollars in Thousands)
1403-1210450 16
2. Significant Accounting Policies (continued)
The System is in the midst of a significant multi-year, System-wide enterprise resource planning project, including information technology and process standardization (Symphony), which is expected to continue through fiscal year 2016. The project is anticipated to result in a transition to a common software product for various finance, information technology, procurement, and human resources management processes, including standardization of those processes throughout the System. Capitalized costs of Symphony were approximately $320,000 and $301,000 at June 30, 2014 and 2013, respectively, and are included in capitalized software costs in the preceding table. Certain costs of this project were also expensed. Beginning September 1, 2012, the software associated with Symphony was considered substantially complete and ready for its intended use and is amortized on a straight-line basis over its expected useful life. Accumulated amortization of Symphony was approximately $55,000 and $25,000 at June 30, 2014 and 2013, respectively. See the Impairment, Restructuring, and Nonrecurring Gains (Losses) discussion below for additional information about costs associated with Symphony.
Noncontrolling Interests
The consolidated financial statements include all assets, liabilities, revenues, and expenses of entities that are controlled by the System and therefore consolidated. Noncontrolling interests in the Consolidated Balance Sheets represent the portion of net assets owned by entities outside the System, for those entities in which the System’s ownership interest is less than 100%.
Temporarily and Permanently Restricted Net Assets
Temporarily restricted net assets are those assets whose use by the System has been limited by donors to a specific time period or purpose. Permanently restricted net assets consist of gifts with corpus values that have been restricted by donors to be maintained in perpetuity, which include endowment funds. Temporarily restricted net assets and earnings on permanently restricted net assets, including earnings on endowment funds, are used in accordance with the donors’ wishes, primarily to purchase equipment and to provide charity care and other health and educational services. Contributions with donor-imposed restrictions that are met in the same reporting period are reported as unrestricted.
Temporarily and permanently restricted net assets consist solely of controlling interests of the System.

Ascension
Notes to Consolidated Financial Statements (continued) (Dollars in Thousands)
1403-1210450 17
2. Significant Accounting Policies (continued)
Performance Indicator
The performance indicator is the excess of revenues and gains over expenses and losses. Changes in unrestricted net assets that are excluded from the performance indicator primarily include pension and other postretirement liability adjustments, transfers to or from sponsors and other affiliates, net assets released from restrictions for property acquisitions, change in unconsolidated entities’ net assets, discontinued operations, and contributions received of property and equipment.
Operating and Nonoperating Activities
The System’s primary mission is to meet the healthcare needs in its market areas through a broad range of general and specialized healthcare services, including inpatient acute care, outpatient services, long-term care, and other healthcare services. Activities directly associated with the furtherance of this purpose are considered to be operating activities. Other activities that result in gains or losses peripheral to the System’s primary mission are considered to be nonoperating. Additionally, contributions recognized in conjunction with business combination transactions are also classified as nonoperating.
Net Patient Service Revenue, Accounts Receivable, and Allowance for Doubtful Accounts
Net patient service revenue is reported at the estimated realizable amounts from patients, third-party payors, and others for services provided and includes estimated retroactive adjustments under reimbursement agreements with third-party payors. The System recognizes patient service revenue at the time services are rendered, even though the patient’s ability to pay may not be completely assessed at that time. Revenue under certain third-party payor agreements is subject to audit, retroactive adjustments, and significant regulatory actions. Provisions for third-party payor settlements and adjustments are estimated in the period the related services are provided and adjusted in future periods as additional information becomes available and as final settlements are determined.
Laws and regulations governing the Medicare and Medicaid programs are complex and subject to interpretation. As a result, there is at least a possibility that recorded estimates will change by a material amount in the near term. Adjustments to revenue related to prior periods increased net patient service revenue by $95,591 and $55,340 for the years ended June 30, 2014 and 2013, respectively.
Ascension
Notes to Consolidated Financial Statements (continued) (Dollars in Thousands)
1403-1210450 18
2. Significant Accounting Policies (continued)
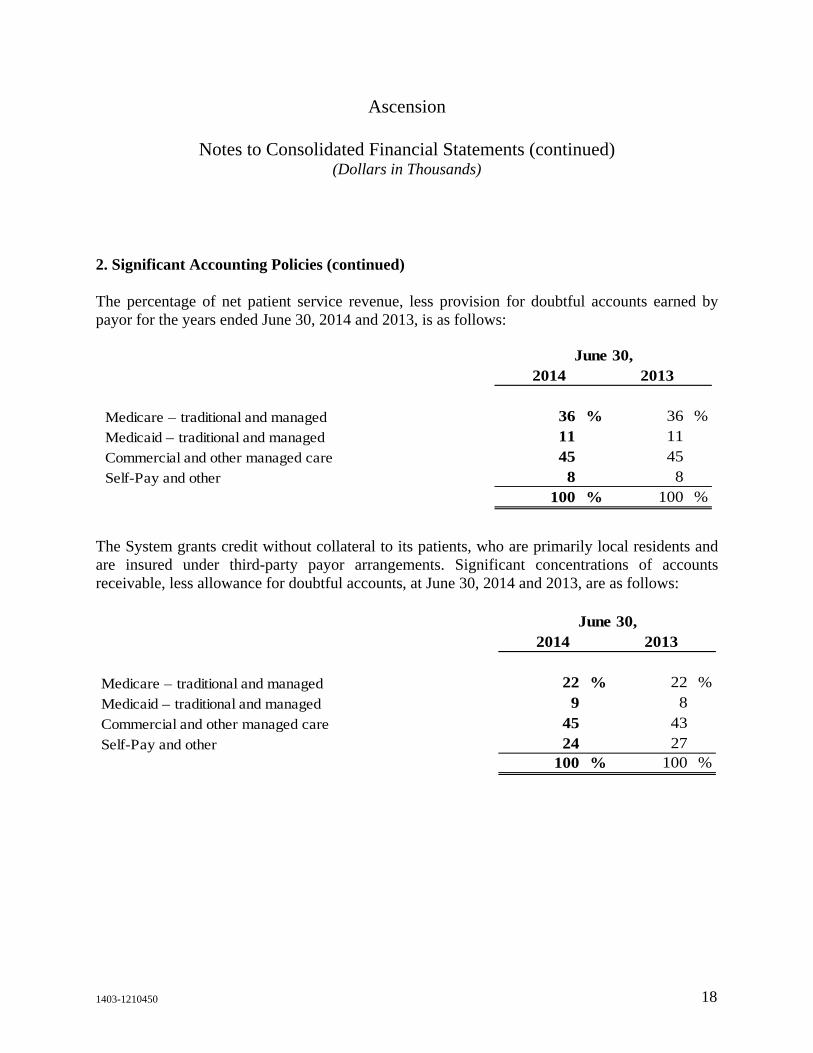
The percentage of net patient service revenue, less provision for doubtful accounts earned by payor for the years ended June 30, 2014 and 2013, is as follows:
Medicare – traditional and managed 36 % 36 %Medicaid – traditional and managed 11 11 Commercial and other managed care 45 45 Self-Pay and other 8 8
100 % 100 %
June 30,2014 2013
The System grants credit without collateral to its patients, who are primarily local residents and are insured under third-party payor arrangements. Significant concentrations of accounts receivable, less allowance for doubtful accounts, at June 30, 2014 and 2013, are as follows:
Medicare – traditional and managed 22 % 22 %
Medicaid – traditional and managed 9 8
Commercial and other managed care 45 43
Self-Pay and other 24 27 100 % 100 %
2014 2013June 30,

Ascension
Notes to Consolidated Financial Statements (continued) (Dollars in Thousands)
1403-1210450 19
2. Significant Accounting Policies (continued)
The provision for doubtful accounts is based upon management’s assessment of expected net collections considering economic conditions, historical experience, trends in healthcare coverage, and other collection indicators. Periodically throughout the year, management assesses the adequacy of the allowance for doubtful accounts based upon historical write-off experience by payor category, including those amounts not covered by insurance. The results of this review are then used to make any modifications to the provision for doubtful accounts to establish an appropriate allowance for doubtful accounts. After satisfaction of amounts due from insurance and reasonable efforts to collect from the patient have been exhausted, the System follows established guidelines for placing certain past-due patient balances with collection agencies, subject to the terms of certain restrictions on collection efforts as determined by the System. Accounts receivable are written off after collection efforts have been followed in accordance with the System’s policies.
The methodology for determining the allowance for doubtful accounts and related write-offs on uninsured patient accounts has remained consistent with the prior year. The System has not experienced material changes in write-off trends and has not materially changed its charity care policy in the current fiscal year.
Impairment, Restructuring, and Nonrecurring Gains (Losses)
Long-lived assets are reviewed for impairment whenever events or business conditions indicate the carrying amount of such assets may not be fully recoverable. Initial assessments of recoverability are based on estimates of undiscounted future net cash flows associated with an asset or group of assets. Where impairment is indicated, the carrying amount of these long-lived assets is reduced to fair value based on future discounted net cash flows or other estimates of fair value.
Nonrecurring expenses associated with Symphony include project management and process re-engineering costs, amortization expense for those Health Ministries not yet on Symphony, as well as costs to establish a shared service center and develop a business intelligence data warehouse. Costs associated with product deployment are recorded as nonrecurring gains (losses), and costs associated with product support are recorded as recurring operating expenses.

Ascension
Notes to Consolidated Financial Statements (continued) (Dollars in Thousands)
1403-1210450 20
2. Significant Accounting Policies (continued)
During the year ended June 30, 2014, the System recorded total impairment, restructuring, and nonrecurring losses, net of $223,834. This amount was comprised primarily of $163,293 of nonrecurring expenses associated with Symphony, one-time termination benefits and other restructuring expenses of $26,012, impairment expenses of $23,120, and other nonrecurring expenses of $11,409.
During the year ended June 30, 2013, the System recorded total impairment, restructuring, and nonrecurring losses, net of $103,344. This amount was comprised primarily of $113,193 of nonrecurring expenses associated with Symphony, one-time termination benefits and other restructuring expenses of $57,470, and impairment and other nonrecurring expenses of $4,998, partially offset by pension curtailment gains of $72,317, as discussed in the Retirement Plans note.
Amortization
Bond issuance costs, discounts, and premiums are amortized over the term of the bonds using a method approximating the effective interest method.
Capitalized software, including internally developed software, is amortized on a straight-line basis over the expected useful life of the software.
Income Taxes
The member healthcare entities of the System are primarily tax-exempt organizations under Internal Revenue Code Section 501(c)(3) or Section 501(c)(2), and their related income is exempt from federal income tax under Section 501(a). The System accounts for uncertainty in income tax positions by applying a recognition threshold and measurement attribute for financial statement recognition and measurement of a tax position taken or expected to be taken in a tax return. The System has determined that no material unrecognized tax benefits or liabilities exist as of June 30, 2014.
At June 30, 2014, the System has deferred tax assets of approximately $326,000 for federal and state income tax purposes primarily related to net operating loss carryforwards. A valuation allowance of approximately $322,000 was recorded due to the uncertainty regarding use of the deferred tax assets.
Ascension
Notes to Consolidated Financial Statements (continued) (Dollars in Thousands)
1403-1210450 21
2. Significant Accounting Policies (continued)
Regulatory Compliance
Various federal and state agencies have initiated investigations regarding reimbursement claimed by certain members of the System. The investigations are in various stages of discovery, and the ultimate resolution of these matters, including the liabilities, if any, cannot be readily determined; however, in the opinion of management, the results of the investigations will not have a material adverse impact on the consolidated financial statements of the System.
Reclassifications
Certain reclassifications were made to the 2013 accompanying consolidated financial statements to conform to the 2014 presentation.
Adoption of New Accounting Standards
In December 2011, the Financial Accounting Standards Board (FASB) issued Accounting Standards Update (ASU) No. 2011-11, Disclosures about Offsetting Assets and Liabilities, an amendment to the accounting guidance for disclosures about offsetting assets and liabilities. In January 2013, the FASB issued ASU No. 2013-01, Clarifying the Scope of Disclosures about Offsetting Assets and Liabilities. These ASUs expand the disclosure requirements in that entities will be required to disclose both gross and net information about instruments and transactions eligible for offset in the balance sheet. Ascension adopted this collective guidance on July 1, 2013, which did not have a material impact on Ascension’s consolidated financial statements for the year ended June 30, 2014. See the Derivative Instruments note for disclosures about offsetting assets and liabilities for the year ended June 30, 2014.
Subsequent Events
The System evaluates the impact of subsequent events, which are events that occur after the Consolidated Balance Sheet date but before the consolidated financial statements are issued, for potential recognition in the consolidated financial statements as of the Consolidated Balance Sheet date. For the year ended June 30, 2014, the System evaluated subsequent events through September 11, 2014, representing the date on which the accompanying audited consolidated financial statements were issued.

Ascension
Notes to Consolidated Financial Statements (continued) (Dollars in Thousands)
1403-1210450 22
2. Significant Accounting Policies (continued)
In July 2014, the System signed two separate non-binding letters of intent to sell primarily all assets and liabilities and related operations of Ascension’s operations in Kansas City, Missouri and Tucson, Arizona, as discussed in the Organizational Changes note.
In August 2014, Ascension Health signed an affiliation agreement to sell primarily all of the assets, liabilities and operations associated with Ascension’s operations in Niagara Falls, New York to Catholic Health System, Inc. This transaction is intended to close during calendar year 2015, after obtaining all necessary approvals.
3. Organizational Changes
Business Combinations
Marian Health System
Effective April 1, 2013, Ascension Health, a subsidiary of the System, became the sole corporate member, through a non-cash business combination transaction, of three regional health systems that formerly comprised Marian Health System, Inc. (Marian Health System): Via Christi Health, Inc. (Via Christi Health), based in Wichita, Kansas; Ministry Health Care, Inc. (Ministry Health Care), based in Milwaukee, Wisconsin; and St. John Health System, Inc. (St. John Health), based in Tulsa, Oklahoma (collectively, the Marian Systems). Prior to this transaction, Marian Health System was the sole corporate member of Ministry Health Care and St. John Health, while Ascension Health and Marian Health System were the two corporate members of Via Christi Health.
Prior to April 1, 2013, the System accounted for its 50% interest in Via Christi Health under the equity method of accounting. The System’s investment in Via Christi Health at March 31, 2013, was $545,018, which was reported in the Consolidated Balance Sheet at that date in investment in unconsolidated entities. For the year ended June 30, 2013, the System’s excess of revenues and gains over expenses and losses included $34,141, representing the System’s share of Via Christi Health’s excess of revenues over expenses prior to the business combination transaction on April 1, 2013. The System’s investment in Via Christi Health of $545,018 at March 31, 2013, was derecognized on April 1, 2013, in conjunction with the accounting for the business combination transaction.

Ascension
Notes to Consolidated Financial Statements (continued) (Dollars in Thousands)
1403-1210450 23
3. Organizational Changes (continued)
The fair values of the Marian Systems’ net assets, by major type, that were recognized in the System’s Consolidated Balance Sheet on April 1, 2013, were as follows. The valuation of these net assets was finalized during the year ended June 30, 2014, resulting in no material adjustments.
Net working capital $ 557,274 Intangible assets, including capitalized software 135,819 Property and equipment 1,950,739 Assets limited as to use 1,126,259 Investments and other long-term assets 1,125,652 Noncurrent liabilities assumed (2,144,948)Subtotal 2,750,795 Less: March 31, 2013 Investment in Via Christi Health (545,018)Fair value of net assets $ 2,205,777
The fair value of net assets of $2,205,777 in the preceding table was recognized in the Consolidated Statement of Operations and Changes in Net Assets for the year ended June 30, 2013, as a nonoperating contribution from business combinations of $2,028,992; contributions of temporarily and permanently restricted net assets of $44,201 and $67,846, respectively; and contributions of noncontrolling interests of $64,738.
For the three months ended June 30, 2013, the System recognized revenues of the Marian Systems of $1,049,259, and an excess of revenues and gains over expenses and losses of the Marian Systems of $56,670, of which $55,542 was attributable to controlling interest, with the remaining attributable to noncontrolling interests. Additionally, for the three months ended June 30, 2013, the System recognized an increase in unrestricted net assets – controlling interests, excluding the excess of revenues and gains over expenses and losses of $56,670 above, of $53,801; an increase in unrestricted net assets – noncontrolling interests of $823; an increase in temporarily restricted net assets of $915; and a decrease in permanently restricted net assets of $56.

Ascension
Notes to Consolidated Financial Statements (continued) (Dollars in Thousands)
1403-1210450 24
3. Organizational Changes (continued)
The following unaudited pro forma financial information presents the combined results of operations of the System and the Marian Systems for the year ended June 30, 2013, as though the April 1, 2013 business combination transaction had occurred on July 1, 2011. This pro forma financial information is not necessarily indicative of the results of operations that would have occurred had the System and the Marian Systems constituted a single entity during this period, nor is it necessarily indicative of future operating results.
Year Ended
June 30, 2013 Total operating revenue 20,005,943$ Excess of revenues and gains over expenses and losses 1,230,777 Increase in unrestricted net assets – controlling interest 1,307,542 Increase in unrestricted net assets – noncontrolling interests 879,585 Increase in temporarily restricted net assets 7,497 Increase in permanently restricted net assets 7,945
The excess of revenues and gains over expenses and losses and the increase in unrestricted net assets – controlling interest in the table above exclude the nonoperating contribution from the Marian Health System business combination of $2,028,992 included in the Consolidated Statement of Operations and Changes in Net Assets for the year ended June 30, 2013. The pro forma excess of revenues and gains over expenses and losses above includes certain adjustments attributable to the April 1, 2013, business combination transaction.
In addition, the increases in unrestricted net assets – controlling interest, temporarily restricted net assets, and permanently restricted net assets in the table above exclude the contributions from business combinations reflected in the contributions of noncontrolling interests, and temporarily and permanently restricted net assets of $64,738, $44,201, and $67,846, respectively.
Ascension
Notes to Consolidated Financial Statements (continued) (Dollars in Thousands)
1403-1210450 25
3. Organizational Changes (continued)
Mercy Regional Health Center, Inc.
On February 27, 2014 (transaction date), Via Christi Health, a subsidiary of Ascension Health, became the sole corporate member of Mercy Regional Health Center, Inc. (MRHC) through a membership transfer agreement with Memorial Hospital Association (MHA). Prior to the transaction date, Via Christi Health held a 50% controlling interest in MRHC, which it consolidated, with a noncontrolling interest recognized for the portion of MRHC held by MHA. On the transaction date, Via Christi Health paid cash of approximately $7,300 to MHA in exchange for MHA’s 50% interest valued at approximately $52,530, along with contingent consideration, paid in the event of a sale or future change in control of either MRHC or Via Christi Health, or the dissolution of MRHC. As such, this contingent liability had a value of zero at June 30, 2014 and through September 11, 2014, the date of issuance of Ascension’s consolidated financial statements. This transaction was accounted for as a $45,255 increase in controlling interest and a corresponding $52,530 decrease in noncontrolling interest in Ascension’s Consolidated Statement of Operations and Changes in Net Assets for the year ended June 30, 2014.
Divestitures and Discontinued Operations
As of June 30, 2014, and through September 11, 2014, the date of issuance of Ascension’s consolidated financial statements, the System is in discussions, and has signed related non-binding letters of intent, with certain third parties for the sale of primarily all assets, liabilities and operations, excluding certain non-acute care entities, associated with Ascension’s operations in Kansas City, Missouri; Tucson, Arizona; and Niagara Falls, New York (entities held for sale). A noncontrolling interest in the operations in Tucson, Arizona, subsequent to the sale is expected to be retained. Completion of these proposed transactions is subject to due diligence and execution of final definitive agreements, including obtaining all necessary approvals.

Ascension
Notes to Consolidated Financial Statements (continued) (Dollars in Thousands)
1403-1210450 26
3. Organizational Changes (continued)
Assets and liabilities intended to be sold are designated as assets and liabilities held for sale, and included within other assets and other liabilities, respectively, in the System’s Consolidated Balance Sheets. Assets held for sale were $431,404 and $571,350 at June 30, 2014 and 2013, respectively, while liabilities held for sale were $130,722 and $142,707 at June 30, 2014 and 2013, respectively. Revenues of the entities held for sale were $870,862 and $862,838 for the years ended June 30, 2014 and 2013, respectively. Losses of the entities held for sale included in the Loss from discontinued operations in the Consolidated Statement of Operations and Changes in Net Assets were $31,579 and $74,892 for the years ended June 30, 2014 and 2013, respectively. Primarily all of the remaining loss from discontinued operations for the year ended June 30, 2014, was comprised of the write-down of assets in Tucson, Arizona, and Niagara Falls, New York, in conjunction with being classified as held for sale.
Other
In June 2014, Alexian Brothers Health System, a subsidiary of Ascension Health, signed a non-binding letter of intent to form a joint operating company with Adventist Midwest Health. Completion of this proposed transaction is subject to due diligence and execution of final definitive agreements, including obtaining all necessary approvals.
4. Pooled Investment Fund
At June 30, 2014 and 2013, a significant portion of the System’s investments consists of the System’s interest in the Alpha Fund, a limited liability company organized in the state of Delaware. Certain System assets continue to be held through the Ascension Legacy Portfolio, and subsequent to April 2012, the Ascension Legacy Portfolio no longer holds assets for unrelated entities. Additional System investments include those held and managed by the Health Ministries’ and their consolidated foundations.
The Alpha Fund includes the investment interests of the System and other Alpha Fund members. AIM, a wholly owned subsidiary of the System, manages and serves as the manager and primary investment advisor of the Alpha Fund, overseeing the investment strategies offered to the Alpha Fund’s members. AIM provides expertise in the areas of asset allocation, selection and monitoring of outside investment managers, and risk management. The Alpha Fund is consolidated in the System’s financial statements.

Ascension
Notes to Consolidated Financial Statements (continued) (Dollars in Thousands)
1403-1210450 27
4. Pooled Investment Fund (continued)
The portion of the Alpha Fund’s net assets representing interests held by entities other than the System are reflected in noncontrolling interests in the Consolidated Balance Sheets, which amount to $1,490,082 and $1,450,580 at June 30, 2014 and 2013, respectively.
The Alpha Fund invests in a diversified portfolio of investments including alternative investments, such as real asset funds, hedge funds, private equity funds, commodity funds, and private credit funds. Collectively, these funds have liquidity terms ranging from daily to annual with notice periods ranging from 1 to 180 days. Due to redemption restrictions, investments in certain of these funds, whose fair value was $1,312,677 at June 30, 2014, cannot currently be redeemed. However, the potential for the Alpha Fund to sell its interest in these funds in a secondary market prior to the end of the fund term does exist.
The Alpha Fund’s investments in certain alternative investment funds also include contractual commitments to provide capital contributions during the investment period, which is typically five years and can extend to the end of the fund term. During these contractual periods, investment managers may require the Alpha Fund to invest in accordance with the terms of the agreement. Commitments not funded during the investment period will expire and remain unfunded. As of June 30, 2014, contractual agreements of the Alpha Fund expire between July 2014 and December 2019. The remaining unfunded capital commitments of the Alpha Fund total approximately $1,459,000 for 95 individual funds as of June 30, 2014. Due to the uncertainty surrounding whether the contractual commitments will require funding during the contractual period, future minimum payments to meet these commitments cannot be reasonably estimated. These committed amounts are expected to be primarily satisfied by the liquidation of existing investments in the Alpha Fund.
In the normal course of operations and within established Alpha Fund guidelines, the Alpha Fund may enter into various exchange-traded and over-the-counter derivative contracts for trading purposes, including futures, option, and forward contracts as well as warrants and swaps. These instruments are used primarily to adjust the portfolio duration, restructure term structure exposure, change sector exposure, and arbitrage market inefficiencies. See the Fair Value Measurements note for a discussion of how fair value for the Alpha Fund’s derivatives is determined.
Ascension
Notes to Consolidated Financial Statements (continued) (Dollars in Thousands)
1403-1210450 28
4. Pooled Investment Fund (continued)
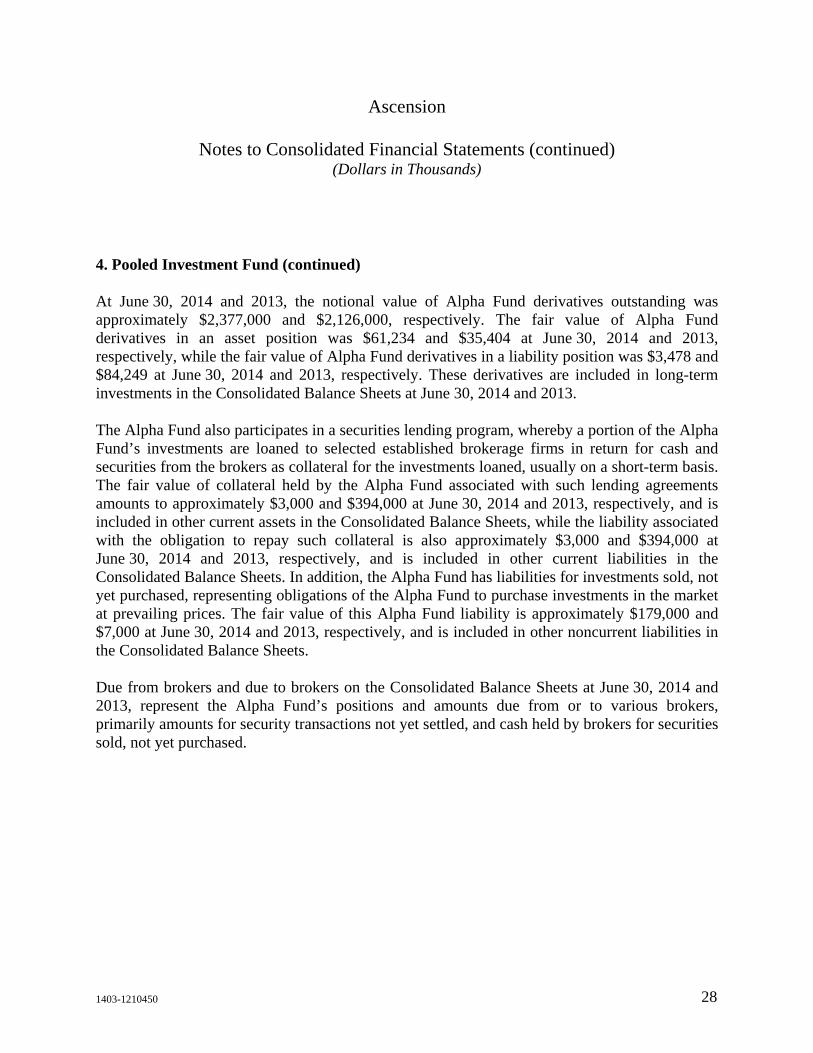
At June 30, 2014 and 2013, the notional value of Alpha Fund derivatives outstanding was approximately $2,377,000 and $2,126,000, respectively. The fair value of Alpha Fund derivatives in an asset position was $61,234 and $35,404 at June 30, 2014 and 2013, respectively, while the fair value of Alpha Fund derivatives in a liability position was $3,478 and $84,249 at June 30, 2014 and 2013, respectively. These derivatives are included in long-term investments in the Consolidated Balance Sheets at June 30, 2014 and 2013.
The Alpha Fund also participates in a securities lending program, whereby a portion of the Alpha Fund’s investments are loaned to selected established brokerage firms in return for cash and securities from the brokers as collateral for the investments loaned, usually on a short-term basis. The fair value of collateral held by the Alpha Fund associated with such lending agreements amounts to approximately $3,000 and $394,000 at June 30, 2014 and 2013, respectively, and is included in other current assets in the Consolidated Balance Sheets, while the liability associated with the obligation to repay such collateral is also approximately $3,000 and $394,000 at June 30, 2014 and 2013, respectively, and is included in other current liabilities in the Consolidated Balance Sheets. In addition, the Alpha Fund has liabilities for investments sold, not yet purchased, representing obligations of the Alpha Fund to purchase investments in the market at prevailing prices. The fair value of this Alpha Fund liability is approximately $179,000 and $7,000 at June 30, 2014 and 2013, respectively, and is included in other noncurrent liabilities in the Consolidated Balance Sheets.
Due from brokers and due to brokers on the Consolidated Balance Sheets at June 30, 2014 and 2013, represent the Alpha Fund’s positions and amounts due from or to various brokers, primarily amounts for security transactions not yet settled, and cash held by brokers for securities sold, not yet purchased.

Ascension
Notes to Consolidated Financial Statements (continued) (Dollars in Thousands)
1403-1210450 29
5. Cash and Investments
The System’s cash and investments are reported in the Consolidated Balance Sheets as presented in the table that follows. Total cash and investments, net, includes both the System’s membership interest in the Alpha Fund and the noncontrolling interests held by other Alpha Fund members. System unrestricted cash and investments, net, represent the System’s cash and investments excluding the noncontrolling interests held by other Alpha Fund members and assets limited as to use.
2014 2013
Cash and cash equivalents 618,418$ 753,555$ Short-term investments 109,081 113,825 Long-term investments 15,327,255 14,156,447 Subtotal 16,054,754 15,023,827
Other Alpha Fund assets and liabilities: In other current assets 30,671 459,050 In other long-term assets 2,641 2,785 In accounts payable and other accrued liabilities (7,013) (5,680) In other current liabilities (3,341) (394,763) In other noncurrent liabilities (178,732) (6,622) Due to brokers, net 11,588 (315,040) Total cash and investments, net 15,910,568 14,763,557 Less noncontrolling interests of Alpha Fund 1,490,082 1,450,580 System cash and investments, including assets limited as to use 14,420,486 13,312,977 Less assets limited as to use: Under bond indenture agreement 43,869 33,955 Self-insurance trust funds 759,388 728,621 Temporarily or permanently restricted 652,244 561,802 Total assets limited as to use 1,455,501 1,324,378 System unrestricted cash and investments, net 12,964,985$ 11,988,599$
June 30,
Ascension
Notes to Consolidated Financial Statements (continued) (Dollars in Thousands)
1403-1210450 30
5. Cash and Investments (continued)
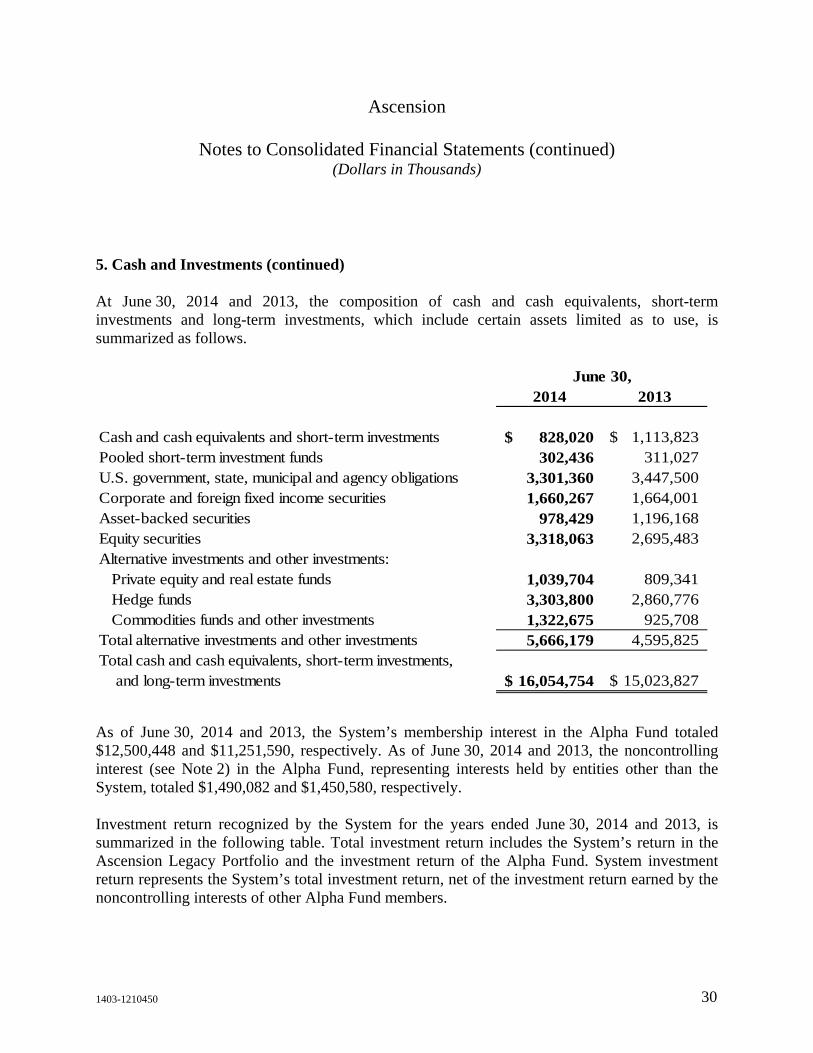
At June 30, 2014 and 2013, the composition of cash and cash equivalents, short-term investments and long-term investments, which include certain assets limited as to use, is summarized as follows.
2014 2013
Cash and cash equivalents and short-term investments 828,020$ 1,113,823$ Pooled short-term investment funds 302,436 311,027 U.S. government, state, municipal and agency obligations 3,301,360 3,447,500 Corporate and foreign fixed income securities 1,660,267 1,664,001 Asset-backed securities 978,429 1,196,168 Equity securities 3,318,063 2,695,483 Alternative investments and other investments: Private equity and real estate funds 1,039,704 809,341 Hedge funds 3,303,800 2,860,776 Commodities funds and other investments 1,322,675 925,708 Total alternative investments and other investments 5,666,179 4,595,825 Total cash and cash equivalents, short-term investments, and long-term investments 16,054,754$ 15,023,827$
June 30,
As of June 30, 2014 and 2013, the System’s membership interest in the Alpha Fund totaled $12,500,448 and $11,251,590, respectively. As of June 30, 2014 and 2013, the noncontrolling interest (see Note 2) in the Alpha Fund, representing interests held by entities other than the System, totaled $1,490,082 and $1,450,580, respectively.
Investment return recognized by the System for the years ended June 30, 2014 and 2013, is summarized in the following table. Total investment return includes the System’s return in the Ascension Legacy Portfolio and the investment return of the Alpha Fund. System investment return represents the System’s total investment return, net of the investment return earned by the noncontrolling interests of other Alpha Fund members.

Ascension
Notes to Consolidated Financial Statements (continued) (Dollars in Thousands)
1403-1210450 31
5. Cash and Investments (continued)
2014 2013
Interest and dividends 203,975$ 169,797$
Net gains on investments reported at fair value 1,378,018 601,488 Restricted investment return and unrealized gains, net 39,234 18,830 Total investment return 1,621,227 790,115 Less return earned by noncontrolling interests of Alpha Fund 193,400 106,039 System investment return 1,427,827$ 684,076$
Year Ended June 30,
6. Fair Value Measurements
The System categorizes, for disclosure purposes, assets and liabilities measured at fair value in the consolidated financial statements based upon whether the inputs used to determine their fair values are observable or unobservable. Observable inputs are inputs that are based on market data obtained from sources independent of the reporting entity. Unobservable inputs are inputs that reflect the reporting entity’s own assumptions about pricing the asset or liability, based on the best information available in the circumstances.
In certain cases, the inputs used to measure fair value may fall into different levels of the fair value hierarchy. In such cases, an asset’s or liability’s level within the fair value hierarchy is based on the lowest level of input that is significant to the fair value measurement of the asset or liability. The System’s assessment of the significance of a particular input to the fair value measurement in its entirety requires judgment and considers factors specific to the asset or liability.

Ascension
Notes to Consolidated Financial Statements (continued) (Dollars in Thousands)
1403-1210450 32
6. Fair Value Measurements (continued)
The System follows the three-level fair value hierarchy to categorize these assets and liabilities recognized at fair value at each reporting period, which prioritizes the inputs used to measure such fair values. Level inputs are defined as follows:
Level 1 – Quoted prices (unadjusted) that are readily available in active markets or exchanges for identical assets or liabilities on the reporting date.
Level 2 – Inputs other than quoted market prices included in Level 1 that are observable for the asset or liability, either directly or indirectly. Level 2 pricing inputs include prices quoted for similar assets and liabilities in active markets or exchanges or prices quoted for identical or similar assets and liabilities in markets that are not active. If the asset or liability has a specified (contractual) term, a Level 2 input must be observable for substantially the full term of the asset or liability.
Level 3 – Significant pricing inputs that are unobservable for the asset or liability, including assets or liabilities for which there is little, if any, market activity for such asset or liability. Inputs to the determination of fair value for Level 3 assets and liabilities require management judgment and estimation.
There were no significant transfers between Levels 1 and 2 during the years ended June 30, 2014 and 2013.
As of June 30, 2014 and 2013, the assets and liabilities listed in the fair value hierarchy tables below use the following valuation techniques and inputs:
Cash and Cash Equivalents and Short-Term Investments
Cash and cash equivalents and certain short-term investments include certificates of deposit, whose fair value is based on cost plus accrued interest. Significant observable inputs include security cost, maturity, and relevant short-term interest rates. Other short-term investments designated as Level 2 investments primarily consist of commercial paper, whose fair value is based on the income approach. Significant observable inputs include security cost, maturity, credit rating, interest rate, and par value.
Ascension
Notes to Consolidated Financial Statements (continued) (Dollars in Thousands)
1403-1210450 33
6. Fair Value Measurements (continued)
Pooled Short-term Investment Fund
The pooled short-term investment fund is a short term exchange traded money market fund primarily invested in treasury securities.
U S. Government, State, Municipal, and Agency Obligations
The fair value of investments in U.S. government, state, municipal, and agency obligations is primarily determined using techniques consistent with the income approach. Significant observable inputs to the income approach include data points for benchmark constant maturity curves and spreads.
Corporate and Foreign Fixed Income Securities
The fair value of investments in U.S. and international corporate bonds, including commingled funds that invest primarily in such bonds, and foreign government bonds is primarily determined using techniques that are consistent with the market approach. Significant observable inputs include benchmark yields, reported trades, observable broker-dealer quotes, issuer spreads, and security specific characteristics, such as early redemption options.
Asset-backed Securities
The fair value of U.S. agency and corporate asset-backed securities is primarily determined using techniques consistent with the income approach. Significant observable inputs include prepayment speeds and spreads, benchmark yield curves, volatility measures, and quotes.
Equity Securities
The fair value of investments in U.S. and international equity securities is primarily determined using techniques consistent with the market and income approaches. The values for underlying investments are fair value estimates determined by external fund managers based on quoted market prices, operating results, balance sheet stability, growth, dividend, dividend yield, and other business and market sector fundamentals.

Ascension
Notes to Consolidated Financial Statements (continued) (Dollars in Thousands)
1403-1210450 34
6. Fair Value Measurements (continued)
Alternative Investments and Other Investments
Alternative investments consist of private equity, hedge funds, private equity funds, commodity funds, and real estate partnerships. The fair value of private equity is primarily determined using techniques consistent with both the market and income approaches, based on the System’s estimates and assumptions in the absence of observable market data. The market approach considers comparable company, comparable transaction, and company-specific information, including but not limited to restrictions on disposition, subsequent purchases of the same or similar securities by other investors, pending mergers or acquisitions, and current financial position and operating results. The income approach considers the projected operating performance of the portfolio company.
The fair value of hedge funds, private equity funds, commodity funds, and real estate partnerships is primarily determined using net asset values, which approximate fair value, as determined by an external fund manager based on quoted market prices, operating results, balance sheet stability, growth, and other business and market sector fundamentals.
Other investments include derivative assets and derivative liabilities of the Alpha Fund, whose fair value is primarily determined using techniques consistent with the market approach. Significant observable inputs to valuation models include interest rates, Treasury yields, volatilities, credit spreads, maturity, and recovery rates.
Securities Lending Collateral
The fair value of collateral received under the Alpha Fund’s securities lending program is valued using the calculated net asset value for the commingled fund in which the collateral is invested. The underlying investments in the commingled fund are valued using techniques consistent with the market approach, which uses significant observable market inputs such as available trade, quotes, benchmark curves, sector groupings, and matrix pricing.

Ascension
Notes to Consolidated Financial Statements (continued) (Dollars in Thousands)
1403-1210450 35
6. Fair Value Measurements (continued)
Benefit Plan Assets
The fair value of benefit plan assets is based on original investment into a guaranteed pooled fund, plus guaranteed, annuity contract-based interest rates. Significant unobservable inputs to the guaranteed rate include the fair value and average duration of the portfolio of investments underlying annuity contract, the contract value, and the annualized weighted-average yield to maturity of the underlying investment portfolio.
Interest Rate Swap Assets and Liabilities
The fair value of interest rate swaps is primarily determined using techniques consistent with the market approach. Significant observable inputs to valuation models include interest rates, Treasury yields, volatilities, credit spreads, maturity, and recovery rates.
Investments Sold, Not Yet Purchased
The fair value of investments sold, not yet purchased is primarily determined using techniques consistent with the income approach. Significant observable inputs to the income approach include data points for benchmark, constant maturity curves, and spreads.

Ascension
Notes to Consolidated Financial Statements (continued) (Dollars in Thousands)
1403-1210450 36
6. Fair Value Measurements (continued)
The following table summarizes fair value measurements, by level, at June 30, 2014, for all financial assets and liabilities measured at fair value on a recurring basis in the System’s consolidated financial statements:
Level 1 Level 2 Level 3 TotalJune 30, 2014Cash and cash equivalents 351,934$ 3,398$ –$ 355,332$ Short-term investments 44,193 23,804 293 68,290 Pooled short-term investment funds 302,436 – – 302,436 U.S. government, state, municipal and agency obligations – 3,301,360 – 3,301,360 Corporate and foreign fixed income securities – 1,429,694 230,573 1,660,267 Asset-backed securities – 878,508 99,921 978,429 Equity securities 3,079,815 186,670 51,578 3,318,063 Alternative investments and other investments: Private equity and real estate funds 388 5,901 1,030,536 1,036,825 Hedge funds – – 3,303,800 3,303,800 Commodities funds and other investments 134 1,352 1,212,420 1,213,906 Assets not at fair value 516,046
Cash and investments 16,054,754$
Securities lending collateral, in other current assets –$ 3,341$ –$ 3,341$
Benefit plan assets, in other noncurrent assets 235,991 – 40,749 276,740
Interest rate swaps, in other noncurrent assets – 69,883 – 69,883
Investments sold, not yet purchased, in other noncurrent liabilities – 178,732 – 178,732
Interest rate swaps, included in other noncurrent liabilities – 189,659 – 189,659
Ascension
Notes to Consolidated Financial Statements (continued) (Dollars in Thousands)
1403-1210450 37
6. Fair Value Measurements (continued)
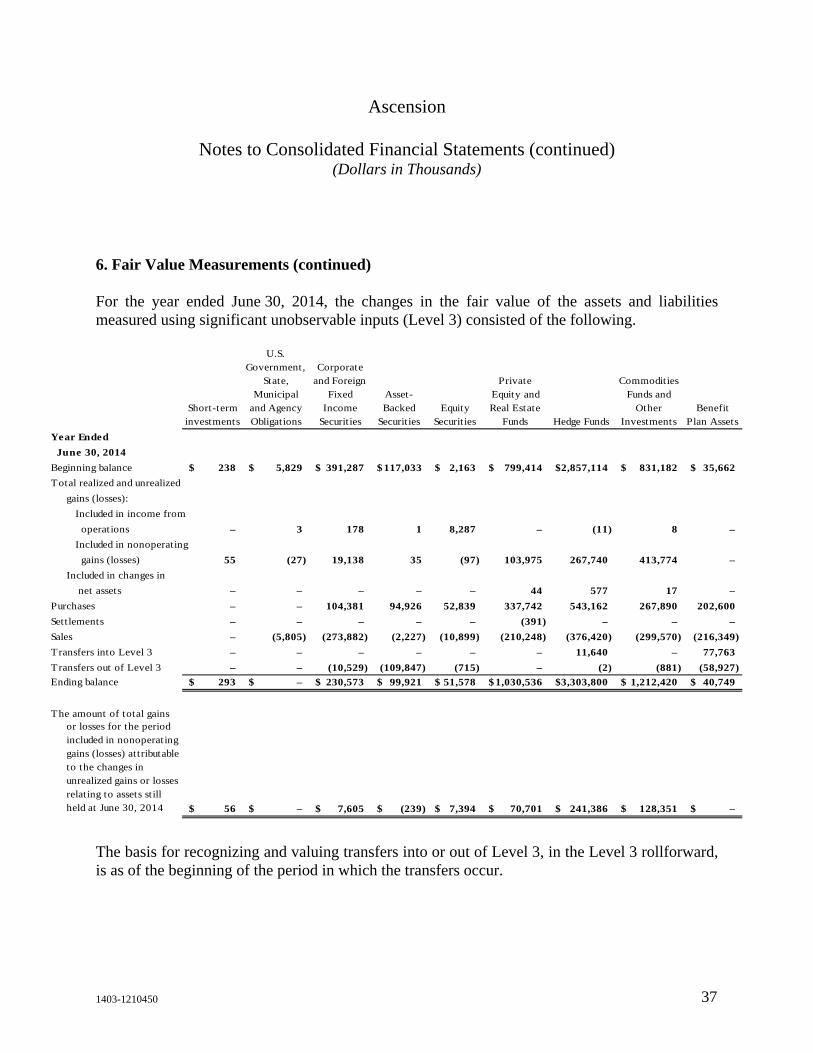
For the year ended June 30, 2014, the changes in the fair value of the assets and liabilities measured using significant unobservable inputs (Level 3) consisted of the following.
Short-term
investments
U.S. Government,
State, Municipal
and Agency Obligations
Corporate and Foreign
Fixed Income
Securities
Asset-Backed
SecuritiesEquity
Securities
Private Equity and Real Estate
Funds Hedge Funds
Commodities Funds and
Other Investments
Benefit Plan Assets
Year Ended
June 30, 2014
Beginning balance 238$ 5,829$ 391,287$ 117,033$ 2,163$ 799,414$ 2,857,114$ 831,182$ 35,662$
Total realized and unrealized
gains (losses):
Included in income from
operations – 3 178 1 8,287 – (11) 8 –
Included in nonoperating
gains (losses) 55 (27) 19,138 35 (97) 103,975 267,740 413,774 –
Included in changes in
net assets – – – – – 44 577 17 –
Purchases – – 104,381 94,926 52,839 337,742 543,162 267,890 202,600
Settlements – – – – – (391) – – –
Sales – (5,805) (273,882) (2,227) (10,899) (210,248) (376,420) (299,570) (216,349)
Transfers into Level 3 – – – – – – 11,640 – 77,763
Transfers out of Level 3 – – (10,529) (109,847) (715) – (2) (881) (58,927)
Ending balance 293$ –$ 230,573$ 99,921$ 51,578$ 1,030,536$ 3,303,800$ 1,212,420$ 40,749$
The amount of total gainsor losses for the period included in nonoperating gains (losses) attributable to the changes in unrealized gains or losses relating to assets still held at June 30, 2014 56$ –$ 7,605$ (239)$ 7,394$ 70,701$ 241,386$ 128,351$ –$
The basis for recognizing and valuing transfers into or out of Level 3, in the Level 3 rollforward, is as of the beginning of the period in which the transfers occur.
Ascension
Notes to Consolidated Financial Statements (continued) (Dollars in Thousands)
1403-1210450 38
6. Fair Value Measurements (continued)
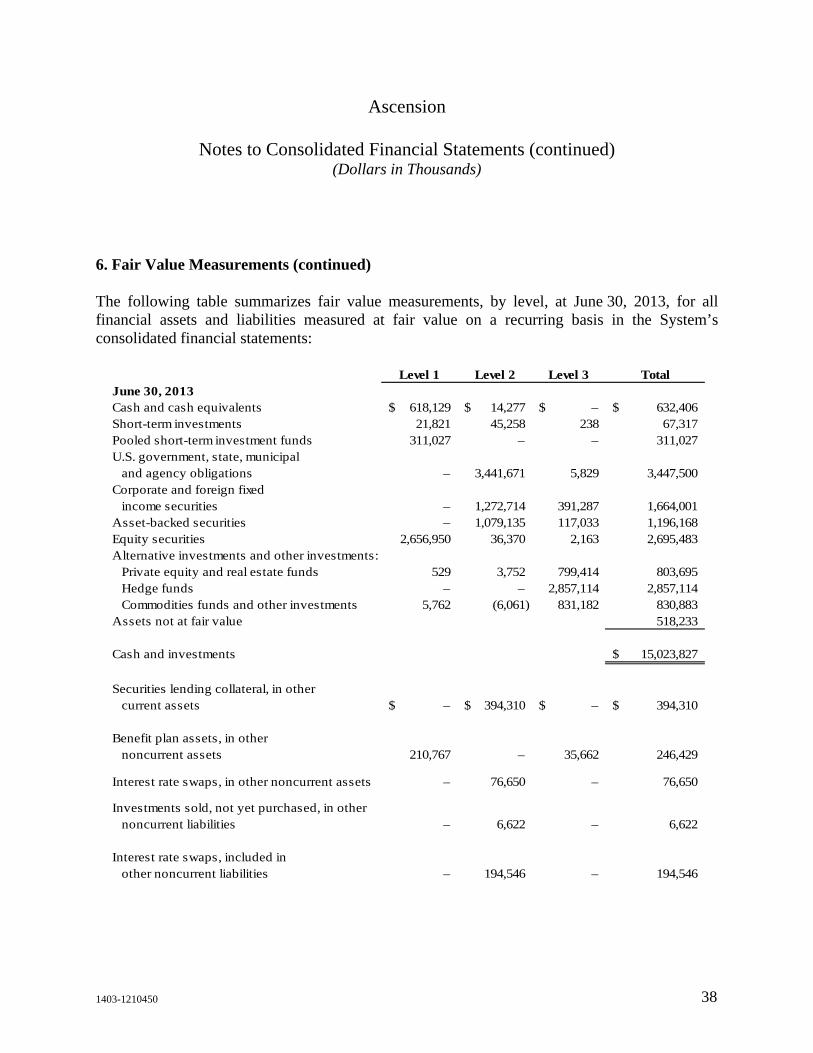
The following table summarizes fair value measurements, by level, at June 30, 2013, for all financial assets and liabilities measured at fair value on a recurring basis in the System’s consolidated financial statements:
Level 1 Level 2 Level 3 TotalJune 30, 2013Cash and cash equivalents 618,129$ 14,277$ –$ 632,406$ Short-term investments 21,821 45,258 238 67,317 Pooled short-term investment funds 311,027 – – 311,027 U.S. government, state, municipal and agency obligations – 3,441,671 5,829 3,447,500 Corporate and foreign fixed income securities – 1,272,714 391,287 1,664,001 Asset-backed securities – 1,079,135 117,033 1,196,168 Equity securities 2,656,950 36,370 2,163 2,695,483 Alternative investments and other investments: Private equity and real estate funds 529 3,752 799,414 803,695 Hedge funds – – 2,857,114 2,857,114 Commodities funds and other investments 5,762 (6,061) 831,182 830,883 Assets not at fair value 518,233
Cash and investments 15,023,827$
Securities lending collateral, in other current assets –$ 394,310$ –$ 394,310$
Benefit plan assets, in other noncurrent assets 210,767 – 35,662 246,429
Interest rate swaps, in other noncurrent assets – 76,650 – 76,650
Investments sold, not yet purchased, in other noncurrent liabilities – 6,622 – 6,622
Interest rate swaps, included in other noncurrent liabilities – 194,546 – 194,546

Ascension
Notes to Consolidated Financial Statements (continued) (Dollars in Thousands)
1403-1210450 39
6. Fair Value Measurements (continued)
For the year ended June 30, 2013, the changes in the fair value of the assets and liabilities measured using significant unobservable inputs (Level 3) consisted of the following. Level 3 investments of the Alpha Fund are included in transfers in the table below.
Short-term investments
U.S. Government,
State, Municipal
and Agency Obligations
Corporate and Foreign
Fixed Income
Securities
Asset-Backed
SecuritiesEquity
Securities
Private Equity and Real Estate
Funds Hedge Funds
Commodities Funds and
Other Investments
Benefit Plan Assets
Year Ended
June 30, 2013
Beginning balance –$ 7,437$ 120,418$ 15,297$ 13,118$ 593,753$ 1,887,407$ 615,813$ 35,373$
Total realized and unrealized
gains (losses):
Included in income from
operations – 16 242 10 1,489 – 123 (45) –
Included in nonoperating
gains (losses) 3 445 1,059 (227) 170 83,975 220,887 80,222 –
Included in changes in
net assets – – – – – – 293 27 –
Purchases – 169 328,980 122,703 718 188,085 981,414 401,957 44,150
Settlements – – – – – (25) – – (279)
Sales – (2,238) (58,928) (17,883) (13,372) (66,836) (232,198) (266,889) (41,668)
Transfers into Level 3 235 – 2,962 – 40 927 3,271 139 12,485
Transfers out of Level 3 – – (3,446) (2,867) – (465) (4,083) (42) (14,399)
Ending balance 238$ 5,829$ 391,287$ 117,033$ 2,163$ 799,414$ 2,857,114$ 831,182$ 35,662$
The amount of total gainsor losses for the period included in nonoperating gains (losses) attributable to the changes in unrealized gains or losses relating to assets still held at June 30, 2013 46$ 342$ (1,682)$ (751)$ 149$ 39,300$ 234,426$ (28,407)$ –$
The basis for recognizing and valuing transfers into or out of Level 3, in the Level 3 rollforward,
is as of the beginning of the period in which the transfers occur.
Ascension
Notes to Consolidated Financial Statements (continued) (Dollars in Thousands)
1403-1210450 40
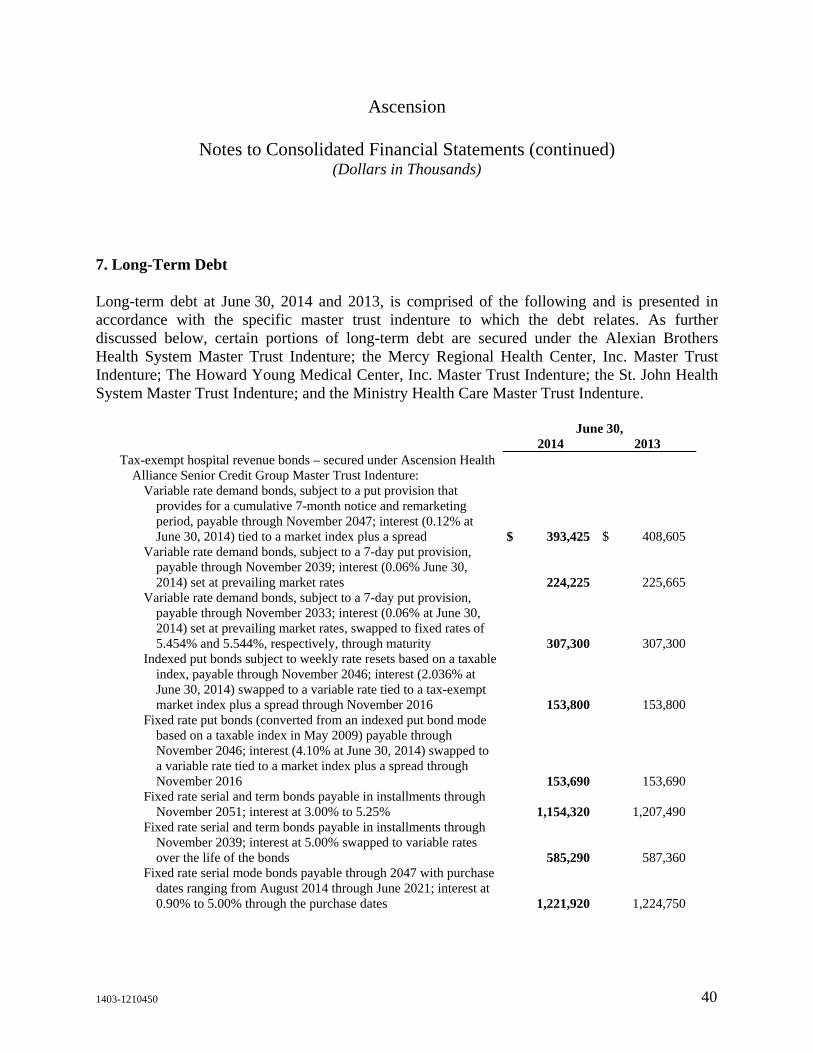
7. Long-Term Debt
Long-term debt at June 30, 2014 and 2013, is comprised of the following and is presented in accordance with the specific master trust indenture to which the debt relates. As further discussed below, certain portions of long-term debt are secured under the Alexian Brothers Health System Master Trust Indenture; the Mercy Regional Health Center, Inc. Master Trust Indenture; The Howard Young Medical Center, Inc. Master Trust Indenture; the St. John Health System Master Trust Indenture; and the Ministry Health Care Master Trust Indenture.
June 30, 2014 2013 Tax-exempt hospital revenue bonds – secured under Ascension Health
Alliance Senior Credit Group Master Trust Indenture: Variable rate demand bonds, subject to a put provision that
provides for a cumulative 7-month notice and remarketing period, payable through November 2047; interest (0.12% at June 30, 2014) tied to a market index plus a spread $ 393,425 $ 408,605
Variable rate demand bonds, subject to a 7-day put provision, payable through November 2039; interest (0.06% June 30, 2014) set at prevailing market rates 224,225 225,665
Variable rate demand bonds, subject to a 7-day put provision, payable through November 2033; interest (0.06% at June 30, 2014) set at prevailing market rates, swapped to fixed rates of 5.454% and 5.544%, respectively, through maturity 307,300 307,300
Indexed put bonds subject to weekly rate resets based on a taxable index, payable through November 2046; interest (2.036% at June 30, 2014) swapped to a variable rate tied to a tax-exempt market index plus a spread through November 2016 153,800 153,800
Fixed rate put bonds (converted from an indexed put bond mode based on a taxable index in May 2009) payable through November 2046; interest (4.10% at June 30, 2014) swapped to a variable rate tied to a market index plus a spread through November 2016 153,690 153,690
Fixed rate serial and term bonds payable in installments through November 2051; interest at 3.00% to 5.25% 1,154,320 1,207,490
Fixed rate serial and term bonds payable in installments through November 2039; interest at 5.00% swapped to variable rates over the life of the bonds 585,290 587,360
Fixed rate serial mode bonds payable through 2047 with purchase dates ranging from August 2014 through June 2021; interest at 0.90% to 5.00% through the purchase dates 1,221,920 1,224,750

Ascension
Notes to Consolidated Financial Statements (continued) (Dollars in Thousands)
1403-1210450 41
7. Long-Term Debt (continued)
June 30, 2014 2013 Tax-exempt hospital revenue bonds – unsecured under Ascension
Health Alliance Subordinate Master Trust Indenture: Variable rate demand bonds, subject to a 7-day put provision,
payable through November 2027; interest (0.06% at June 30, 2014) set at prevailing market rates $ 55,100 $ 56,060
Fixed rate serial mode bonds payable through 2027 with purchase dates through November 2019; interest at 0.32% to 5.00% 445,435 446,515
Taxable bonds – secured under Ascension Health Alliance Senior Credit Group Master Trust Indenture:
Taxable fixed rate term bonds payable in installments through November 2053; interest at 4.847% 425,000 425,000
Total hospital revenue bonds under Senior Master Trust Indenture and Subordinate Master Trust Indenture 5,119,505 5,196,235
Tax-exempt hospital revenue bonds – secured under Alexian Brothers
Health System Master Trust Indenture: Fixed rate serial and term bonds payable in installments through
February 2038; interest at 3.50% to 5.50% 153,710 157,000 Total hospital revenue bonds under the Alexian Brothers Health
System Master Trust Indenture 153,710 157,000 Tax-exempt hospital revenue bonds – secured under Mercy Regional
Health Center, Inc. Master Trust Indenture: Fixed rate serial and term bonds payable in installments through
November 2029; interest at 3.00% to 5.00% 24,040 25,060 Total hospital revenue bonds under the Mercy Regional Health Center,
Inc. Master Trust Indenture 24,040 25,060 Tax-exempt hospital revenue bonds – secured under The Howard
Young Medical Center, Inc. Master Trust Indenture: Fixed rate serial and term bonds payable in installments through
August 2030; interest at 3.00% to 5.00% 19,185 20,040 Total hospital revenue bonds under The Howard Young Medical
Center, Inc. Master Trust Indenture 19,185 20,040
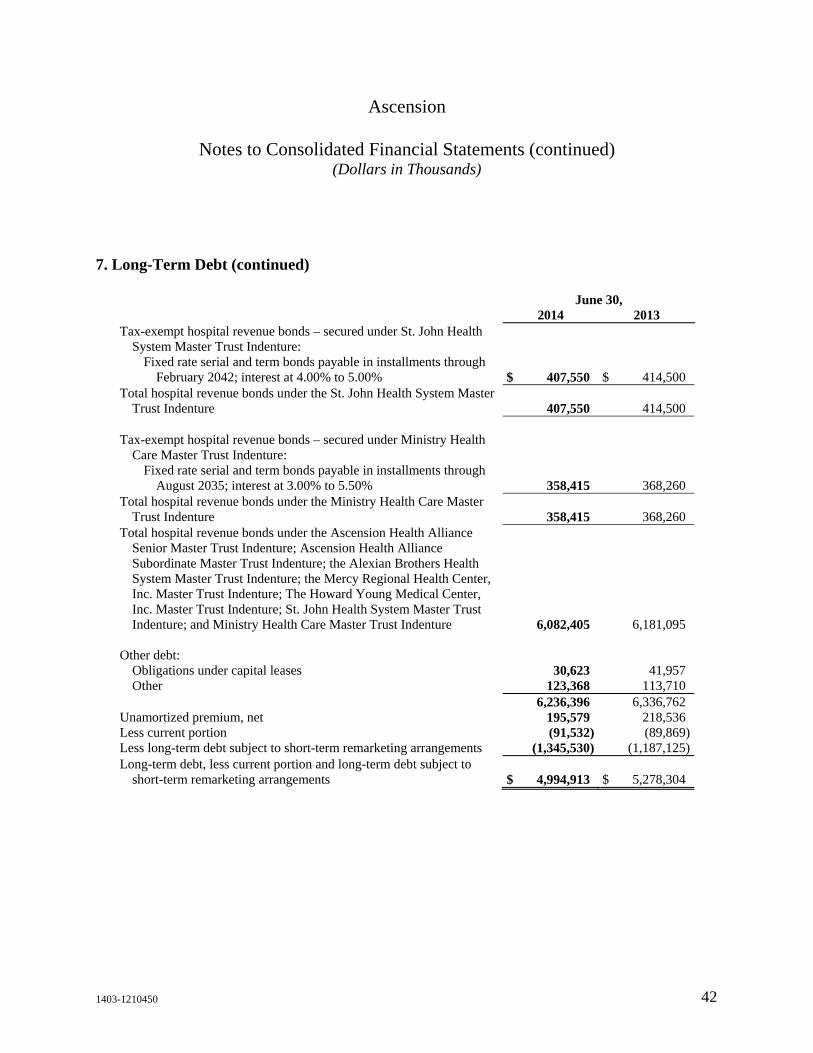
Ascension
Notes to Consolidated Financial Statements (continued) (Dollars in Thousands)
1403-1210450 42
7. Long-Term Debt (continued)
June 30, 2014 2013 Tax-exempt hospital revenue bonds – secured under St. John Health
System Master Trust Indenture: Fixed rate serial and term bonds payable in installments through
February 2042; interest at 4.00% to 5.00% $ 407,550 $ 414,500 Total hospital revenue bonds under the St. John Health System Master
Trust Indenture 407,550 414,500 Tax-exempt hospital revenue bonds – secured under Ministry Health
Care Master Trust Indenture: Fixed rate serial and term bonds payable in installments through
August 2035; interest at 3.00% to 5.50% 358,415 368,260 Total hospital revenue bonds under the Ministry Health Care Master
Trust Indenture 358,415 368,260 Total hospital revenue bonds under the Ascension Health Alliance
Senior Master Trust Indenture; Ascension Health Alliance Subordinate Master Trust Indenture; the Alexian Brothers Health System Master Trust Indenture; the Mercy Regional Health Center, Inc. Master Trust Indenture; The Howard Young Medical Center, Inc. Master Trust Indenture; St. John Health System Master Trust Indenture; and Ministry Health Care Master Trust Indenture 6,082,405 6,181,095
Other debt:
Obligations under capital leases 30,623 41,957 Other 123,368 113,710
6,236,396 6,336,762 Unamortized premium, net 195,579 218,536 Less current portion (91,532) (89,869)Less long-term debt subject to short-term remarketing arrangements (1,345,530) (1,187,125)Long-term debt, less current portion and long-term debt subject to
short-term remarketing arrangements $ 4,994,913 $ 5,278,304

Ascension
Notes to Consolidated Financial Statements (continued) (Dollars in Thousands)
1403-1210450 43
7. Long-Term Debt (continued)
June 30, 2014 2013 Ascension Health Alliance Senior Master Trust Indenture long-term
debt obligations, including unamortized premium, net $ 3,329,323 $ 3,579,334 Ascension Health Alliance Subordinate Master Trust Indenture long-
term debt obligations, including unamortized premium, net 505,843 511,009 Alexian Brothers Health System Master Trust Indenture long-term
debt obligations, including unamortized premium, net 160,965 162,594 Mercy Regional Health Center, Inc. Master Trust Indenture long-term
debt obligations, including unamortized premium, net 25,498 27,258 The Howard Young Medical Center, Inc. Master Trust Indenture long-
term debt obligations, including unamortized premium, net 19,942 20,933 St. John Health System Master Trust Indenture long-term debt
obligations, including unamortized premium, net 429,154 437,503 Ministry Health Care Master Trust Indenture long-term debt
obligations, including unamortized premium, net 381,144 394,781 Other 143,044 144,892 Long-term debt, less current portion, and long-term debt subject to
short-term remarketing arrangements $ 4,994,913 $ 5,278,304
Scheduled principal repayments of long-term debt, considering obligations subject to short-term remarketing as due according to their long-term amortization schedule, as of June 30, 2014, are as follows:
Ascension Health
Alliance MTIs
Alexian Brothers
Health System
MTI
Mercy Regional
Health Center, Inc. MTI
The Howard Young
Medical Center, Inc.
MTI
St. John Health System
MTI
Ministry Health
Care MTI Other Debt Total
Year ending June 30:
2015 59,835$ 340$ 1,045$ 875$ 7,305$ 11,185$ 10,947$ 91,532$ 2016 50,130 7,485 1,080 910 7,680 11,665 22,513 101,463 2017 65,945 13,130 1,125 945 8,070 12,185 9,200 110,600 2018 69,045 15,655 1,175 975 6,890 12,890 35,710 142,340 2019 85,230 5,735 1,230 1,000 7,230 12,265 8,908 121,598 Thereafter 4,789,320 111,365 18,385 14,480 370,375 298,225 66,713 5,668,863
Total 5,119,505$ 153,710$ 24,040$ 19,185$ 407,550$ 358,415$ 153,991$ 6,236,396$
Ascension
Notes to Consolidated Financial Statements (continued) (Dollars in Thousands)
1403-1210450 44
7. Long-Term Debt (continued)
The carrying amounts of variable rate bonds and other notes payable approximate fair value. The fair values of the unsecured fixed rate serial and term bonds are obtained from independent public valuation services. The fair value of fixed rate serial and term bonds, including the component of variable rate demand bonds subject to long-term fixed interest rates, approximates carrying value at June 30, 2014 and 2013. During the years ended June 30, 2014 and 2013, interest paid was approximately $223,000 and $170,000, respectively. Capitalized interest was approximately $5,500 and $5,400 for the years ended June 30, 2014 and 2013, respectively.
Certain members of the System formed the Ascension Health Alliance Credit Group (Senior Credit Group). Each Senior Credit Group member is identified as either a senior obligated group member, a senior designated affiliate, or a senior limited designated affiliate. Senior obligated group members are jointly and severally liable under a Senior Master Trust Indenture (Senior MTI) to make all payments required with respect to obligations under the Senior MTI and may be entities not controlled directly or indirectly by the System. Senior designated affiliates and senior limited designated affiliates are not obligated to make debt service payments on the obligations under the Senior MTI. The System may cause each senior designated affiliate to transfer such amounts as are necessary to enable the obligated group to comply with the terms of the Senior MTI, including payment of the outstanding obligations. Additionally, each senior limited designated affiliate has an independent limited designated affiliate agreement and promissory note with the System with stipulated repayment terms and conditions, each subject to the governing law of the senior limited designated affiliate’s state of incorporation.
Pursuant to a Supplemental Master Indenture dated February 1, 2005, senior obligated group members, which are operating entities, have pledged and assigned to the Master Trustee a security interest in all of their rights, title, and interest in their pledged revenues and proceeds thereof.
A Subordinate Credit Group, which is comprised of subordinate obligated group members, subordinate designated affiliates, and subordinate limited designated affiliates, was created under the Subordinate Master Trust Indenture (Subordinate MTI). The subordinate obligated group members are jointly and severally liable under the Subordinate MTI to make all payments required with respect to obligations under the Subordinate MTI and may be entities not controlled directly or indirectly by the System. Subordinate designated affiliates and subordinate limited designated affiliates are not obligated to make debt service payments on the obligations under the Subordinate MTI. The System may cause each subordinate designated affiliate to

Ascension
Notes to Consolidated Financial Statements (continued) (Dollars in Thousands)
1403-1210450 45
7. Long-Term Debt (continued)
transfer such amounts as are necessary to enable the obligated group members to comply with the terms of the Subordinate MTI, including payment of the outstanding obligations. Additionally, each subordinate limited designated affiliate has an independent subordinate limited designated affiliate agreement and promissory note with the System, with stipulated repayment terms and conditions, each subject to the governing law of the subordinate limited designated affiliate’s state of incorporation.
The unsecured variable rate demand bonds of both the Senior and Subordinate Credit Groups, while subject to long-term amortization periods, may be put to the System at the option of the bondholders in connection with certain remarketing dates. To the extent that bondholders may, under the terms of the debt, put their bonds within 12 months after June 30, 2014, the principal amount of such bonds has been classified as a current liability in the accompanying Consolidated Balance Sheets. Management believes the likelihood of a material amount of bonds being put to the System to be remote. However, to address this possibility, management has taken steps to provide various sources of liquidity in the event any bonds would be put, including the line of credit, commercial paper program, and maintaining unrestricted assets as a source of self-liquidity.
On January 1, 2012, Alexian Brothers became part of the System. Subsequently, the System redeemed or refinanced a portion of Alexian Brothers’ debt; however, a portion of the bonds previously issued for the benefit of Alexian Brothers remains outstanding (the Alexian Brothers’ Bonds). The Alexian Brothers’ Bonds continue to be secured by the Alexian Brothers Health System Master Trust Indenture (As Amended and Restated), dated October 1, 1992, between the Members of the Alexian Brothers Health System Obligated Group established under this document and the Alexian Brothers Health System Master Trustee.
On April 1, 2013, Marian Health System joined Ascension Health. Subsequently, the System redeemed or refinanced a portion of the debt of the Marian Systems; however, a portion of the bonds previously issued for the benefit of the Marian Systems remains outstanding. These bonds continue to be secured by the respective Master Trust Indentures, including the Amended and Restated Master Trust Indenture dated October 1, 1999, by and between St. John Health System and the St. John Health Master Trustee; the Master Trust Indenture dated October 1, 1984, by and between Ministry Health Care and the Ministry Health Care Master Trustee; the Master Trust Indenture dated August 15, 1993, between The Howard Young Medical Center, Inc., a subsidiary of Ministry Health Care, and The Howard Young Medical Center, Inc. Master

Ascension
Notes to Consolidated Financial Statements (continued) (Dollars in Thousands)
1403-1210450 46
7. Long-Term Debt (continued)
Trustee; and the Master Trust Indenture dated January 15, 2013, between Mercy Regional Health Center, Inc. (a subsidiary of Via Christi Health) and the Mercy Regional Health Center, Inc. Master Trustee.
In June 2013, the System issued a total of $521,865 of tax-exempt bonds, Series 2013A and 2013B, through the Wisconsin issuing authority. In June 2013, the System also issued a total of $425,000 of taxable bonds, Series 2013A. The proceeds of the bonds, including original issue premium, were used to refinance debt and general corporate purposes.
Due to aggregate financing activity during the fiscal years ended June 30, 2014 and 2013, losses on extinguishment of debt of $1,605 and $4,079, respectively, were recorded, which are included in nonoperating gains (losses) in the accompanying Consolidated Statements of Operations and Changes in Net Assets.
The System is a party to multiple interest rate swap agreements that convert the variable or fixed rates of certain debt issues to fixed or variable rates, respectively. See the Derivative Instruments note for a discussion of these derivatives.
As of June 30, 2014, the Senior Credit Group has a line of credit of $1,000,000 which may be used as a source of funding for unremarketed variable debt (including commercial paper) or for general corporate purposes, towards which bank commitments totaling $1,000,000 extend to November 9, 2014. As of June 30, 2014 and 2013, there were no borrowings under the line of credit.
As of June 30, 2014, the Senior Credit Group has a $75,000 revolving line of credit related to its letters of credit program toward which a bank commitment of $75,000 extends to November 26, 2014. The revolving line of credit may be accessed solely in the form of Letters of Credit issued by the bank for the benefit of the members of the Credit Groups. Of this $75,000 revolving line of credit, letters of credit totaling $57,455 have been issued as of June 30, 2014. No borrowings were outstanding under the letters of credit as of June 30, 2014 and 2013.

Ascension
Notes to Consolidated Financial Statements (continued) (Dollars in Thousands)
1403-1210450 47
8. Derivative Instruments
The System uses interest rate swap agreements to manage interest rate risk associated with its outstanding debt. Interest rate swaps with varying characteristics are outstanding under the Master Trust Indentures of the System, Alexian Brothers, Ministry Health Care, and St. John Health. These swaps have historically been used to effectively convert interest rates on variable rate bonds to fixed rates and rates on fixed rate bonds to variable rates. At June 30, 2014 and 2013, the notional values of outstanding interest rate swaps were as follows:
2014 2013
Ascension Health Alliance MTI 2,128,757$ 2,128,757$ Alexian Brothers Health System MTI 39,220 47,220 Ministry Health Care MTI 192,950 270,880 St. John Health System MTI 100,000 125,000 Total 2,460,927$ 2,571,857$
June 30,
The System recognizes the fair value of its interest rate swaps in the Consolidated Balance Sheets as assets, recorded in other noncurrent assets, or liabilities, recorded in other noncurrent liabilities, as appropriate. The respective fair values of interest rate swaps in an asset and liability position for the System, Alexian Brothers, Ministry Health Care and St. John Health were as follows:
Asset Liability Asset Liability
Ascension Health Alliance MTI 66,981$ 169,031$ 73,846$ 174,413$ Alexian Brothers Health System MTI – 1,934 – 2,685 Ministry Health Care MTI 2,902 17,938 2,804 16,492 St. John Health System MTI – 756 – 956 Total 69,883$ 189,659$ 76,650$ 194,546$
June 30, 2014 June 30, 2013
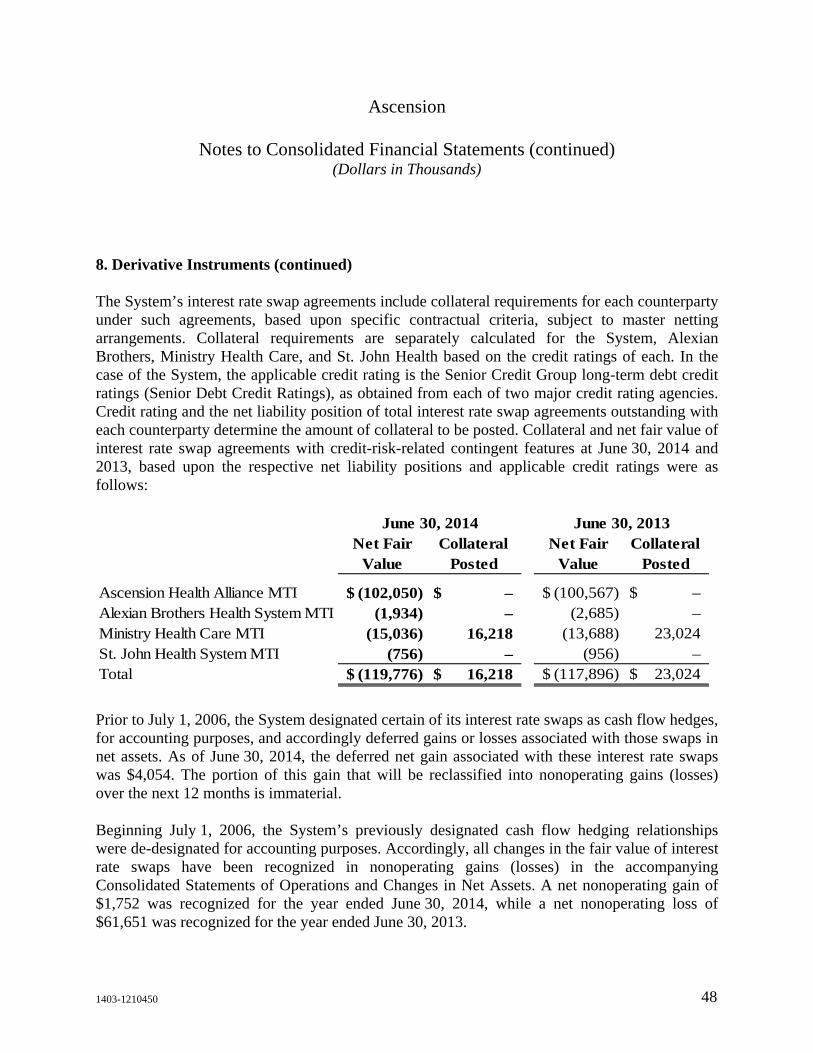
Ascension
Notes to Consolidated Financial Statements (continued) (Dollars in Thousands)
1403-1210450 48
8. Derivative Instruments (continued)
The System’s interest rate swap agreements include collateral requirements for each counterparty under such agreements, based upon specific contractual criteria, subject to master netting arrangements. Collateral requirements are separately calculated for the System, Alexian Brothers, Ministry Health Care, and St. John Health based on the credit ratings of each. In the case of the System, the applicable credit rating is the Senior Credit Group long-term debt credit ratings (Senior Debt Credit Ratings), as obtained from each of two major credit rating agencies. Credit rating and the net liability position of total interest rate swap agreements outstanding with each counterparty determine the amount of collateral to be posted. Collateral and net fair value of interest rate swap agreements with credit-risk-related contingent features at June 30, 2014 and 2013, based upon the respective net liability positions and applicable credit ratings were as follows:
Net Fair Value
Collateral Posted
Net Fair Value
Collateral Posted
Ascension Health Alliance MTI (102,050)$ –$ (100,567)$ –$ Alexian Brothers Health System MTI (1,934) – (2,685) – Ministry Health Care MTI (15,036) 16,218 (13,688) 23,024 St. John Health System MTI (756) – (956) – Total (119,776)$ 16,218$ (117,896)$ 23,024$
June 30, 2014 June 30, 2013
Prior to July 1, 2006, the System designated certain of its interest rate swaps as cash flow hedges, for accounting purposes, and accordingly deferred gains or losses associated with those swaps in net assets. As of June 30, 2014, the deferred net gain associated with these interest rate swaps was $4,054. The portion of this gain that will be reclassified into nonoperating gains (losses) over the next 12 months is immaterial.
Beginning July 1, 2006, the System’s previously designated cash flow hedging relationships were de-designated for accounting purposes. Accordingly, all changes in the fair value of interest rate swaps have been recognized in nonoperating gains (losses) in the accompanying Consolidated Statements of Operations and Changes in Net Assets. A net nonoperating gain of $1,752 was recognized for the year ended June 30, 2014, while a net nonoperating loss of $61,651 was recognized for the year ended June 30, 2013.

Ascension
Notes to Consolidated Financial Statements (continued) (Dollars in Thousands)
1403-1210450 49
9. Retirement Plans
Defined-Benefit Plans
Certain System entities participate in defined-benefit pension plans (the System Plans), which are noncontributory, defined-benefit pension plans covering substantially all eligible employees of certain System entities. Benefits are based on each participant’s years of service and compensation. All of the System Plans’ assets are invested in Trusts, which include the Master Pension Trust (the Trust) and other trusts (the Other Trusts). The System Plans’ assets primarily consist of cash and cash equivalents, equity, fixed income funds, and alternative investments, consisting of various hedge funds, real estate funds, private equity funds, commodity funds, private credit funds, and certain other private funds. Contributions to the System Plans are based on actuarially determined amounts sufficient to meet the benefits to be paid to participants.
During previous fiscal years, the System approved and communicated to employees a redesign of associate retirement benefits, which affects certain System Plans, as well as provides an enhanced comprehensive defined contribution plan. This redesign resulted in the recognition of a curtailment gain of $73,198, for the year ended June 30, 2013, which was recognized in total impairment, restructuring, and nonrecurring losses, net for the year ended June 30, 2013. This redesign resulted in a decrease to the projected benefit obligation and is included in pension and other postretirement liabilities in the Consolidated Balance Sheets.
The assets of the System Plans are available to pay the benefits of eligible employees and retirees of all participating entities. In the event entities participating in the System Plans are unable to fulfill their financial obligations under the System Plans, the other participating entities are obligated to do so.
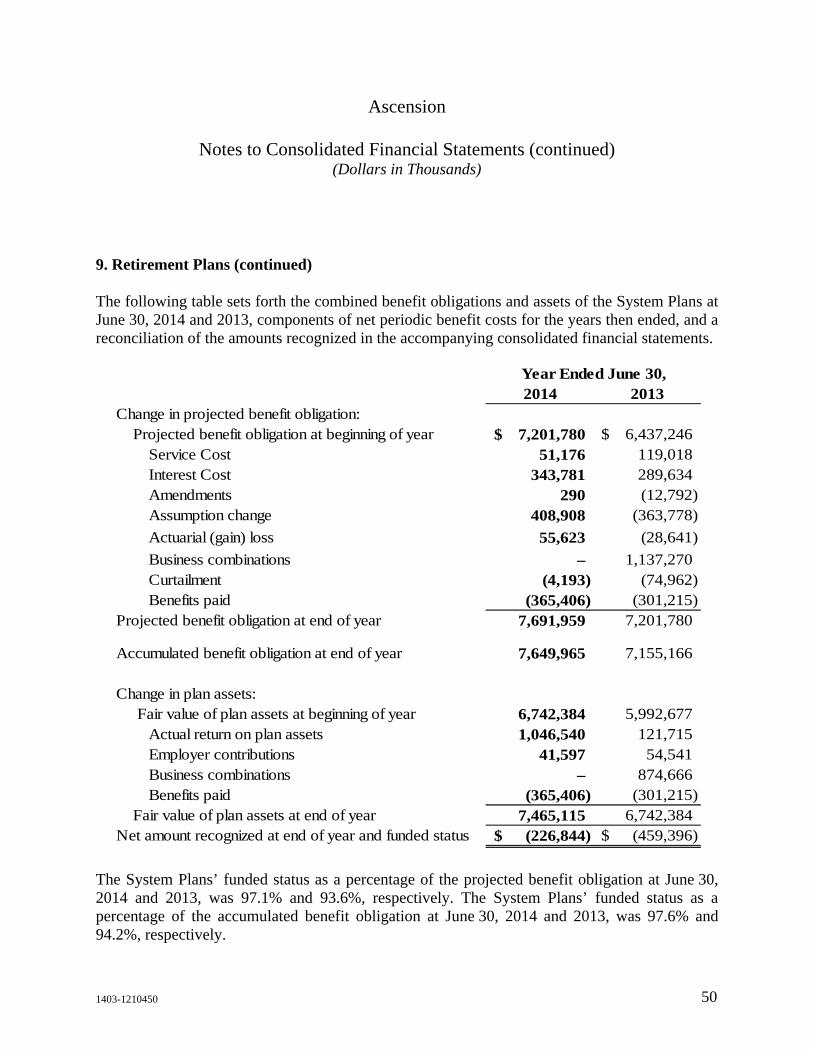
Ascension
Notes to Consolidated Financial Statements (continued) (Dollars in Thousands)
1403-1210450 50
9. Retirement Plans (continued)
The following table sets forth the combined benefit obligations and assets of the System Plans at June 30, 2014 and 2013, components of net periodic benefit costs for the years then ended, and a reconciliation of the amounts recognized in the accompanying consolidated financial statements.
2014 2013Change in projected benefit obligation: Projected benefit obligation at beginning of year 7,201,780$ 6,437,246$
Service Cost 51,176 119,018 Interest Cost 343,781 289,634 Amendments 290 (12,792) Assumption change 408,908 (363,778)
Actuarial (gain) loss 55,623 (28,641)
Business combinations – 1,137,270 Curtailment (4,193) (74,962) Benefits paid (365,406) (301,215)
Projected benefit obligation at end of year 7,691,959 7,201,780
Accumulated benefit obligation at end of year 7,649,965 7,155,166
Change in plan assets: Fair value of plan assets at beginning of year 6,742,384 5,992,677
Actual return on plan assets 1,046,540 121,715 Employer contributions 41,597 54,541 Business combinations – 874,666 Benefits paid (365,406) (301,215)
Fair value of plan assets at end of year 7,465,115 6,742,384 Net amount recognized at end of year and funded status (226,844)$ (459,396)$
Year Ended June 30,
The System Plans’ funded status as a percentage of the projected benefit obligation at June 30, 2014 and 2013, was 97.1% and 93.6%, respectively. The System Plans’ funded status as a percentage of the accumulated benefit obligation at June 30, 2014 and 2013, was 97.6% and 94.2%, respectively.
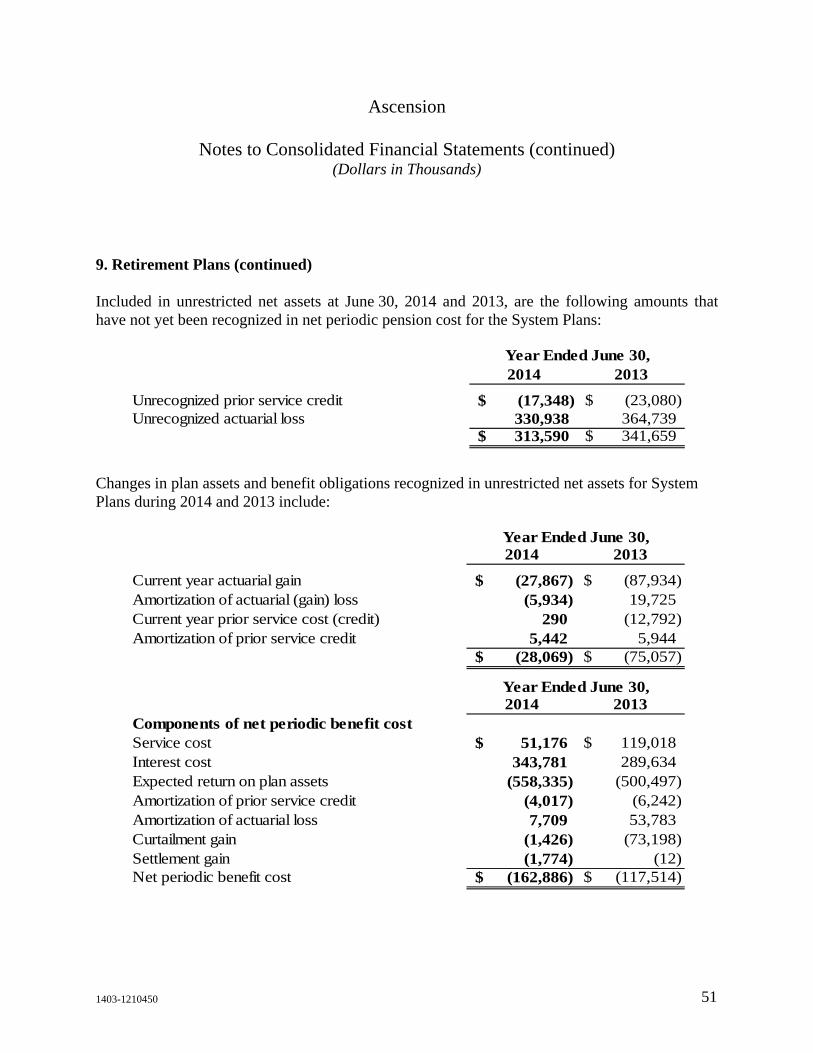
Ascension
Notes to Consolidated Financial Statements (continued) (Dollars in Thousands)
1403-1210450 51
9. Retirement Plans (continued)
Included in unrestricted net assets at June 30, 2014 and 2013, are the following amounts that have not yet been recognized in net periodic pension cost for the System Plans:
2014 2013
Unrecognized prior service credit (17,348)$ (23,080)$ Unrecognized actuarial loss 330,938 364,739
313,590$ 341,659$
Year Ended June 30,
Changes in plan assets and benefit obligations recognized in unrestricted net assets for System Plans during 2014 and 2013 include:
2014 2013
Current year actuarial gain (27,867)$ (87,934)$ Amortization of actuarial (gain) loss (5,934) 19,725 Current year prior service cost (credit) 290 (12,792) Amortization of prior service credit 5,442 5,944
(28,069)$ (75,057)$
2014 2013Components of net periodic benefit costService cost 51,176$ 119,018$ Interest cost 343,781 289,634 Expected return on plan assets (558,335) (500,497) Amortization of prior service credit (4,017) (6,242) Amortization of actuarial loss 7,709 53,783 Curtailment gain (1,426) (73,198) Settlement gain (1,774) (12) Net periodic benefit cost (162,886)$ (117,514)$
Year Ended June 30,
Year Ended June 30,

Ascension
Notes to Consolidated Financial Statements (continued) (Dollars in Thousands)
1403-1210450 52
9. Retirement Plans (continued)
The prior service credit and actuarial gain included in unrestricted net assets and expected to be recognized in net periodic pension cost during the year ending June 30, 2015, are $4,000 and $24,955, respectively.
The assumptions used to determine the benefit obligation and net periodic benefit cost for the System Plans are set forth below:
2014 2013
Weighted-average discount rate 4.35% 4.88%Weighted-average rate of compensation increase 3.81% 3.81%Weighted-average expected long-term rate of
return on plan assets 8.30% 8.30%
June 30,
The System Plans’ assets invested in the Trust are invested in a portfolio designed to protect principal and obtain competitive investment returns and long-term investment growth, consistent with actuarial assumptions, with a reasonable and prudent level of risk. Diversification is achieved by allocating to funds and managers that correlate to one of three economic strategies: growth, deflation, and inflation. Growth strategies include U.S. equity, emerging market equity, global equity, international equity, directional hedge funds, private equity, high yield, and private credit. Deflation strategies include core fixed income, absolute return hedge funds, and cash. Inflation strategies include inflation-linked bonds, commodity-related investments, and real assets. The System Plans use multiple investment managers with complementary styles, philosophies, and approaches. In accordance with the System Plans’ objectives, derivatives may also be used to gain market exposure in an efficient and timely manner.

Ascension
Notes to Consolidated Financial Statements (continued) (Dollars in Thousands)
1403-1210450 53
9. Retirement Plans (continued)
In accordance with the System Plans’ asset diversification targets, as presented in the table that follows, the Trust holds certain alternative investments, consisting of various hedge funds, real asset funds, private equity funds, commodity funds, private credit funds, and certain other private funds. These investments do not have observable market values. As such, each of these investments is valued at net asset value as determined by each fund’s investment manager, which approximates fair value. The fair value of the System Plans’ alternative investments in the Trust as of June 30, 2014, is reported in the fair value measurement table that follows. Collectively, these funds have liquidity terms ranging from daily to annual with notice periods ranging from 1 to 180 days. Due to redemption restrictions, investments of certain private funds, whose fair value was approximately $1,313,000 at June 30, 2014, cannot be redeemed. However, the potential for the System Plans to sell their interest in real asset funds and private equity funds in a secondary market prior to the end of the fund term does exist.
The investments in these alternative investment funds may also include contractual commitments to provide capital contributions during the investment period, which is typically five years, and may extend to the end of the fund term. During these contractual periods, investment managers may require the System Plans to invest in accordance with the terms of the agreement. Commitments not funded during the investment period will expire and remain unfunded. As of June 30, 2014, investment periods expire between July 2014 and March 2018. The remaining unfunded capital commitments of the Trust total approximately $416,000 for 62 individual contracts as of June 30, 2014.
The weighted-average asset allocation for the System Plans in the Trust at the end of fiscal 2014 and 2013 and the target allocation for fiscal 2015, by asset category, are as follows:
TargetAllocation
2015 2014 2013
Growth 50% 53% 52%Deflation 30 29 29Inflation 20 18 19Total 100% 100% 100%
Percentage of Plan AssetsAt Year-End
Asset Category

Ascension
Notes to Consolidated Financial Statements (continued) (Dollars in Thousands)
1403-1210450 54
9. Retirement Plans (continued)
The System Plans’ assets in the Other Trusts are invested in portfolios designed to best serve the participants of the System Plans’ through a long-term investment strategy designed to ensure that funds are available to pay benefits as they become due and to maximize the total return at a prudent level of investment risk. The System Plans’ assets invested in the Other Trusts are diversified among various assets classes based upon established investment guidelines.
TargetAllocation
2015 2014 2013
Cash 1% 1% 6%Growth 62 67 61Income 32 28 25Other 5 4 8
Total 100% 100% 100%
Percentage of Plan AssetsAt Year-End
Asset Category

Ascension
Notes to Consolidated Financial Statements (continued) (Dollars in Thousands)
1403-1210450 55
9. Retirement Plans (continued)
The following tables summarize fair value measurements at June 30, 2014 and 2013, by asset class and by level, for the System Plans’ assets and liabilities. As also discussed in the Fair Value Measurements note, the System follows the three-level fair value hierarchy to categorize plan assets and liabilities recognized at fair value, which prioritizes the inputs used to measure such fair values. The inputs and valuation techniques discussed in the Fair Value Measurements note also apply to the System Plans’ assets and liabilities as presented in the following tables.
Level 1 Level 2 Level 3 TotalJune 30, 2014Short-term investments 191,495$ 399$ –$ 191,894$ Derivatives receivable 7 15,245 19,404 34,656 U.S. government, state, municipal and agency obligations – 1,704,131 – 1,704,131 Corporate and foreign fixed income securities – 673,696 47,850 721,546 Asset-backed securities – 232,484 24,080 256,564 Equity securities 1,649,136 395,372 3,045 2,047,553 Alternative investments and other investments: Private equity and real estate funds – – 909,980 909,980 Hedge funds – – 1,448,274 1,448,274 Commodities funds and other investments – – 295,563 295,563 Assets not at fair value 154,023 Total 7,764,184
Derivatives payable 26 160,907 2,980 163,913 Investments sold, not yet purchased 1,555 – – 1,555 Liabilities not at fair value 133,601 Total 299,069 Fair value of plan assets 7,465,115$
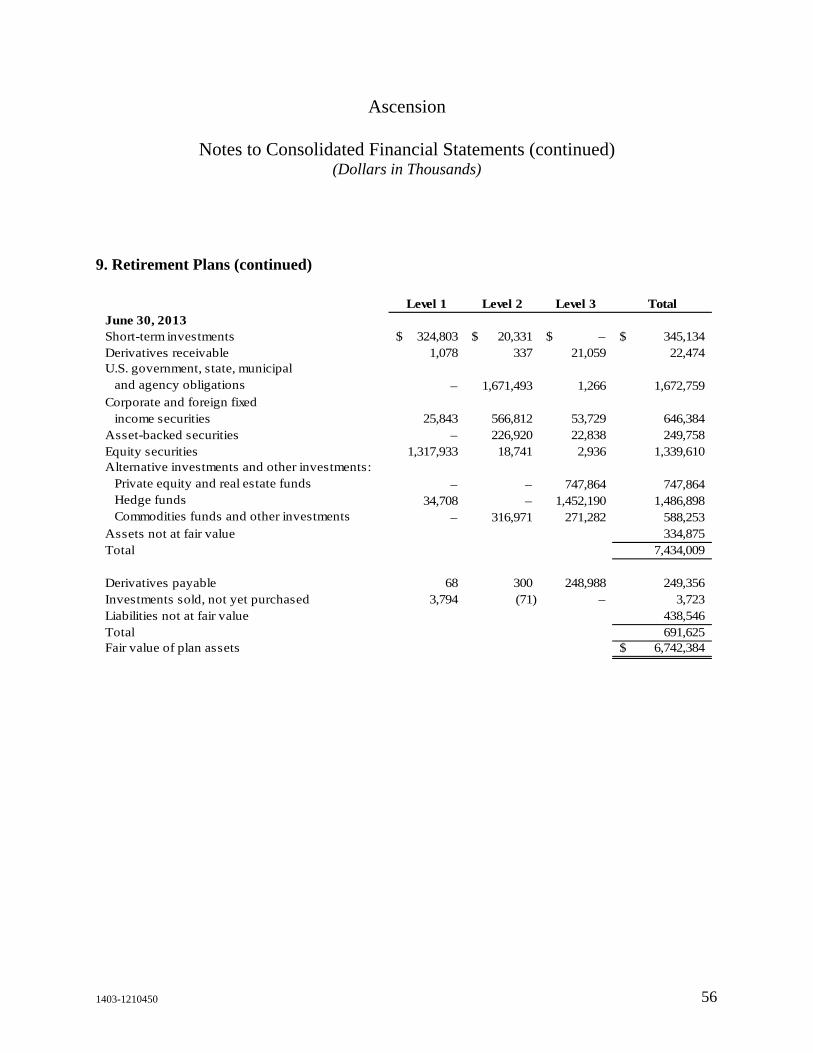
Ascension
Notes to Consolidated Financial Statements (continued) (Dollars in Thousands)
1403-1210450 56
9. Retirement Plans (continued)
Level 1 Level 2 Level 3 TotalJune 30, 2013Short-term investments 324,803$ 20,331$ –$ 345,134$ Derivatives receivable 1,078 337 21,059 22,474 U.S. government, state, municipal and agency obligations – 1,671,493 1,266 1,672,759 Corporate and foreign fixed income securities 25,843 566,812 53,729 646,384 Asset-backed securities – 226,920 22,838 249,758 Equity securities 1,317,933 18,741 2,936 1,339,610 Alternative investments and other investments: Private equity and real estate funds – – 747,864 747,864 Hedge funds 34,708 – 1,452,190 1,486,898 Commodities funds and other investments – 316,971 271,282 588,253 Assets not at fair value 334,875 Total 7,434,009
Derivatives payable 68 300 248,988 249,356 Investments sold, not yet purchased 3,794 (71) – 3,723 Liabilities not at fair value 438,546 Total 691,625 Fair value of plan assets 6,742,384$
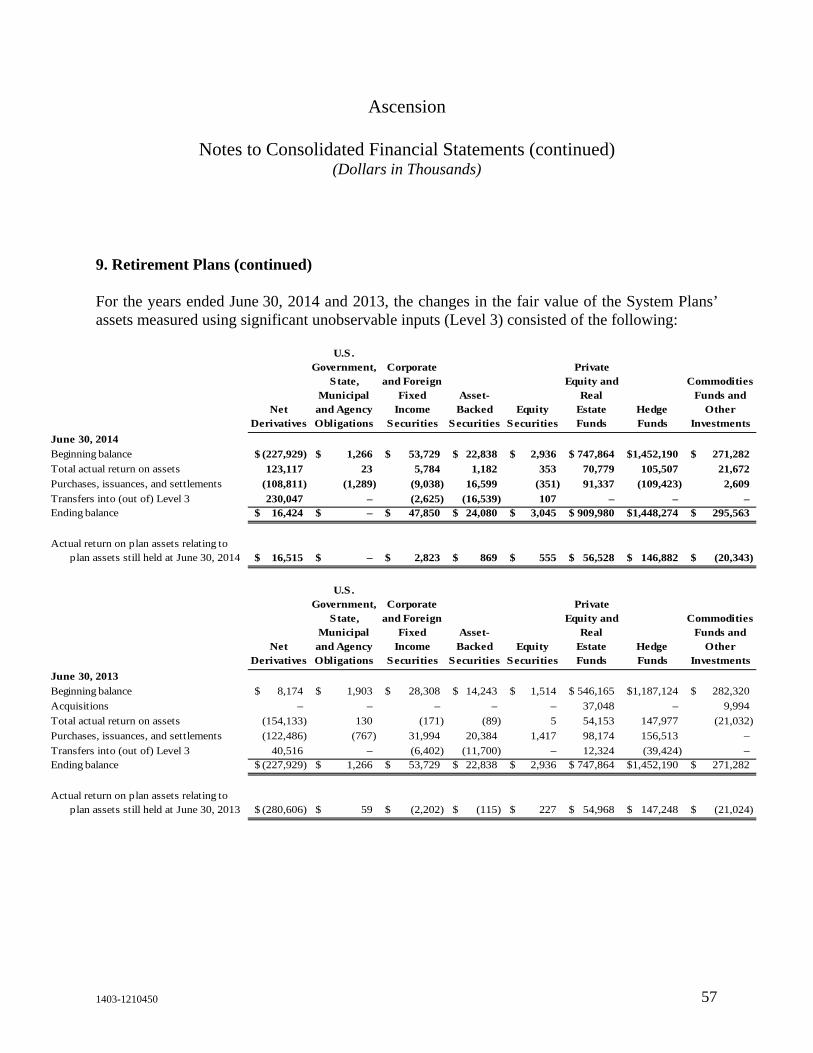
Ascension
Notes to Consolidated Financial Statements (continued) (Dollars in Thousands)
1403-1210450 57
9. Retirement Plans (continued)
For the years ended June 30, 2014 and 2013, the changes in the fair value of the System Plans’ assets measured using significant unobservable inputs (Level 3) consisted of the following:
Net Derivatives
U.S. Government,
State, Municipal
and Agency Obligations
Corporate and Foreign
Fixed Income
Securities
Asset-Backed
SecuritiesEquity
Securities
Private Equity and
Real Estate Funds
Hedge Funds
Commodities Funds and
Other Investments
June 30, 2014
Beginning balance (227,929)$ 1,266$ 53,729$ 22,838$ 2,936$ 747,864$ 1,452,190$ 271,282$
Total actual return on assets 123,117 23 5,784 1,182 353 70,779 105,507 21,672
Purchases, issuances, and settlements (108,811) (1,289) (9,038) 16,599 (351) 91,337 (109,423) 2,609
Transfers into (out of) Level 3 230,047 – (2,625) (16,539) 107 – – – Ending balance 16,424$ –$ 47,850$ 24,080$ 3,045$ 909,980$ 1,448,274$ 295,563$
Actual return on plan assets relating toplan assets still held at June 30, 2014 16,515$ –$ 2,823$ 869$ 555$ 56,528$ 146,882$ (20,343)$
Net Derivatives
U.S. Government,
State, Municipal
and Agency Obligations
Corporate and Foreign
Fixed Income
Securities
Asset-Backed
SecuritiesEquity
Securities
Private Equity and
Real Estate Funds
Hedge Funds
Commodities Funds and
Other Investments
June 30, 2013
Beginning balance 8,174$ 1,903$ 28,308$ 14,243$ 1,514$ 546,165$ 1,187,124$ 282,320$
Acquisitions – – – – – 37,048 – 9,994
Total actual return on assets (154,133) 130 (171) (89) 5 54,153 147,977 (21,032)
Purchases, issuances, and settlements (122,486) (767) 31,994 20,384 1,417 98,174 156,513 –
Transfers into (out of) Level 3 40,516 – (6,402) (11,700) – 12,324 (39,424) – Ending balance (227,929)$ 1,266$ 53,729$ 22,838$ 2,936$ 747,864$ 1,452,190$ 271,282$
Actual return on plan assets relating toplan assets still held at June 30, 2013 (280,606)$ 59$ (2,202)$ (115)$ 227$ 54,968$ 147,248$ (21,024)$

Ascension
Notes to Consolidated Financial Statements (continued) (Dollars in Thousands)
1403-1210450 58
9. Retirement Plans (continued)
The Trust has entered into a series of interest rate swap agreements with a net notional amount of $2,958,450. The combined targeted duration of these swaps and the Trust’s fixed income investments approximates the duration of the liabilities of the Trust. Currently, 75% of the dollar duration of the liability is subject to this economic hedge. The purpose of this strategy is to economically hedge the change in the net funded status for a significant portion of the liability that can occur due to changes in interest rates.
The expected long-term rate of return on the System Plans’ assets is based on historical and projected rates of return for current and planned asset categories in the investment portfolio. Assumed projected rates of return for each asset category were selected after analyzing historical experience and future expectations of the returns and volatility for assets of that category using benchmark rates. Based on the target asset allocation among the asset categories, the overall expected rate of return for the portfolio was developed and adjusted for historical and expected experience of active portfolio management results compared to benchmark returns and for the effect of expenses paid from plan assets.
Information about the expected cash flows for the System Plans follows:
Expected employer contributions 2015 41,714$ Expected benefit payments:
2015 502,046 2016 478,701 2017 494,566 2018 502,342 2019 506,546 2020-2024 2,499,041
The contribution amount above includes amounts paid to Trusts. The benefit payment amounts above reflect the total benefits expected to be paid from Trusts.

Ascension
Notes to Consolidated Financial Statements (continued) (Dollars in Thousands)
1403-1210450 59
9. Retirement Plans (continued)
Other Postretirement Benefit Plans
In addition to the retirement plan described above, certain Health Ministries sponsor postretirement benefit plans that provide healthcare benefits to qualified retirees who meet certain eligibility requirements. The total benefit obligation of these plans at June 30, 2014 and 2013, is $44,473 and $45,308, respectively. The net asset included in pension and other postretirement liabilities in the accompanying Consolidated Balance Sheets at June 30, 2014, is $756, while the net obligation included in pension and other postretirement liabilities in the accompanying Consolidated Balance Sheets at June 30, 2013, is $6,624. The change in the plans’ assets and benefit obligations recognized in unrestricted net assets during the year ended June 30, 2014, was a decrease of $1,471.
Defined-Contribution Plans
System entities participate in contributory and noncontributory defined-contribution plans covering all eligible associates. There are three primary types of contributions to these plans: employer automatic contributions, employee contributions, and employer matching contributions. Benefits for employer automatic contributions are determined as a percentage of a participant’s salary and, for certain entities, increases over specified periods of employee service. These benefits are funded annually, and participants become fully vested over a period of time. Benefits for employer matching contributions are determined as a percentage of an eligible participant’s contributions each payroll period. These benefits are funded each payroll period, and participants become fully vested in these employer contributions immediately. Expenses for the defined-contribution plans were $280,223 and $193,856 during 2014 and 2013, respectively.

Ascension
Notes to Consolidated Financial Statements (continued) (Dollars in Thousands)
1403-1210450 60
10. Self-Insurance Programs
Certain System hospitals and other entities participate in pooled risk programs to insure professional and general liability risks and workers’ compensation risks to the extent of certain self-insured limits. In addition, various umbrella insurance policies have been purchased to provide coverage in excess of the self-insured limits. The System provides its self-insurance through various trust funds and captive insurance companies. Actuarially determined amounts, discounted at 6% for the System, are contributed to the trust funds and the captive insurance companies to provide for the estimated cost of claims. The loss reserves recorded for estimated self-insured professional, general liability, and workers’ compensation claims include estimates of the ultimate costs for both reported claims and claims incurred but not reported, which are discounted at 6% in 2014 and 2013 for the System. Those entities not participating in the self-insured programs are insured under separate policies.
Professional and General Liability Programs
Professional and general liability coverage is provided on a claims-made or occurrence basis through a wholly owned onshore trust and through AHIL.
The wholly owned onshore trust has a self-insured retention of $10,000 per occurrence with no aggregate. Excess coverage is provided through AHIL with limits up to $205,000. AHIL retains $5,000 per occurrence and $5,000 annual aggregate for professional liability. AHIL also retains a 20% quota share of the first $25,000 of umbrella excess. The remaining excess coverage is reinsured by commercial carriers.
Sunflower Assurance, Inc. (Sunflower) was acquired when Marian Health System joined the System. Sunflower provided excess coverage with limits up to $75,000 above the primary coverage for Via Christi Health and retained 10% of the first reinsurance layer of $10,000 on a quota share basis. The remaining excess coverage was reinsured by commercial carriers. As of October 1, 2013, Via Christi’s primary and excess medical professional and general liability and employed physician programs were integrated into the System trust and AHIL. After January 1, 2014, the employer stop loss and employee life insurance coverage provided by Sunflower to Via Christi were not renewed and are in run off.

Ascension
Notes to Consolidated Financial Statements (continued) (Dollars in Thousands)
1403-1210450 61
10. Self-Insurance Programs (continued)
Self-insured entities in the states of Indiana, Kansas, Pennsylvania, and Wisconsin are provided professional liability coverage with limits in compliance with participation in the Patient Compensation Funds. The Patient Compensation Funds apply to claims in excess of the primary self-insured limit, except the Fund in Kansas, which only covers claims up to the first $1,000 and then the trust and AHIL cover amounts above $1,000.
Included in operating expenses in the accompanying Consolidated Statements of Operations and Changes in Net Assets is professional and general liability expense of $99,568 and $68,437 for the years ended June 30, 2014 and 2013, respectively. Included in current and long-term self-insurance liabilities on the accompanying Consolidated Balance Sheets are professional and general liability loss reserves of $604,846 and $614,913 at June 30, 2014 and 2013, respectively.
AHIL also offers physician professional liability coverage through insurance or reinsurance arrangements to nonemployed physicians practicing at the System’s various facilities, primarily in Michigan, Indiana, Texas, Florida and Illinois. Coverage is offered to physicians with limits ranging from $100 per claim to $1,000 per claim with various aggregate limits. Beginning October 1, 2013, AHIL offered similar coverage to employed physicians from Marian Health System in Kansas and Wisconsin.
Edessa Insurance Company Ltd. (Edessa) was acquired as part of the Alexian Brothers business combination effective January 1, 2012. Effective July 1, 2012, the self-insurance programs of Edessa were consolidated into AHIL, and Edessa ceased operations.

Ascension
Notes to Consolidated Financial Statements (continued) (Dollars in Thousands)
1403-1210450 62
10. Self-Insurance Programs (continued)
Workers’ Compensation
Workers’ compensation coverage is provided on an occurrence basis through a grantor trust. The self-insured trust provides coverage up to $1,500 per occurrence with no aggregate. The trust provides a mechanism for funding the workers’ compensation obligations of its members. Prior to October 1, 2013, workers’ compensation coverage for Marian Health System was self-insured or commercially insured up to various limits and excess insurance against catastrophic loss was obtained through commercial insurers. As of October 1, 2013, the Marian Systems are provided coverage under the self-insured trust. Premium payments made to the trust are expensed and represent claims reported and claims incurred but not reported.
Included in operating expenses in the accompanying Consolidated Statements of Operations and Changes in Net Assets is workers’ compensation expense of $42,052 and $41,699 for the years ended June 30, 2014 and 2013, respectively. Included in current and long-term self-insurance liabilities on the accompanying Consolidated Balance Sheets are workers’ compensation loss reserves of $114,237 and $137,825 at June 30, 2014 and 2013, respectively.
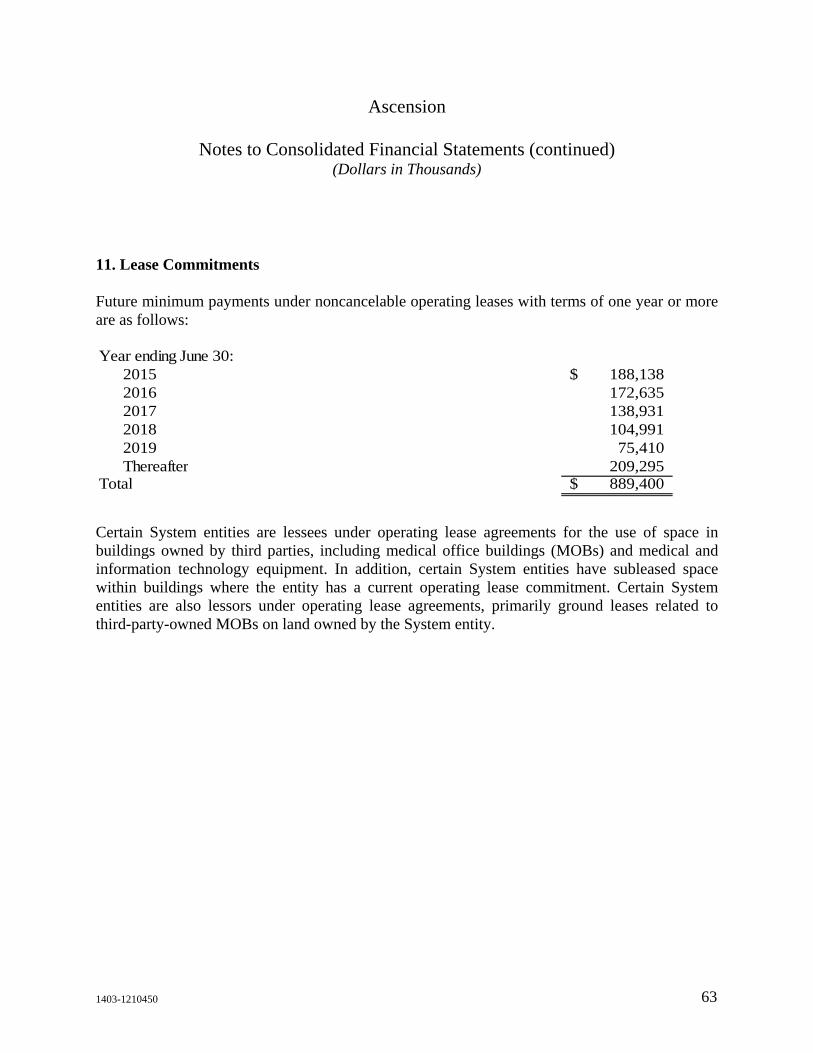
Ascension
Notes to Consolidated Financial Statements (continued) (Dollars in Thousands)
1403-1210450 63
11. Lease Commitments
Future minimum payments under noncancelable operating leases with terms of one year or more are as follows:
Year ending June 30:2015 188,138$ 2016 172,635 2017 138,931 2018 104,991 2019 75,410 Thereafter 209,295
Total 889,400$
Certain System entities are lessees under operating lease agreements for the use of space in buildings owned by third parties, including medical office buildings (MOBs) and medical and information technology equipment. In addition, certain System entities have subleased space within buildings where the entity has a current operating lease commitment. Certain System entities are also lessors under operating lease agreements, primarily ground leases related to third-party-owned MOBs on land owned by the System entity.

Ascension
Notes to Consolidated Financial Statements (continued) (Dollars in Thousands)
1403-1210450 64
11. Lease Commitments (continued)
The System’s future minimum noncancelable payments associated with operating leases where a System entity is the lessee, as well as future minimum noncancelable receipts associated with operating leases where a System entity is the sublessor or lessor, are presented in the table that follows. Future minimum payments and receipts relate to noncancelable leases with terms of one year or more.
Future Future ReceiptsPayments Where theWhere the System is Net FutureSystem is Sublessor/ PaymentsLessee Lessor (Receipts)
Year ending June 30:2015 188,138$ 50,118$ 138,020$ 2016 172,635 41,175 131,460 2017 138,931 32,104 106,827 2018 104,991 26,333 78,658 2019 75,410 20,626 54,784 Thereafter 209,295 300,833 (91,538)
Total 889,400$ 471,189$ 418,211$
Rental expense under operating leases amounted to $391,928 and $347,087 in 2014 and 2013, respectively.
12. Contingencies and Commitments
The System is involved in litigation and regulatory investigations arising in the ordinary course of business. Regulatory investigations also occur from time to time. In the opinion of management, after consultation with legal counsel, these matters are expected to be resolved without material adverse effect on the System’s Consolidated Balance Sheet.
In March 2013, the System and some of its subsidiaries were named as defendants to litigation surrounding the Church Plan status of its System Plans. On May 9, 2014, the United States District Court, Eastern District of Michigan, Southern Division, issued its Decision and Order Granting Defendants’ Motion to Dismiss, which effectively dismissed the case against the System. On June 11, 2014, the plaintiff in the case filed a Notice of Appeal, and the appeal is pending. Regardless of the outcome of such appeal, the System does not believe that this matter will have a material adverse effect on the System’s financial position or results of operations.

Ascension
Notes to Consolidated Financial Statements (continued) (Dollars in Thousands)
1403-1210450 65
12. Contingencies and Commitments (continued)
In September 2010, Ascension Health received a letter from the U.S. Department of Justice (the DOJ) in connection with its nationwide review to determine whether, in certain cases, implantable cardioverter defibrillators (ICD) were provided to certain Medicare beneficiaries in accordance with national coverage criteria. In connection with this nationwide review, identified System hospitals are reviewing applicable medical records and responding to the DOJ. The DOJ’s investigation spans a time frame beginning in 2003 and extending through the present time. To date, four System hospitals have entered into settlements with the DOJ and the System is having settlement discussions with the DOJ regarding two other System hospitals subject to the ICD investigation.
The System enters into agreements with non-employed physicians that include minimum revenue guarantees. The terms of the guarantees vary. The carrying amounts of the liability for the System’s obligation under these guarantees were $37,623 and $44,553 at June 30, 2014 and 2013, respectively, and are included in other current and noncurrent liabilities in the accompanying Consolidated Balance Sheets. The maximum amount of future payments that the System could be required to make under these guarantees is approximately $95,700.
The System entered into agreements with sponsors for support through January 2017. The System’s obligation under these agreements totals $31,000 at June 30, 2014, and is included in other current and noncurrent liabilities in the accompanying Consolidated Balance Sheet.
The System entered into Master Service Agreements for information technology services provided by third parties. The maximum amount of future payments that the System could be required to make under these agreements is approximately $190,700.
Guarantees and other commitments represent contingent commitments issued by Ascension Health Alliance Senior and Subordinate Credit Groups, generally to guarantee the performance of an affiliate to a third party in borrowing arrangements such as commercial paper issuances, bond financing, and other transactions. The terms of guarantees are equal to the terms of the related debt, which can be as long as 26 years. The following represents the remaining guarantees and other commitments of the Senior and Subordinate Credit Groups at June 30, 2014:
Hospital de la Concepción 2000 Series A debt guarantee 29,240$ St. Vincent de Paul Series 2000A debt guarantee 28,300 Other guarantees and commitments 36,200

1403-1210450
Supplementary Information
1403-1210450 66
Report of Independent Auditors on Supplementary Information
The Board of Directors Ascension
Our audits were conducted for the purpose of forming an opinion on the consolidated financial statements as a whole. The accompanying Schedule of Net Cost of Providing Care of Persons Living in Poverty and Community Benefit Programs, the Credit Group Consolidated Balance Sheets, the Credit Group Consolidated Statements of Operations and Changes in Net Assets, and the Schedule of Credit Group Cash and Investments are presented for purposes of additional analysis and is not a required part of the financial statements. Such information is the responsibility of management and was derived from and relates directly to the underlying accounting and other records used to prepare the financial statements. The information has been subjected to the auditing procedures applied in the audits of the consolidated financial statements and certain additional procedures, including comparing and reconciling such information directly to the underlying accounting and other records used to prepare the financial statements or to the financial statements themselves, and other additional procedures in accordance with auditing standards generally accepted in the United States. In our opinion, the information is fairly stated, in all material respects, in relation to the financial statements as a whole.
ey September 11, 2014
A member firm of Ernst & Young Global Limited
Ernst & Young LLP The Plaza in Clayton Suite 1300 190 Carondelet Plaza St. Louis, MO 63105-3434
Tel: +1 314 290 1000 Fax: +1 314 290 1882 ey.com

1403-1210450 67
Ascension
Schedule of Net Cost of Providing Care of Persons Living in Poverty and Other Community Benefit Programs
(Dollars in Thousands)
Years Ended June 30, 2014 and 2013
The net cost of providing care to persons living in poverty and other community benefit programs is as follows:
Year Ended June 30, 2014 2013
Traditional charity care provided $ 580,606 $ 524,605 Unpaid cost of public programs for persons
living in poverty 641,981 488,959 Other programs for persons living in poverty
and other vulnerable persons 117,990 89,923 Community benefit programs 480,866 383,583 Care of persons living in poverty and other community
benefit programs $ 1,821,443 $ 1,487,070

2014 2013
AssetsCurrent assets:
Cash and cash equivalents $ 414,489 $ 413,891 Short-term investments 60,957 73,881 Accounts receivable, less allowance for doubtful accounts ($1,077,662 and $1,130,769 at June 30, 2014 and 2013, respectively) 1,979,167 1,887,031 Inventories 270,472 237,594 Due from brokers 343,757 178,380 Estimated third-party payor settlements 225,709 108,559 Other 617,517 1,009,996
Total current assets 3,912,068 3,909,332
Long-term investments 14,970,497 13,778,749
Property and equipment, net 6,297,972 6,227,296
Other assets:Investment in unconsolidated entities 539,394 532,483 Capitalized software costs, net 684,996 651,627 Due from affiliates 637,799 651,022 Other 1,353,604 1,341,384
Total other assets 3,215,793 3,176,516 Total assets $ 28,396,330 $ 27,091,893
Continued on next page.
Ascension
Credit Group1 Financial StatementsConsolidated Balance Sheets
(Dollars in Thousands)
1The Credit Group Financial Statements are comprised of the System (see Note 1) excluding the System's investment in ViaChristi Health, Inc. prior to March 31, 2013 and assets, liabilities and net assets of Alexian Brothers Health System (ABHS), St.John Health System, Inc. (St. John), and Ministry Health Care, Inc (Ministry). As discussed in Note 3, Ascension Healthbecame the sole corporate member of Via Christi Health, Inc. on April 1, 2013, at which time Via Christi Health, Inc. became amember of the Credit Group. The Credit Group Financial Statements also include the System's noncontrolling interest (seeNote 2) of the Alpha Fund (see Notes 4 and 5), which represents $1,490,082, or approximately 10.7%, and $1,450,580, orapproximately 12.9%, of the Alpha Fund's net assets as of June 30, 2014 and 2013, respectively. See Note 5 for furtherdiscussion of noncontrolling interests of the Alpha Fund.
June 30,
1403-1210450 68

2014 2013
Liabilities and net assetsCurrent liabilities:
Current portion of long-term debt $ 69,301 $ 66,291 Long-term debt subject to short-term remarketing arrangements 1,345,530 1,187,125 Accounts payable and accrued liabilities 1,926,657 1,903,339 Estimated third-party payor settlements 344,262 352,343 Due to brokers 332,169 493,420 Current portion of self-insurance liabilities 220,710 202,113 Other 154,472 531,141
Total current liabilities 4,393,101 4,735,772
Noncurrent liabilities:Long-term debt (senior and subordinated) 3,961,654 4,221,758 Self-insurance liabilities 517,691 519,423 Pension and other postretirement liabilities 319,808 404,516
Other 2 2,658,030 2,252,568
Total noncurrent liabilities 7,457,183 7,398,265 Total liabilities 11,850,284 12,134,037
Net assets:Unrestricted Controlling interest 14,418,042 12,919,514
Noncontrolling interests 3 1,655,092 1,591,091
Unrestricted net assets 16,073,134 14,510,605
Temporarily restricted 349,104 334,201 Permanently restricted 123,808 113,050
Total net assets 16,546,046 14,957,856
Total liabilities and net assets $ 28,396,330 $ 27,091,893
Ascension
Credit Group1 Financial StatementsConsolidated Balance Sheets (continued)
(Dollars in Thousands)
2Includes $1,490,730 and $1,241,017 at June 30, 2014 and 2013, respectively, representing the amounts due toABHS, St. John and Ministry from Ascension attributable to interests in investments held by Ascension.
3Includes $1,490,082 and $1,450,580 at June 30, 2014 and 2013, respectively, attributable to the Alpha Fund (seeNotes 4 and 5).
June 30,
1403-1210450 69

2014 2013 Operating revenue:
Net patient service revenue $ 15,791,162 $ 14,730,194
Less provision for doubtful accounts 1,090,775 1,027,245
Net patient service revenue, less provision for doubtful accounts 14,700,387 13,702,949
Other revenue 1,307,373 1,090,380
Total operating revenue 16,007,760 14,793,329
Operating expenses:Salaries and wages 6,664,407 6,282,418
Employee benefits 1,402,949 1,372,742
Purchased services 880,836 798,329
Professional fees 1,112,707 1,012,804
Supplies 2,306,106 2,106,666
Insurance 102,453 88,747
Interest 132,946 126,307
Depreciation and amortization 712,801 651,391
Other 2,026,905 1,861,777
Total operating expenses before impairment, restructuring andnonrecurring losses, net 15,342,110 14,301,181
Income from operations before self-insurance trust fund investment return and impairment, restructuring and nonrecurring losses, net 665,650 492,148
Self-insurance trust fund investment return 66,174 34,985
Impairment, restructuring and nonrecurring losses, net (218,279) (168,937)
Income from operations 513,545 358,196
Nonoperating gains (losses):
Investment return 4 1,357,908 731,181
Loss on extinguishment of debt (1,605) (4,079)
(Loss) gain on interest rate swaps (1,407) 53,746
Income from unconsolidated entities 5,016 8,137
Contributions from business combinations – 982,018
Other (56,771) (73,497)
Total nonoperating gains, net 1,303,141 1,697,506
Excess of revenues and gains over expenses and losses 1,816,686 2,055,702
Less noncontrolling interests 246,390 131,380
Excess of revenues and gains over expenses and lossesattributable to controlling interest 1,570,296 1,924,322
Continued on next page.
Year Ended June 30,
Ascension
Credit Group Financial StatementsConsolidated Statement of Operations and Changes in Net Assets
(Dollars in Thousands)
4Includes the investment return of $1,533,134 and $762,550 for the years ended June 30, 2014 and 2013,respectively, attributable to the Alpha Fund. Of the Alpha Fund's investment return, $193,400 and $106,039 for theyears ended June 30, 2014 and 2013, respectively, is included in the noncontrolling interests.
1403-1210450 70

2014 2013 Unrestricted net assets, controlling interest:
Excess of revenues and gains over expenses and losses 1,570,296$ 1,924,322$ Transfers from (to) sponsors and other affiliates, net 9,815 (6,138) Contributed net assets (1,534) (1,049) Membership interest changes, net 45,255 – Net assets released from restrictions for property acquisitions 54,869 60,084 Pension and other postretirement liability adjustments (2,725) 31,469 Change in unconsolidated entities’ net assets 4,571 5,523 Other (17,656) 2,759 Increase in unrestricted net assets, controlling interest,
before loss from discontinued operations 1,662,891 2,016,970 Loss from discontinued operations (164,363) (76,829)
Increase in unrestricted net assets, controlling interest 1,498,528 1,940,141
Unrestricted net assets, noncontrolling interest:Excess of revenues and gains over expenses and losses 246,390 131,380 Distributions of capital (530,534) (829,932) Contributions of capital 400,675 1,578,371 Contributions from business combinations – 63,757 Membership interest changes, net (52,530) –
Increase in unrestricted net assets, noncontrolling interest5 64,001 943,576
Temporarily restricted net assets, controlling interest:Contributions and grants 81,762 80,893 Investment return 27,264 17,524 Net assets released from restrictions (96,232) (97,345) Contributions from business combinations – 11,868 Other 2,109 3,040
Increase in temporarily restricted net assets, controlling interest 14,903 15,980
Permanently restricted net assets, controlling interest:Contributions 10,290 2,581 Investment return 635 1,744 Contributions from business combinations – 6,717 Other (167) 407
Increase in permanently restricted net assets, controlling interest 10,758 11,449
Increase in net assets 1,588,190 2,911,146 Net assets, beginning of period 14,957,856 12,046,710 Net assets, end of period 16,546,046$ 14,957,856$
5Includes net distributions of $153,898, comprised of distributions of $487,564 and contributions of $333,666 forthe year ended June 30, 2014 and net contributions of $755,906, comprised of contributions of $1,555,146 anddistributions of $799,240 for the year ended June 30, 2013, attributable to the Alpha Fund.
Year Ended June 30,
Ascension
Credit Group Financial StatementsConsolidated Statement of Operations and Changes in Net Assets (continued)
(Dollars in Thousands)
1403-1210450 71
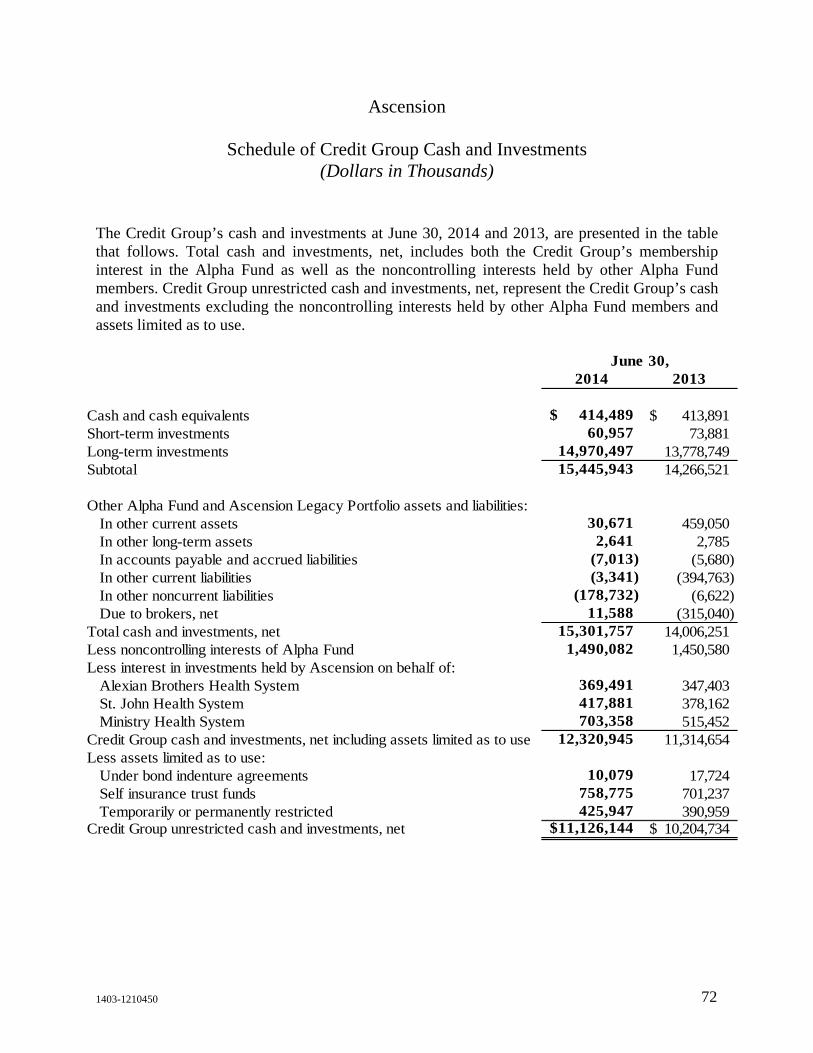
Ascension
Schedule of Credit Group Cash and Investments (Dollars in Thousands)
1403-1210450 72
The Credit Group’s cash and investments at June 30, 2014 and 2013, are presented in the table that follows. Total cash and investments, net, includes both the Credit Group’s membership interest in the Alpha Fund as well as the noncontrolling interests held by other Alpha Fund members. Credit Group unrestricted cash and investments, net, represent the Credit Group’s cash and investments excluding the noncontrolling interests held by other Alpha Fund members and assets limited as to use.
2014 2013
Cash and cash equivalents 414,489$ 413,891$ Short-term investments 60,957 73,881 Long-term investments 14,970,497 13,778,749 Subtotal 15,445,943 14,266,521
Other Alpha Fund and Ascension Legacy Portfolio assets and liabilities:In other current assets 30,671 459,050 In other long-term assets 2,641 2,785 In accounts payable and accrued liabilities (7,013) (5,680) In other current liabilities (3,341) (394,763) In other noncurrent liabilities (178,732) (6,622) Due to brokers, net 11,588 (315,040)
Total cash and investments, net 15,301,757 14,006,251 Less noncontrolling interests of Alpha Fund 1,490,082 1,450,580 Less interest in investments held by Ascension on behalf of:
Alexian Brothers Health System 369,491 347,403 St. John Health System 417,881 378,162 Ministry Health System 703,358 515,452
Credit Group cash and investments, net including assets limited as to use 12,320,945 11,314,654 Less assets limited as to use:
Under bond indenture agreements 10,079 17,724 Self insurance trust funds 758,775 701,237 Temporarily or permanently restricted 425,947 390,959
Credit Group unrestricted cash and investments, net 11,126,144$ 10,204,734$
June 30,

Ascension
Schedule of Credit Group Statistical Information (unaudited) (Dollars in Thousands)
1403-1210450 73
Total Available BedsTotal Patient DaysTotal DischargesAverage Length of StayTotal Outpatient Visits
18,634
6.75 6.14 19,619,835
4,263,264
2014 2013
631,831
18,520,894
For the Year EndedJune 30,
18,463 3,784,649
616,603
The percentage of net patient service revenue, less provision for doubtful accounts, earned by payor for the years ended June 30, 2014 and 2013, are as follows:
June 30,
2014 2013
Medicare – traditional and managed 36% 37%
Medicaid – traditional and managed 12 12
Commercial and other managed care 43 43
Self-Pay and other 9 8
100% 100%
Significant concentrations of accounts receivable, less allowance for doubtful accounts, at June 30, 2014 and 2013, are as follows:
June 30,
2014 2013
Medicare – traditional and managed 22% 22%
Medicaid – traditional and managed 9 8
Commercial and other managed care 46 43
Self-Pay and other 23 27
100% 100%


