World Economic Situation and Prospects 2011 Global outlook asdf United Nations New York, 2010 PRE-RELEASE EMBARGO: 1 December 2010 11:00 am New York time http://www.un.org/esa/policy/wess/wesp.html
Transcript
World Economic Situation and Prospects 2011
Global outlook
asdfUnited NationsNew York, 2010
PRE-RELEASE
Embargo:
1 December 2010
11:00 am
New York time
http://www.un.org/esa/policy/wess/wesp.html
This report is a joint product of the United Nations Department of Economic and Social Affairs (DESA), the United Nations Conference on Trade and Development (UNCTAD) and the five United Nations regional commissions (Economic Commission for Africa (ECA), Economic Commission for Europe (ECE), Economic Commission for Latin America and the Caribbean (ECLAC), Economic and Social Commission for Asia and the Pacific (ESCAP) and Economic and Social Commission for Western Asia (ESCWA)).
For further information, please see http://www.un.org/esa/policy or contact:
Mr. Rob VosDirectorDevelopment Policy and Analysis DivisionDepartment of Economic and Social AffairsRoom DC2-2020United Nations,New York, NY 10017, USAPhone: +1-212.963.4838Fax: +1-212.963.1061E-mail: [email protected]
Pre-Release
This is a pre-release of Chapter I of the World Economic Situation and Prospects 2011, issued on 1 December 2010 in New York. The full report, including regional overviews and a detailed analysis of trends in global trade and finance will be available from the second full week of January 2011
1
Chapter IGlobal outlook
macroeconomic prospects for the world economyThe road to recovery from the Great Recession is proving to be long, winding and rocky. After a year of fragile and uneven recovery, growth of the world economy is now decelerat-ing on a broad front, presaging weaker global growth in the outlook.
Weaknesses in major developed economies continue to drag the global recov-ery and pose risks for world economic stability in the coming years. There will be no quick fix for the problems these economies are still facing in the aftermath of the financial crisis. The unprecedented scale of the policy measures taken by Governments during the early stage of the crisis has no doubt helped stabilize financial markets and jump-start a recovery, but overcoming the structural problems that led to the crisis and those that were created by it is proving much more challenging and will be a lengthy process. For example, despite the notable progress made by the banking sector in disposing of its troubled as-sets, many of the banks in major developed countries remain vulnerable to multiple risks. Those risks include a further deterioration in real estate markets, more distress in sovereign debt markets, and continued low credit growth associated with overall economic weakness and the ongoing deleveraging among firms and households. Persistent high levels of unem-ployment, with increasing numbers of workers that have been without a job for prolonged periods, are restraining private consumption demand; they are also a continued cause of increasing housing foreclosures, which are adding to the fragility of the financial system. Troubles with public finances have become daunting as well. Fiscal deficits have widened dramatically and have become a source of political contention. Deficits have increased, mainly as a consequence of the impact of the crisis on falling government revenues and rising social benefit payments. The costs of fiscal stimulus measures have compounded this situation but, contrary to popular belief, have contributed only in minor part to the increase in public indebtedness. Yet, rising public debt has engendered political and finan-cial stress in a number of European countries and, more broadly, has undermined support for further fiscal stimuli. However, as Governments shift from fiscal stimulus to austerity, the recovery process is being placed in further jeopardy. The fiscal consolidation plans that have been announced so far by Governments of developed countries will impact negatively on gross domestic product (GDP) growth in the outlook for 2011 and 2012.
This contrasts with the strong GDP growth in many developing countries and economies in transition, which has been contributing to more than half of the expansion of the world economy since the third quarter of 2009. The rebound has been led by the large emerging economies in Asia and Latin America, particularly China, India and Brazil. Many developing countries have been able to use the policy buffers (in the form of ample fiscal space and vast foreign-exchange reserves) they had generated in the years before the crisis to adopt aggressive stimulus packages. These have helped boost domestic demand and have thus facilitated a relatively quick recovery from the global downturn. Since the second quarter of 2009, low- and middle-income countries have also led the recovery of international trade, building on ties among developing countries through global value chains. Many smaller economies in Africa and Latin America have been able to benefit from these South-South linkages, as well as from more buoyant international primary
Weaker global growth is expected in 2011 and 2012
There will be no quick fix for economic problems in advanced countries
Developing country growth remains the main driver of the global recovery…
2 World Economic Situation and Prospects 2011
commodity prices which have rebounded largely on account of the recovery in demand in the large developing economies. The return of private capital inflows to middle-income countries has further supported the recovery. By late 2010, developing country trade and industrial output had climbed to above pre-crisis levels.
It is uncertain, however, whether the developing countries and economies in transition can sustain the same robust pace of growth in 2011 and beyond. Despite strengthened trade ties amongst these countries, they remain highly dependent on demand in the developed countries for their exports. Access to capital flows and official develop-ment finance is also highly conditioned by financial circumstances and fiscal stances in advanced economies. A faltering recovery in those economies, on account of the above-mentioned risks, should thus be expected to moderate growth prospects for developing economies as well.
In addition, there are also important risks associated with the surge in private capital flows to emerging market economies. These flows are causing upward pressure on these countries’ currencies and risk inflating domestic asset bubbles. The return of capital flows is associated, to some degree, with the strong monetary expansion in the major developed countries, which has induced investors to seek more profitable ventures given continued weakness in financial sectors and the real economy in those countries. It has led policymakers in the emerging market economies to worry about the competitive-ness of exports and the possibility of sudden capital flow reversals. They are responding by intervening in currency markets and imposing controls on short-term capital inflows. Fears of protectionist retaliation by developed countries have increased. As primary com-modities are increasingly seen as alternative financial assets, short-term capital has also moved deeper into commodity markets, risking higher volatility in commodity prices and raising economic insecurity for many developing countries. Together with the increase in volatility in the exchange rates of major reserve currencies (the dollar, the euro and the yen) and a weakening commitment to coordinate policies to redress the global imbalances effectively, these factors pose increasing risks to the stability of international trade and finance, and, unless addressed in a timely fashion, will impede a strong, sustainable and balanced recovery of the global economy.
Mitigating these risks poses enormous policy challenges. In major developed economies, macroeconomic policy options are limited by political factors restraining fur-ther fiscal stimulus and market responses to sovereign debt distress. This has led policymak-ers to rely increasingly on monetary policy. Authorities in the main developed countries have cut interest rates further and moved deeper into quantitative easing, but it is unlikely that this will suffice to boost aggregate demand and create new jobs, especially as long as financial sector weaknesses remain and fiscal stimulus is on the wane. Active income policy could be an alternative or complementary tool for strengthening domestic demand, but it remains largely unused. The surge in capital flows to emerging and other developing economies and the consequent pressures on currencies are complicating the international environment for developing countries, rendering policies to restructure their economies in support of sustained growth all the more challenging. The spillover effects of national poli-cies are significant and a potential source of renewed instability. This once again highlights the need for strengthened international policy coordination. In this regard, the waning cooperative spirit among policymakers in the major economies has become an additional risk to the recovery of the world economy.
…but developing countries face challenges
in the outlook
3Global outlook
Growth prospects
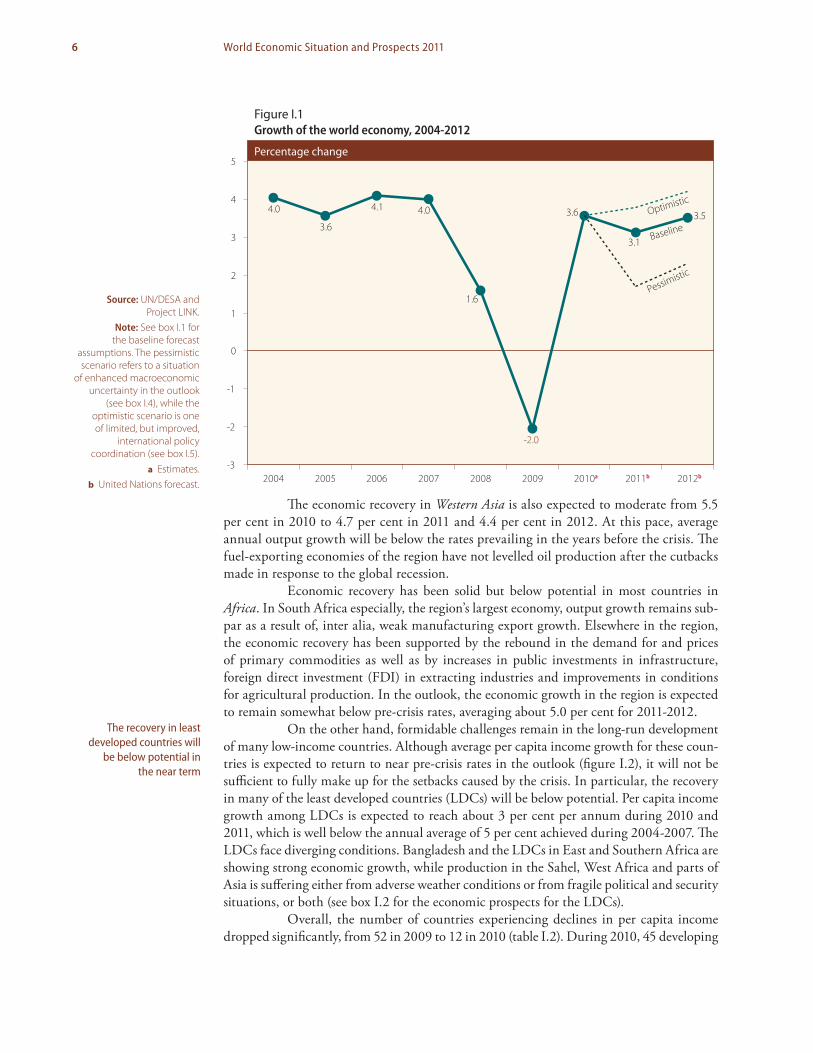
After a year of fragile and uneven recovery, global economic growth started to decelerate on a broad front in mid-2010. The slowdown is expected to continue into 2011 and 2012. The outlook is shrouded in great uncertainty and serious downside risks remain. Premised on the key assumptions delineated in box I.1, the United Nations baseline forecast for the growth of world gross product (WGP) is 3.1 per cent for 2011 and 3.5 per cent for 2012, which is below the 3.6 per cent estimated for 2010 and the pre-crisis pace of global growth (see table I.1 and figure I.1). The recovery may suffer further setbacks if some downside risks take shape. In such a pessimistic scenario—discussed further in box I.4—growth of the world economy could slow significantly, to 1.7 per cent in 2011 and 2.3 per cent in 2012. Better outcomes may be expected only through strengthened international policy coordination (see the section on policy challenges and box I.5 below).
Among the developed economies, the United States of America has been on the mend from its longest and deepest recession since the Second World War. Yet, the pace of the recovery has been the weakest in the country’s post-recession experience. At 2.6 per cent in 2010, growth is expected to moderate further to 2.2 per cent in 2011 and to improve slightly to 2.8 per cent in 2012. At these rates, the level of GDP will return to its pre-crisis peak by 2011, but a full recovery of employment would take at least another four years (see below), leaving the level of output well below potential.
The growth prospects for Europe and Japan are even dimmer. Assuming con-tinued, albeit moderate, recovery in Germany, GDP growth in the euro area is forecast to virtually stagnate at 1.3 per cent in 2011 and 1.7 per cent in 2012 (growth in 2010 was 1.6 per cent). Many European countries will see even less growth, especially those in which drastic fiscal cuts and continued high unemployment rates are draining domestic demand. This is especially the case in Greece, Ireland, Portugal and Spain, which are entrapped in sovereign debt distress and whose economies will either remain in recession or stagnate. Japan’s initially strong rebound, fuelled by net export growth, started to falter in the course of 2010. Challenged by persistent deflation and elevated public debt, the economy is expected to grow by a meagre 1.1 per cent in 2011 and 1.4 per cent in 2012.
Among the economies in transition, the Commonwealth of Independent States (CIS) and Georgia experienced a rebound in GDP by about 4 per cent on average in 2010, up from the deep contraction of 6.7 per cent in 2009. Increased external demand and rebounding commodity prices are the drivers of the recovery. Domestic demand remains weak in most economies, especially in Ukraine. The recovery has slowed in the course of 2010, however. Output growth is not expected to accelerate in the outlook for 2011 and 2012. After a prolonged period of contraction, output growth in the economies in transi-tion in South-eastern Europe, except for Croatia, returned to positive territory in 2010. In this case, too, export growth has been driving most of the recovery so far, while domestic consumption and investment demand remain subdued. In 2011 and 2012, the pace of recovery in South-eastern Europe is expected to be rather slow.
Developing countries continue to drive the global recovery, but their output growth is also expected to moderate to 6.0 per cent on average during 2011-2012, down from 7.1 per cent in 2010. Developing Asia, led by China and India, continues to show the strongest growth performance, but GDP growth in these two new economic giants is expected to experience some moderation in 2011 and 2012.
Growth in Latin America, particularly that in the South American economies, is projected to remain relatively robust at about 4.1 per cent in the baseline forecast. Yet,
The global recovery started to falter in mid-2010
Slower economic growth is expected in the United States, Europe and Japan
Developing country growth is also expected to moderate during 2011-2012
4 World Economic Situation and Prospects 2011
Key assumptions for the United Nations baseline forecast for 2011 and 2012
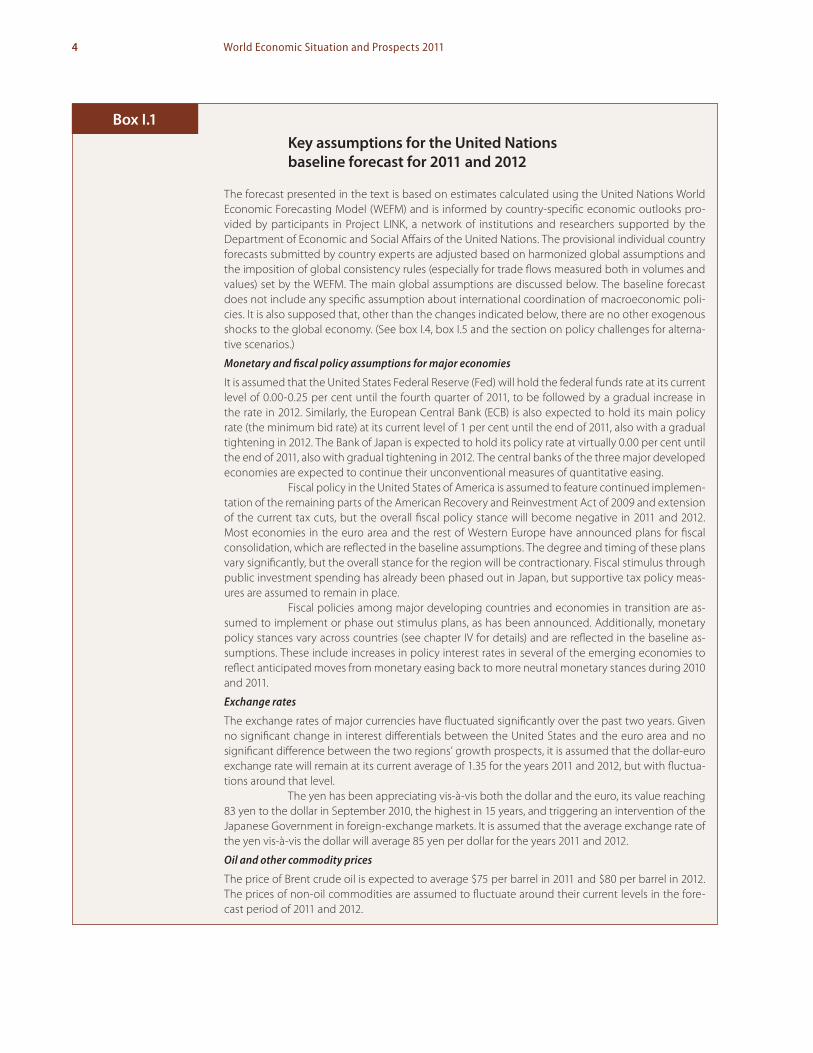
The forecast presented in the text is based on estimates calculated using the United Nations World Economic Forecasting Model (WEFM) and is informed by country-specific economic outlooks pro-vided by participants in Project LINK, a network of institutions and researchers supported by the Department of Economic and Social Affairs of the United Nations. The provisional individual country forecasts submitted by country experts are adjusted based on harmonized global assumptions and the imposition of global consistency rules (especially for trade flows measured both in volumes and values) set by the WEFM. The main global assumptions are discussed below. The baseline forecast does not include any specific assumption about international coordination of macroeconomic poli-cies. It is also supposed that, other than the changes indicated below, there are no other exogenous shocks to the global economy. (See box I.4, box I.5 and the section on policy challenges for alterna-tive scenarios.)
Monetary and fiscal policy assumptions for major economies
It is assumed that the United States Federal Reserve (Fed) will hold the federal funds rate at its current level of 0.00-0.25 per cent until the fourth quarter of 2011, to be followed by a gradual increase in the rate in 2012. Similarly, the European Central Bank (ECB) is also expected to hold its main policy rate (the minimum bid rate) at its current level of 1 per cent until the end of 2011, also with a gradual tightening in 2012. The Bank of Japan is expected to hold its policy rate at virtually 0.00 per cent until the end of 2011, also with gradual tightening in 2012. The central banks of the three major developed economies are expected to continue their unconventional measures of quantitative easing.
Fiscal policy in the United States of America is assumed to feature continued implemen-tation of the remaining parts of the American Recovery and Reinvestment Act of 2009 and extension of the current tax cuts, but the overall fiscal policy stance will become negative in 2011 and 2012. Most economies in the euro area and the rest of Western Europe have announced plans for fiscal consolidation, which are reflected in the baseline assumptions. The degree and timing of these plans vary significantly, but the overall stance for the region will be contractionary. Fiscal stimulus through public investment spending has already been phased out in Japan, but supportive tax policy meas-ures are assumed to remain in place.
Fiscal policies among major developing countries and economies in transition are as-sumed to implement or phase out stimulus plans, as has been announced. Additionally, monetary policy stances vary across countries (see chapter IV for details) and are reflected in the baseline as-sumptions. These include increases in policy interest rates in several of the emerging economies to reflect anticipated moves from monetary easing back to more neutral monetary stances during 2010 and 2011.
Exchange rates
The exchange rates of major currencies have fluctuated significantly over the past two years. Given no significant change in interest differentials between the United States and the euro area and no significant difference between the two regions’ growth prospects, it is assumed that the dollar-euro exchange rate will remain at its current average of 1.35 for the years 2011 and 2012, but with fluctua-tions around that level.
The yen has been appreciating vis-à-vis both the dollar and the euro, its value reaching 83 yen to the dollar in September 2010, the highest in 15 years, and triggering an intervention of the Japanese Government in foreign-exchange markets. It is assumed that the average exchange rate of the yen vis-à-vis the dollar will average 85 yen per dollar for the years 2011 and 2012.
Oil and other commodity prices
The price of Brent crude oil is expected to average $75 per barrel in 2011 and $80 per barrel in 2012. The prices of non-oil commodities are assumed to fluctuate around their current levels in the fore-cast period of 2011 and 2012.
Box I.1
5Global outlook
this implies a marked moderation from the 5.6 per cent GDP growth estimated for 2010. Brazil continues to act as the engine of regional growth, with strong domestic demand helping to boost the export growth of neighbouring countries. The subregion also benefits from improved terms of trade and strengthened economic ties with the emerging econo-mies in Asia.
a Partly estimated.b Forecasts, based in part on Project LINK and baseline projections of the United Nations World Economic Forecasting Model.c See World economic situation and prospects as of mid-2010 (E/2010/73), available from http://www.un.org/esa/policy/wess/wesp2010files/
wesp10update.pdf.d Calculated as a weighted average of individual country growth rates of gross domestic product (GDP), where weights are based on GDP in 2005
prices and exchange rates.e Includes trade in goods and non-factor services. Previous WESP reports reported growth of merchandise trade only.
6 World Economic Situation and Prospects 2011
The economic recovery in Western Asia is also expected to moderate from 5.5 per cent in 2010 to 4.7 per cent in 2011 and 4.4 per cent in 2012. At this pace, average annual output growth will be below the rates prevailing in the years before the crisis. The fuel-exporting economies of the region have not levelled oil production after the cutbacks made in response to the global recession.
Economic recovery has been solid but below potential in most countries in Africa. In South Africa especially, the region’s largest economy, output growth remains sub-par as a result of, inter alia, weak manufacturing export growth. Elsewhere in the region, the economic recovery has been supported by the rebound in the demand for and prices of primary commodities as well as by increases in public investments in infrastructure, foreign direct investment (FDI) in extracting industries and improvements in conditions for agricultural production. In the outlook, the economic growth in the region is expected to remain somewhat below pre-crisis rates, averaging about 5.0 per cent for 2011-2012.
On the other hand, formidable challenges remain in the long-run development of many low-income countries. Although average per capita income growth for these coun-tries is expected to return to near pre-crisis rates in the outlook (figure I.2), it will not be sufficient to fully make up for the setbacks caused by the crisis. In particular, the recovery in many of the least developed countries (LDCs) will be below potential. Per capita income growth among LDCs is expected to reach about 3 per cent per annum during 2010 and 2011, which is well below the annual average of 5 per cent achieved during 2004-2007. The LDCs face diverging conditions. Bangladesh and the LDCs in East and Southern Africa are showing strong economic growth, while production in the Sahel, West Africa and parts of Asia is suffering either from adverse weather conditions or from fragile political and security situations, or both (see box I.2 for the economic prospects for the LDCs).
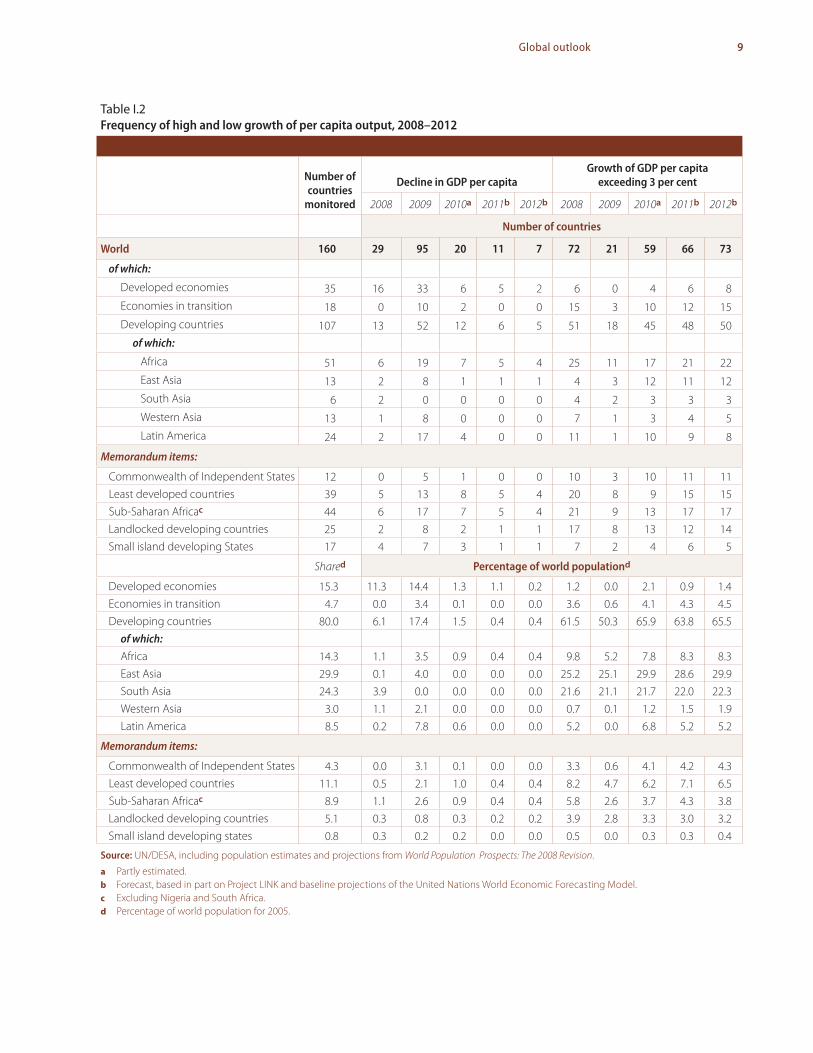
Overall, the number of countries experiencing declines in per capita income dropped significantly, from 52 in 2009 to 12 in 2010 (table I.2). During 2010, 45 developing
The recovery in least developed countries will
be below potential in the near term
Figure I.1Growth of the world economy, 2004-2012
Percentage change
4.0
3.6
4.1 4.0 3.5
1.6
-2.0
3.6
3.1
-3
-2
-1
0
1
2
3
4
5
2004 2005 2006 2007 2008 2009 2010a 2011b 2012b
Baseline
Optimistic
Pessimistic
Source: UN/DESA and Project LINK.
Note: See box I.1 for the baseline forecast
assumptions. The pessimistic scenario refers to a situation
of enhanced macroeconomic uncertainty in the outlook
(see box I.4), while the optimistic scenario is one of limited, but improved,
international policy coordination (see box I.5).
a Estimates.b United Nations forecast.
7Global outlook
Figure I.2Growth of GDP per capita, by level of development, 2000-2012
Percentage
-6.0
-4.0
-2.0
0.0
2.0
4.0
6.0
8.0
10.0
2000 2002 2004 2006 2008 2010 2012
Source: UN/DESA and Project LINK.
Lower middle income countries
Upper middle income countries
Least developed countries
High-income countries
Low-income countries
Prospects for the least developed countriesa
Most least developed countries (LDCs) have weathered the crisis relatively well owing to their limited exposure to the international financial system and, in the case of a number of non-fuel exporters, their relatively low exports-to-gross domestic product (GDP) ratios. Yet, none of the LDCs have been immune to the synchronized global slowdown, which depressed exports and reduced investment. The crisis has set back the progress made in these countries towards achieving the millennium devel-opment goals (MDGs). The welfare losses suffered in late 2008 and early 2009 will be long-lasting, as nearly all LDCs will see a recovery well below pre-crisis growth rates in the outlook for 2011 and 2012. The outlook differs significantly across countries, however.
A number of LDCs have been severely affected by natural disasters. Haiti was hit by a catastrophic earthquake, with damage totalling about 120 per cent of the country’s GDP for 2009. Droughts in the Sahel have severely affected Chad, Mauritania and especially Niger, where up to half the population has faced acute food shortages. In Benin, months of heavy rain resulted in the worst flooding since 1963. Meanwhile, a number of countries, including Afghanistan, the Democratic Republic of the Congo, Haiti and Liberia, obtained some financial relief through debt relief or debt restructuring.
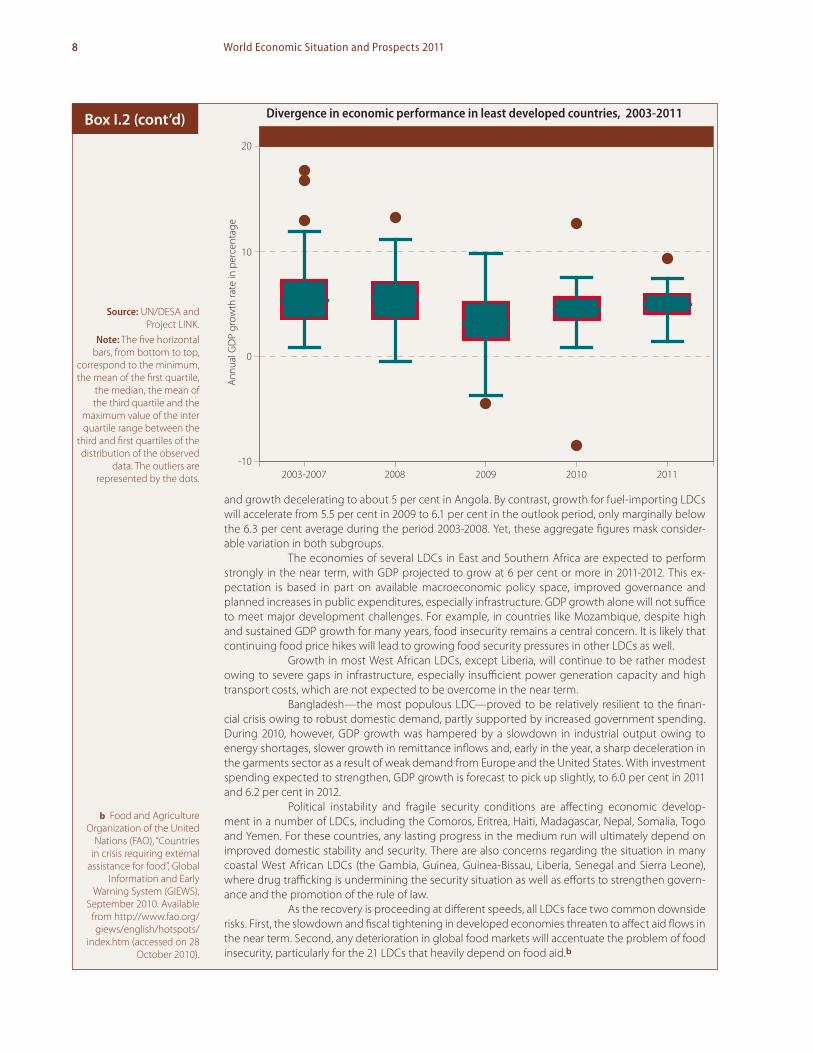
Economic activity in most LDCs improved in 2010 along with the recovery in interna-tional trade and the rebound in many commodity prices. In addition, growth in several economies was supported by increased government spending. Aggregate growth for the group will accelerate from 4.0 per cent in 2009—the lowest rate in over a decade—to about 5.5 per cent in 2010-2012, with significant divergence among the poorest and structurally handicapped nations (see figure). Nevertheless, growth will remain well below the annual average of 7.2 per cent during the period 2003-2008. In the five fuel-exporting LDCs, growth is forecast to decelerate from an annual average of 9.2 per cent in 2003-2008 to 4.6 per cent in 2010-2012, with oil output declining in Equatorial Guinea
Box I.2
a While the group of least developed countries (LDCs) includes 49 economies, only the 37 members for which macroeconomic data are available are covered here. For details on the definition of the category of LDCs, see http://www.un.org/esa/policy/devplan/.
8 World Economic Situation and Prospects 2011
and growth decelerating to about 5 per cent in Angola. By contrast, growth for fuel-importing LDCs will accelerate from 5.5 per cent in 2009 to 6.1 per cent in the outlook period, only marginally below the 6.3 per cent average during the period 2003-2008. Yet, these aggregate figures mask consider-able variation in both subgroups.
The economies of several LDCs in East and Southern Africa are expected to perform strongly in the near term, with GDP projected to grow at 6 per cent or more in 2011-2012. This ex-pectation is based in part on available macroeconomic policy space, improved governance and planned increases in public expenditures, especially infrastructure. GDP growth alone will not suffice to meet major development challenges. For example, in countries like Mozambique, despite high and sustained GDP growth for many years, food insecurity remains a central concern. It is likely that continuing food price hikes will lead to growing food security pressures in other LDCs as well.
Growth in most West African LDCs, except Liberia, will continue to be rather modest owing to severe gaps in infrastructure, especially insufficient power generation capacity and high transport costs, which are not expected to be overcome in the near term.
Bangladesh—the most populous LDC—proved to be relatively resilient to the finan-cial crisis owing to robust domestic demand, partly supported by increased government spending. During 2010, however, GDP growth was hampered by a slowdown in industrial output owing to energy shortages, slower growth in remittance inflows and, early in the year, a sharp deceleration in the garments sector as a result of weak demand from Europe and the United States. With investment spending expected to strengthen, GDP growth is forecast to pick up slightly, to 6.0 per cent in 2011 and 6.2 per cent in 2012.
Political instability and fragile security conditions are affecting economic develop-ment in a number of LDCs, including the Comoros, Eritrea, Haiti, Madagascar, Nepal, Somalia, Togo and Yemen. For these countries, any lasting progress in the medium run will ultimately depend on improved domestic stability and security. There are also concerns regarding the situation in many coastal West African LDCs (the Gambia, Guinea, Guinea-Bissau, Liberia, Senegal and Sierra Leone), where drug trafficking is undermining the security situation as well as efforts to strengthen govern-ance and the promotion of the rule of law.
As the recovery is proceeding at different speeds, all LDCs face two common downside risks. First, the slowdown and fiscal tightening in developed economies threaten to affect aid flows in the near term. Second, any deterioration in global food markets will accentuate the problem of food insecurity, particularly for the 21 LDCs that heavily depend on food aid.b
Box I.2 (cont’d) Divergence in economic performance in least developed countries, 2003-2011
Annu
al G
DP
grow
th ra
te in
per
cent
age
2003-2007 2008 2009 2010 2011
20
10
0
-10
b Food and Agriculture Organization of the United
Nations (FAO), “Countries in crisis requiring external
assistance for food”, Global Information and Early
Warning System (GIEWS), September 2010. Available
from http://www.fao.org/giews/english/hotspots/
index.htm (accessed on 28 October 2010).
Source: UN/DESA and Project LINK.
Note: The five horizontal bars, from bottom to top,
correspond to the minimum, the mean of the first quartile,
the median, the mean of the third quartile and the
maximum value of the inter quartile range between the
third and first quartiles of the distribution of the observed
data. The outliers are represented by the dots.
9Global outlook
Table I.2 Frequency of high and low growth of per capita output, 2008–2012
Commonwealth of Independent States 4.3 0.0 3.1 0.1 0.0 0.0 3.3 0.6 4.1 4.2 4.3Least developed countries 11.1 0.5 2.1 1.0 0.4 0.4 8.2 4.7 6.2 7.1 6.5Sub-Saharan Africac 8.9 1.1 2.6 0.9 0.4 0.4 5.8 2.6 3.7 4.3 3.8Landlocked developing countries 5.1 0.3 0.8 0.3 0.2 0.2 3.9 2.8 3.3 3.0 3.2Small island developing states 0.8 0.3 0.2 0.2 0.0 0.0 0.5 0.0 0.3 0.3 0.4
Source: UN/DESA, including population estimates and projections from World Population Prospects: The 2008 Revision.
a Partly estimated.b Forecast, based in part on Project LINK and baseline projections of the United Nations World Economic Forecasting Model.c Excluding Nigeria and South Africa.d Percentage of world population for 2005.
10 World Economic Situation and Prospects 2011
countries achieved per capita growth rates of 3 per cent or more, which is sometimes consid-ered the minimum rate needed to facilitate substantial poverty reduction. In comparison, before the crisis in 2007, there were 68 developing countries with welfare increases above that threshold. In sub-Saharan Africa, 13 countries registered per capita growth of more than 3 per cent in 2010, compared with 23 in 2007. In the outlook, 48 developing countries are expected to have per capita growth of more than 3 per cent in 2011, and 50 in 2012.
Outlook for employment
Next to the continued financial fragility in developed countries, the lack of remunera-tive employment growth is probably the weakest link in the recovery. Between 2007 and the end of 2009, at least 30 million jobs were lost worldwide as a result of the global financial crisis.1 Even this number most likely underestimates the true depth of the jobs crisis, since it is based on official labour statistics, which in many developing countries only account for formal sector employment in urban areas and hence may not include those pushed into precarious employment in the informal sector or underemployment in low-productivity rural economic activities. Owing to the below-potential pace of output growth in the recovery—particularly in developed economies—which barely matched the natural growth rate of the labour force, few new jobs have been created to hire back those workers who have been laid off. Meanwhile, as more Governments are embarking on fiscal tightening, including tax hikes and spending cuts, the prospects for a fast recovery of employment look even gloomier.
Only a few developed economies, such as Australia and Germany, have seen a discernable improvement in labour markets. In the United States, the labour market improved slightly in early 2010, only to falter again later, in particular as state and local Governments started to lay off workers. The unemployment rate may increase to 10 per cent in early 2011, up from 9.6 per cent in the third quarter of 2010. All projections indi-cate that it will take more than a few years before the unemployment rate in the United States falls to its pre-crisis level.
In the euro area, despite improvements in Germany’s job market, the average unemployment rate has continued to drift upwards, reaching 10.1 per cent in 2010, up from 7.5 per cent before the crisis. In Spain, the unemployment rate more than doubled, to 20.5 per cent. It also increased dramatically in Ireland, where it reached 14.9 per cent in 2010, and in other countries in the region. In France, unemployment edged up along aver-age lines for the euro area. In the outlook, unemployment in Europe is expected to come down at only a snail’s pace. In Japan, the improvement in the labour market was marginal during 2010, with the unemployment rate expecting to remain above 5 per cent in 2011.
A “jobless” recovery such as the one being faced at present by the developed countries is not uncommon in the recent history of the business cycle. However, the time needed for employment levels to recover to pre-recession levels has become successively longer. Data for the United States indicate that after each recession during the 1950s and 1960s it took about one year to recover the jobs lost in the downturn. In the 1970s and 1980s, it took between one and two years, but after the recession of the early 1990s and after the 2001 dotcom crisis, the period for job recovery lengthened to two and a half years or more (figure I.3). Today’s Great Recession, however, has caused a faster and steeper rise
1 See International Monetary Fund (IMF) and International Labour Organization (ILO), “The challenges of growth, employment and social cohesion”, discussion document from the Joint ILO-IMF conference in cooperation with the office of the Prime Minister of Norway, 13 September 2010, Oslo, Norway. Available from http://www.osloconference2010.org/discussionpaper.pdf.
Thirty million jobs have been lost worldwide because of the crisis
It may take several years for employment to return
to pre-crisis levels in developed economies
11Global outlook
in the rate of unemployment in the United States than in any previous downturn. It has already been three years since employment started to fall in 2007, longer than any previous episode, and it is yet to see any significant recovery. At the present pace of job recovery, it will take many more years for employment to be back at pre-crisis levels.
A few interrelated factors explain the lagging recovery in the job markets of major developed economies. First, the pace of GDP growth in the recovery phase has become less and less robust after each business cycle. Second, rapid technological progress, along with structural economic change, especially in the form of a smaller share of manufacturing and a larger share of services in the economy, explain why purely cyclical movements have become less important than structural factors in determining the upward and downward swings in developed economies. In earlier business cycle episodes, workers who lost jobs during the downturn would, for the most part, be able to regain employment relatively quickly in the upturn in the same sector, if not the same company, in which they had been work-ing. Nowadays, however, more and more job losses during the downturn tend to become permanent, forcing the unemployed to find jobs in other sectors during the recovery. This often means workers have to acquire different skills, and ones that are highly dependent upon the development of new industrial sectors in the economy. In addition, the history of financial crises suggests that when a recession is caused or accompanied by a banking crisis, the recovery of output, employment and real wages is much more protracted.
The longer term employment consequences of the present crisis are already becoming visible. Workers have been without a job for more time, and in some coun-tries youth unemployment has reached alarming heights. The share of the structurally or long-term unemployed has increased significantly in most developed countries since 2007. In the United States, for instance, the share of workers who have been unemployed for 27 weeks or more has been rising at a disturbing pace during 2010; about half of the
Long-term unemployment is rising and youth unemployment is reaching alarming heights
Figure I.3Post-recession employment recovery in the United States, 1973, 1980, 1981, 1990, 2001 and 2007
Percentage
-7
-6
-5
-4
-3
-2
-1
0
1
0 6 12 18 24 30 36Number of months from start of recession
Deg
ree
of e
mpl
oym
ent b
elow
(-) o
r abo
ve (+
) pre
-rec
essio
n le
vel
2007
198119731980 2001 1990
Source: UN/DESA calculations, based on data from U.S. Department of Labor, Bureau of Labor Statistics (www.bls.gov/ces).Note: Data refer to “civilian employment”, seasonably adjusted, for workers 16 years of age and older.
12 World Economic Situation and Prospects 2011
workers without a job are now in that position. The situation is equally worrisome in many European countries.
Unemployment and underemployment rates are very high among young peo-ple (15 to 24 years of age), both in developed and developing regions. At the end of 2009, there were an estimated 81 million unemployed young people, and the rate of global youth unemployment stood at 13.0 per cent, having increased by 0.9 percentage points from 2008. This represents a significant acceleration compared with the 0.6 percentage point increase seen in the rate of youth unemployment between 1998 and 2008.
Persistent high unemployment, stagnant or declining real wages and subdued output recovery can push the economy into a vicious circle and entrap it in a protracted period of below-potential growth, or, in some cases, it may even cause a double-dip reces-sion. High unemployment and lower real wages will constrain the recovery in household consumption, which in turn will drag output growth; below-potential output growth will, for its part, constrain employment growth. The longer this vicious circle lasts, the higher the risk of “cyclical” unemployment becoming “structural”, thereby impairing potential growth of the economy in the longer run. For younger workers who stay without a job for a prolonged period, the likely implications will seriously jeopardize future earnings opportunities as a result of their being deprived of years of working experience.
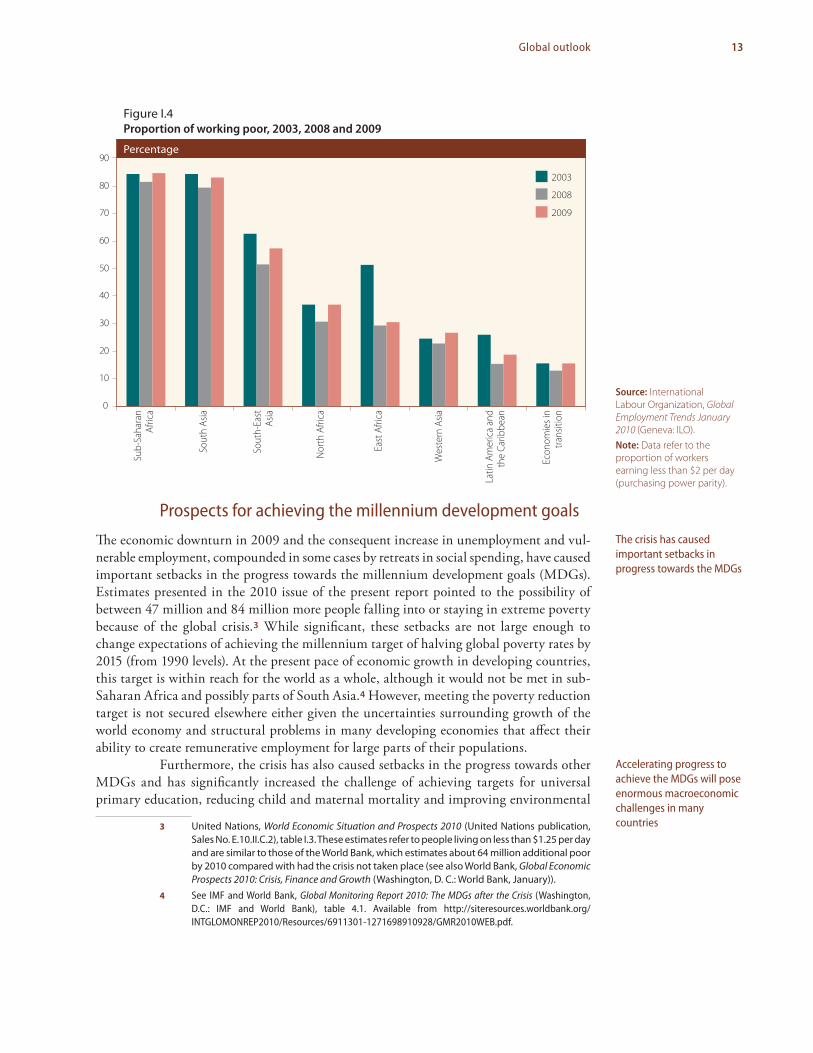
Workers in developing countries and economies in transition have been se-verely affected by the crisis also, though the impact in terms of job losses emerged later and was much more short-lived than in developed countries. Most job losses occurred in export sectors and were greatest during the last quarter of 2008 and the first quarter of 2009 when global trade collapsed. Where domestic demand was also affected, further job losses oc-curred in other parts of the economy, especially in construction. The impact on aggregate unemployment rates was softened by the absorption of many workers into the informal sectors and, in fact, even allowed aggregate employment levels to continue to grow during 2009, albeit only weakly. The consequence is that while the impact on open unemploy-ment rates has been muted, many more workers have ended up in vulnerable jobs with lower pay. The International Labour Organization (ILO) estimates that the proportion of workers earning less than $2 per day increased by 3 percentage points, implying that the number of working poor increased by about 100 million during 2009 (figure I.4).
With the recovery in production, employment also started to rebound in many developing countries and economies in transition from the second half of 2009. Improvements in employment conditions are also noticeable in some CIS countries, includ-ing Belarus, the Russian Federation and Kazakhstan. In East Asia, the strong economic growth in the first half of 2010 was reflected in a visible decline in unemployment rates. Job growth was strongest in the manufacturing, construction and services sectors. By the end of the first quarter of 2010, unemployment rates had already fallen back to pre-crisis levels in most East Asian economies. Employment levels were also back up to pre-crisis levels by the first quarter of 2010 in a number of other developing countries, including Argentina, Brazil, Chile, Colombia, Egypt, Mexico, Peru, the Philippines and Turkey.
Despite this rebound in employment in parts of the world during 2010, the global economy would still need to create at least another 22 million new jobs in order to return to the pre-crisis level of global employment. At the current speed of the recovery, this would take at least five years, according to recent estimates by the ILO.2 This is al-most entirely on account of the weak recovery in advanced countries and the increasingly structural nature of unemployment in those countries.
2 ILO, World of Work Report 2010: From one crisis to the next? (Geneva: International Institute for Labour Studies).
High unemployment is the Achilles heel of the recovery
in developed economies
Recovery of employment has been faster in
developing countries
13Global outlook
Prospects for achieving the millennium development goals
The economic downturn in 2009 and the consequent increase in unemployment and vul-nerable employment, compounded in some cases by retreats in social spending, have caused important setbacks in the progress towards the millennium development goals (MDGs). Estimates presented in the 2010 issue of the present report pointed to the possibility of between 47 million and 84 million more people falling into or staying in extreme poverty because of the global crisis.3 While significant, these setbacks are not large enough to change expectations of achieving the millennium target of halving global poverty rates by 2015 (from 1990 levels). At the present pace of economic growth in developing countries, this target is within reach for the world as a whole, although it would not be met in sub-Saharan Africa and possibly parts of South Asia.4 However, meeting the poverty reduction target is not secured elsewhere either given the uncertainties surrounding growth of the world economy and structural problems in many developing economies that affect their ability to create remunerative employment for large parts of their populations.
Furthermore, the crisis has also caused setbacks in the progress towards other MDGs and has significantly increased the challenge of achieving targets for universal primary education, reducing child and maternal mortality and improving environmental
3 United Nations, World Economic Situation and Prospects 2010 (United Nations publication, Sales No. E.10.II.C.2), table I.3. These estimates refer to people living on less than $1.25 per day and are similar to those of the World Bank, which estimates about 64 million additional poor by 2010 compared with had the crisis not taken place (see also World Bank, Global Economic Prospects 2010: Crisis, Finance and Growth (Washington, D. C.: World Bank, January)).
4 See IMF and World Bank, Global Monitoring Report 2010: The MDGs after the Crisis (Washington, D.C.: IMF and World Bank), table 4.1. Available from http://siteresources.worldbank.org/INTGLOMONREP2010/Resources/6911301-1271698910928/GMR2010WEB.pdf.
The crisis has caused important setbacks in progress towards the MDGs
Accelerating progress to achieve the MDGs will pose enormous macroeconomic challenges in many countries
Figure I.4Proportion of working poor, 2003, 2008 and 2009
Percentage
0
10
20
30
40
50
60
70
80
90
Sub-
Saha
ran
Afric
a
Sout
h As
ia
Nor
th A
frica
East
Afri
ca
Wes
tern
Asia
Latin
Am
eric
a an
dth
e Ca
ribbe
an
Sout
h-Ea
stAs
ia
Econ
omie
s in
trans
ition
2003
2008
2009
Source: International Labour Organization, Global Employment Trends January 2010 (Geneva: ILO).Note: Data refer to the proportion of workers earning less than $2 per day (purchasing power parity).
14 World Economic Situation and Prospects 2011
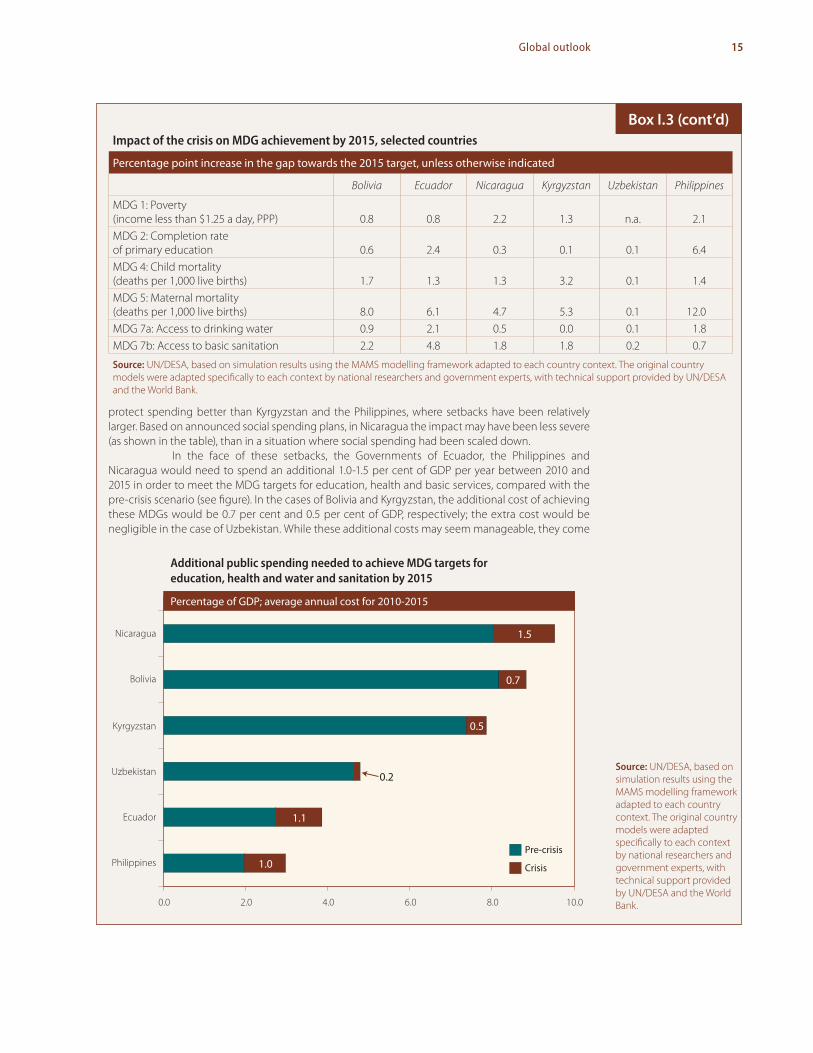
and sanitary conditions. Despite increasing fiscal constraints, many Governments in de-veloping countries made laudable efforts during the crisis to protect the most vulnerable by directing a significant proportion of stimulus measures at pro-poor and social protection programmes.5 Countries that managed to do so, such as Bolivia and Ecuador, were able to mitigate the impact of the crisis on education and health outcomes, but nonetheless could not avoid certain setbacks. Accelerating progress towards the MDGs has become more costly as a consequence, both in these cases and even more so in countries that did not manage to protect social spending during the crisis (see box I.3). The requirements for stepping up economic growth and social spending had posed significant macroeconomic challenges even before the crisis, but they have become all the more pressing in cases where setbacks have been the greatest. In Nicaragua, for instance, additional spending requirements for education, health, water and sanitation have increased to about 11 per cent of GDP annually between 2010 and 2015 in order to meet the MDG targets, up from 8 per cent of GDP in a scenario absent the impact of the global crisis. In Ecuador, the additional requirements are significantly less, despite a stronger drop in GDP growth, as the Government managed to protect social spending better during the crisis.
5 See, for instance, Yongzheng Yang and others, Creating Policy Space in Low-Income Countries during the Recent Crises (Washington, D. C.: IMF, 2009), which shows that in 16 out of 19 low-income countries an average of about 24 per cent of the total announced fiscal stimulus was directed at pro-poor and social protection programmes.
Impact of the crisis and macroeconomic challenges to meeting the millennium development goals
Slower or negative per capita income growth has undoubtedly caused setbacks in the progress towards the millennium development goals (MDGs) in many developing countries. How much? That is more difficult to answer as it depends on country conditions. Slower growth affects household incomes and job creation, which will have a direct impact on income poverty (MDG1). But some parts of the economy, such as export sectors, have been hit harder than others in most economies, and the degree of the impact will also depend on how many poor find employment in export activities or how much an expansion of informal sector employment pushes down the average remuneration in that part of the economy. Less income will also affect access to social services and hence progress towards the other MDGs. But that impact will further depend on the fiscal space countries have to protect spending on education, health and basic sanitation during the crisis. In cases where setbacks were unavoidable, accelerating progress to meet the MDGs by 2015 will provide an even greater chal-lenge for spending strategies and macroeconomic policies. To take account of all the interactions at work, to estimate the macroeconomic costs of achieving the MDGs and to evaluate alternative financing strategies, an economy-wide macro-micro framework was applied to a reasonable number of developing countries.a As indicated in the body of the chapter, the macroeconomic challenges of accelerating progress towards the MDGs differ widely across countries. This is illustrated further by the six country cases discussed below.
Under a scenario of the observed impact of the crisis on output growth and govern-ment spending during 2008-2010 and a projected slow and gradual economic recovery towards 2015, Nicaragua and the Philippines would suffer a setback of 2 percentage points in poverty reduction, whereas Bolivia, Ecuador and Kyrgyzstan would experience a setback of about one percentage point (see table). In the case of Uzbekistan, setbacks for all of the MDGs have been minimal as the country barely suffered any downturn and was thus able to sustain spending towards the MDGs. In the other countries, differences in the impact on projected outcomes for primary school completion rates, child and maternal mortality and access to drinking water and sanitation by 2015 can be attributed in part to different responses to adjusting social spending during the crisis. Bolivia and Ecuador managed to
Box I.3
a For a description of the methodology, see Marco
V. Sánchez and others, Public Policies for Human
Development (London: Palgrave, 2010), chapters
1 and 3. The country-level analysis was conducted by national researchers
and government experts with technical support
from the Department of Economic and Social Affairs
of the United Nations (UN/DESA) and the World
Bank. The methodology involves, inter alia, a
detailed microeconomic analysis of determinants of MDG achievement, which
is used as an input to a dynamic economy-wide
modelling framework called MAMS (MAquette for MDG
Simulations).
15Global outlook
protect spending better than Kyrgyzstan and the Philippines, where setbacks have been relatively larger. Based on announced social spending plans, in Nicaragua the impact may have been less severe (as shown in the table), than in a situation where social spending had been scaled down.
In the face of these setbacks, the Governments of Ecuador, the Philippines and Nicaragua would need to spend an additional 1.0-1.5 per cent of GDP per year between 2010 and 2015 in order to meet the MDG targets for education, health and basic services, compared with the pre-crisis scenario (see figure). In the cases of Bolivia and Kyrgyzstan, the additional cost of achieving these MDGs would be 0.7 per cent and 0.5 per cent of GDP, respectively; the extra cost would be negligible in the case of Uzbekistan. While these additional costs may seem manageable, they come
Box I.3 (cont’d)Impact of the crisis on mDg achievement by 2015, selected countries
Percentage point increase in the gap towards the 2015 target, unless otherwise indicated
Bolivia Ecuador Nicaragua Kyrgyzstan Uzbekistan Philippines
MDG 1: Poverty (income less than $1.25 a day, PPP) 0.8 0.8 2.2 1.3 n.a. 2.1MDG 2: Completion rate of primary education 0.6 2.4 0.3 0.1 0.1 6.4MDG 4: Child mortality (deaths per 1,000 live births) 1.7 1.3 1.3 3.2 0.1 1.4MDG 5: Maternal mortality (deaths per 1,000 live births) 8.0 6.1 4.7 5.3 0.1 12.0MDG 7a: Access to drinking water 0.9 2.1 0.5 0.0 0.1 1.8MDG 7b: Access to basic sanitation 2.2 4.8 1.8 1.8 0.2 0.7
Source: UN/DESA, based on simulation results using the MAMS modelling framework adapted to each country context. The original country models were adapted specifically to each context by national researchers and government experts, with technical support provided by UN/DESA and the World Bank.
Additional public spending needed to achieve MDG targets for education, health and water and sanitation by 2015
Percentage of GDP; average annual cost for 2010-2015
1.0
1.1
0.5
0.7
1.5
0.2
0.0 2.0 4.0 6.0 8.0 10.0
Nicaragua
Bolivia
Kyrgyzstan
Uzbekistan
Ecuador
PhilippinesPre-crisis
Crisis
Source: UN/DESA, based on simulation results using the MAMS modelling framework adapted to each country context. The original country models were adapted specifically to each context by national researchers and government experts, with technical support provided by UN/DESA and the World Bank.
16 World Economic Situation and Prospects 2011
Unfortunately, the mood for fiscal tightening also seems to be taking hold in many developing countries, even in those with a policy intention of safeguarding “priority” social spending.6 This is a worrying trend, particularly where GDP growth is moderating because of weaker export growth and continued weak domestic demand, and also because protecting social spending is not the same as the significant expansion needed in most countries that still display large shortfalls in MDG achievement. The difficulties in most low-income countries in sustaining (or increasing) expenditure patterns has thus far been caused mainly by substantial declines in tax revenue rather than major declines in official
6 A recent study by UNICEF concluded that real government expenditure in about one quarter of 126 developing countries is expected to contract in 2010-2011 (see Isabel Ortiz and others, “Prioritizing expenditures for a recovery for all: A rapid review of public expenditures in 126 developing countries”, Social and Economic Policy Working Paper (New York: United Nations Children’s Fund (UNICEF), 2010)). Moreover, another study has found that two thirds of the 56 low-income countries surveyed are cutting budget allocations in 2010 to one or more “priority” pro-poor sectors, which include education, health, agriculture and social protection (see Katerina Kyrili and Matthew Martin, “The impact of the global economic crisis on the budgets of low-income countries”, research report for Oxfam International (Oxford, United Kingdom: Oxfam GB, July 2010)).
on top of the already considerable MDG spending requirements prior to the crisis (given pre-existing shortfalls). As a result, the challenge for Nicaragua would be to increase spending for education, health and basic services by 9.5 per cent of GDP during 2010-2015. The required efforts would be of a similar magnitude in Bolivia and Kyrgyzstan, while in Ecuador, the Philippines and Uzbekistan the estimated additional macroeconomic costs in these policy simulations would be in the order of 3.0-5.0 per cent of GDP. Such impacts may be even larger in many countries that are poorer than these lower middle income countries. Clearly, additional costs of this magnitude may stretch government finances and could lead to steep increases in public debt or demand infeasible increases in domestic tax burdens. The situation would be even more pronounced absent a simultaneous acceleration of economic growth.
The additional government spending for the achievement of the MDGs could have a counter-cyclical impact. Further analysis shows, however, that without a broader set of accom-panying growth-stimulating policies, even large increases in social spending may be partially off-set by macroeconomic trade-offs. For instance, in a scenario where all additional spending was financed through foreign borrowing (as assumed in the simulations discussed above) significant real exchange-rate appreciation would have a negative impact on export and investment growth. Similar macroeconomic trade-offs would be induced if additional aid inflows covered the additional costs of achieving the MDGs. In alternative financing scenarios in which the tax burden were increased or the Government were to borrow on domestic capital markets, private consumption or investment spending, or both, would be affected and thus lower the aggregate growth effects. Such trade-offs tend to be stronger where the MDG spending strategy is not accompanied by productivity improve-ments. Better education and health outcomes are likely to have a positive impact on overall labour productivity. However, as assumed in the present analysis, such an impact is not likely to take shape in the short run. Education cycles are long and today’s improvements in the health status of the young will take time before they translate into higher labour productivity. Much of the productivity growth effects of additional action taken today to accelerate progress towards the MDGs will likely take effect after 2015. The MDG strategy may thus pose important intertemporal macroeconomic trade-offs. These would need to be addressed by broader economic policies that strengthen employment and productivity growth, such as infrastructure investments, credit policies and other support measures fostering investments in economic diversification and counteracting exchange-rate appreciation. Such policies would further need the support of an enabling external environment, especially in the form of a stronger recovery of export demand. This in turn, however, will require strengthened international policy coordination, as discussed in the body of the chapter.
Box I.3 (cont’d)
17Global outlook
development assistance (ODA). However, the outlook for more generous aid delivery in the near future is sombre, and this will make the achievement of the MDGs all the more challenging in many developing countries.
Continued low inflation
Inflation is expected to remain low worldwide during 2010-2012 (annex tables A.4-A.6). Except for a few Asian developing economies, inflation should not be of much concern to policymakers in most countries in the near outlook.
In several developed economies, aggregate price levels actually declined (defla-tion) during the nadir of the recession in 2009, but with the recovery in aggregate demand, inflation returned, though at low levels. During 2010, inflation ranged between 1 and 2 per cent in most developed countries. Deflation persists in Japan, however.
With the huge amounts of liquidity provided by the central banks of developed countries, the extremely low interest rates and the widening government deficits, some analysts have been warning of risks of escalating inflation. However, not only have the current rates of headline inflation stayed at very low levels despite the massive monetary expansion, inflationary expectations, as measured by inflation-indexed bonds and various business surveys, also remain muted. As explained in the section on policy challenges be-low, much of the liquidity provided by the central banks has been retained in the banking system, with hardly any growth in credit supplies to the real economy. The stagnation in credit growth, along with wide output gaps and elevated unemployment in most developed economies, should give rise to little concern that inflation would escalate much in the near future. Moreover, central banks in developed economies have already announced plans to withdraw liquidity once the recovery has matured in order to pre-empt any surge in inflation.
Among developing countries and economies in transition, South Asia is a cause for some concern as regards inflation. Consumer price inflation is expected to average 11.0 per cent in 2010 in this subregion. The continuing strong inflationary pressures in most countries of the region reflect a combination of supply- and demand-side factors. These include higher fuel prices, partly as a result of reduced subsidies, strong demand for manu-factured goods and rapidly rising food prices, which account for a large share of consumer price indices. While food price inflation has eased somewhat in the second half of 2010 owing to good harvests, it has still pushed the general price level higher. In India, the central bank continues to be particularly concerned with inflation, which has remained persistently high despite significant monetary tightening in 2010. In Pakistan, consumer price inflation increased sharply in the second half of the year as the disastrous floods of July and August destroyed crops and rural infrastructure, leading to food shortages and driving up food prices further. Rapidly rising food prices have also exerted upward pressure on consumer prices in some East Asian economies, most notably in China, where authorities have started to reduce the monetary stimulus injected during the financial crisis. In other developing regions, inflation rates have also increased during 2010, but only modestly, such that inflation is still below pre-crisis levels.
Inflation poses no present danger…
…except in parts of South Asia
18 World Economic Situation and Prospects 2011
International economic conditions for developing countries and economies in transition
Returning, but risky, capital flows
During 2010, net private capital inflows to emerging economies7 continued to recover from their precipitous decline in late 2008 and early 2009. A better economic performance of emerging economies has been conducive to the recovery of private inflows. In addition, the extremely low nominal interest rates and unprecedented scale of quantitative easing in major developed economies have led international investors to relocate funds towards emerging markets in search of higher returns. The expectations of currency appreciation in emerging economies and improved prospects for the prices of primary commodities that many emerging economies export have heightened perceptions of much higher profit-ability in these markets, and much of the increase in financial flows appears to be short term and speculative in nature.
Net private inflows to these economies are estimated to be above $800 billion in 2010, a more than 30 per cent increase from the previous year, though still about $400 billion lower than the pre-crisis peak levels registered in 2007. The momentum of the capital inflows to these economies tapered off somewhat in late 2010, and the outlook for 2011 is for only a slight increase in the inflows.
FDI inflows remain the largest component, accounting for more than 40 per cent of the total inflows to emerging economies in 2010. However, the increase in in-flows of portfolio equity has been strongest among the different types of capital flows and increased by 25 per cent in 2010. While inflows of portfolio equity to Asia account for the lion’s share, the rebound in inflows to Latin America has also been particularly strong, doubling the amount of inflows received in 2009. In the outlook for 2011, some moderation is expected. An important part of the increase in equity inflows in 2010 was related to a reallocation in the portfolios of major institutional investors, including pen-sion funds, which some observers expect to be a “one-off” adjustment, moderating the prospect of any large increases in the near outlook. The appetite for investing in emerging markets may also moderate because those equities now look more expensive than they did a year ago. Yet, the prospects for private capital flows remain subject to great uncertainty given the risks of further exchange-rate instability and global monetary conditions, as discussed below.
International bank lending to emerging economies also resumed in 2010 after negative net flows in 2009. Even so, the share of bank lending in total private capital flows to emerging markets is still far below that of the pre-crisis period and reflects the ongoing process of deleveraging in international banks. Non-bank lending has recovered more vigorously, as both private and public sectors in emerging economies managed to increase issuance of bonds in developed countries and take advantage of low interest rates. With the improved outlook in emerging markets and positive perceptions of investors, the external financing costs for emerging economies have fallen back to pre-crisis levels.
While private capital returned, emerging economies also significantly stepped up their own investments abroad. Direct investments from countries like China continued
7 The reference is to a group of some 30 developing countries and economies in transition, which are well integrated into the global economy through trade and finance linkages. For more details, see Institute of International Finance, “Capital flows to emerging market economies”, IIF Research Note, 4 October 2010. Available from http://www.iif.com/press/press+161.php.
A surge in private capital flows is posing policy concerns in emerging
economies
Capital outflows from emerging markets continue
to increase…
19Global outlook
to increase and private residents in emerging markets sought safe havens in assets abroad. Outflows fell in 2009, to increase again in 2010 and 2011. New FDI by firms established in emerging economies, destined especially towards commodity production in other de-veloping countries, explain a large part of the increase.
In addition, developing countries and economies in transition have continued to accumulate foreign-exchange reserves in 2010, adding about $500 billion to the total of $5.4 trillion by the end of 2009. A large proportion was accumulated by developing coun-tries in Asia, particularly China, which is holding about $2.6 trillion in foreign-exchange reserves. During the trough of the crisis, the last quarter of 2008 and the first of 2009, developing countries tapped into this buffer, and reserve holdings dropped by about $300 billion in the aggregate (figure I.5). The recovery of exports and the subsequent return of capital flows facilitated the resumption of the growth in reserve holdings.
Many low-income economies have weaker policy buffers and limited access to capital markets. As detailed in chapter III, stagnation in flows of ODA and shortfalls in the delivery on commitments made by donor countries to increase those flows in support of the achievement of the MDGs, estimated at $20 billion in 2010, are limiting scope for counter-cyclical responses in low-income countries. The shortcomings in ODA delivery were compensated to some degree through increased funding and reform of multilateral financial facilities.8 In January 2010, countries that qualified to draw on concessional re-sources obtained enhanced access to International Monetary Fund (IMF) facilities under much simplified conditions. By 30 April 2010, 30 low-income countries had arranged concessional IMF programmes totalling almost $5 billion, up from $0.2 billion in 2007. Multilateral development banks also sharply boosted their lending. While the majority of
8 United Nations, MDG Gap Task Force Report 2010: The Global Partnership for Development at a Critical Juncture (United Nations publication, Sales No. E.10.I.12).
… as do their reserve holdings
Figure I.5Foreign reserve accumulation by developing countries, first quarter 2007-second quarter 2010
Trillions of US dollars
20082007 2009 2010
0.0
1.0
2.0
3.0
4.0
5.0
6.0
I II III IV I II III IV I II III IV I II
Use of reservesduring trough
of crisis
Other developing countries
China
Source: IMF, Statistics Department COFER database; and International Financial Statistics.
20 World Economic Situation and Prospects 2011
their outlays were non-concessional, there were very significant increases in concessional lending as well. In particular, the International Development Association of the World Bank committed $14 billion in loans in 2009, a 20 per cent increase over 2008, to be disbursed over several years.
Rebounding world trade, volatile commodity prices
World trade continued to recover in 2010, but the momentum of the strong growth observed in the first half of the year started to peter out in the second. The volume of exports of many emerging economies, including Brazil, China, India and other developing economies in Asia, have already recovered to, or beyond, pre-crisis peaks. In contrast, exports of developed economies have not yet reached full recovery and were still 8 per cent below the pre-crisis peaks seen in the third quarter of 2010 (figure I.6). In the outlook, world trade is expected to grow by about 6.5 per cent in 2011 and 2012, moderating from the 10.5 per cent rebound in 2010.
At the height of the crisis, the value of imports of the European Union (EU), Japan and the United States plummeted by almost 40 per cent between July 2008 and April 2009 and triggered the worldwide collapse in international trade.9 Despite the gradual recovery of the past two years, the value of imports of the three largest developed economies was still about 25 per cent below pre-crisis peaks by August 2010. The export recovery in these economies is mirrored in the fast growth of imports by countries in East Asia and Latin America. For instance, in China the contribution of net exports to GDP
9 The volume of imports of the three major developed economies fell by about 18 per cent during that period, compounded by a decline of about 24 per cent in import prices. These estimates are based on the same source as that for figure I.6.
The rebound in world trade decelerated during 2010
Figure I.6Volume of world merchandise trade, January 2005-August 2010
Index, 2005=100
2005 2006 2007 2008 2009 2010
Jan
May
Sep
Jan
May
Sep
Jan
May
Sep
Jan
May
Sep
Jan
May
Sep
Jan
May
Emerging economies
Developed economies
World
80
90
100
110
120
130
140
150
Source: CPB Netherlands Bureau for Economic
Policy Analysis.
21Global outlook
growth was negative during 2010, implying that the contribution of China’s net imports to GDP growth in the rest of the world has been positive.
The question is, however, whether emerging economies can continue to act as the engines of world trade growth in the outlook. As discussed in the previous section, there is reason not to be overly optimistic in this regard. The dynamics of the initial phase of the recovery seems to be fading, especially as growth in developed countries remains sluggish. Without a stronger recovery in import demand from developed economies, ex-port growth of developing countries is also bound to slow, given their continued high dependence on advanced country markets. Furthermore, as some major surplus countries, like China, are reorienting growth to rely more on domestic demand, growth of import demand is likely to slow given the lower import propensity of domestic demand compared with that of export production.
The value of world trade received a boost as most commodity prices have re-bounded. The world price of crude oil fluctuated at about $78 per barrel during 2010, up from an average of $62 for the year 2009. In the outlook for 2011, global oil demand is expected to increase further, but at a more moderate pace than in 2010. Most of the demand growth will continue to come from emerging economies, especially China and India. The efforts towards achieving greater energy efficiency in these countries are being offset by the economic expansion and higher living standards which keep up the demand for fossil-fuel based energy. In contrast, oil demand in developed economies is expected to register a modest decline, owing to the combination of subdued economic growth and further efficiency gains, as well as the progressive substitution of conventional fuel with ethanol and other biofuels.
On the supply side, fuel-producing countries that are not members of the Organization of the Petroleum Exporting Countries (OPEC) are expected to post a small increase in output in 2011, driven by oil production increases in Brazil, Azerbaijan and Colombia. These expansions will outweigh the fall in production among oil producers in advanced economies, mainly caused by the decline in output from maturing oil fields in Europe. OPEC producers, however, retain ample spare output capacity. As a result, oil prices are expected to decrease somewhat in 2011, to fluctuate at about $75 per barrel, and to edge up to about $80 per barrel in 2012.
World prices of metals followed a similar trend in 2010, being sensitive to changes in the prospects for output growth in emerging economies, especially China. China’s demand for copper, aluminium and other base metals is estimated to account for about 40 per cent of the world total. In the outlook for 2011 and 2012, global demand for metals is expected to stabilize at 2010 levels, partly reflecting sluggishness in world investment demand. No major changes in supply conditions are expected in the short run. Consequently, metal prices are expected to edge up only slightly in 2011 and 2012.
Food prices declined during the first half of 2010, but rebounded in the second. World food prices are much more sensitive to changes in supply conditions than those of demand. The expansion of global acreage in response to higher prices during 2005-2008 and favourable weather patterns in key producing areas helped increase global food sup-plies considerably during 2009 and early 2010. In mid-2010, however, drought and fires in the Russian Federation, Ukraine and, to a lesser extent, North America affected the harvests of basic staples, especially wheat, leading to a spike in prices for these crops. The spike was short lived, in part because of ample availability in global wheat inventories and because the Russian Federation and Ukraine have only minor shares in global wheat trade. Speculation in wheat markets thus seems to have had a strong influence on grain
Financial market trends are exacerbating the volatility in food and other commodity prices
22 World Economic Situation and Prospects 2011
prices in the third quarter of 2010. On the demand side, emerging economies continue to account for much of the growth for major crops during 2010-2012. Nonetheless, also in the outlook for 2011 and 2012, food prices will remain vulnerable to any supply shock and speculative response in commodity derivatives markets. The latter uncertainty applies to all commodity markets as a result of their increased “financialization”,10 which has also enhanced the influence of exchange-rate fluctuations on commodity price volatility.
Declining remittances
The global financial crisis also triggered a visible decline in worker remittances to developing countries and economies in transition, from $336 billion in 2008 to $315 billion in 2009. This 6 per cent drop presents a relatively small shock for developing countries as a whole (0.1 per cent of their combined GDP), but the impact differs significantly across regions and countries (table I.3). Countries in Latin America and the Caribbean, Central Asia and Eastern Europe were hardest hit. The most severe impact was experienced in Kyrgyzstan, the Republic of Moldova and Tajikistan, where the decline in remittance income repre-sented between 8 and 16 per cent of GDP. In several Central American and Caribbean countries, including Haiti, the impact ranged from between 1 and 2 per cent of GDP, while in South-eastern European countries it was between 2 and 3 per cent. Remittance incomes in these regions were strongly affected by rising unemployment among migrant workers in the Russian Federation, Western Europe and the United States.
In South Asia, in contrast, remittance flows increased as dependence on mi-gration to Western Asia proved to be a stabilizing factor during the crisis, especially as construction activities in the Gulf States remained robust. As a result, worker remittances
10 See Chapter II and United Nations Conference on Trade and Development (UNCTAD), Trade and Development Report 2009: Responding to the global crisis (United Nations publication, Sales No. E.09.II.D.16), for further discussion.
Table I.3 Trends in worker remittances to developing countries and economies in transition, 2004-2009
Percentage
2004 2005 2006 2007 2008 2009
Impact of crisisa (percentage
of GDP)
Remittances as a share
of GDP
all developing countries 17.3 21.0 18.4 23.1 15.9 -6.0 -0.1 1.9
Least developed countries 12.8 10.3 18.4 23.9 31.2 7.6 0.4 5.0Low-income countries 15.3 21.5 23.9 24.0 29.4 1.0 0.1 6.8Lower middle income countries 12.4 22.6 18.6 29.2 19.7 -2.7 -0.1 2.5Upper middle income countries 25.9 18.6 16.8 13.3 5.7 -14.9 -0.2 1.1East Asia and the Pacific 23.4 25.1 14.2 23.8 20.7 -0.4 0.0 1.5Europe and Central Asia 49.1 43.6 24.1 36.0 13.3 -20.7 -0.3 1.4Latin America and the Caribbean 17.9 15.8 18.1 6.9 2.1 -12.3 -0.2 1.5Middle East and North Africa 13.2 8.4 4.6 21.4 9.8 -8.1 -0.3 3.1South Asia -5.5 18.2 25.3 27.1 32.6 4.9 0.2 4.7Sub-Saharan Africa 34.5 16.4 34.8 48.5 14.1 -2.7 -0.1 2.3
Source: World Bank, Development Prospects Group.a Calculated as the proportion of remittances in GDP in 2008 times the growth rate of remittances in 2009.
23Global outlook
to Bangladesh, Nepal and Pakistan actually increased, and were also a factor in keeping up resource flows to the Philippines in East Asia and to several African countries.
Exchange-rate effects also had a bearing on flows, with the depreciation of the Russian rouble affecting remittance flows to Central Asian and Eastern European countries, especially during the first half of 2009. Depreciation of national currencies in the Philippines and other South Asian countries, in contrast, appears not only to have increased the domestic value of remittances, but also to have provided an incentive for migrants to buy long-term assets at home.11
As a result of these diverging patterns, remittance incomes to low-income countries proved resilient during the crisis, while mostly middle-income countries saw an adverse shock. In the outlook, some rebound in remittance flows may be expected during 2010-2012 but, given the persistent high unemployment in important recipient countries of migratory flows as well as rising anti-immigrant sentiments in those countries, the rebound will be weak at best. Increased exchange-rate instability, as discussed below, poses a risk to the rebound and stability of remittance flows in the outlook.
Uncertainties and risksKey uncertainties and risks to the baseline scenario for 2011 and 2012 remain on the downside. A much weaker recovery of the world economy is far from a remote possibility, especially as continued high unemployment, financial fragility, enhanced perceptions of sovereign debt distress and inadequate policy responses could further undermine business and consumer confidence in the developed countries. For the dynamic developing countries and economies in transition, the recent surge in capital inflows is posing challenges to growth and stability, especially in the form of currency appreciation and risk of domestic credit and asset price bubbles. These challenges are closely related to the financial weak-nesses and policy stances in developed countries. Further large-scale quantitative easing in the United States is likely to push down the value of the dollar and send even more money flowing into the faster-growing economies of Asia and Latin America, where rates of return are higher. Heightened tensions over currency and trade have already led to defensive inter-ventions in emerging market economies in efforts to keep exchange rates competitive and to curb the flow of capital into their economies. Such tensions are compounding the increased volatility in exchange rates among the major reserve currencies which emerged during 2010 as a result of uncoordinated quantitative easing strategies in Europe, Japan and the United States. Failure to arrive at more coordinated policy responses aimed at a more benign global rebalancing will put the process of economic recovery and the stability of financial markets at further risk. The importance of each of these risks is weighed below.
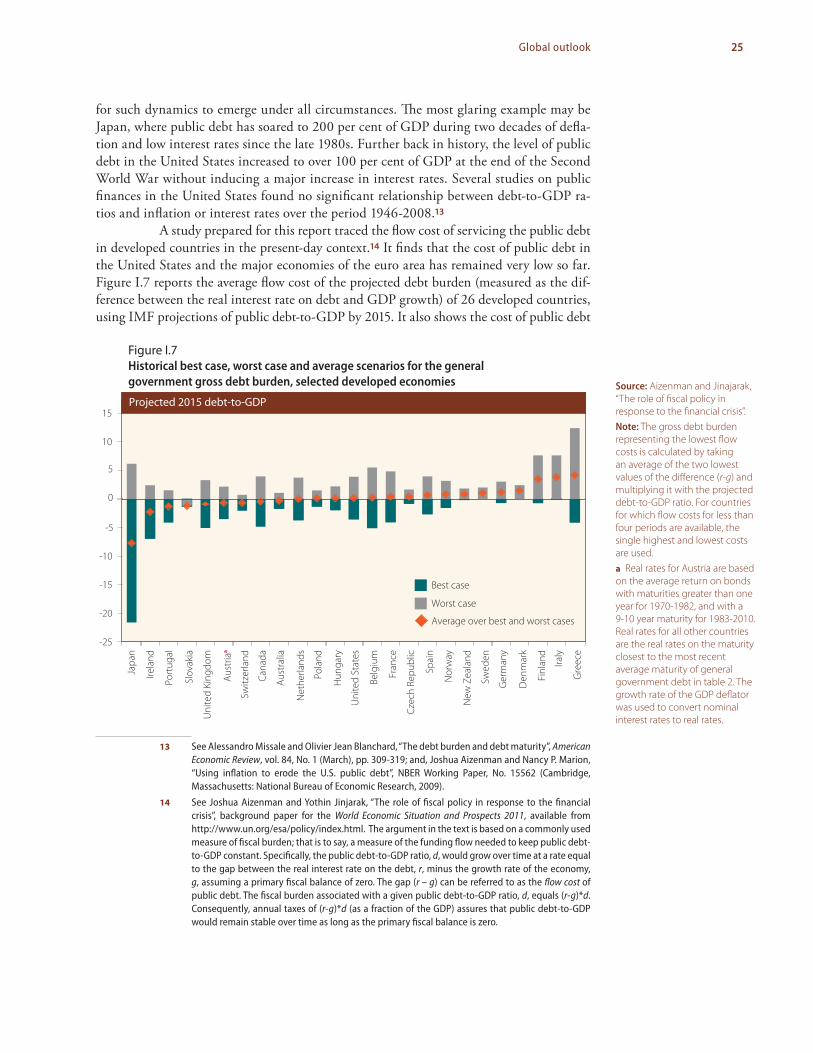
Risks associated with sovereign debt and fiscal austerity
The dire outlook of the global economy in the second half of 2008 propagated unprec-edented fiscal expansion in most developed economies and several developing countries. Arguably, the fiscal stimulus and coordinated monetary expansion stabilized the global
11 See Dilip Ratha, Sanket Mohapatra and Ani Silwal, “Migration and Development Brief”, No. 12, (Washington, D. C.: World Bank, Development Prospects Group, April 2010). Available from http://siteresources.worldbank.org/INTPROSPECTS/Resources/334934-1110315015165/MigrationAndDevelopmentBrief12.pdf.
The rebound in worker remittances will likely be weak in 2011-2012
Early retreat to fiscal austerity, enhanced exchange-rate volatility and weaker policy coordination pose major downside risks to the recovery
24 World Economic Situation and Prospects 2011
economy in the aftermath of the financial meltdown in the United States, preventing employment collapses of the type experienced during the Great Depression. Despite a still fragile recovery, the sense of urgency and the will to move fiscal and monetary policies in tandem dissipated during 2010 over worries that fiscal sustainability, especially in devel-oped countries, was in jeopardy. The sovereign debt distress in several Southern European countries became a source of global financial turmoil in early 2010 and also led to greater concerns among policymakers that further increases in public debt might lead to higher interest rates down the road, increasing the debt-service burden and crowding out private investment. The response to these concerns is already evident in the form of fiscal austerity plans, especially in European countries. Further quantitative easing in the form of central bank purchases of government securities has been the answer to keep interest rates low. Such policy responses are raising concerns at the other end of the spectrum: there are fears that the phasing out of fiscal stimulus and a quick retreat to fiscal austerity would risk further deceleration of the recovery, prolong high unemployment and be self-defeating, and that budget deficits and public debt ratios as a share of GDP would continue to rise because of insufficient output growth and despite the fiscal tightening. How should these two sides of the coin be assessed in the present-day context?
First, it is clear that budget deficits have widened sharply and that public debt will increase further in the near term. The average deficit for developed economies soared to 10 per cent of GDP by the end of 2009, with public debt reaching over 80 per cent. The deficit is estimated to decline to about 9 per cent in 2010, mainly on account of the phasing-out of the government spending associated with the bailout of the financial sector in the United States. Many developed economies continued to experience deficit increases. The projected deficits for 2011 suggest an improvement by 1 percentage point of GDP, premised on continued GDP growth as delineated in the baseline, smooth implementa-tion of announced fiscal consolidation plans and accommodative capital markets. Under conservative assumptions, the public debt of developed countries will continue to increase, surpassing 100 per cent of GDP, on average, in the next few years.
It should be emphasized, however, that while fiscal stimulus measures may have added to the widening of budget deficits and rising debt burdens, the impact of the crisis itself (in particular through lower tax revenues) has had the greatest bearing on projected future public debt ratios.12
The second question is whether this situation is likely to cause rapid upward-spiralling debt growth as perceptions of emerging debt stress push up interest rates (as well as risk premium) on government securities, thereby putting greater pressure on deficits to widen and on public debt to increase. These kinds of dynamics have clearly affected Greece, Ireland, Portugal, Spain and several economies in Eastern Europe, countries that still have a relatively limited tax capacity, making the vicious forces at work more power-ful. Yet, despite these experiences, evidence that there would also be strong dynamics between public indebtedness and the cost of servicing the debt in developed countries is scanty. During the present crisis, real interest rates have remained low and have even seen a decline despite mounting public debt in the United States, the major economies of the euro area and Japan. There is also not much historical evidence to support the claim
12 The IMF estimates that only about 20 per cent of the projected increase in public debt of the developed countries belonging to the Group of Twenty (G20) is due to fiscal stimulus measures and financial rescue operations undertaken in response to the crisis. Revenue loss explains about half of the debt increase, and debt dynamics another 20 per cent. See IMF, “Navigating the fiscal challenges ahead”, Fiscal Monitor, 14 May 2010, p. 14. Available from http://www.imf.org/external/pubs/ft/fm/2010/fm1001.pdf.
Public debt of developed countries will rise to over
100 per cent of GDP…
…but in most countries the cost of higher debt
remains very low
25Global outlook
for such dynamics to emerge under all circumstances. The most glaring example may be Japan, where public debt has soared to 200 per cent of GDP during two decades of defla-tion and low interest rates since the late 1980s. Further back in history, the level of public debt in the United States increased to over 100 per cent of GDP at the end of the Second World War without inducing a major increase in interest rates. Several studies on public finances in the United States found no significant relationship between debt-to-GDP ra-tios and inflation or interest rates over the period 1946-2008.13
A study prepared for this report traced the flow cost of servicing the public debt in developed countries in the present-day context.14 It finds that the cost of public debt in the United States and the major economies of the euro area has remained very low so far. Figure I.7 reports the average flow cost of the projected debt burden (measured as the dif-ference between the real interest rate on debt and GDP growth) of 26 developed countries, using IMF projections of public debt-to-GDP by 2015. It also shows the cost of public debt
13 See Alessandro Missale and Olivier Jean Blanchard, “The debt burden and debt maturity”, American Economic Review, vol. 84, No. 1 (March), pp. 309-319; and, Joshua Aizenman and Nancy P. Marion, “Using inflation to erode the U.S. public debt”, NBER Working Paper, No. 15562 (Cambridge, Massachusetts: National Bureau of Economic Research, 2009).
14 See Joshua Aizenman and Yothin Jinjarak, “The role of fiscal policy in response to the financial crisis”, background paper for the World Economic Situation and Prospects 2011, available from http://www.un.org/esa/policy/index.html. The argument in the text is based on a commonly used measure of fiscal burden; that is to say, a measure of the funding flow needed to keep public debt-to-GDP constant. Specifically, the public debt-to-GDP ratio, d, would grow over time at a rate equal to the gap between the real interest rate on the debt, r, minus the growth rate of the economy, g, assuming a primary fiscal balance of zero. The gap (r – g) can be referred to as the flow cost of public debt. The fiscal burden associated with a given public debt-to-GDP ratio, d, equals (r-g)*d. Consequently, annual taxes of (r-g)*d (as a fraction of the GDP) assures that public debt-to-GDP would remain stable over time as long as the primary fiscal balance is zero.
Figure I.7Historical best case, worst case and average scenarios for the general government gross debt burden, selected developed economies
Projected 2015 debt/GDP
0
5
-5
-25
-20
-15
-10
10
15Projected 2015 debt-to-GDP
Japa
n
Irela
nd
Port
ugal
Slov
akia
Uni
ted
King
dom
Aust
riaa
Switz
erla
nd
Cana
da
Aust
ralia
Net
herla
nds
Pola
nd
Hun
gary
Uni
ted
Stat
es
Belg
ium
Fran
ce
Czec
h Re
publ
ic
Spai
n
Nor
way
New
Zea
land
Swed
en
Ger
man
y
Den
mar
k
Finl
and
Iraly
Gre
ece
Best case
Worst case
Average over best and worst cases
Source: Aizenman and Jinajarak, “The role of fiscal policy in response to the financial crisis”.Note: The gross debt burden representing the lowest flow costs is calculated by taking an average of the two lowest values of the difference (r-g) and multiplying it with the projected debt-to-GDP ratio. For countries for which flow costs for less than four periods are available, the single highest and lowest costs are used.a Real rates for Austria are based on the average return on bonds with maturities greater than one year for 1970-1982, and with a 9-10 year maturity for 1983-2010. Real rates for all other countries are the real rates on the maturity closest to the most recent average maturity of general government debt in table 2. The growth rate of the GDP deflator was used to convert nominal interest rates to real rates.
26 World Economic Situation and Prospects 2011
under the historical worst- and best-case scenarios during the last four decades. Intriguingly, for most countries, the flow cost of servicing the debt is below 2 per cent of GDP, except for Greece, Italy and Finland. For most of the developed countries, including the United States, the projected expected public debt burden is zero or negative. The country with the greatest uncertainty in the future debt burden is Japan, followed by Greece, Belgium, Ireland, France and Canada. The United States has the eleventh highest uncertainty in terms of (worst-best) scenarios. While most countries that have low projected debt ratios occupy the lower end of the scale, that is to say, they have lower uncertainty in future debt burdens, this uncertainty does not increase monotonically with the size of the projected debt. For instance, the projected debt of the United States for 2015 is higher than that of seven countries that face a much greater uncertainty in future debt burden.
From this perspective, one could conclude that, insofar as future growth de-pends on short-term stabilization during or in the aftermath of a financial crash and a deep recession, the additional debt incurred for such stabilization may not translate into excessively high medium-term flow costs of public debt for an important part of the de-veloped countries. This finding should not be used as an excuse for fiscal complacency, as it remains true that the degree of uncertainty of the future debt burden likely increases with the size of the future public debt-to-GDP ratios. This is illustrated by looking at the worst-case fiscal scenario in figure I.7, in which permanent low growth would likely create onerous debt burdens in most developed countries. The flow cost of the debt burden in the United States would climb to above average, at 3.9 per cent of GDP, while Greece’s would rise to about 12.4 per cent of GDP.
These findings highlight that the risk of triggering vicious public debt dynamics depends critically on the growth scenario. A focus on belt-tightening today, which would slow and delay economic recovery, could well trigger such a vicious circle. Developed countries with less fiscal space that already have high public debt ratios and flow costs may see few options but to engage in fiscal consolidation, but they would risk entering into vicious debt dynamics anyway if the consequent demand contraction cannot be offset by other sources of growth, including export growth, which would require demand expan-sion elsewhere.
Third, the higher projected growth for developing countries implies that the flow costs of public debt are lower, increasing their fiscal space. Emerging markets with modest public debt may benefit by using this fiscal space to accommodate the adjustment challenges associated with lower demand in developed countries. The flow costs of public debt in several fast-growing emerging markets and developing countries are actually very low or even negative, reflecting the high growth and low real interest rates of recent years (figure I.8). In particular, since 2000, a high rate of growth, coupled with relatively low levels of public debt and large domestic savings, have allowed the Governments of develop-ing countries in Asia and Latin America to build up local-currency bond issuance and ex-tend the maturity of their public debt. Indeed, the negative flow cost of public debt is most evident in Asia. However, the notion of fiscal space is country-specific and countries with better adjustment capacities, lower debt overhang and a greater tax base tend to possess more of it. Low-income countries tend to have weaker tax bases and hence significantly less fiscal space.15 As a result, their scope for counter-cyclical policies depends to a greater degree on inflows of development assistance.
In sum, continued slow GDP growth in developed economies will have significant implications for fiscal sustainability. If the ongoing trend of deceleration in
15 See Aizenman and Jinjarak, ibid., for comparative estimates.
Fiscal austerity that dampens growth poses
the greatest threat for the emergence of public
debt distress
Developing countries grow faster and have more
fiscal space
27Global outlook
0
0.01
0.02
0.03
0.04
0.05
0.06
0.07
0.08
0.09 Brazil
2000
2001
2002
2003
2004
2005
2006
2007
2008
2009
India
2000
2001
2002
2003
2004
2005
2006
2007
2008
2009
-0.06
-0.04
-0.02
0
0.02
Mexico
2000
2001
2002
2003
2004
2005
2006
2007
2008
2009
-0.04
-0.02
0
0.02
0.04
China
2000
2001
2002
2003
2004
2005
2006
2007
2008
2009
-0.04
-0.03
-0.02
-0.01
0
Republic of Korea
2000
2001
2002
2003
2004
2005
2006
2007
2008
2009
-0.015
-0.01
-0.005
0
Figure I.8 Flow costs of public debt, selected emerging and other developing countries, 2000-2009 (percentage of GDP)
Thailand
2000
2001
2002
2003
2004
2005
2006
2007
2008
2009
-0.02
0
0.02
0.04
Source: Aizenman and Jinajarak, “The role of fiscal policy in response to the financial crisis”.
28 World Economic Situation and Prospects 2011
global growth continues, leading to significantly lower growth than the baseline, or even a double-dip recession in some developed economies, the fiscal position of these economies would deteriorate further. At the same time, in the present context, global growth is af-fected by waning fiscal stimulus. Additional fiscal austerity will weaken growth further. In developed countries, GDP growth will fall, on average, by about 1 percentage point per 1 per cent of GDP decline in government spending. Such fiscal retrenchment among advanced economies would spill over to developing countries and lower their growth by 0.3 percentage points.16
Government balances in a number of European economies are especially vul-nerable to lower GDP growth, as they are, too, in Japan. In the outlook, Governments of many advanced economies will face large and increasing funding needs, the cost of which will be highly vulnerable to changes in market sentiment. If sovereign risk premiums in capital markets continue to surge, they will jeopardize market access for some of these countries, as has been seen in the cases of Greece and a few other countries in 2010. The risk does not seem to be a major concern in most developed economies, which still have fiscal space and should be more concerned with protracted low growth. They should, how-ever, be wary of the risk of enhanced financial fragility because of the way in which public indebtedness became linked to the health of the banking sector during the crisis. On the one hand, Governments have guaranteed vast amounts of bank liabilities, and in some cases have taken partial ownership of banks; on the other, banks, stashed with cash, have been purchasing large amounts of government securities at home and abroad. As a result, a heightened risk for the financial health of any of these two parties will feed throughout the other, possibly forming a vicious circle that could amplify the risk into the whole economy. For example, higher sovereign credit spreads for some countries could push up bank spreads, increasing financing needs for Governments and banks alike.
Risk of increased exchange-rate instability
The exchange rates among major currencies experienced extremely high volatility during 2010, with an escalated tension spreading rapidly to other currencies. The volatility in the first half of 2010 featured the sharp devaluation of the euro, triggered by heightened concerns about sovereign debt in a number of European economies. Between the begin-ning of the year and June, the euro depreciated by about 20 per cent against the United States dollar and the Japanese yen (figure I.9). The tide in foreign-exchange markets has since reversed, however, featuring a sharp weakness of the dollar driven by the deteriorat-ing growth prospects for the United States, along with, as indicated above, the anticipated need for further quantitative easing, that is to say, for further printing of the dollar. As a result, the euro rebounded by nearly 20 per cent vis-à-vis the dollar, while the yen hit a 15-year high against the dollar, engendering intervention by the Japanese Government in foreign-exchange markets.
The announcement of large-scale purchases of government securities by the United States Federal Reserve (Fed) might be a source of further nervousness in global
16 These estimates are based on a simulation using the United Nations World Economic Forecasting Model, assuming an additional, across-the-board 1 per cent cut in government spending in Europe and the United States in comparison with the baseline. The implied average growth elasticity of fiscal expenditures of about 1 for the first-year effect is approximately the mean of that reflected in other global models or macroeconomic models of individual major developed countries.
Exchange-rate volatility among major currencies
has caused tensions worldwide
A weakening dollar is raising concerns in Europe
and elsewhere
29Global outlook
financial markets in the near term.17 The prospect of further weakening of the dollar has already raised concerns, especially in Europe, as it would dampen hopes of an export-led recovery in countries like Greece, Ireland, Spain and the United Kingdom of Great Britain and Northern Ireland, who need to offset the negative demand effects from fiscal austerity. But it will also affect growth in Germany, which is strongly export-oriented, unless that country manages to stimulate domestic demand.
The failure to maintain exchange-rate stability among the three major inter-national reserve currencies has also affected currencies of emerging economies. The surge in capital inflows to emerging economies, fuelled by the quantitative easing in developed countries and portfolio reallocation by international investors, as well as by the weakening of the dollar, has led to upward pressure on the exchange rates of some emerging econo-mies. For example, Brazil’s real appreciated by about 10 per cent vis-à-vis the currencies of its trading partners in 2010, while the Republic of Korea and South Africa also saw their exchange rates strengthen significantly in the third quarter of 2010 (figure I.10).
Developing countries have responded by intervening in currency markets, buy-ing foreign exchange and/or imposing capital controls in order to avoid soaring exchange rates, loss of competitiveness and inflating asset bubbles. Brazil, for instance, tripled the tax rate on foreign purchases of its domestic debt, while Thailand announced a 15 per cent withholding tax for such purchases. China has received continuous political pressure to revalue its currency further, but has resisted making major adjustments out of concern for possible disruptive effects on its economy.
17 The Fed announced on 3 November 2010 that it would purchase an additional $600 billion in long-term United States government securities by June 2011. This is, however, far less than the $1.75 trillion worth of debt the Fed bought between early 2009 and early 2010 in its first round of quantitative easing.
Figure I.9Exchange rates among major currencies, March 2010-October 2010
Inverted scale, dollars per euro and dollars per 100 yen1.00
1.05
1.10
1.15
1.20
1.25
1.30
1.35
1.40
1.45
1.50
1 M
ar 2
010
1 Ap
r 201
0
1 M
ay 2
010
1 Ju
n 20
10
1 Ju
l 201
0
1 Au
g 20
10
1 Se
p 20
10
1 O
ct 2
010
Dollar to yen
Dollar to euro
Source: United States Federal Reserve Board.
30 World Economic Situation and Prospects 2011
Currency instability and perceived misalignment of exchange rates could be-come part of a major skirmish over trade, which may well turn into a wave of protection-ist measures and retaliations worldwide. It remains to be seen whether this will actually transpire, but clearly, the unpredictability of exchange rates risks derailing global growth and destabilizing financial markets once again.
Risks of an uncoordinated rebalancing of the world economy
The risks associated with uncoordinated fiscal and monetary policies and the large swings in exchange rates are not only slower global growth but also a widening of the global imbalances, which in turn could feed more instability back into financial markets.
The global imbalances narrowed markedly along with the global recession (fig-ure I.11). The large external deficit of the United States declined from its peak of 6 per cent of GDP before the recession to a trough of 2.7 per cent in 2009. Commensurately, the external surpluses in China, Germany, Japan and a group of fuel-exporting countries, have also reduced. China’s surplus, for instance, dropped from a high of 10 per cent of GDP to 6 per cent in the same period. Related changes were also made in domestic savings and investment in these economies. In the United States, the household savings rate increased from about 2 per cent in 2007 to 5.9 per cent in 2009, although a large part of the increase in private savings was offset by the rise in the budget deficit. In China, the ratio of private consumption to GDP started to rise for the first time in a decade, although it remains extremely low, below 40 per cent, compared with that of between 60 and 70 per cent in most other major economies.
In 2010, the global imbalances widened again along with the global recovery. The external deficit of the United States increased slightly to above 3 per cent of GDP, while surpluses of fuel-exporting countries and those of Germany and Japan widened, somewhat. China’s external surplus, while increasing in absolute terms, continued to decline relative to its GDP (to 4 per cent). At these levels, the global imbalances may be considered moderate compared with those prior to the crisis. A critical issue is whether the global imbalances will widen again substantially in the coming years and compound the above-mentioned risk factors, thus endangering global growth and stability.
In the near-term outlook, pressure on the imbalances to widen in flow terms does not seem excessively great, but the forces that could lead to a narrowing of the imbal-ances are equally weak. Households in the deficit countries, mainly the United States, are not expected to resume the debt-financed expansion of consumption quickly, and further widening of the government deficit relative to GDP is likely to be politically constrained. With a mild growth in demand from the deficit countries, room for an increase of the external surpluses in the surplus countries will also be small.
The prospects of narrowing the imbalances in the longer run will depend on how successful economies will be in making structural adjustments. Changes in the right direction are visible in both deficit and surplus countries. For example, China has taken various measures to boost private consumption, reducing its dependence on exports. But it will take a long time before a more significant structural change is achieved that will also make a global impact. Such structural change would also entail important sectoral shifts and institutional change, which will take time to effectuate. Household savings in the United States have increased as a result of more cautious consumption behaviour and ongoing deleveraging of household balance sheets.
Figure I.11Resurge in global imbalances, 1996-2011
Current-account balances as a percentage of world gross producta
Source: UN/DESA, based on data from IMF World Economic Outlook Database.a Summation of each
country’s GDP.
Fuel-exportingcountries
East Asia
Germany and Japan
United States
European deficit countries
Others
32 World Economic Situation and Prospects 2011
Uncertainties remain regarding the future path of these adjustments, particularly given the unknown quantity of how the risks of a further slowing of growth and the persistence of high rates of unemployment, sovereign debt problems and further exchange-rate instability will play out. A weaker dollar would certainly increase the com-petitiveness of United States exports, which could help reduce the economy’s large external deficit. However, as discussed, the factors underlying the weakening of the dollar also point to much greater unpredictability and volatility in exchange rates which would be harmful for trade. Clearly, without more effective international policy coordination that recognizes the interconnectedness between these problems, the risk of a disorderly adjust-ment in the global imbalances remains high.
Even if the global imbalances do not edge up strongly in the outlook, the un-derlying adjustment in stocks of international asset and liability positions would continue to move in a risky direction. Continued external deficits add further to the net external liability position of the United States. The global financial crisis caused a surge in the country’s net foreign liabilities, which reached a record high of $3.5 trillion by the end of 2008 (figure I.12). They declined somewhat during 2009, to a level of $2.7 trillion, strongly influenced by the recovery in asset prices and the depreciation of the United States dollar in the second half of the year. This also increased the value of the assets held abroad by the United States by more than that of the country’s foreign liabilities.18
Further quantitative easing and a further depreciation of the dollar could be a way for the United States to try to inflate and export its way out of its large foreign liability position, but it could more likely risk disruption of trade and financial markets. Expectations for a further and sustained weakening of the dollar could sour foreign inves-tors’ attraction to dollar-denominated assets. This, in turn, could spur an exodus of capital
18 For more information, see the United States Bureau of Economic Analysis, available from http://www.bea.gov/international/index.htm#iip.
The ever-increasing foreign liability position of the
United States will put further downward pressure
on the dollar
Figure I.12Net international investment position of the United States, 1976-2009
Billions of US dollars
-3 500
-3 000
-2 500
-2 000
-1 500
-1 000
-500
0
500
1976
1978
1980
1982
1984
1986
1988
1990
1992
1994
1996
1998
2000
2002
2004
2006
2008
Source: U.S. Department of Commerce, Bureau of
Economic Analysis.
33Global outlook
out of the United States and also cut the influx of international capital into United States markets. Even the temporary appreciation of the dollar after mid-2008 did not prevent a sharp decline in the net inflow of foreign investment funds into the United States, reflect-ing concerns about the United States economy. If international investors start to avoid dollar-denominated financial assets, it would be natural for the influx of liquidity into financial markets outside the United States to increase. It would also be likely to spill over into more price instability in commodity markets given the high degree of financialization of those markets and the impact of exchange rates (especially the value of the dollar) on commodity prices (see chapter II).
Moreover, for countries trying to export their way out of the global slump, dol-lar weakness poses a threat because it will increase import prices in the United States, the world’s largest consumer market, and thus erode purchasing power. A decline in United States’ household demand for imported goods could lead to a decline in global trade. It would be the antithesis of the United States consumption boom that fuelled global eco-nomic growth before the financial crisis. Accordingly, if concerns grow about exports’ be-ing hit by dollar weakness, affected developing countries will understandably feel inclined to intervene in their foreign-exchange markets, as is already happening. However, frequent intervention in foreign-exchange markets by emerging economies increases the potential for international currency and trade conflicts. If the unnecessary political confrontations surrounding the issue of foreign-exchange rates continue to deepen, they could further un-dermine the international cooperation shaped at the level of the Group of Twenty (G20), which has spearheaded the global economic recovery. Commitment to coordinated policy responses has already suffered over disagreements regarding the role of fiscal policy in the context of a slowing recovery and mounting public indebtedness, as manifested at the G20 Summit in Toronto in July 2010, and the uncoordinated retreats to fiscal austerity and further monetary easing, and have resulted in greater global economic uncertainty, as discussed above. The Seoul Summit of the G20, held on 11 and 12 November 2010, recognized the currency risks and the need for national macroeconomic policies to take ac-count of international spillover effects, but it failed to offer any specifics for a coordinated solution. A further waning of the commitment to international policy coordination will be an added liability to the prospects for a balanced and more sustained global recovery.
Policy challengesOvercoming the risks outlined above and reinvigorating the global recovery in a balanced and sustainable manner poses enormous policy challenges. Doing so has become even more challenging, given that the sense of urgency and the will to coordinate policies that existed during the peak of the crisis seems to have unravelled. The risks enhance uncer-tainty in the global economy and that, in itself, may well contribute to a further slowdown. Business and consumer confidence may be further restrained against the backdrop of continued high unemployment, the anticipation that further quantitative easing in the United States will do little to boost aggregate demand but will further weaken the dollar, and the expected growth costs of fiscal consolidation in major economies.
According to an alternative simulation using the United Nations World Economic Forecasting Model (WEFM) (see box I.4), in this more pessimistic scenario of greater uncertainty, but with an unchanged fiscal and monetary stance in developed economies, Europe could well see a double-dip recession, while the economies of the United States and Japan might virtually stagnate and possibly also fall back into recession
A waning commitment to international policy coordination poses a further threat to global growth and stability
Further uncertainty and unchanged policies may lead to a double-dip recession in major developed economies
34 World Economic Situation and Prospects 2011
A pessimistic scenario for the world economy
Risks arising from macroeconomic uncertainty clearly increased during 2010. Concerns are that the global recovery is losing steam and that the present poorly coordinated policy stances may be inad-equate for reinvigorating growth and could be a source of renewed instability.
A pessimistic scenario was simulated using the United Nations World Economic Forecasting Model (WEFM), in order to quantify the possible implications for global growth if some downside risks, as discussed in the body of the chapter, were to become a present danger. The scenario delineates a situation in which greater macroeconomic uncertainty would cause a further weakening of growth in developed economies, dragging down growth of the world economy as a whole. Specifically, it is assumed that the prospect of fiscal consolidation and continued weakness in financial institutions, especially the banks, in the United States of America and the countries of the European Union (EU) would make them even more risk-averse in their lending to households and businesses, while higher uncertainty among unemployed workers of finding a job in the near future is assumed to hamper private consumption demand more severely than in the baseline. It is assumed further that the sovereign debt problems of some EU members will start to agitate financial markets again, thereby aggravating the difficulties facing the banking sector and depressing confidence more generally. On the policy front, the monetary policy stance, in terms of quantitative easing, would be the same as that assumed in the baseline scenario, but in the pessimistic scenario it is assumed that its anticipated effects on aggregate demand and employment would be even smaller. Fiscal policy stances, particularly the fiscal consolidation plans of developed economies, are also unaltered with respect to the baseline assumptions, but with greater uncertainty, the adverse impact of the fiscal consolidation on aggregate demand will be larger.
Under these assumptions, private consumption, business investment, the housing sector and import demand in major developed economies would all be significantly weaker than in the baseline. For example, in the United States, consumption growth would decelerate from 1.6 per cent in 2010 to 0.5 per cent in 2011 and 2012, compared with the more than 2 per cent growth in the baseline outlook. Growth in business investment would slow to 1.8 per cent in 2011, down from 6.4 per cent in the baseline. The housing sector, as measured by residential investment, would continue to contract by another 5 per cent instead of rebounding as in the baseline. Overall, gross domestic product (GDP) growth in the United States would come to a virtual standstill in 2011 and then rise to 1.1 per cent in 2012, 2 percentage points lower than in the baseline forecast. A slowdown of similar magnitude is expected in private consumption and business investment in the EU, where GDP would fall by 0.4 per cent in 2011, followed by a feeble recovery of 1.4 per cent in 2012. In Japan, much weaker export growth, combined with a faltering domestic demand, would cause renewed stagnation of the economy, with GDP growing by a mere 0.4 per cent in 2011 and by 0.9 per cent in 2012 (see table).
Pessimistic scenario for the world economy, 2011-2012
Precentage annual growth rate
Baseline forecast Pessimistic scenario
2011 2012 2011 2012
World GDP growth rate 3.1 3.5 1.7 2.3Developed economies 1.9 2.3 0.1 1.1Economies in transition 4.0 4.2 3.6 3.5Developing economies 6.0 6.1 5.3 5.1Least developed economies 5.5 5.7 5.3 5.2
Memorandum item:
World trade volume (goods and non-factor services) 6.6 6.5 5.1 4.5
Source: UN/DESA.
Box I.4
35Global outlook
during 2011. Growth in the developed countries would be almost 2 percentage points lower in 2011 than in the baseline forecast, and this would also significantly lower growth prospects for developing countries (by almost 1 percentage point).
There have been contentious policy discussions in the political constituencies of a number of key countries regarding the future role of fiscal stimulus and tax poli-cies, and among countries about exchange-rate realignments. For instance, facing close to double-digit unemployment, stagnating employment rates and the uncertainty regarding the strength of the economic recovery—particularly as there seems to be no end in sight for the continued sizeable foreclosures—the United States has been vigorously debating the case for a second federal fiscal stimulus package. But the likelihood of new fiscal stimulus has evaporated following the election results of November 2010. Meanwhile, the Greek crisis has shaken confidence in many developed economies and has propagated doubts about the fiscal soundness of several European countries. Gaps between France, which has a more pro-fiscal stimulus stance, and Germany, which has advocated more fiscal consolidation and belt-tightening, are indicative of differences in policy perspectives within Europe. In addition, the stronger automatic stabilizers and broader social security provisions in Europe in comparison with the United States has led to further complica-tions as not all countries share the impetus for fiscal stimulus that continues to prevail in some quarters in the United States. Indeed, several countries already embarked upon fiscal retrenchment in 2010, while others have announced plans to do so in 2011. This is making the task of coordinating fiscal policy between Europe and the United States much harder. It is also making it harder to arrive at a national consensus on whether to start fiscal consolidation sooner or later.
At the same time, monetary and exchange-rate policies have become issues of contention across countries. China’s resistance to let its currency appreciate faster has been blamed for hampering the adjustment of global imbalances; China and other emerging economies, on the other hand, view excessive quantitative easing, especially in the United States, as a greater source of distortion in the global economy, and one that has been
For a balanced and sustainable global recovery, five policy challenges need to be addressed
Growth prospects for developing countries and economies in transition will be hurt by a further slowdown in developed countries. This analysis accounts for the impact through the trade channel only. The dependence of these economies on demand from major developed economies remains high, as more than 50 per cent of their exports are still destined for developed economies. Consequently, cumulative GDP growth of developing countries would be 1.7 percentage points lower in the two years of the forecasting period compared with the baseline. Some Asian and Latin American economies would be hit harder because of greater trade dependence on demand growth in major developed economies.
Global economic growth would slow to 1.7 per cent in 2011 and 2.3 per cent in 2012, compared with 3.1 per cent and 3.5 per cent, respectively, in the baseline.
Because of certain limitations of the WEFM, particularly the lack of a detailed specifica-tion of international financial linkages and contagion effects in financial sectors, the scenario does not consider all the risk factors discussed in the body of the chapter. If the increased exchange-rate volatility and the spillover effects into commodity prices were accounted for, for instance, the out-comes would likely be even gloomier. At the same time, however, worsening economic prospects could trigger shifts in policy stances; for example, some developed economies might postpone fiscal consolidation plans, which could mitigate a further slowdown. The purpose of the analysis in this scenario is to show to what extent increased uncertainty, caused by the downside risks, would further harm growth given the present macroeconomic policy positions.
Box I.4 (cont’d)
36 World Economic Situation and Prospects 2011
causing exchange-rate volatility among major reserve currencies and a flood of short-term and volatile capital to flow their way and put upward pressure on their own currencies. These policy quarrels reflect differences in perspective regarding the role of policies as well as more fundamental problems in the world economy, which can only be overcome through a common and coordinated approach. Given existing discrepancies, reaching a more common understanding and approach may seem difficult. But recognition that the world economy is still fragile and that current uncoordinated policy stances risk adding insult to injury, as analysed above, should suffice to motivate and forcefully seek coordi-nated solutions. Moving towards a more balanced and sustainable global recovery would require addressing at least five related major policy challenges. The first is to provide ad-ditional fiscal stimulus, by using the existing fiscal space available in many countries, and to coordinate it to the degree needed to ensure a reinvigoration of global growth that will also provide external demand for those economies which have exhausted their fiscal space. The second is to redesign fiscal stimulus and other economic policies to lend a stronger ori-entation towards measures that directly support job growth, reduce income inequality and strengthen sustainable production capacity on the supply side. The third challenge is to find greater synergy between fiscal and monetary stimulus, while counteracting damaging international spillover effects in the form of increased currency tensions and volatile short-term capital flows. The fourth is to ensure that sufficient and stable development finance is made available for developing countries with limited fiscal space and large developmental deficits, including those in the form of the large shortfalls in progress towards the MDGs. The fifth challenge is to make the G20 framework for sustainable global rebalancing more specific and concrete, which would include having verifiable and, ideally, enforceable tar-gets for more balance and sustainable global growth.
Continued stimulus and coordination of the stimulus
The first challenge, as mentioned above, is to ensure that there is enough stimulus world-wide to reignite global demand. This needs to be done in a concerted fashion to avoid resurging global imbalances. Coordination is also needed to strike a balance between, on the one hand, those countries which have little fiscal space left and need to rely on greater foreign demand to avoid deep contractions and, on the other, those that still posses an ample degree of fiscal space.
Structural and policy shortcomings that have contributed to significant fiscal deficits in a number of developed countries need to be addressed, particularly where long-term entitlement adjustments (old-age pension systems and health systems) will absorb increasingly large proportions of public expenditure. However, the fragility of the eco-nomic recovery, particularly in developed economies, requires that there be an additional and coordinated push for fiscal stimulus to reignite the global economy. Indeed, fiscal expenditure can have a large multiplier effect when interest rates are zero bound, as is currently the case. It is premature to declare that an enduring stabilization and resump-tion of sustainable growth has been accomplished, particularly as aggregate demand from the private sector remains weak in most developed, and in many developing, economies. Absent a new net fiscal stimulus and faster recovery of bank lending to the private sector, growth is likely to remain anaemic in many countries in the foreseeable future.
As analysed above, at times of global slack with very low interest rates, the cost of further fiscal stimulus is low relative to the growth risk of fiscal consolidation. This is es-pecially the case when the short-term impact of contractionary fiscal policy is exacerbated
Further fiscal stimulus is needed
The cost of further fiscal stimulus is low relative to
the growth risk of fiscal consolidation
37Global outlook
by near zero interest rates, as it is in many developed economies. Fiscal consolidation has been accompanied by growth in the past. However, upon closer inspection, enabling factors—such as exchange-rate policy and net export demand—played a pivotal role in most cases. Against the backdrop of a global crisis, it not clear from where such enabling factors will originate: beggar-thy-neighbour policies such as exchange-rate readjustments to increase competitiveness might lead to successive rounds of depreciations, with little real impact; additionally, there is no obvious source for export demand that can com-pensate for the lack of demand from developed economies. Meanwhile, the inability, or unwillingness, to provide greater fiscal support in most developed countries is negatively impacting upon emerging and developing economies.
Larger capital inflows, resulting from policies of quantitative easing that are being implemented in many developed economies to make up for the lack of fiscal support, are causing upward pressure on the currencies of many developing economies. Despite having managed their fiscal policy prudently before the global crisis and having significant room for counter-cyclical fiscal policies, authorities in emerging economies may therefore be inclined to implement contractionary fiscal policies to offset these pressures and to try to overcome bottlenecks in labour markets at home, irrespective of continued weak demand for exports. Doing so will clearly frustrate their growth prospects. It will also have knock-on effects in low-income countries, many of which remain painfully exposed to the looming uncertainty regarding global growth and depend on the demand for commodities from developed and emerging economies. By leading to a downward spiral in the global economy, austerity measures in developed economies could well trigger a similar spiral of pro-cyclical fiscal adjustment. It is likely that fiscal consolidation will turn out to be self-defeating on a global scale.
It is therefore important to continue to provide accommodative and coordi-nated fiscal stimulus in the short run, in tandem with appropriate monetary policies (see below), in order to reinvigorate the global recovery.
Redesigning fiscal stimulus
The second challenge will be to redesign fiscal policy—and economic policies more broadly—in order to strengthen its impact on employment and aid in its transition from a purely demand stimulus to one that promotes structural change for more sustainable economic growth. Thus far, stimulus packages in developed countries have mostly fo-cused on income support measures, with tax-related measures accounting for more than half of the stimulus packages. In many developing countries, such as Argentina, China and the Republic of Korea, in contrast, infrastructure investment tended to make up the larger share of the stimulus and strengthened supply-side conditions. The optimal mix of supporting demand directly through taxes or income subsidies or indirectly through strengthening supply-side conditions, including by investing in infrastructure and new technologies, may vary across countries. In most contexts, however, direct government spending tends to generate stronger employment effects.
A prudent policy would be to target public investments to alleviate infrastruc-ture bottlenecks that mitigate growth prospects, and to supplement this policy with fiscal efforts to broaden the tax base. One priority area would be to expand public investment in renewable clean energy as part of commitments to reduce greenhouse gas (GHG) emissions and in infrastructure that provides greater resilience to the effects of climate change. Some
Fiscal policies, in tandem with income and structural policies, will need to be reoriented to foster job creation and green growth
38 World Economic Situation and Prospects 2011
countries, like the Republic of Korea, have already laid out ambitious plans to that end. Such a reorientation of stimulus measures has the potential to provide significantly greater employment effects, as the renewable energy sector tends to be more labour-intensive than existing, non-renewable energy generation.19 Another area might be to expand and im-prove public transportation networks, which would create potentially significant amounts of new jobs while at the same time helping to reduce GHG emissions, particularly in rapidly urbanizing environments. These strategies would represent win-win scenarios by both orienting the recovery towards job creation and combating climate change.20
The redesigned fiscal strategy would also need to monitor closely the way in which income growth and productivity gains are shared in society. A recent discussion paper of the IMF and the ILO suggests that rising inequality has implications for the effectiveness of macroeconomic policies and global rebalancing.21 Declining wage shares (resulting from higher unemployment and underemployment or lagging real wage growth) may undermine consumption growth and thereby contribute to national and international imbalances. Labour-market and income policies may thus need to supplement fiscal and monetary policies for a more balanced outcome. In particular, allowing labour incomes to grow at the pace of productivity growth can help underpin a steady expansion of domestic demand and prevent income inequality from rising.22
The supplementary policies could target the unemployed, such as by provid-ing job-search training, short vocational training or general and remedial training. These have worked in a number of countries to compensate for sharp declines in vacancies. Job subsidies have been useful in stimulating an early pick-up in employment after a recession, as successfully demonstrated in Germany, for example. Similarly, in the United Kingdom and the United States, for instance, income subsidies to low-paid workers that make it more attractive for beneficiaries of income support to move into employment have proven to be effective in reducing poverty and stimulating demand. In other countries, employment programmes targeted at disadvantaged communities have proven effective. For instance, India’s Mahatma Gandhi National Rural Employment Guarantee Act provides one hun-dred days of employment at the minimum wage to 43 million low-income households, while in Mexico the temporary employment programme in response to the crisis has been expanded, creating more than half a million jobs between January and July of 2009.
Social protection policies are another crucial element in cushioning the impact of economic shocks and helping people avoid falling into poverty. They are also important tools for boosting aggregate demand and contributing to the sustainability of economic growth. While social transfers, such as family benefits, unemployment benefits and other cash transfers, help protect household consumption against shocks or crises, they also pre-vent asset depletion that may have adverse long-term consequences and further undermine a sustainable recovery.
19 See, for instance, ECOTEC, “Analysis of the EU Eco-Industries, their Employment and Export Potential”, a Final Report to DG Environment, 2002. Available from http://ec.europa.eu/environment/enveco/eco_industry/pdf/main_report.pdf.
20 As shown in annex table A.22, GHG emissions in Annex I countries are projected to decline by about 2 per cent during 2010-2012 given the slow recovery in GDP growth and existing plans for trends in improving energy efficiency and emissions reductions. However, the pace of reduction in a number of Annex I countries is too slow for them to meet the agreed targets under the Kyoto Protocol.
21 IMF and ILO, op. cit.
22 UNCTAD, Trade and Development Report 2010: Employment, globalization and development (United Nations publication, Sales No. E.10.II.D.3).
39Global outlook
Making monetary policy more effective and addressing its international spillover effects
The third challenge relates to monetary and exchange-rate policies. As indicated above, quantitative easing in major developed countries will likely be more effective when sup-ported by greater fiscal stimulus in the short run. Printing more money to buy government bonds will only work if the extra liquidity can find its way into aggregate demand growth. In the United States, it may do relatively little, as the transmission channels are either clogged or relatively weak. First, lower real yields could spur borrowing and investment demand; but households cannot borrow because they are still overleveraged as a result of the fall in home values, corporate firms are already stashed with cash and demanding little credit and banks are reluctant to lend to small-scale firms and households. Second, the quantitative easing has helped stock markets rebound and has increased household wealth; this could spur some additional spending, but with unemployment still high, home prices still down and high mortgages still to be paid, this channel will also be weak at best. Third, a weaker dollar could spur United States exports; but not all exports are responsive to a weaker dollar (primary commodity prices, for instance, tend to increase with a depre-ciating dollar) and the United States needs more structural policies to develop new export niches. Moreover, the share of exports in GDP of the United States is only about 10 per cent, meaning that a very large expansion of net exports will be needed in order to make a strong impact on aggregate output growth.
In the present context, maintaining an accommodative monetary policy could be supportive of additional fiscal stimuli in the short run as it would help limit the flow costs of rising public debt. A key condition for this to work, however, would be the refocusing of fiscal policy to accelerate job creation and provide incentives for structural change that would put economies on a sustainable growth path. It would also work better if comple-mentary policies were undertaken which would help unclog the financial system, including through additional measures to reduce the mortgage debt overhang and by providing tem-porary guarantees which could enhance credit access for small and medium-sized firms.
A similar approach could be tailored to the conditions of other major econo-mies. However, international repercussion effects should be borne in mind, and this would hence require explicit policy coordination. Quantitative easing in the United States is spilling over to the rest of the world, as indicated, through its impact on exchange rates and capital flow surges. The euro area, Japan and many developing economies have seen upward pressure on their currencies. The challenge is to avoid a damaging round of cur-rency interventions and even stronger exchange-rate volatility among major reserve cur-rencies. If the European Central Bank (ECB), the Bank of Japan and the Fed were all to print more money without mopping up the excess liquidity, they could easily exacerbate such volatility. Hence, coordinating monetary and fiscal policy is important, as are agree-ments about the magnitude, speed and timing of quantitative easing policies within a broader framework of targets to redress the global imbalances (see below).
This will also be important for emerging economies and other developing countries that are well integrated into the international financial system. It would take some steam out of the push for short-term capital to move to emerging markets. In the meantime, it makes sense for developing countries to impose capital controls, as has al-ready been done by several countries, to extend the maturity of capital inflows and miti-gate their volatility. The IMF is now also supportive of such measures. Effective capital controls should also reduce the need to accumulate vast amounts of foreign reserves as it would limit the risk of sudden capital-flow reversals.
Further quantitative easing is unlikely to work without additional fiscal stimulus and a resolution of financial sector weaknesses
Strong policy coordination is needed to avoid trade and currency wars
40 World Economic Situation and Prospects 2011
The suggested responses should be within reach as long as the authorities of the major economies take the risks posed by the spillover effects of national monetary policies sufficiently seriously. Such responses are no panacea in the medium term, however. There will be a limit to how much capital controls imposed by recipient countries can achieve. Aside from coordinated monetary policies, additional corrective measures to incentives for interest-rate arbitrage at the source of capital flows may need to be considered. For instance, a reserve requirement on cross-border capital flows could be agreed upon and made part of the ongoing reform of financial regulatory systems. But deeper reforms of the international monetary system would still be needed since the more fundamental causes conducive to exchange-rate volatility are inherent in the present system, which overly relies on a single national currency as the world’s reserve.23 In the transition towards a new monetary system, further enhancing the role of special drawing rights (SDRs)—which countries can convert into other currencies if need be—and including the Chinese renminbi in the basket of cur-rencies that determine the value of SDRs could be included in the steps towards reducing reliance on the United States dollar as a reserve currency for the world.
Financing for achieving the MDGs and investments in sustainable development in low-income countries
The fourth challenge is to ensure that sufficient resources become available to develop-ing countries with limited fiscal space and large development needs, including resources for achieving the MDGs and investing in sustainable and resilient growth. Low-income countries with limited fiscal space are in need of additional ODA to finance the expansion of social services and programmes needed to meet the MDGs and to engage in counter-cyclical and broader development policies. These increased needs contrast with the signifi-cant shortfall still existing in aid delivery against commitments. Apart from delivering on existing aid commitments, donor countries should consider mechanisms to delink aid flows from their business cycles so as to prevent delivery shortfalls in times of crisis, when the need for development aid is most urgent.
More broadly, the global crisis has highlighted the need for very large liquidity buffers to deal with sudden, large capital market shocks. In response to the financial crises of the 1990s, many developing countries accumulated vast amounts of reserves as a form of self-protection. But doing so comes with high opportunity costs and has, moreover, con-tributed to the problem of the global imbalances. A better pooling of reserves, regionally and internationally, could reduce such costs to individual countries and could also form the basis for more reliable emergency financing and the establishment of an international lender-of-last-resort mechanism. Broadening existing SDR arrangements could form part of such new arrangements.
Strengthening the framework for policy coordination
The need for strengthened international policy coordination thus seems more urgent than ever. Yet, the cooperative spirit that emerged in the immediate aftermath of the crisis has been waning. Governments in major economies have become more focused on domestic policy challenges than on the spillover effects of their actions. While it is clear that global
23 These issues were discussed extensively in United Nations, World Economic Situation and Prospects 2010, op. cit.; United Nations, World Economic and Social Survey 2010: Retooling Global Development (United Nations publication, Sales No. E.10.II.C.1); and, in UNCTAD, 2009, op. cit.
Over the medium run, more fundamental reforms in
the international financial architecture need to be effectuated
Developing countries need more predictable access to development finance
to achieve the MDGs and sustainable development
Concrete and enforceable targets for international
policy coordination should be considered
41Global outlook
demand needs rebalancing, achieving this will not be easy as it will require a range of structural reforms, a high degree of policy coherence and several years of continued ef-forts. The focus in recent policy debates on exchange-rate realignment is too narrow and bilaterally focused and seems to reflect a misunderstanding of the global spillover effects of present macroeconomic policy stances. The fifth major challenge, therefore, will be for leaders of the major economies to make the G20 framework for strong, balanced and sustainable global growth more concrete and to implement it.
A renewal of pledges to intensify and broaden macroeconomic policy coor-dination will, in itself, not guarantee that all parties will remain committed to agreed joint responses. Having clear and verifiable targets for desired policy outcomes will help make parties accountable, and the possible loss of reputation through non-compliance would be an incentive to live up to policy agreements. The proposal of the United States Secretary of the Treasury made at the G20 finance ministers meeting in October 2010, to establish “current account target zones” among major economies did not receive much support. Nevertheless, apart from establishing transparent targets, the proposal reflects the need for both surplus and deficit countries to contribute more to sustain global effec-tive demand. Overall economic policies, rather than simple exchange-rate realignment, determine the balance of national savings and investments underpinning growth of output and employment. Moreover, the proposal explicitly recognizes that national policies have international consequences.
It seems feasible to combine policies which would, when conducted simul-taneously, be both growth enhancing and reduce current-account surpluses and deficits to likely more manageable proportions of, say, 3 per cent of GDP or less for the major economies (including China). It would seem reasonable that other emerging and develop-ing countries, such as major fuel exporters and smaller economies, be allowed to run somewhat larger surpluses or deficits. Simulations with the other United Nations global modeling framework, the Global Policy Model—reflecting the key policy directions sug-gested above—show that this would be a win-win scenario for all economies, as it would enhance GDP and employment growth compared with the baseline, while reducing public debt-to-GDP ratios and requiring limited exchange-rate realignment (see box I.5). WGP would accelerate to over 4 per cent per year during 2012-2015, especially as developed economies would be lifted from their anaemic growth, while developing countries would also reach a higher growth path compared with the baseline situation where policy coor-dination is absent.
The mutual assessment process that is to accompany the implementation of the G20 framework for policy coordination would become more concrete with the establish-ment of current-account target zones. The target zones should not be seen as an end in themselves, but as a guide towards a sustainable growth path for the world, which should be considerate of the proposed actions to address all five challenges listed above. They should also be seen as an intermediate step towards more fundamental reforms of the global reserve system and the financial regulation that are needed to prevent future global financial instability and meltdowns.
42 World Economic Situation and Prospects 2011
Feasible policy coordination for rebalancing the world economy
A scenario of strengthened policy coordination aimed at strong, sustainable and balanced growth was simulated using the United Nations Global Policy Model.a It takes on board several of the policy directions suggested in the chapter, including a stronger role for fiscal policy in the short-term out-look, one that aims at strengthening the supply side through government spending, investment in-centives and structural policies. While the assumptions underlying the simulation aim to strengthen output and employment growth, policies are coordinated so as to help place the global imbalances within a narrower and more sustainable band.
The scenario pursues growth targets per country and per country grouping (as speci-fied in the table contained in the appendix to this chapter), which are considered sensible in view of their historical experience and strategic concerns. The growth targets for developed economies are close to (non-inflationary) potential, while those for developing and emerging economies represent reasonable improvements over the present rates and baseline projections, even if still below poten-tial and hence having room for improvement.
To achieve these targets, policy instruments are adjusted in small, feasible steps in the desired direction. The scenario assumes policymakers have opted for certain choices. First, additional incentives to private investment are provided to ensure increases in the capital stock needed to sus-tain the target rate of growth of gross domestic product (GDP), but these incentives are assumed to be biased in favour of using more energy and commodity-efficient technologies so as to also comply with the sustainability objective. Second, the investment push is supported by increased government spending for improvements in infrastructure and expansion of research and development in energy efficiency. Third, government spending is increased further, as part of income policies to strengthen household consumption, to allow expansion of social services and social protection programmes, as well as tax cuts and subsidies. The latter set of measures is assumed to support consumption growth in developing countries at a moderate but sustained pace. In surplus developed countries, these measures equally result in rising disposable household income, including pension income in countries with ageing populations. In developed countries with large external deficits, these policies are designed to enhance private savings and to limit consumption growth.
Under these assumptions, Governments in all major developed countries and China would easily be able to comply with a target of narrowing current-account balances to less than 3 per cent of GDP (see figure). The external surpluses of major oil and mineral exporting countries adjust more slowly, mainly as a result of higher initial oil and other commodity prices induced by stronger global growth; but over time these surpluses would also narrow further once the impact of investments in greater energy and raw material efficiency have taken effect. Many other developing countries may still need to be allowed a wider margin of external imbalances, but one that would not endanger exchange-rate instability or risk unsustainable levels of public indebtedness. Indeed, public sector borrowing requirements and debt-to-GDP ratios would decline with the coordinated policies for stronger and sustainable growth across all country groupings (appendix table).
Box I.5
a Available from http://www.un.org/esa/
policy/publications/ ungpm.html.
43Global outlook
Box I.5 (cont’d)
(i) Selected developed economies(percentage of GDP)
BaselineBalanced growth scenario
- 5
- 4
- 3
- 2
- 1
0
1
2
3
4
5
6
2010 2011 2012 2013 2014 2015
Japan
Europe
United States
(iii) Developed economies and major fuel exporters(percentage)
0
1
2
3
4
5
6
7
8
9
1 0
2010 2011 2012 2013 2014 2015
CIS and Western Asia
United States, Japan and Europe
(iv) Selected developing economies(percentage)
0
1
2
3
4
5
6
7
8
9
10
2010 2011 2012 2013 2014 2015
China and India
Other developing countries
Source: UN/DESA Global Policy Model, available from http://www.un.org/esa/policy/publications/ungpm.html.
(ii) Developing economies(percentage of GDP)
-5
-4
-3
-2
-1
0
1
2
3
4
5
6
2010 2011 2012 2013 2014 2015
CIS and Western Asia
China
India
Other developing economies
(a) Current account of selected countries and country groups, 2010-2015
(b) gDP growth of selected countries and country groups, 2010-2015
44 World Economic Situation and Prospects 2011
appendixTable a balanced growth scenario: main outcomes by groups of countries, 2010-2015
2010 2011 2012 2013 2014 2015
gDP growth (percentage)
Europe 1.7 2.0 2.9 2.7 2.6 2.6Japan 2.8 2.3 2.3 2.7 2.9 3.0United States, Canada and other developed countries 2.7 2.9 3.4 3.2 3.2 3.2China 10.0 10.2 9.6 9.2 9.0 8.8India 8.4 8.6 9.1 8.6 8.3 8.1CIS and Western Asia (major fuel exporters) 4.8 4.8 4.8 5.2 5.1 5.0Other developing countries 5.9 5.5 5.5 5.4 5.4 5.4
Current account (percentage of gDP)
Europe 0.4 0.4 0.3 0.3 0.3 0.2Japan 2.8 2.0 1.9 1.8 1.7 1.6United States, Canada and other developed countries -2.6 -2.2 -2.1 -2.2 -2.4 -2.6China 3.6 3.5 3.4 3.3 3.2 3.2India -3.7 -3.4 -2.9 -2.6 -2.4 -2.1CIS and Western Asia (major fuel exporters) 4.3 4.9 4.6 4.5 4.5 4.4Other developing countries -1.0 -1.5 -1.5 -1.3 -1.0 -0.8
growth of private investment (constant prices)
Europe -6.5 0.1 1.7 3.3 3.5 3.6Japan -4.2 6.1 3.5 3.0 3.1 3.1United States, Canada and other developed countries -6.0 -1.0 2.2 4.3 4.7 5.0China 13.1 10.4 8.8 7.6 7.0 6.6India 8.9 7.5 7.2 7.6 7.1 6.9CIS and Western Asia (major fuel exporters) -6.1 10.5 9.7 8.2 7.7 7.0Other developing countries 4.5 12.3 9.5 7.8 6.8 6.3
Private investment (percentage of gDP)
Europe 15.7 15.5 15.3 15.5 15.7 15.8Japan 18.9 19.6 19.9 19.9 19.9 19.9United States, Canada and other developed countries 12.0 11.7 11.6 11.7 11.8 12.0China 39.3 39.5 39.1 38.5 37.8 37.0India 31.4 31.3 30.9 30.7 30.4 30.0CIS and Western Asia (major fuel exporters) 13.8 14.3 14.8 15.1 15.5 15.7Other developing countries 16.9 18.0 18.6 19.0 19.2 19.3
growth of government spending (constant prices)Europe 1.3 0.6 0.6 0.7 0.8 0.8Japan 1.4 1.5 0.9 0.9 1.0 1.0United States, Canada and other developed countries 4.2 2.5 1.9 2.1 2.1 2.1China 8.1 6.9 7.1 6.7 6.3 5.9India 6.2 5.2 5.5 6.0 6.3 6.5CIS and Western Asia (major fuel exporters) 8.1 5.4 4.6 4.2 4.0 3.9Other developing countries 5.6 5.9 5.3 4.8 4.5 4.4
45Global outlook
Table (cont’d)
2010 2011 2012 2013 2014 2015
government spending (percentage of gDP)
Europe 24.9 24.6 24.1 23.7 23.3 23.0Japan 21.8 21.6 21.3 21.0 20.6 20.1United States, Canada and other developed countries 22.9 22.9 22.6 22.4 22.2 21.9China 17.9 17.4 17.0 16.6 16.2 15.7India 16.1 15.7 15.2 14.9 14.6 14.4CIS and Western Asia (major fuel exporters) 25.4 25.2 25.0 24.5 24.0 23.7Other developing countries 19.3 19.4 19.3 19.1 18.9 18.7
Private consumption (percentage of gDP)
Europe 59.2 59.0 59.1 59.3 59.7 60.0Japan 59.3 58.7 58.6 58.7 59.0 59.4United States, Canada and other developed countries 69.0 68.2 67.9 68.0 68.1 68.2China 37.5 37.7 38.6 39.5 40.6 41.7India 53.2 54.0 54.6 55.0 55.4 55.8CIS and Western Asia (major fuel exporters) 53.9 52.9 53.0 53.2 53.3 53.5Other developing countries 62.0 61.2 60.8 60.4 60.1 59.9
Net private sector financial surplus (percentage of gDP)
Europe 4.9 4.1 3.3 2.5 1.9 1.4Japan 2.7 0.9 0.0 -0.8 -1.3 -1.8United States, Canada and other developed countries 6.5 5.9 5.0 4.1 3.3 2.7China 5.9 5.5 5.2 4.9 4.6 4.3India 2.3 1.5 0.9 0.4 0.2 0.1CIS and Western Asia (major fuel exporters) 8.7 8.9 8.4 8.0 7.7 7.4Other developing countries 0.8 0.3 0.1 0.2 0.3 0.4
Net government financial surplus (percentage of gDP)
Europe -4.5 -3.8 -3.0 -2.3 -1.7 -1.1Japan 0.1 1.1 1.9 2.5 3.0 3.4United States, Canada and other developed countries -9.1 -8.1 -7.1 -6.4 -5.8 -5.2China -2.3 -2.0 -1.8 -1.6 -1.4 -1.1India -6.0 -4.9 -3.8 -3.1 -2.6 -2.2CIS and Western Asia (major fuel exporters) -4.3 -4.1 -3.9 -3.5 -3.2 -3.0Other developing countries -1.8 -1.7 -1.6 -1.5 -1.4 -1.2
government debt (percentage of gDP)
Europe 89 91 91 91 90 88Japan 170 169 167 162 157 152United States, Canada and other developed countries 79 82 84 86 87 87China 8 7 7 8 8 8India 70 67 63 60 58 55CIS and Western Asia (major fuel exporters) 40 41 42 42 42 42Other developing countries 44 45 46 47 48 49
46 World Economic Situation and Prospects 2011
Table (cont’d)
2010 2011 2012 2013 2014 2015
Nominal exchange-rate appreciation (percentage)
Europe -5.0 -5.0 0.0 0.0 0.0 0.0Japan 6.0 5.0 2.0 3.0 3.0 3.0United States, Canada and other developed countries 1.8 1.4 0.2 -0.4 -0.6 -0.5China 1.0 0.0 0.0 -1.0 -1.0 0.0India -3.0 -2.0 -3.0 -4.0 -4.0 -4.0CIS and Western Asia (major fuel exporters) 0.0 0.0 -1.0 -6.0 -7.0 -7.0Other developing countries 4.0 3.0 -2.0 -6.0 -6.0 -5.0
Memorandum items (percentage)
Growth of gross world product at market rate (percentage) 3.6 3.7 4.2 4.1 4.1 4.1Growth of gross world product at PPP rate (percentage) 4.5 4.7 5.0 4.9 4.9 4.9Growth of exports of good and services (percentage) 6.9 7.0 8.4 8.3 8.3 8.4Real world price of energy (index) 1.3 1.4 1.5 1.5 1.6 1.6Real world price of food and primary commodities (index) 1.1 1.1 1.1 1.1 1.1 1.1Real world price of manufactures (index) 1.0 1.0 1.1 1.1 1.1 1.1
Source: UN/DESA Global Policy Model, availble from http://www.un.org/esa/policy/publications/ungpm.html.