26
ASEAN Business Outlook Survey 2014 IN COOPERATION WITH:
| Date post: | 21-Feb-2017 |
| Category: |
Documents |
| Upload: | gregory-tirrell |
| View: | 169 times |
| Download: | 0 times |

ASEAN Business Outlook Survey2014
IN COOPERATION WITH:

54 ASEAN Business Outlook Survey2014CONTENTS
05 06 38 08 40 13 42 24 44 25 46 26 48 28 50 30 32 52 34 53 36 54
ASEAN Business Outlook Survey
ASEAN Business Outlook Survey
ASEAN Business Outlook Survey
Vice President, AsiaU.S. Chamber of Commerce
Acting Executive DirectorAmCham Singapore
32 34 36 38 40 42 44 46 48 50 52 53 54

6 ASEAN Business Outlook Survey2014
IMPORTANCE OF ASEAN MARKETS
More important Less important Have the same importance
Don’t know
63% 3% 33% 1%
More important Less important Have the same importance
Don’t know
73% 2% 24% 1%
PROFIT OUTLOOK
57%
55%
48%
39%
28%
Economic recovery
Limited growth opportunities in other regions
Improvement in infrastructure
Change in business strategy
Stable political conditions
2013 Increase 2014 Increase
Brunei Cambodia Indonesia Laos Malaysia Myanmar Philippines Singapore Thailand Vietnam
66% 69% 64% 64%
37%50% 59%
78% 78%84% 84% 85% 85%
73% 73%62%
89%
75%
95% 93%100%
82%
Regional

9ASEAN Business Outlook Survey2014
Increased Decreased Remained about the same
79% 2% 19%
Increased Decreased Remained about the same
91% 2% 7%
LOCATION OF BUSINESS EXPANSION IN ASEAN
Indonesia Vietnam Thailand Myanmar Malaysia Philippines Singapore Cambodia Laos None Brunei
49%43% 40% 39%
31% 29%22% 20%
13%11% 6%
24%
Potential for business growth
Increasing market share
+P]LYZPÄJH[PVUVMJ\Z[VTLYIHZL
Economic recovery
Reasonable production costs
Stable government and political system
83%
46%
32%
30%
15%
Expand Contract Remain about the same Don’t know
Brunei
46%
9%
45%
Myanmar
100%
Philippines
82%
15%3%
Laos
69%
25%
6%
Malaysia
75%
19%6%
Indonesia
84%
16%
Cambodia
85%
10%5%
Regional
73%
2%
24%
1%
Thailand
74%
2%
23%
1%
Vietnam
1%
18%4%
77%
Singapore
1%2%
37%
60%
TRADE AND INVESTMENT IN ASEAN

ASEAN Business Outlook Survey2014
DIVERSIFYING OPERATIONS FROM CHINA INTO ASEAN
ASEAN Business Outlook Survey
22%
Potential for business growth
Increasing market share
+P]LYZPÄJH[PVUVMJ\Z[VTLYIHZL
Economic recovery
(]HPSHIPSP[`VM[YHPULKWLYZVUULSLMÄJPLU[THUWV^LY
Reasonable production costs
74%
50%
26%
26%
21%
20%Stable government and political system
Yes 2011 Yes 2012 Yes 2013
Regional Cambodia Indonesia Malaysia Philippines Singapore Thailand Vietnam
15%
6%
11%
23%
18%21%
27%
9% 11%
27%
13%
21%19%
12%
24%
34%
24%22%21%
26%
13%10%
21%19%
MYANMAR
2012 2013
Regional Brunei Cambodia Indonesia Laos Malaysia Philippines Singapore Thailand Vietnam
33%27%
37% 37%32%
37%35% 35%
41%44%
35%37%38%
30%
39%
13%26%
55%
2012 2013
Regional Brunei Cambodia Indonesia Laos Malaysia Philippines Singapore Thailand Vietnam
35%
29%
38% 37%
75%
23%
49%
31%
52%
46%
39%
45%50%
60%
49%
23%
31%
55%

ASEAN Business Outlook Survey2014
MONETARY AND RESOURCE CONSTRAINTS
Yes No
Regional Brunei Cambodia Indonesia Laos Malaysia Myanmar Philippines Singapore Thailand Vietnam
15% 18%
85% 82%
20%
80%
14% 14% 10% 11%
86% 86% 90% 89%
31%
3%
69%
97%
21%
79%
25%
75%
Thailand Vietnam
14% 15%
86% 85%
23%
77%
Yes No
Regional Brunei Cambodia Indonesia Laos Malaysia Myanmar Philippines Singapore
16% 9%
84% 91%
25%
75%
12% 14%
88% 86%
25%
75%
94%
18%
82%
6%
Yes No
Regional Brunei Cambodia Indonesia Laos Malaysia Myanmar Philippines Singapore Thailand Vietnam
20% 27%
80% 73%
20%
80%
49% 64%
2%21%
51%36%
98% 79%
38%
62%
100%
26%
74%
22%
78%
Most Significant Barriers to Conducting Business within ASEAN
Regional Brunei Cambodia Indonesia Laos Malaysia Myanmar Philippines Singapore Thailand Vietnam
77%
64%
6%
78% 78%
22% 22%
36%
70%
83%
30%
17%
65%
82%
94%
82%
35%23%
86%
14%18% 18%
Yes No
IMPORTANCE OF ASEAN INTEGRATION

ASEAN Business Outlook Survey2014
ASEAN’S ECONOMIC BLUEPRINT
ASEAN REGIONAL AGREEMENTS
Regional Brunei Cambodia Indonesia Laos Malaysia Myanmar Philippines Singapore Thailand Vietnam
54%46%
56%
41%
46%
59%
54%54%
62%
68%
38%
32%
55%55%
44%
53%
45%46%
64%
36%
45%47%
Yes No
Important Neutral or Unimportant
Framework Agreement on Services
Trade Facilitation Work Program and Strategic Plan of Customs Development
Comprehensive Investment Agreement
Trade in Goods Agreement
68% 32%
63% 37%
59% 41%
56% 44%
ASEAN ECONOMIC COMMUNITY
2016 2017 2018 2019 2020 or later
1%6%
25%
9%
59%
Likey Neither likely nor unlikely Unlikely
52%
23%
25%
HopesSeamless movement of goods and
services will enable productive operations across the ASEAN region.”
ConcernsThe AEC 2015, we feel, will have enormous
and positive impact in the years following 2015, but is not well understood within our region, let alone outside of it.”
“It will mean more investment overall and all well run and efficient businesses will grow and prosper.”
“I worry about the ability of all countries in ASEAN to enforce the rules and regulations.”

ASEAN Business Outlook Survey2014
Yes No
Australia & New Zealand
China India Japan Korea
45%
63%
47%48%
47%
55%
37%
53%52%
53%
Yes No
Australia & New Zealand
China Korea
21%
33%
27%
79%
67%73%
ASEAN FTAs – MANUFACTURING SECTOR UTILIZATION BY AGREEMENT
Australia & New Zealand
Australia & New Zealand
China India Japan Korea
8% 7% 6%10%
48%49% 48%
44% 44%42% 43% 43%
51%49%
8%
Not sureYes No
Australia and New Zealand:
AllManufacturing
Electronics Consumer goods
Food & FoodProducts
Oil &Petrochemical
Pharmaceuticals& Medical
Machinery &Equipment
Othermanufacturing
45%
30%
61%
52%
40%
28%
44%
53%
ASEAN FREE TRADE AGREEMENTS

ASEAN Business Outlook Survey2014
China
India
China:
AllManufacturing
Electronics Consumer goods
Food & FoodProducts
Oil &Petrochemical
Pharmaceuticals& Medical
Machinery &Equipment
Othermanufacturing
63%
74% 74%
43%40%
61%
78%
66%
India:
AllManufacturing
Electronics Consumer goods
Food & FoodProducts
Oil &Petrochemical
Pharmaceuticals& Medical
Machinery &Equipment
Othermanufacturing
47%
35%
61%
33%
20%
61% 61%
53%
Japan
Korea
Korea:
AllManufacturing
Electronics Consumer goods
Food & FoodProducts
Oil &Petrochemical
Pharmaceuticals& Medical
Machinery &Equipment
Othermanufacturing
47%
52%
57%
38%
27%
39%
50%53%
Japan:
AllManufacturing
Electronics Consumer goods
Food & FoodProducts
Oil &Petrochemical
Pharmaceuticals& Medical
Machinery &Equipment
Othermanufacturing
48%
61%
35%
52%
27%
61%
39%
53%
ASEAN Business Outlook Survey2014
Australia & New Zealand
China India Japan Korea
51% 51%53%
51%
2%
14%
6%
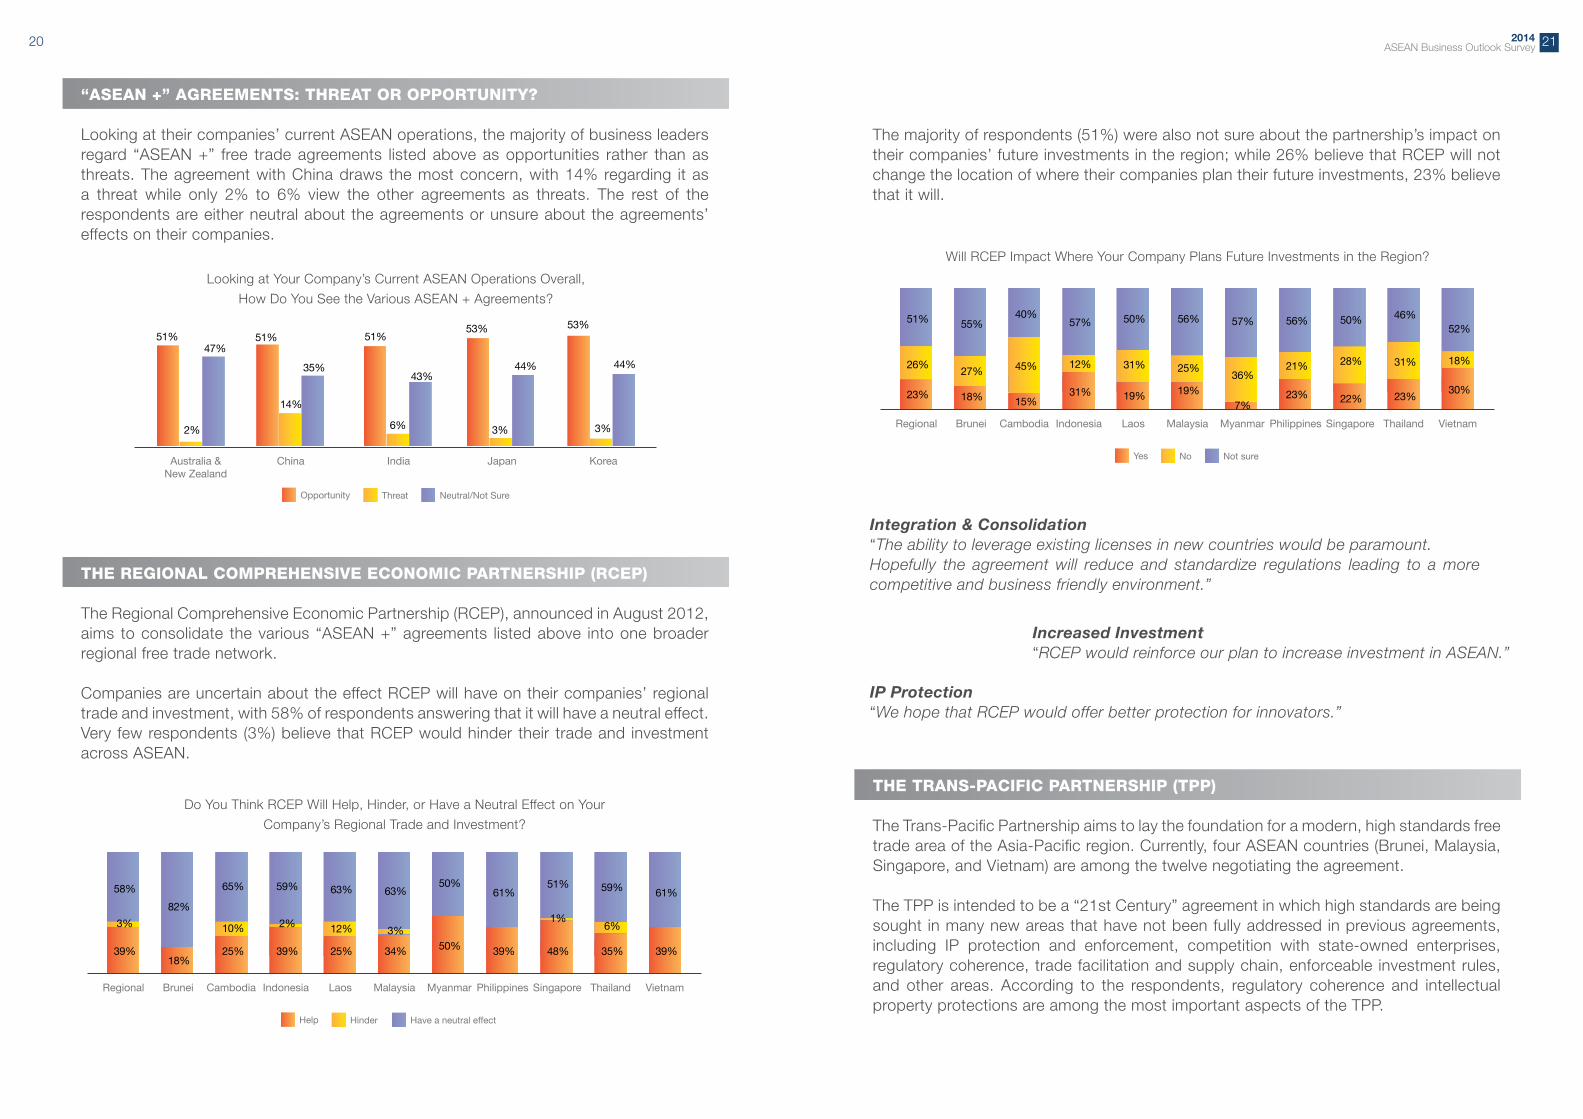
47%
35%43%
44% 44%
3% 3%
53%
Neutral/Not SureOpportunity Threat
THE REGIONAL COMPREHENSIVE ECONOMIC PARTNERSHIP (RCEP)
Have a neutral effectHelp Hinder
Thailand VietnamRegional Brunei Cambodia Indonesia Laos Malaysia Myanmar Philippines Singapore
39%
3%
58%
18%
82%
25%
10%
65%
39%
2%
59%
25%
12%
63%
34%
3%
63%
50%
50%
39%
61%
48%
1%
51%
35%
6%
59%
39%
61%
THE TRANS-PACIFIC PARTNERSHIP (TPP)
Not sureYes No
Thailand VietnamRegional Brunei Cambodia Indonesia Laos Malaysia Myanmar Philippines Singapore
23%
26%
51%
18%
55%
15%
45%
40%
31%
12%
57%
19%
31%
50%
19%
25%
56%
7%
36%
57%
23%
21%
56%
22%
28%
50%
23%
31%
46%
18%
30%
52%
27%
“ASEAN +” AGREEMENTS: THREAT OR OPPORTUNITY?
Integration & ConsolidationThe ability to leverage existing licenses in new countries would be paramount.
Hopefully the agreement will reduce and standardize regulations leading to a more competitive and business friendly environment.”
Increased InvestmentRCEP would reinforce our plan to increase investment in ASEAN.”
IP ProtectionWe hope that RCEP would offer better protection for innovators.”

2322 ASEAN Business Outlook Survey2014
THE “NOODLE BOWL” EFFECT
Helpful Neutral Unhelpful Not sure
38%
35%
17%10%
FOREIGN ACCOUNT TAX COMPLIANCE ACT (FATCA)
Not sureYes No
Thailand VietnamRegional Brunei Cambodia Indonesia Laos Malaysia Myanmar Philippines Singapore
36%
29%
35%
37%
36%
20%
50%
30%
31%
26%
43%
25%
25%
50%
41%
25%
34%
29%
43%
28%
44%
18%
38%
32%
29%
39%
30%
39%
31%
17%
55%
28%
27%
45%
Regulatory coherence
Intellectual property protection and enforcement
Trade facilitation and logistics/supply chain
Enforceable investment rules and protection
3L]LSWSH`PUNÄLSK^P[OZ[H[LV^ULKLU[LYWYPZLZ
67%
61%
53%
52%
Increased Investment in ASEANThe TPP would strengthen the growth potential in the region, improving the risk
appetite of our bank for the region.”
Vietnam Becomes a More Attractive Location for ExpansionWe would invest more production capacity in Vietnam as opposed
to other locations.”
Increased Ease of Doing BusinessThe agreement would allow easier expansion and structural alignment.
IP protection is key for our business.”
HelpfulIt takes a lot of work, but
we are able to maximize the benefits.”
UnhelpfulIt is confusing to investors
and slows down investment decisions.”
“As a professional services firm that advises companies on FDI and trade issues, the more complicated the regulatory regime the more assistance that our potential clients will need in evaluating the impact of these agreements.”
“It’s getting very complex and is hard to get accurate and up-to-date information on the various agreements to drive business decision making across ASEAN and in Asia Pacific with the new proposed agreements.”

2524 ASEAN Business Outlook Survey2014
EXPAT REQUESTS FOR RELOCATION
Yes No
Regional Brunei Cambodia Indonesia Laos Malaysia Myanmar Philippines Singapore Thailand Vietnam
90%
10%
100%90%
10%
84% 64% 94% 93%
16% 36%6% 7%
94%
6% 6%
92%
8%
81%
19%
94%
Regional Brunei Cambodia Indonesia Laos Malaysia Myanmar Philippines Singapore Thailand Vietnam
47%36%
69%
44%
71%
56%
29%
64%
41%
23%
59%
77%
65%
27% 31%
43%35%
53%
43%
57%
73%
57%
Yes No
EXPAT ASSIGNMENT SATISFACTION
Remain about the sameIncrease Decrease
Thailand VietnamRegional Brunei Cambodia Indonesia Laos Malaysia Myanmar Philippines Singapore
61%
4%
34%
73%
80%
20%
65%
2%
33%
50%
6%
44%
72%
6%
22%
100%
67%
5%
26%
56%
4%
39%
57%
6%
37%6%
61%
32%
27%
Not sureYes No
Thailand VietnamRegional Brunei Cambodia Indonesia Laos Malaysia Myanmar Philippines Singapore
17%
25%
58%
18%
64%
15%
35%
50%
8%12%
80%
13%
25%
62%
9%
47%
44%
7%
14%
79%
13%
31%
56%
15%
21%
64%
25%
31%
44%
23%
22%
55%
18%
Note: After the survey had closed, it was announced that the FATCA regulations will now be coming into place in July 2014 instead of in January 2014.

26 ASEAN Business Outlook Survey2014
EXPAT REQUESTS FOR TIME EXTENSION
Regional Brunei Cambodia Indonesia Laos Malaysia Myanmar Philippines Singapore Thailand Vietnam
78%82%
25%
81%83%
19% 17%18%
79%
73%
21%27%
90%
55%
75%74%
10%22%
50%45%
26%
Yes No
50%
Regional Brunei Cambodia Indonesia Laos Malaysia Myanmar Philippines Singapore Thailand Vietnam
33%26%
53%
31%
41%
69%
59%
74%
20%
35%
80%
65%
21%
9%
47%38%
79%
67%
43%
91%
62%
Yes No
57%
Note: Brunei is excluded from the two previous charts because too few respondents indicated that the ability to find space at international schools would be a significant problem over the next one to three years.
Yes No
Regional Cambodia Indonesia Laos Malaysia Myanmar Philippines Singapore Thailand Vietnam
42%
58%
50%
50%
21%33%
58%22%
79%67%
42%
78%
50%
50%70%
30%
70%
42%
58%
30%
Yes No
Regional Cambodia Indonesia Laos Malaysia Myanmar Philippines Singapore Thailand Vietnam
40%
60%
50%
50%
53%33% 38% 39%
47%
67% 62% 61%
38%
62%
40%
40%
60%
30%
70%
60%

29ASEAN Business Outlook Survey2014
Factors Regional Brunei Cambodia Indonesia Laos Malaysia Myanmar Philippines Singapore Thailand Vietnam
Availability of low cost labor 36% 73% 65% 53% 63% 53% 43% 74% 48% 40% 59%
Availability of raw materials 33% 55% 50% 37% 38% 38% 43% 38% 33% 35% 35%
Availability of trained personnel
41% 55% 55% 39% 69% 44% 71% 87% 57% 42% 43%
Corruption(or lack of) 48% 82% 65% 80% 75% 53% 43% 59% 87% 71% 70%
Ease of moving your products through customs
35% 36% 50% 45% 44% 56% 64% 44% 64% 30% 46%
Free movement of goods within the region
41% 36% 40% 35% 50% 47% 50% 41% 66% 40% 43%
Housing costs 39% 45% 55% 45% 44% 41% 86% 56% 71% 52% 45%
Infrastructure 48% 36% 45% 65% 63% 84% 93% 54% 89% 56% 65%
Laws & Regulations 37% 55% 50% 65% 63% 41% 86% 46% 84% 42% 59%
Local protectionism(or lack of)
41% 64% 45% 43% 44% 50% 50% 46% 60% 40% 46%
New business incentives offered by government
36% 45% 40% 47% 38% 44% 43% 44% 65% 42% 49%
6MÄJLSLHZLcosts
34% 36% 40% 45% 63% 53% 79% 51% 54% 51% 35%
Personal security 69% 91% 60% 49% 63% 34% 71% 56% 93% 75% 55%
Sentiment towards the U.S.
64% 73% 65% 53% 44% 53% 71% 79% 73% 64% 55%
Stable government & political system
51% 73% 45% 37% 38% 47% 50% 62% 90% 45% 38%
Tax structure 40% 45% 45% 45% 50% 41% 57% 56% 84% 43% 57%
:[YLUN[O!VYNYLH[LYZH[PZMHJ[PVUYH[L >LHR:[YLUN[O!7S\YHSP[`PZZH[PZÄLKI\[ZH[PZMHJ[PVUYH[LPZSLZZ[OHU
*VUJLYU!VYNYLH[LYKPZZH[PZMHJ[PVUYH[L >LHR*VUJLYU!7S\YHSP[`PZKPZZH[PZÄLKI\[KPZZH[PZMHJ[PVUYH[LPZSLZZ[OHU
Neutral: the plurality is neutral or the factor is inapplicable
Global Leaders in
Office Leasing and
Investment Transactions
Cushman & Wakefield advises landlords and tenants
on all aspects of real estate, from leasing and project
management to investment and valuation.
www.cushmanwakefield.com

ASEAN Business Outlook Survey2014
Increase: 10% or greater increase in satisfaction Weak Increase: Between 5% and 10% increase in satisfaction
Decrease: 10% or greater decrease in satisfaction Weak Decrease: Between 5% and 10% decrease in satisfaction
Minimal Change: the satisfaction percentage changed less than 5%.
5 year data is not available for Brunei, Cambodia, Laos, and Myanmar. Cells measure the change in those reporting that they were satisfied with a given factor, not dissatisfied or neutral.
Factors Regional Indonesia Malaysia Philippines Singapore Thailand Vietnam
Availability of low cost labor 9% 11% 27% 12% 5% 13% 3%
Availability of raw materials 1% 4% 4% 21% 10% 2% 11%
Availability of trained personnel 0% 4% 1% 25% 7% 7% 3%
Corruption (or lack of) 8% 13% 14% 20% 2% 5% 3%
Ease of moving your products through customs
4% 3% 17% 6% 9% 3% 1%
Free movement of goods within the region
1% 13% 5% 12% 9% 0% 15%
Housing costs 1% 7% 16% 10% 6% 10% 2%
Infrastructure 5% 3% 27% 15% 7% 3% 4%
Laws & Regulations 1% 23% 5% 2% 5% 3% 9%
Local protectionism (or lack of) 3% 1% 7% 0% 4% 6% 16%
New business incentives offered by government
7% 13% 8% 15% 6% 7% 32%
6MÄJLSLHZLJVZ[Z 1% 2% 6% 9% 10% 1% 16%
Personal security 1% 5% 17% 18% 1% 2% 18%
Sentiment towards the U.S. 2% 7% 7% 18% 10% 9% 16%
Stable government & political system
2% 25% 1% 50% 1% 5% 31%
Tax structure 6% 19% 22% 6% 4% 13% 9%
tŝƚŚĂƚĞĂŵŽĨŽǀĞƌϮϱϬƐƚĂī ŝŶĐůƵĚŝŶŐϭϮϬн ůĂǁLJĞƌƐĂŶĚ ĂĚǀŝƐĞƌƐ ǁŽƌŬŝŶŐ ĐůŽƐĞůLJ ƚŽŐĞƚŚĞƌ ǁŝƚŚŝŶ Ă ĨĂƐƚŐƌŽǁŝŶŐ ŶĞƚǁŽƌŬ ŽĨ ϭϮ ŽĸĐĞƐ ŝŶ ƐŝĂ ǁĞ ƉƌŽǀŝĚĞƉĞƌƐŽŶĂůŝnjĞĚĂŶĚĐŽƐƚͲĞīĞĐƟǀĞůĞŐĂůƚĂdžĂŶĚĐŽŶƐƵůƟŶŐƐĞƌǀŝĐĞƐĂŶĚƐŽůƵƟŽŶƐǁŝƚŚƉĂƌƟĐƵůĂƌĞdžƉĞƌƟƐĞŝŶ
Emerging Markets>ĂǁĮƌŵŽĨƚŚĞzĞĂƌ
Myanmar>ĂǁĮƌŵŽĨƚŚĞzĞĂƌ
Project FinanceĞĂůŽĨƚŚĞzĞĂƌ
E'>^,DK//EKE^/Ύ>KWZDzEDZ^/E'WKZd,/>E s/dEDΎ/ŶĞdžĐůƵƐŝǀĞĂƐƐŽĐŝĂƟŽŶǁŝƚŚDĂƚĂƌĂŵWĂƌƚŶĞƌƐ www.dfdl.com
Excellence . CreaƟǀŝƚy . TrustSince 1994
&ŽƵŶĚĞĚ ŝŶ ϭϵϵϰ &> ŝƐ ƚŚĞ ĮƌƐƚ ůĞĂĚŝŶŐ ŝŶƚĞƌŶĂƟŽŶĂů ůĂǁ Įƌŵ ƐƉĞĐŝĂůŝnjĞĚ ŝŶ ĞŵĞƌŐŝŶŐŵĂƌŬĞƚƐǁŝƚŚƉĂŶͲƌĞŐŝŽŶĂůůĞŐĂůĂŶĚƚĂdžĞdžƉĞƌƟƐĞĚĞǀĞůŽƉĞĚƚŚƌŽƵŐŚŽƵƚƚŚĞDĞŬŽŶŐƌĞŐŝŽŶ;ĂŵďŽĚŝĂ>ĂŽWZdŚĂŝůĂŶĚDLJĂŶŵĂƌsŝĞƚŶĂŵͿ/ŶĚŽŶĞƐŝĂ^ŝŶŐĂƉŽƌĞĂŶĚĂŶŐůĂĚĞƐŚwith a dedicated focus on ASEAN and the Middle East.
ͻŶĞƌŐLJ DŝŶŝŶŐΘ/ŶĨƌĂƐƚƌƵĐƚƵƌĞͻZĞĂůƐƚĂƚĞΘŽŶƐƚƌƵĐƟŽŶͻdĂdžĂƟŽŶͻŶŐůŝƐŚ>ĂǁŐŽǀĞƌŶĞĚƚƌĂŶƐĂĐƟŽŶƐͻŽƌƉŽƌĂƚĞΘŽŵŵĞƌĐŝĂůͻDĞƌŐĞƌƐΘĐƋƵŝƐŝƟŽŶƐ
ϭϵzĞĂƌƐĂƐWŝŽŶĞĞƌƐŝŶƚŚĞ&ƌŽŶƟĞƌDĂƌŬĞƚƐŽĨƐŝĂ

3332 ASEAN Business Outlook Survey2014
Indonesia Malaysia Myanmar Vietnam Thailand
73% 73%
64% 64%
55%
Profit Outlook 2013Increased Remain Steady Decrease
Profit Outlook 2014Increased Remain Steady
9%
18%
18%
82%
73%Current Business Climate:
Importance of ASEAN Markets:
Level of Trade and Investment in ASEAN:
Business Expansion:
Profit Outlook in Brunei: :H[PZÄLK +PZZH[PZÄLK
Regional ResponsibilityMultiple Countries Only One Country
46%54%
Company Expansion Plans
Expand Remain about the same Contract
9%
45%
46%
Expatriate Satisfaction:
Regional Responsibility:
Primary Business Activities:
Government Agencies:
46%
18%
18%
9%
Singapore
Thailand
Indonesia
Philippines
Major Strengths :H[PZÄLK
Major Concerns +PZZH[PZÄLK

3534 ASEAN Business Outlook Survey2014
Current Business Climate:
Importance of ASEAN Markets:
Level of Trade and Investment in ASEAN:
Business Expansion:
Profit Outlook in Cambodia:
Myanmar Laos Thailand Vietnam Indonesia
60%
35%
20%
15%10%
Profit Outlook 2013Increased Remain Steady Decrease
Profit Outlook 2014Increased Remain Steady
5%
20%
5%
95%
75%
2010 2011 2012 2013
41%
28%
13%20%
Expatriate Satisfaction:
Regional Responsibility:
Primary Business Activities:
Government Agencies:
Financing Constraints:
Regional ResponsibilityMultiple Countries Only One Country
95%
5%
Company Expansion PlansExpand Remain about the same Contract
5%
10%
85%
Major Strengths :H[PZÄLK
Major Concerns +PZZH[PZÄLK
20%
10%
10%
5%
Vietnam
Thailand
Myanmar
Singapore

36 ASEAN Business Outlook Survey2014
Current Business Climate:
Importance of ASEAN Markets:
Level of Trade and Investment in ASEAN:
Business Expansion:
Profit Outlook in Indonesia:
Myanmar Thailand Vietnam Malaysia Philippines
39% 39% 39%
33%
22%
Profit Outlook 2013
Profit Outlook 2014
2%
4%
25%
2%2%
18%
78%
69%
2010 2011 2012 20132009
55%
29%22%
13% 14%
Increased Remain Steady Decrease Not sure
Increased Remain Steady Decrease Not sure
Expatriate Satisfaction:
Primary Business Activities:
Regional ResponsibilityMultiple Countries Only One Country
63%
37%
Company Expansion PlansExpand Remain about the same
16%
84%
18%
16%
14%
12%
Thailand
Singapore
Malaysia
Vietnam
:H[PZÄLK +PZZH[PZÄLK
Major Strengths :H[PZÄLK
Major Concerns +PZZH[PZÄLK

39ASEAN Business Outlook Survey2014
Current Business Climate:
Importance of ASEAN Markets:
Level of Trade and Investment in ASEAN:
Business Expansion:
Profit Outlook in Laos:
LAOS
Myanmar Thailand Cambodia Indonesia Laos
50%
31%
25% 25% 25%
Profit Outlook 2013
Profit Outlook 2014
44%
6%
13%
13%
6%
50%
31%
37%
Increased Remain Steady Decrease Not sure
Increased Remain Steady Decrease Not sure
:H[PZÄLK +PZZH[PZÄLK
Expatriate Satisfaction:
Regional Responsibility:
Primary Business Activities:
Government Agencies
Regional ResponsibilityMultiple Countries Only One Country
56%
44%
Company Expansion PlansExpand Remain about the same
25%
6%
69%
38%
19%
6%
6%
Cambodia
Myanmar
Thailand
Vietnam
Major Strengths :H[PZÄLK
Major Concerns +PZZH[PZÄLK
Contract

ASEAN Business Outlook Survey2014
Current Business Climate:
Importance of ASEAN Markets:
Level of Trade and Investment in ASEAN:
Business Expansion:
Profit Outlook in Malaysia:
Vietnam Thailand Indonesia Philippines Singapore
50%
47%44%
31%
22%
Profit Outlook 2013
Profit Outlook 2014
35%
6%
6%
78%
16%
59%
Increased Remain Steady Decrease
Increased Remain Steady Decrease
2010 2011 2012 20132009
47%
15% 15%
3% 3%
Expatriate Satisfaction:
Primary Business Activities:
Regional ResponsibilityMultiple Countries Only One Country
31%
69%
Company Expansion PlansExpand Remain about the same
19%
6%
75%
31%
22%
13%
6%
Singapore
Thailand
Indonesia
Philippines
Contract
:H[PZÄLK +PZZH[PZÄLK
Major Strengths :H[PZÄLK
Major Concerns +PZZH[PZÄLK

4342 ASEAN Business Outlook Survey2014
Current Business Climate:
Importance of ASEAN Markets:
Level of Trade and Investment in ASEAN:
Business Expansion:
Profit Outlook in Myanmar:
Indonesia Singapore Cambodia Laos Malaysia
43%
36%
29% 29% 29%
Profit Outlook 2013
Profit Outlook 2014
7%
100%
93%
Increased Remain Steady
Increased
:H[PZÄLK +PZZH[PZÄLK
Expatriate Satisfaction:
Regional Responsibility:
Primary Business Activities:
Government Agencies:
Regional ResponsibilityMultiple Countries Only One Country
14%
86%
Company Expansion PlansExpand
100%
50%
14%
7%
7%
Thailand
Cambodia
Singapore
Philippines
Major Strengths :H[PZÄLK
Major Concerns +PZZH[PZÄLK

4544 ASEAN Business Outlook Survey2014
Current Business Climate:
Importance of ASEAN Markets:
Level of Trade and Investment in ASEAN:
Business Expansion:
Profit Outlook in the Philippines:
Indonesia Thailand Vietnam Malaysia Myanmar
33%
28%
26%
23%
18%
Profit Outlook 2013
Profit Outlook 2014
21%
3%
15%
5%
8%
84%
64%
Increased Remain Steady Decrease
Increased Remain Steady Decrease Not sure
2010 2011 2012 20132009
39%
10%
26%
18%21%
Expatriate Satisfaction:
Regional Responsibility:
Government Agencies
Regional ResponsibilityMultiple Countries Only One Country
39%
61%
Company Expansion Plans
82%
15%
3%
23%
15%
13%
5%
Singapore
Thailand
Indonesia
Malaysia
:H[PZÄLK +PZZH[PZÄLK
Major Strengths :H[PZÄLK
Major Concerns +PZZH[PZÄLK
Expand Remain about the same Don’t know
46 ASEAN Business Outlook Survey2014
Current Business Climate:
Importance of ASEAN Markets:
Level of Trade and Investment in ASEAN:
Business Expansion:
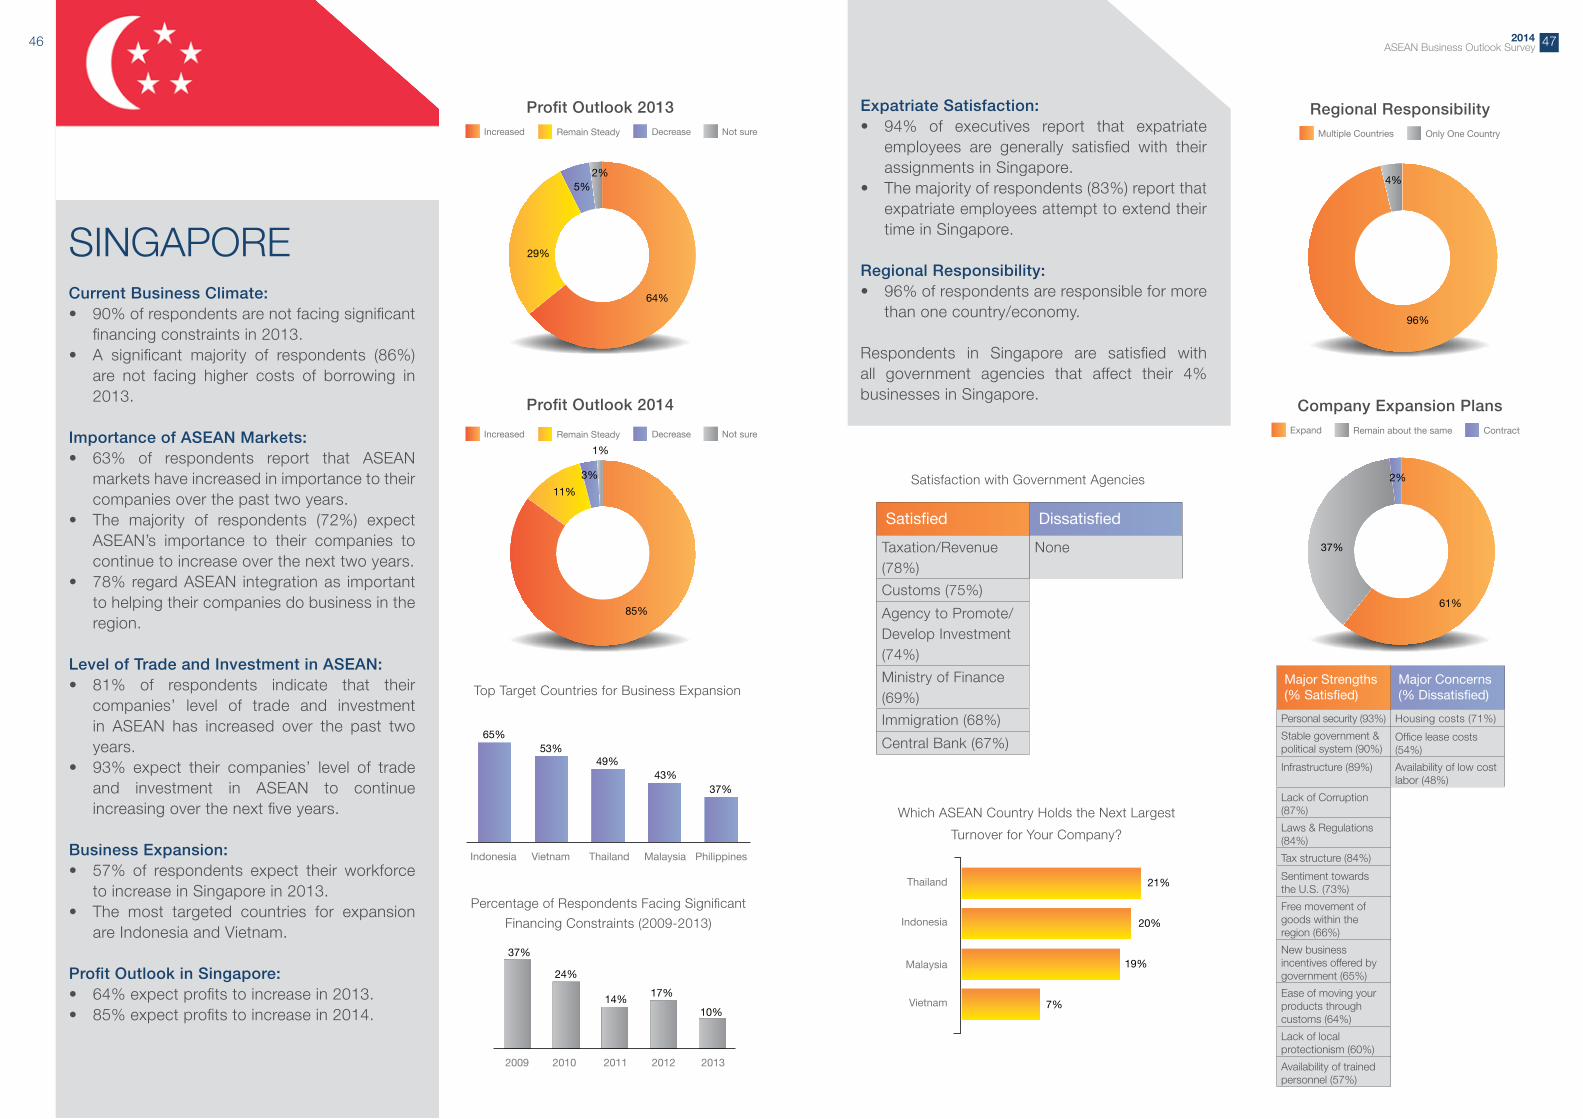
Profit Outlook in Singapore:
Indonesia Vietnam Thailand Malaysia Philippines
65%53%
49%43%
37%
Profit Outlook 2013
Profit Outlook 2014
29%
1%
5%2%
3%
11%
85%
64%
Increased Remain Steady Decrease Not sure
Increased Remain Steady Decrease Not sure
2010 2011 2012 20132009
37%
24%
14%17%
10%
Regional ResponsibilityMultiple Countries Only One Country
96%
4%
Company Expansion Plans
61%
37%
2%
21%
20%
19%
7%
Thailand
Indonesia
Malaysia
Vietnam
Expand Remain about the same Contract
Expatriate Satisfaction:
Regional Responsibility:
:H[PZÄLK +PZZH[PZÄLK
Major Strengths :H[PZÄLK
Major Concerns +PZZH[PZÄLK

49ASEAN Business Outlook Survey2014
Current Business Climate:
Importance of ASEAN Markets:
Level of Trade and Investment in ASEAN:
Business Expansion:
Profit Outlook in Thailand:
Indonesia Myanmar Thailand Vietnam Cambodia
50%47% 47%
37%30%
Profit Outlook 2013
Profit Outlook 2014
25%
1%
2%
10%
89%
73%
Increased Remain Steady Decrease
Increased Remain Steady Decrease
2010 2011 2012 20132009
48%
27% 21%16%
11%
Regional ResponsibilityMultiple Countries Only One Country
56%44%
Company Expansion Plans
75%
23%
2%
14%
13%
12%
11%
Indonesia
Philippines
Singapore
Malaysia
Expand Remain about the same Contract
Expatriate Satisfaction:
Regional Responsibility:
Government Agencies
:H[PZÄLK +PZZH[PZÄLK
Major Strengths :H[PZÄLK
Major Concerns +PZZH[PZÄLK

ASEAN Business Outlook Survey2014
Current Business Climate:
Importance of ASEAN Markets:
Level of Trade and Investment in ASEAN:
Business Expansion:
Profit Outlook in Vietnam:
Vietnam Myanmar Thailand Cambodia Indonesia
58%
41%
29%26% 26%
Profit Outlook 2013
Profit Outlook 2014
28%
9%
3%
1%
12%
85%
62%
Increased Remain Steady Decrease
2010 2011 2012 20132009
47%
30%
19%
39%
25%
Increased Remain Steady Decrease Not sure
Regional ResponsibilityMultiple Countries Only One Country
26%
74%
Company Expansion Plans
78%
18%
4%
17%
12%
7%
7%
Singapore
Thailand
Malaysia
Indonesia
Expand Remain about the same Contract
Expatriate Satisfaction:
Regional Responsibility:
Primary Business Activities:
:H[PZÄLK +PZZH[PZÄLK
Major Strengths :H[PZÄLK
Major Concerns +PZZH[PZÄLK

5352 ASEAN Business Outlook Survey2014
ASEAN Business Outlook Survey
Regional Brunei Cambodia Indonesia Laos Malaysia Myanmar Philippines Singapore Thailand Vietnam
Country of Responsibility
Only ONE country 44% 55% 95% 63% 56% 31% 86% 62% 4% 44% 74%
Multiple countries 56% 45% 5% 37% 44% 69% 14% 38% 96% 56% 26%
Primary Activities
Services 53% 46% 65% 35% 63% 34% 86% 62% 65% 51% 42%Manufacturing 32% 36% 20% 41% 25% 31% 7% 20% 24% 35% 51%
Other 15% 18% 15% 24% 12% 35% 7% 18% 11% 14% 7%
Size of Workforce (Number of Employees)*
Below 50 29% 64% 35% 14% 44% 31% 64% 13% 32% 28% 28%50 to < 500 39% 18% 40% 45% 31% 31% 7% 51% 37% 37% 51%
500 to <1,000 9% 0% 10% 15% 6% 19% 0% 10% 7% 11% 4%1000 to<1,500 6% 0% 5% 8% 0% 6% 7% 10% 4% 7% 4%1500 to<2,000 2% 0% 0% 8% 0% 0% 0% 0% 2% 4% 2%2000 or above 13% 18% 5% 10% 19% 13% 22% 13% 17% 11% 7%
2013 Turnover in Response Country (US$)*
Below $1 million 15% 18% 30% 6% 44% 6% 57% 15% 14% 11% 14%
$1 - <$49 million 45% 55% 55% 43% 25% 44% 36% 49% 44% 44% 51%
$50 - <$99 million 11% 9% 5% 16% 13% 3% 7% 8% 12% 11% 10%
$100 - <$499 million 14% 18% 5% 19% 6% 28% 0% 20% 11% 17% 9%
$500 - <$999 million 2% 0% 0% 2% 0% 3% 0% 5% 1% 3% 0%
$1 billion or above 7% 0% 0% 10% 0% 16% 0% 0% 8% 11% 3%
Percentage of Global Turnover Represented in Response Location
Less than 5% 55% 82% 45% 61% 50% 53% 57% 59% 56% 51% 52%5% - <25% 22% 0% 15% 25% 19% 22% 29% 23% 24% 20% 20%25% - <50% 7% 9% 5% 10% 0% 16% 0% 2% 7% 10% 6%50% - <75% 3% 0% 0% 4% 12% 3% 7% 3% 1% 3% 3%75% - <100% 4% 0% 0% 0% 0% 0% 0% 0% 4% 8% 12%
100% 9% 9% 35% 0% 19% 6% 7% 13% 8% 8% 7%
Regional Brunei Cambodia Indonesia Laos Malaysia Myanmar Philippines Singapore Thailand Vietnam
Percentage of ASEAN Turnover Represented in Response Location
Less than 5% 21% 46% 35% 16% 37% 3% 50% 26% 20% 13% 25%5% - <25% 33% 45% 20% 49% 19% 31% 22% 25% 34% 25% 42%25% - <50% 15% 0% 5% 21% 6% 25% 7% 10% 15% 23% 11%50% - <75% 9% 0% 5% 2% 13% 22% 0% 8% 10% 13% 3%75%-<100% 7% 0% 0% 2% 6% 9% 7% 8% 7% 10% 7%
100% 15% 9% 35% 10% 19% 10% 14% 23% 14% 16% 12%
Length of Membership*
Less than 2yrs 2% 5% 0% 3% 0% 5% 0% 0%
2 yrs to < 5 yrs 8% 0% 2% 3% 5% 10% 8% 12%
5 yrs to < 10 yrs 14% 10% 2% 28% 23% 10% 10% 28%
10 yrs to < 20 yrs 31% 40% 33% 28% 33% 27% 37% 30%
20 yrs or longer 45% 45% 63% 38% 39% 48% 45% 30%


![Energy [R]evolution: A Sustainable ASEAN Energy Outlook](https://static.documents.pub/doc/80x56/568bd5381a28ab203497a98f/energy-revolution-a-sustainable-asean-energy-outlook.jpg)
