58
one vision one identity one community CHARTBOOK 2016 ASEAN ECONOMIC COMMUNITY

AASEAN Economic Chartbook 2016
ASEAN
@ASEAN
www.asean.org
ASEANA COMMUNITY
OFOPPORTUNITIES
one visionone identity
one community
CHARTBOOK
2016ASEAN ECONOMIC COMMUNITY

ASEAN Economic CommunityChartbook 2016
The ASEAN SecretariatJakarta
The Association of Southeast Asian Nations (ASEAN) was established on 8 August 1967. The Member States are Brunei Darussalam, Cambodia, Indonesia, Lao PDR, Malaysia, Myanmar, Philippines, Singapore, Thailand and Viet Nam. The ASEAN Secretariat is based in Jakarta, Indonesia.
For inquiries, contact:The ASEAN SecretariatCommunity Relations Division (CRD)70A Jalan SisingamangarajaJakarta 12110IndonesiaPhone : (62 21) 724-3372, 726-2991Fax : (62 21) 739-8234, 724-3504E-mail : [email protected]
Catalogue-in-Publication Data
Master Plan on ASEAN Connectivity 2025Jakarta, ASEAN Secretariat, October 2016
380.591. ASEAN 2025 – Infrastructure – Technologies 2. Logistics – Regulatory – People Mobility
ISBN 978-602-6392-02-2
ASEAN: A Community of Opportunities
The text of this publication may be freely quoted or reprinted, provided proper acknowledgement is given and a copy containing the reprinted material is sent to the Community Relations Division (CRD) of the ASEAN Secretariat, Jakarta.
General information on ASEAN appears online at the ASEAN Website: www.asean.org
Copyright Association of Southeast Asian Nations (ASEAN) 2016.All rights reserved.

iASEAN Economic Chartbook 2016
TABLE OF CONTENTS
1 ASEAN in the Global Economy1.1 Total Population . . . . . . . . . . . . . . . . . . . . . . . . . . . . . . . . . . . . . . . . . . . . . . . . . . . . . . 11.2 Gross Domestic Product (GDP), at current price . . . . . . . . . . . . . . . . . . . . . . . . . . . . . . . . . . . . . 21.3 GDP per capita, at current price . . . . . . . . . . . . . . . . . . . . . . . . . . . . . . . . . . . . . . . . . . . . . . 31.4 GDP per capita, at PPP* . . . . . . . . . . . . . . . . . . . . . . . . . . . . . . . . . . . . . . . . . . . . . . . . . . 41.5 Trade in Goods . . . . . . . . . . . . . . . . . . . . . . . . . . . . . . . . . . . . . . . . . . . . . . . . . . . . . . . 51.6 Foreign Direct Investment (FDI) . . . . . . . . . . . . . . . . . . . . . . . . . . . . . . . . . . . . . . . . . . . . . . 6
2 ASEAN Economy2.1 Annual GDP Growth . . . . . . . . . . . . . . . . . . . . . . . . . . . . . . . . . . . . . . . . . . . . . . . . . . . . 72.2 GDP per capita, at current price . . . . . . . . . . . . . . . . . . . . . . . . . . . . . . . . . . . . . . . . . . . . . . 82.3 Consumer Price Index in ASEAN-6 (base year = 2005) . . . . . . . . . . . . . . . . . . . . . . . . . . . . . . . . . . 92.4 Consumer Price Index of Transport and Housing in ASEAN-6 (base year = 2005) . . . . . . . . . . . . . . . . . . . .102.5 Currencies-to-US Dollar (period average) . . . . . . . . . . . . . . . . . . . . . . . . . . . . . . . . . . . . . . . . . 112.6 Currencies-to-US Dollar (period average) . . . . . . . . . . . . . . . . . . . . . . . . . . . . . . . . . . . . . . . . .12
3 ASEAN Trade in Goods3.1 Trade in Goods . . . . . . . . . . . . . . . . . . . . . . . . . . . . . . . . . . . . . . . . . . . . . . . . . . . . . .133.2 Trade in Goods as Percent Share of GDP . . . . . . . . . . . . . . . . . . . . . . . . . . . . . . . . . . . . . . . . .143.3 Intra- and Extra-ASEAN Trade in Goods . . . . . . . . . . . . . . . . . . . . . . . . . . . . . . . . . . . . . . . . .153.4 ASEAN Member States Exports of Goods by Destination, 2015 . . . . . . . . . . . . . . . . . . . . . . . . . . . . .163.5 ASEAN Member States Imports of Goods by Origin, 2015 . . . . . . . . . . . . . . . . . . . . . . . . . . . . . . . .173.6 Top Ten Export Commodities, 2015 . . . . . . . . . . . . . . . . . . . . . . . . . . . . . . . . . . . . . . . . . . . .183.7 Top Ten Import Commodities, 2015 . . . . . . . . . . . . . . . . . . . . . . . . . . . . . . . . . . . . . . . . . . . .193.8 Intra-ASEAN Top 5 Trade Commodities, 2015 . . . . . . . . . . . . . . . . . . . . . . . . . . . . . . . . . . . . . . .203.9 Extra-ASEAN Top 5 Trade Commodities, 2015 . . . . . . . . . . . . . . . . . . . . . . . . . . . . . . . . . . .21
4 ASEAN Trade in Goods with Dialogue Partners4.1 Total Trade in Goods . . . . . . . . . . . . . . . . . . . . . . . . . . . . . . . . . . . . . . . . . . . . . . . . . . . .224.2 Total Trade in Goods . . . . . . . . . . . . . . . . . . . . . . . . . . . . . . . . . . . . . . . . . . . . . . . . . . . .234.3 Exports of Goods. . . . . . . . . . . . . . . . . . . . . . . . . . . . . . . . . . . . . . . . . . . . . . . . . . . . . .24

ii ASEAN Economic Chartbook 2016
4.4 Imports of Goods . . . . . . . . . . . . . . . . . . . . . . . . . . . . . . . . . . . . . . . . . . . . . . . . . . . . . .254.5 Trade in Goods Balance . . . . . . . . . . . . . . . . . . . . . . . . . . . . . . . . . . . . . . . . . . . . . . . . . .264.6 Top 5 Traded Commodities with Australia-New Zealand, 2015 . . . . . . . . . . . . . . . . . . . . . . . . . . . . . .274.7 Top 5 Traded Commodities with Canada, 2015 . . . . . . . . . . . . . . . . . . . . . . . . . . . . . . . . . . . . . .284.8 Top 5 Traded Commodities with China, 2015 . . . . . . . . . . . . . . . . . . . . . . . . . . . . . . . . . . . . . . .294.9 Top 5 Traded Commodities with EU-28, 2015 . . . . . . . . . . . . . . . . . . . . . . . . . . . . . . . . . . . . . . .304.10 Top 5 Traded Commodities with India, 2015 . . . . . . . . . . . . . . . . . . . . . . . . . . . . . . . . . . . . . . . .314.11 Top 5 Traded Commodities with Japan, 2015 . . . . . . . . . . . . . . . . . . . . . . . . . . . . . . . . . . . . . . .324.12 Top 5 Traded Commodities with Republic of Korea, 2015 . . . . . . . . . . . . . . . . . . . . . . . . . . . . . . . . .334.13 Top 5 Traded Commodities with Russian Federation, 2015 . . . . . . . . . . . . . . . . . . . . . . . . . . . . . . . .344.14 Top 5 Traded Commodities with USA, 2015 . . . . . . . . . . . . . . . . . . . . . . . . . . . . . . . . . . . . . . . .35
5 ASEAN Trade in Services5.1 Trade in Services. . . . . . . . . . . . . . . . . . . . . . . . . . . . . . . . . . . . . . . . . . . . . . . . . . . . . .365.2 Exports of Services by Broad Headings . . . . . . . . . . . . . . . . . . . . . . . . . . . . . . . . . . . . . . . . . .375.3 Imports of Services by Broad Headings . . . . . . . . . . . . . . . . . . . . . . . . . . . . . . . . . . . . . . . . . .385.4 Intra-ASEAN Exports of Services by Broad Headings . . . . . . . . . . . . . . . . . . . . . . . . . . . . . . . . . . .395.5 Intra-ASEAN Imports of Services by Broad Headings . . . . . . . . . . . . . . . . . . . . . . . . . . . . . . . . . . .40
6 Investments in ASEAN6.1 NetInflowsofFDIbyASEANMemberStates(ASEAN-6) . . . . . . . . . . . . . . . . . . . . . . . . . . . . . . . .416.2 NetInflowsofFDIbyASEANMemberStates(CLMV) . . . . . . . . . . . . . . . . . . . . . . . . . . . . . . . . . .426.3 NetinflowsofFDI,ExtraandIntra-ASEAN . . . . . . . . . . . . . . . . . . . . . . . . . . . . . . . . . . . . . . . .436.4 NetInflowsofFDIinASEAN . . . . . . . . . . . . . . . . . . . . . . . . . . . . . . . . . . . . . . . . . . . . . . . .446.5 Intra-ASEANNetInflowsofFDI,2015 . . . . . . . . . . . . . . . . . . . . . . . . . . . . . . . . . . . . . . . . . .456.6 NetInflowsofFDIbyComponent . . . . . . . . . . . . . . . . . . . . . . . . . . . . . . . . . . . . . . . . . . . . .466.7 NetInflowsofFDIbyActivity,2015 . . . . . . . . . . . . . . . . . . . . . . . . . . . . . . . . . . . . . . . . . . . .47
7 Other Developments in the ASEAN Economic Community7.1 Internet Subscribers/Users and Cellular Phone Density (per 100 persons) . . . . . . . . . . . . . . . . . . . . . . . .487.2 Ratio of Paved Road to Total Road Length . . . . . . . . . . . . . . . . . . . . . . . . . . . . . . . . . . . . . . . .497.3 Visitor Arrivals . . . . . . . . . . . . . . . . . . . . . . . . . . . . . . . . . . . . . . . . . . . . . . . . . . . . . . .50

iiiASEAN Economic Chartbook 2016
INTRODUCTION
The ASEAN Economic Community (AEC) Chartbook 2016, provides statistical updates on the various dimensions of the ASEAN economic community based primarily on data submitted by the ASEAN Member States (AMS). It covers the period of 2007, the year the Declaration on the ASEAN Economic Community Blueprint was signed, to 2015.
The AEC Chartbook, now in its 10thedition,aimstowalkitsreadersthroughthedifferentdevelopmentstakingplaceintheASEAN region ranging from demography, economy, international trade, investment to infrastructure, in eight sections as follows:
CONTENTS
1. ASEAN in the Global Economy situates the region in the global economy in terms of its population, economic size and growth, trade, and investment.
2. ASEAN Economy looks into key macroeconomic trends and developments within the region.3. ASEAN Trade in Goods examines the trends of exports and imports of goods, composition and direction of trade within
the region and with the rest of the world.4. ASEAN Trade with Dialogue Partners maps out the region’s trade position and the concentration and dependencies
of traded commodities with its dialogue partners 5. ASEAN Trade in Services describes the trends of exports and imports of services within ASEAN and with the rest of
the world. 6. Investment in ASEANhighlightstheinflowsofforeigndirectinvestmentintotheregion.7. Other Developments in the ASEAN Economic Community examines other important elements characterising the
regional economy, i.e. information and communications technology, infrastructure, and tourism.
CAVEAT
The charts presented in this publication are based on data available in the various databases being maintained by the ASEAN Secretariat as submitted through relevant ASEAN working groups and/or data sharing schemes and/or as gathered from officialpublicationsandwebsitesoftheASEANMemberStatesandinternationalorganisations,asof31Agustus2016.
Some data were derived/estimated using basic statistical approaches employed by the ASEAN Secretariat. Unless otherwise stated,thesefiguresareinnowayconsideredastheofficialstatistics,andareusedonlytogiveindicativeinformation.
ASEAN Economic CommunityCHARTBOOK 2016

iv ASEAN Economic Chartbook 2016

1ASEAN Economic Chartbook 2016
1 ASEAN in the Global Economy1.1 Total Population
In million persons
1,3751,293
629
322255
204 186 179 160 146 127
0
200
400
600
800
1,000
1,200
1,400
1,600
China India ASEAN USA Indonesia Brazil Pakistan Nigeria Bangladesh Russia Mexico
2007 2014 2015
Source: ASEAN Secretariat and IMF World Economic Outlook April 2016.
In 2015, ASEAN’s population increased by 11.1% from 2007. ASEAN’s population was the third largest in the world, after China and India. Indonesia’s population accounted for about 40% of the region’s total population.

2 ASEAN Economic Chartbook 2016
ASEAN in the Global Economy 1 Gross Domestic Product (GDP), at current price 1.2
In billion US dollars
USA, 24.5%China, 15.0%
Brazil, 2.4%Italy, 2.5%India, 2.9%
France, 3.3%
ASEAN, 3.3%
United Kingdom, 3.9%
Germany, 4.6%
Japan, 5.6%
Rest of theWorld, 32.0%
Percent Share to World GDP, 2015
17,947
10,983
4,123
3,358
2,849
2,432
2,422
2,091
1,816
1,773
0 5,000 10,000 15,000 20,000
USA
China
Japan
Germany
United Kingdom
ASEAN
France
India
Italy
Brazil 2007
2014
2015
GDP at Current Price
Source: ASEAN Secretariat and IMF World Economic Outlook April 2016.
In 2015, ASEAN overtook France as the sixth richest economy in the world. ASEAN was also third among the Asian countries, after China and Japan.
3ASEAN Economic Chartbook 2016
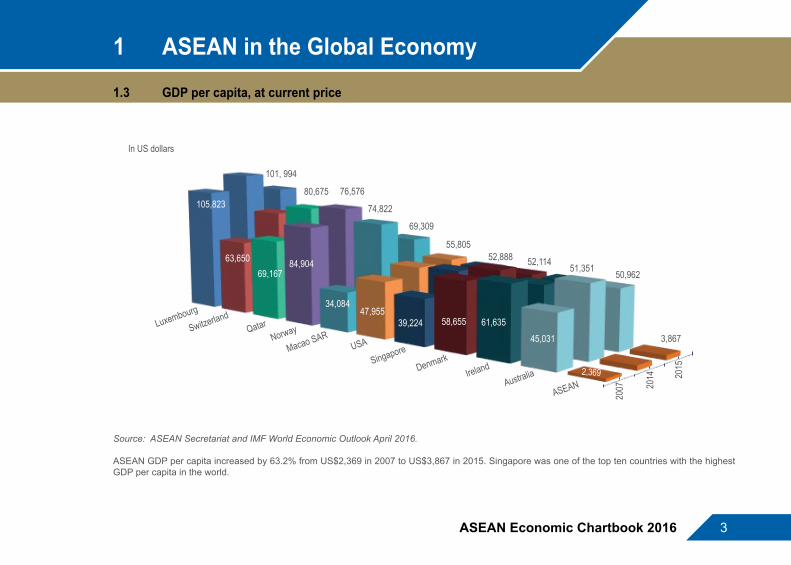
1 ASEAN in the Global Economy1.3 GDP per capita, at current price
In US dollars
2007 20
14 2015
105,823
101, 994
63,650
80,675
69,167
76,576
84,904
74,822
34,084
69,309
47,955
55,805
39,224
52,888
58,655
52,114
61,635
51,351
45,031
50,962
3,867Luxembourg
SwitzerlandQatar
Norway
Macao SARUSA
Singapore
DenmarkIreland
Australia
ASEAN
Source: ASEAN Secretariat and IMF World Economic Outlook April 2016.
ASEAN GDP per capita increased by 63.2% from US$2,369 in 2007 to US$3,867 in 2015. Singapore was one of the top ten countries with the highest GDP per capita in the world.

4 ASEAN Economic Chartbook 2016
ASEAN in the Global Economy 1 GDP per capita, at PPP* 1.4
2007 20
14 2015
116,969
90,665
98,987
70,346
98,135
64,421
85,253
76,560
79,587
66,616
70,166
61,899
68,430
72,892
67,617
84,307
63,104
51,355
58,551
7,052
11,009
7,052
132,099
In PPP US dollars
Qatar
Luxembourg
Macao SARSingapore
Brunei DarussalamKuwait
Norway
United Arab Emirates
San Marino
Switzerland
ASEAN
* Purchasing Power Parity; PPP dollar takes into account the differences in the purchasing power of the US dollar in the countries. PPP $1 in a country, say Cambodia, has the same purchasing power as PPP $1 in all other countries in the world.
Source: ASEAN Secretariat and IMF World Economic Outlook April 2016.
The region’s GDP per capita (PPP) increased by 56.1% from US$7,052 in 2007 to US$11,009 in 2015. Singapore and Brunei Darussalam were among the top 5 economies with the highest GDP per capita (PPP) in the world.

5ASEAN Economic Chartbook 2016
1 ASEAN in the Global Economy1.5 Trade in Goods
In billion US dollars
USA, 13.6%
Netherlands, 3.0%
Rep. of Korea, 3.0%United Kingdom, 3.7%
France, 4.1%
Japan, 4.2%
Hong Kong, 5.2%
ASEAN, 7.6%
Germany, 8.0%
Rest of theWorld, 33.7%
China, 13.8%
Percent Share to World Total Trade, 2015
4,108
4,026
2,388
2,270
1,532
1,251
1,225
1,103
891
888
0 1,000 2,000 3,000 4,000 5,000
China
USA
Germany
ASEAN
China, HongKong SAR
Japan
France
United Kingdom
Netherlands
Italy 2007
2014
2015
Total Trade
Source: ASEAN Secretariat and UNComtrade.
In 2015, ASEAN’s total trade stood at US$2.3 trillion, accounting for 7.6% share of the world’s total trade; and placed fourth after China (13.8%), USA (13.6%) and Germany (8.0%).

6 ASEAN Economic Chartbook 2016
ASEAN in the Global Economy 1 Foreign Direct Investment (FDI) 1.6
In billion US dollars
British Virgin Islands, 2.9%
Brazil, 3.7%
Switzerland, 3.9%
Netherlands, 4.1%
Ireland, 5.7%
ASEAN, 6.8%
China, 7.7%
Hong Kong, China, 9.9%
Rest of theWorld, 33.7%
Percent Share to World Total FDI Inflows, 2015
USA, 21.6%
380
175
136
120
101
73
69
65
65
52
0 100 200 300 400
USA
Hong Kong, China
China
ASEAN
Ireland
Netherlands
Switzerland
Singapore
Brazil
British VirginIslands
2007
2014
2015
Total FDI Inflows
Source: ASEAN Secretariat and UNCTAD.
In 2015, ASEAN was the fourth biggest recipient of FDI in the world, after USA (21.6%), Hong Kong (9.9%) and China (7.7%).

7ASEAN Economic Chartbook 2016
2 ASEAN Economy2.1 Annual GDP Growth
0.6
10.2
6.3 6.0 6.3
12.0
6.6
9.1
5.4
7.1 6.4
8.7
6.6
-0.6
7.1
4.8
7.6
5.0
7.1
5.8
2.02.8
6.7
4.3
6.9
4.7
-4
-2
0
2
4
6
8
10
12
14
Brun
ei Da
russ
alam
Camb
odia
Indon
esia
Lao P
DR
Malay
sia
Myan
mar
Philip
pines
Sing
apor
e
Thail
and
Viet
Nam
ASEA
N-6
CLMV
ASEA
N
2007 2014 2015In percent
Note: ASEAN-6 = Brunei Darussalam, Indonesia, Malaysia, Philippines, Singapore, Thailand; CLMV = Cambodia, Lao PDR, Myanmar, Viet Nam.Source: ASEAN Secretariat.
The region’s GDP grew at 4.7% in 2015, lower by 2.1 percentage points from 2007. GDP growth in CLMV remained higher than in ASEAN-6 during the same period.

8 ASEAN Economic Chartbook 2016
ASEAN Economy 2 GDP per capita, at current price 2.2
30,942
1,1983,357
1,831
9,657
1,246 2,850
52,744
5,7372,109
4,6321,741 3,867
0
10,000
20,000
30,000
40,000
50,000
60,000
Brun
eiDa
russ
alam
Camb
odia
Indon
esia
Lao P
DR
Malay
sia
Myan
mar
Philip
pines
Sing
apor
e
Thail
and
Viet
Nam
ASEA
N-6
CLMV
ASEA
N
2007 2014 2015In US dollars
Source: ASEAN Secretariat.
Member States’ GDP per capita varied widely. In 2015, GDP per capita in Singapore and Brunei Darussalam reached more than US$50,000 and US$30,000 respectively; while GDP per capita in Cambodia and Myanmar stood at US$1,198 and $1,246, respectively. Indonesia, Malaysia, Philippines and Thailand’s GDP per capita ranged from US$2,800 to US$9,600.

9ASEAN Economic Chartbook 2016
2 ASEAN Economy2.3 Consumer Price Index in ASEAN-6 (base year = 2005)
Brunei Darussalam
Indonesia
Malaysia
Philippines
SingaporeThailand
90
100
110
120
130
140
150
160
170
180
190
200
2005 2006 2007 2008 2009 2010 2011 2012 2013 2014 2015
Overall
Brunei Darussalam
Indonesia
Malaysia
Philippines
Singapore
Thailand
90100110120130140150160170180190200210220
2005 2006 2007 2008 2009 2010 2011 2012 2013 2014 2015
Food
Source: ASEAN Secretariat.
In 2015, overall prices in the ASEAN-6 grew between 1.4% and 6.4%, Increase in food prices was relatively higher in Philippines, Thailand, and Indonesia, ranging from 2.5% to 5.0% during the same year.
10 ASEAN Economic Chartbook 2016
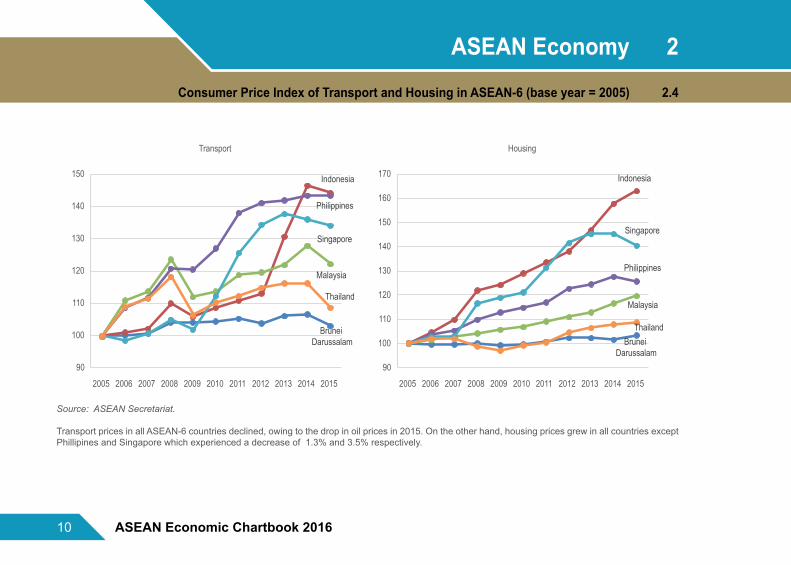
ASEAN Economy 2 Consumer Price Index of Transport and Housing in ASEAN-6 (base year = 2005) 2.4
Brunei Darussalam
Indonesia
Malaysia
Philippines
Singapore
Thailand
90
100
110
120
130
140
150
2005 2006 2007 2008 2009 2010 2011 2012 2013 2014 2015
Transport
Brunei Darussalam
Indonesia
Malaysia
Philippines
Singapore
Thailand
90
100
110
120
130
140
150
160
170
2005 2006 2007 2008 2009 2010 2011 2012 2013 2014 2015
Housing
Source: ASEAN Secretariat.
Transport prices in all ASEAN-6 countries declined, owing to the drop in oil prices in 2015. On the other hand, housing prices grew in all countries except Phillipines and Singapore which experienced a decrease of 1.3% and 3.5% respectively.

11ASEAN Economic Chartbook 2016
2 ASEAN Economy2.5 Currencies-to-US Dollar (period average)
8.8
0.4
28.4
1.0
20.2
14.2
3.4
8.8
5.3
2.6
-5
0
5
10
15
20
25
30
Brun
eiDa
russ
alam
Camb
odia
Indon
esia
Lao P
DR
Malay
sia
Myan
mar
Philip
pines
Sing
apor
e
Thail
and
Viet
Nam
2014 2015
.A positive (+) rate of change connotes currency depreciation while a negative (-) rate of change indicates currency appreciation
In percent change
Source: ASEAN Secretariat.
All ASEAN Member States’ currencies depreciated vis-à-vis the US dollar between 2014 and 2015. The Indonesian rupiah and Malaysian ringgit depreciated the most by 28.4% and 20.2%, respectively.

12 ASEAN Economic Chartbook 2016
ASEAN Economy 2 Currencies-to-US Dollar (period average) 2.6
1.4
3.9
1.4
0
1
2
3
4
Brun
eiDa
russ
alam
Malay
sia
Sing
apor
e
per US dollars
2007 2014 2015
45.9
34.2
0
5
10
15
20
25
30
35
40
45
50
Philip
pines
Thail
and
2007 2014 2015
4,059
13,458
8,113
1,136
21,679
0
5,000
10,000
15,000
20,000
25,000
Camb
odia
Indon
esia
Lao P
DR
Myan
mar
Viet
Nam
2007 2014 2015
Source: ASEAN Secretariat.
Between 2007 and 2015, the Indonesian rupiah depreciated the most vis-à-vis the US dollar to reach 13,458 per US dollar in 2015 compared to 9,164 in 2007, followed by Vietnamese dong (from 16,120 per US dollar to 21,679) and Malaysian ringgit (from 3.4 per US dollar to 3.9).
13ASEAN Economic Chartbook 2016
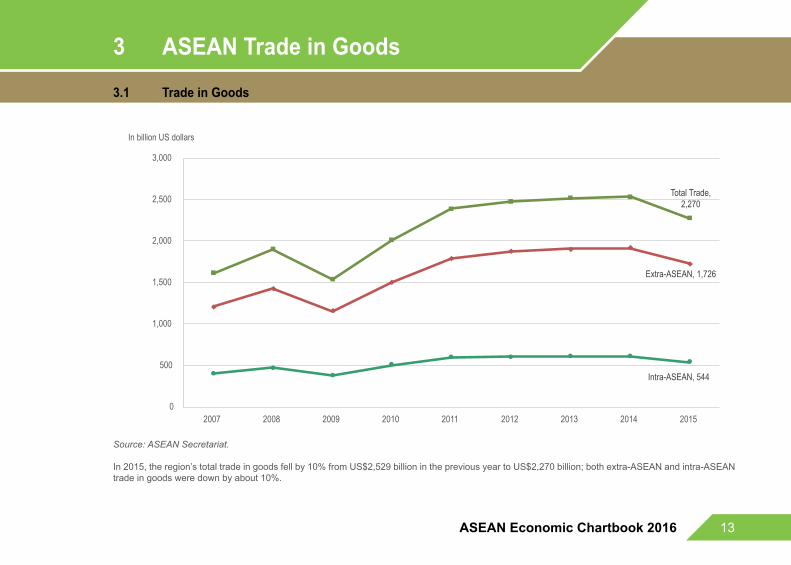
3 ASEAN Trade in Goods3.1 Trade in Goods
0
500
1,000
1,500
2,000
2,500
3,000
2007 2008 2009 2010 2011 2012 2013 2014 2015
In billion US dollars
Extra-ASEAN, 1,726
Intra-ASEAN, 544
Total Trade,2,270
Source: ASEAN Secretariat.
In 2015, the region’s total trade in goods fell by 10% from US$2,529 billion in the previous year to US$2,270 billion; both extra-ASEAN and intra-ASEAN trade in goods were down by about 10%.

14 ASEAN Economic Chartbook 2016
ASEAN Trade in Goods 3 Trade in Goods as Percent Share of GDP 3.2
0
20
40
60
80
100
120
140
2007 2008 2009 2010 2011 2012 2013 2014 2015
Total Trade,93.3
Extra-ASEAN, 71.0
Intra-ASEAN, 22.4
In percent
Source: ASEAN Secretariat.
In 2015, total trade in goods accounted for 93.3% of GDP; intra-ASEAN share to GDP remained relatively stable at 22.4%.

15ASEAN Economic Chartbook 2016
3 ASEAN Trade in Goods3.3 Intra- and Extra-ASEAN Trade in Goods
2007
Intra-ASEAN25.0%
Extra-ASEAN75.0%
2014
Extra-ASEAN75.9%
Intra-ASEAN24.1%
2015
Extra-ASEAN76.1%
Intra-ASEAN23.9%
In percent share
Source: ASEAN Secretariat.
In 2015, intra-ASEAN trade in goods remained stable at approximately 24% of the region’s total trade in goods.

16 ASEAN Economic Chartbook 2016
ASEAN Trade in Goods 3 ASEAN Member States Exports of Goods by Destination, 2015 3.4
25.8%
19.5%
9.3%
22.3%
71.2%
28.1%
37.5%
14.6%
32.3%
28.9%
11.1%
0 10 20 30 40 50 60 70 80 90 100
ASEAN
Brunei Darussalam
Cambodia
Indonesia
Lao PDR
Malaysia
Myanmar
Philippines
Singapore
Thailand
Viet Nam
In percent share
Intra-ASEAN
Extra-ASEAN
Source: ASEAN Secretariat.
Lao PDR exported most of its products within the region while Cambodia, Viet Nam, and Philippines shipped around 90% of their commodities outside the ASEAN.

17ASEAN Economic Chartbook 2016
3 ASEAN Trade in Goods3.5 ASEAN Member States Imports of Goods by Origin, 2015
21.9%
46.2%
33.6%
21.0%
56.1%
26.5%
41.6%
24.3%
21.5%
21.2%
14.4%
0 10 20 30 40 50 60 70 80 90 100
ASEAN
Brunei Darussalam
Cambodia
Indonesia
Lao PDR
Malaysia
Myanmar
Philippines
Singapore
Thailand
Viet Nam
In percent share
Intra-ASEAN
Extra-ASEAN
Source: ASEAN Secretariat.
Brunei Darussalam, Lao PDR and Myanmar purchased nearly 50% of their commodity items from within the region; while Viet Nam imported the least from the ASEAN countries.
18 ASEAN Economic Chartbook 2016
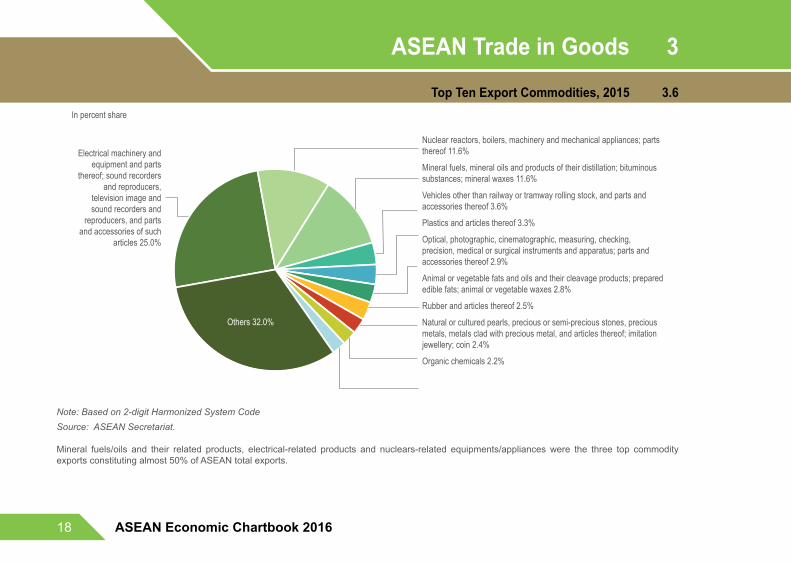
ASEAN Trade in Goods 3 Top Ten Export Commodities, 2015 3.6
In percent share
Electrical machinery and equipment and parts
thereof; sound recorders and reproducers,
television image and sound recorders and
reproducers, and parts and accessories of such
articles 25.0%
Nuclear reactors, boilers, machinery and mechanical appliances; parts thereof 11.6%
Mineral fuels, mineral oils and products of their distillation; bituminous substances; mineral waxes 11.6%
Vehicles other than railway or tramway rolling stock, and parts and accessories thereof 3.6%
Plastics and articles thereof 3.3%
Optical, photographic, cinematographic, measuring, checking, precision, medical or surgical instruments and apparatus; parts and accessories thereof 2.9%
Animal or vegetable fats and oils and their cleavage products; prepared edible fats; animal or vegetable waxes 2.8%
Rubber and articles thereof 2.5%
Natural or cultured pearls, precious or semi-precious stones, precious metals, metals clad with precious metal, and articles thereof; imitation jewellery; coin 2.4%
Organic chemicals 2.2%
Others 32.0%
Note: Based on 2-digit Harmonized System CodeSource: ASEAN Secretariat.
Mineral fuels/oils and their related products, electrical-related products and nuclears-related equipments/appliances were the three top commodity exports constituting almost 50% of ASEAN total exports.

19ASEAN Economic Chartbook 2016
3 ASEAN Trade in Goods3.7 Top Ten Import Commodities, 2015
Others29.4%
In percent share
Electrical machinery and equipment and parts
thereof; sound recorders and reproducers,
television image and sound recorders and
reproducers, and parts and accessories of such
articles 22.8%
Mineral fuels, mineral oils and products of their distillation; bituminous substances; mineral waxes 14.7%
Nuclear reactors, boilers, machinery and mechanical appliances; parts thereof 13.3%
Plastics and articles thereof 3.8%
Vehicles other than railway or tramway rolling stock, and parts and accessories thereof 3.6%
Iron and steel 3.2%
Optical, photographic, cinematographic, measuring, checking, precision, medical or surgical instruments and apparatus; parts and accessories thereof 2.5%
Natural or cultured pearls, precious or semi-precious stones, precious metals, metals clad with precious metal, and articles thereof; imitation jewellery; coin 2.4%
Articles of iron or steel 2.1%
Organic chemicals 2.0%
Note: Based on 2-digit Harmonized System CodeSource: ASEAN Secretariat.
Mineral fuels/oils and their related products, electrical-related products and nuclears-related equipments/appliances accounted for more than 50% of ASEAN imports.

20 ASEAN Economic Chartbook 2016
ASEAN Trade in Goods 3 Intra-ASEAN Top 5 Trade Commodities, 2015 3.8
Plastics and articles thereof 4.0%
Vehicles other than railway or tramway rolling stock, and parts and accessories thereof 4.5%
Nuclear reactors, boilers, machinery and mechanical appliances; parts thereof 11.0%
Mineral fuels, mineral oils and products of their distillation; bituminous substances; mineral waxes 22.2%
Others36.0%
ExportsIn percent share
Imports
Plastics and articles thereof 4.3%
Vehicles other than railway or tramway rolling stock, and parts and accessories thereof 5.0%
Nuclear reactors, boilers, machinery and mechanical appliances; parts thereof 12.9%
Mineral fuels, mineral oils and products of their distillation; bituminous substances; mineral waxes 19.5%
Electrical machinery and equipment and parts thereof; sound recorders and
reproducers, television image and sound recorders and reproducers, and parts and
accessories of such articles21.4%
Others36.9%
Electrical machinery and equipment and parts thereof; sound recorders and
reproducers, television image and sound recorders and reproducers, and parts and
accessories of such articles22.3%
Note: Based on 2-digit Harmonized System CodeSource: ASEAN Secretariat.
Electrical machinery and equipment and their related products were the major intra-ASEAN export and import commodity items, accounting for 21.4% and 22.3% of the total, respectively.

21ASEAN Economic Chartbook 2016
3 ASEAN Trade in Goods3.9 Extra-ASEAN Top 5 Trade Commodities, 2015
Plastics and articles thereof 3.7%
Iron and steel 3.9% Mineral fuels, mineral oils and products of their distillation; bituminous substances; mineral waxes 12.6%
Nuclear reactors, boilers, machinery and mechanical appliances; parts thereof 14.0%
Others42.8%
In percent shareImports
Optical, photographic, cinematographic, measuring, checking, precision, medical or surgical instruments and apparatus; parts and accessories thereof 3.2%
Animal or vegetable fats and oils and their cleavage products; prepared edible fats; animal or vegetable waxes 3.3%
Mineral fuels, mineral oils and products of their distillation; bituminous substances; mineral waxes 8.9%
Nuclear reactors, boilers, machinery and mechanical appliances; parts thereof 11.2%
Exports
Others47.1%
Electrical machinery and equipment and parts thereof; sound recorders and reproducers, television
image and sound recorders and reproducers, and parts and accessories of such articles
26.3%
Electrical machinery and equipment and parts thereof; sound recorders and reproducers, television image and
sound recorders and reproducers, and parts and accessories of such articles
23.0%
Note: Based on 2-digit Harmonized System CodeSource: ASEAN Secretariat.
The top ‘traded’ commodity item outside the region was electrical-related products (26.3%); while leading import commodities were electrical- related products (23.0%) and nuclear reactors, boilers, etc (14.0%).

22 ASEAN Economic Chartbook 2016
ASEAN Trade in Goods with 4 Dialogue Partners Total Trade in Goods 4.1
ChinaJapan
EU-28USA
Republic ofKorea Australia-
NewZealand
IndiaRussian
Federation Canada 2007 20
14 2015
171,089
345,416
173,056
238,291
187,307
227,583
178,189
212,330
61,209
122,347
47,771
60,031
37,243
58,484
5,401
13,385
9,496
11,714
In million US dollars
Source: ASEAN Secretariat.
In 2015, China remained as ASEAN’s top trading partner, with total trade in goods amounting to US$345 billion. While ASEAN trade with most partners declined, trade with Japan and EU-28 recorded positive growth at 4.0% and 8.6%, respectively.

23ASEAN Economic Chartbook 2016
4 ASEAN Trade in Goods with Dialogue Partners4.2 Total Trade in Goods
ANZ3.0%
Canada0.6%
China10.6%
EU -2811.6%
India2.3%
Japan10.7%
ROK3.8%
Russia0.3%
USA11.1%
Others45.9%
2007
In percent share
ANZ3.2%
Canada0.5%
China14.5%
EU -288.3%
India2.7%
Japan9.1%
ROK5.2%Russia
0.9%
USA8.4%
Others47.3%
2014
ANZ2.6%
Canada0.5%
China15.2%
EU -2810.0%
India2.6%
Japan10.5%
ROK5.4%Russia
0.6%
USA9.4%
Others43.2%
2015
Note: ANZ= Australia-New Zealand; ROK= Republic of Korea; Russia= Russian Federation.Source: ASEAN Secretariat.
China, EU-28, Japan and USA’s combined shares to ASEAN’s total trade in goods grew from 40.3% in 2014 to 45.1% in 2015.

24 ASEAN Economic Chartbook 2016
ASEAN Trade in Goods with 4 Dialogue Partners Exports of Goods 4.3
ANZ3.6%
Canada0.6%
China9.1%
EU -2812.6%
India2.9%
Japan9.9%
ROK3.4%Russia
0.2%
USA12.3%
Others45.4%
2007
In percent share
ANZ4.0%
Canada0.6%
China11.6%
EU -288.0%
India3.4%
Japan9.3%
ROK4.0%Russia
0.4%
USA9.5%
Others49.2%
2014
ANZ3.2%
Canada0.6%
China11.3%
EU -2810.8%
India3.3%
Japan9.6%
ROK3.9%Russia
0.3%
USA10.9%
Others46.0%
2015
Note: ANZ= Australia-New Zealand; ROK= Republic of Korea; Russia= Russian Federation.Source: ASEAN Secretariat.
In 2015, China was the top export destination of ASEAN, accounting for 11.3% of the region’s total exports, followed by USA (10.9%), EU-28 (10.8%), and Japan (9.6%).
25ASEAN Economic Chartbook 2016
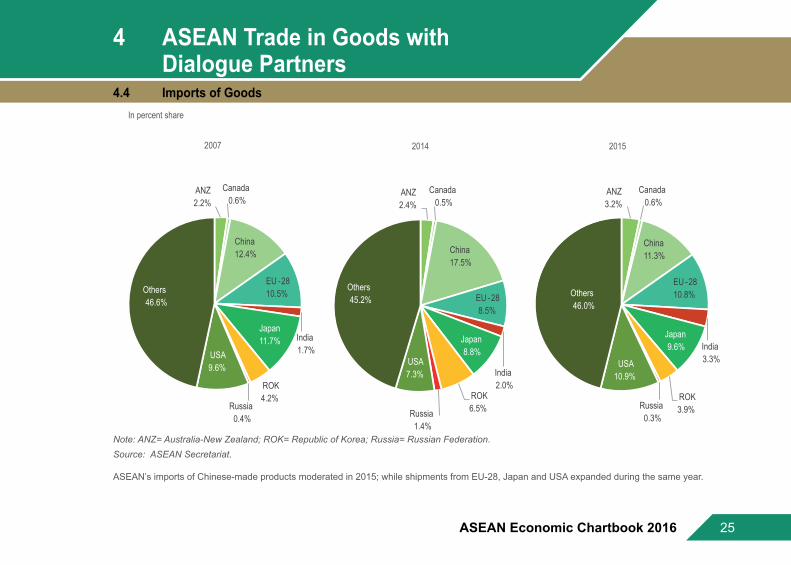
4 ASEAN Trade in Goods with Dialogue Partners4.4 Imports of Goods
ANZ2.2%
Canada0.6%
China12.4%
EU -2810.5%
India1.7%
Japan11.7%
ROK4.2%
Russia0.4%
USA9.6%
Others46.6%
2007
In percent share
ANZ2.4%
Canada0.5%
China17.5%
EU -288.5%
India2.0%
Japan8.8%
ROK6.5%Russia
1.4%
USA7.3%
Others45.2%
2014
ANZ3.2%
Canada0.6%
China11.3%
EU -2810.8%
India3.3%
Japan9.6%
ROK3.9%Russia
0.3%
USA10.9%
Others46.0%
2015
Note: ANZ= Australia-New Zealand; ROK= Republic of Korea; Russia= Russian Federation.Source: ASEAN Secretariat.
ASEAN’s imports of Chinese-made products moderated in 2015; while shipments from EU-28, Japan and USA expanded during the same year.

26 ASEAN Economic Chartbook 2016
ASEAN Trade in Goods with 4 Dialogue Partners Trade in Goods Balance 4.5
15,732
2,139
-77,591
27,47919,573
-10,406
-30,507
-5,407
45,993
-80,000
-60,000
-40,000
-20,000
0
20,000
40,000
60,000
ANZ Canada China EU-28 India Japan Republic ofKorea
RussianFederation
USA
2007 2014 2015
In million US dollars
Note: A positive value indicates trade surplus; the region is a net exporter.Source: ASEAN Secretariat.
In 2015, among its dialogue partners, ASEAN registered trade surpluses with Australia, New Zealand, Canada, EU-28, India, and USA; while trade deficitswererecordedwithChina,Korea,JapanandRussia.

27ASEAN Economic Chartbook 2016
4 ASEAN Trade in Goods with Dialogue Partners4.6 Top 5 Traded Commodities with Australia-New Zealand, 2015
Articles of iron or steel 7.8%
Electrical machinery and equipment and parts thereof; sound recorders and reproducers, television image and sound recorders and reproducers, and parts and accessories of such articles 8.8%
Vehicles other than railway or tramway rolling stock, and parts and accessories thereof 9.0%
Nuclear reactors, boilers, machinery and mechanical appliances; parts thereof 13.7%
ExportsIn percent share
Others54.4%
Imports
Natural or cultured pearls, precious or semi-precious stones, precious metals, metals clad with precious metal, and articles thereof; imitation jewellery; coin 4.9%
Nickel and articles thereof 5.3%
Cereals 8.3% Dairy produce; birds' eggs; natural honey; edible products of animal origin, not elsewhere specified or included 10.5%
Mineral fuels, mineral oils and products of their distillation; bituminous substances; mineral waxes 16.6%
Others37.3%
Mineral fuels, mineral oils and products of their distillation; bituminous substances; mineral waxes
23.4%
Note: Based on 2-digit Harmonized System code.Source: ASEAN Secretariat.
Mineral fuels, oils and related products were the major traded items for both exports and imports, with Australia and New Zealand.

28 ASEAN Economic Chartbook 2016
ASEAN Trade in Goods with 4 Dialogue Partners Top 5 Traded Commodities with Canada, 2015 4.7
ExportsIn percent share
Imports
Footwear, gaiters and the like; parts of such articles 4.7%
Articles of apparel and clothing accessories, not knitted or crocheted 6.3%
Nuclear reactors, boilers, machinery and mechanical appliances; parts thereof 7.4%
Articles of apparel and clothing accessories, knitted or crocheted 13.3%
Electrical machinery and equipment and parts thereof; sound recorders and reproducers, television image and sound recorders and reproducers, and parts and accessories of such articles 7.1%
Pulp of wood or of other fibrous cellulosic material; recovered (waste and scrap) paper or paperboard 7.6%
Cereals 13.3% Nuclear reactors, boilers, machinery and mechanical appliances; parts thereof 13.9%
Electrical machinery and equipment and parts thereof; sound recorders and reproducers, television image and sound
recorders and reproducers, and parts and accessories of such articles21.3%
Others46.9%
Others43.7%
Fertilisers14.4%
Note: Based on 2-digit Harmonized System code.Source: ASEAN Secretariat.
Exports to Canada were mainly electrical machinery/equipment and articles of apparel and clothing accessories. Imports consisted of cereals, fertilizers and nuclear reactors, boilers and mechanical appliances.
29ASEAN Economic Chartbook 2016
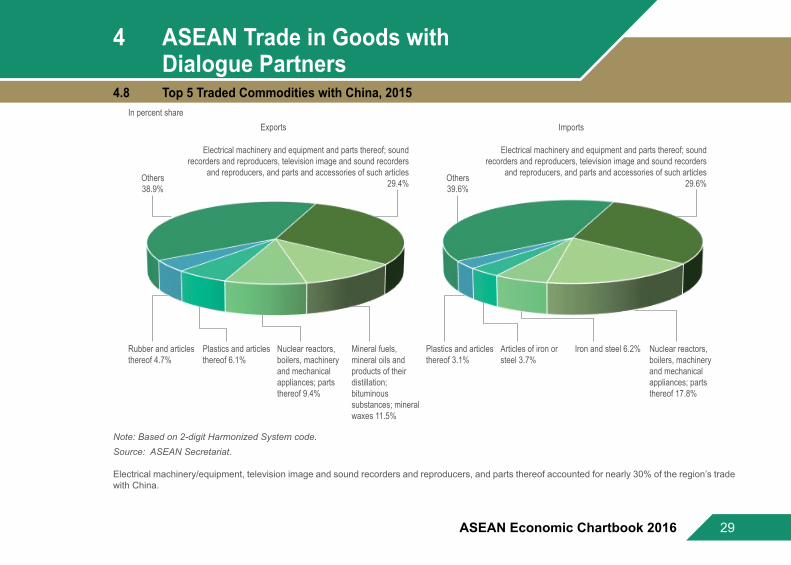
4 ASEAN Trade in Goods with Dialogue Partners4.8 Top 5 Traded Commodities with China, 2015
Others38.9%
ExportsIn percent share
Others39.6%
Imports
Rubber and articles thereof 4.7%
Plastics and articles thereof 6.1%
Nuclear reactors, boilers, machinery and mechanical appliances; parts thereof 9.4%
Mineral fuels, mineral oils and products of their distillation; bituminous substances; mineral waxes 11.5%
Plastics and articles thereof 3.1%
Articles of iron or steel 3.7%
Iron and steel 6.2% Nuclear reactors, boilers, machinery and mechanical appliances; parts thereof 17.8%
Electrical machinery and equipment and parts thereof; sound recorders and reproducers, television image and sound recorders
and reproducers, and parts and accessories of such articles 29.4%
Electrical machinery and equipment and parts thereof; sound recorders and reproducers, television image and sound recorders
and reproducers, and parts and accessories of such articles 29.6%
Note: Based on 2-digit Harmonized System code.Source: ASEAN Secretariat.
Electrical machinery/equipment, television image and sound recorders and reproducers, and parts thereof accounted for nearly 30% of the region’s trade with China.

30 ASEAN Economic Chartbook 2016
ASEAN Trade in Goods with 4 Dialogue Partners Top 5 Traded Commodities with EU-28, 2015 4.9
ExportsIn percent share
Others48.6%
Imports
Optical, photographic, cinematographic, measuring, checking, precision, medical or surgical instruments and apparatus; parts and accessories thereof 4.0%
Organic chemicals 4.3%
Footwear, gaiters and the like; parts of such articles 5.0%
Nuclear reactors, boilers, machinery and mechanical appliances; parts thereof 12.8%
Vehicles other than railway or tramway rolling stock, and parts and accessories thereof 5.0%
Pharmaceutical products 5.1%
Mineral fuels, mineral oils and products of their distillation; bituminous substances; mineral waxes 5.1%
Electrical machinery and equipment and parts thereof; sound recorders and reproducers, television image and sound recorders and reproducers, and parts and accessories of such articles 16.1%
Others46.2%
Electrical machinery and equipment and parts thereof; sound recorders and reproducers, television image and sound recorders
and reproducers, and parts and accessories of such articles 27.7%
Nuclear reactors, boilers, machinery and mechanical appliances; parts thereof
20.2%
Note: Based on 2-digit Harmonized System code.Source: ASEAN Secretariat.
Trade with EU-28 consisted largely of electrical machinery/equipment, television image and sound recorders and reproducers, and parts as well as nuclear reactors, boilers and mechanical appliances.

31ASEAN Economic Chartbook 2016
4 ASEAN Trade in Goods with Dialogue Partners4.10 Top 5 Traded Commodities with India, 2015
ExportsIn percent share
Imports
Organic chemicals 5.1%
Nuclear reactors, boilers, machinery and mechanical appliances; parts thereof 10.5%
Electrical machinery and equipment and parts thereof; sound recorders and reproducers, television image and sound recorders and reproducers, and parts and accessories of such articles 12.6%
Animal or vegetable fats and oils and their cleavage products; prepared edible fats; animal or vegetable waxes 14.1%
Natural or cultured pearls, precious or semi-precious stones, precious metals, metals clad with precious metal, and articles thereof; imitation jewellery; coin 4.5%
Vehicles other than railway or tramway rolling stock, and parts and accessories thereof 4.8%
Organic chemicals 6.2%
Nuclear reactors, boilers, machinery and mechanical appliances; parts thereof 7.6%
Others38.1%
Mineral fuels, mineral oils and products of their distillation; bituminous substances; mineral waxes
19.7% Others56.4%
Mineral fuels, mineral oils and products of their distillation; bituminous substances; mineral waxes
20.5%
Note: Based on 2-digit Harmonized System code.Source: ASEAN Secretariat.
The region’s leading export items to India mostly consisted of mineral fuels, oils and related products including animal or vegetable fats and oils and their cleavage products; prepared edible fats; animal or vegetable waxes. Imported goods were mainly mineral fuels, mineral oils and products of their distillation; bituminous substances; mineral waxes.

32 ASEAN Economic Chartbook 2016
ASEAN Trade in Goods with 4 Dialogue Partners Top 5 Traded Commodities with Japan, 2015 4.11
Wood and articles of wood; wood charcoal 4.6%
Vehicles other than railway or tramway rolling stock, and parts and accessories thereof 5.7%
Nuclear reactors, boilers, machinery and mechanical appliances; parts thereof 9.8%
Mineral fuels, mineral oils and products of their distillation; bituminous substances; mineral waxes 16.5%
ExportsIn percent share
Imports
Plastics and articles thereof 5.0%
Iron and steel 7.7% Vehicles other than railway or tramway rolling stock, and parts and accessories thereof 9.8%
Electrical machinery and equipment and parts thereof; sound recorders and reproducers, television image and sound recorders and reproducers, and parts and accessories of such articles 19.4%
Nuclear reactors, boilers, machinery and mechanical appliances; parts thereof
20.8%Others37.2%
Others41.9%
Electrical machinery and equipment and parts thereof; sound recorders and reproducers, television image and sound recorders
and reproducers, and parts and accessories of such articles21.5%
Note: Based on 2-digit Harmonized System code.Source: ASEAN Secretariat.
Electrical machinery and equipment and parts thereof; sound recorders and reproducers, television image and sound recorders and reproducers, and parts and accessories of such articles together with nuclear reactors, boilers, machinery and mechanical appliances; parts and mineral fuels, oils and related products comprised the region’s most traded commodities with Japan.

33ASEAN Economic Chartbook 2016
4 ASEAN Trade in Goods with Dialogue Partners4.12 Top 5 Traded Commodities with Republic of Korea, 2015
Others38.0%
ExportsIn percent share
Others28.6%
Imports
Optical, photographic, cinematographic, measuring, checking, precision, medical or surgical instruments and apparatus; parts and accessories thereof 2.8%
Articles of apparel and clothing accessories, not knitted or crocheted 4.0%
Nuclear reactors, boilers, machinery and mechanical appliances; parts thereof 8.4%
Mineral fuels, mineral oils and products of their distillation; bituminous substances; mineral waxes 18.0%
Iron and steel 5.0%
Plastics and articles thereof 5.4%
Nuclear reactors, boilers, machinery and mechanical appliances; parts thereof 9.3%
Mineral fuels, mineral oils and products of their distillation; bituminous substances; mineral waxes 14.5%
Electrical machinery and equipment and parts thereof; sound recorders and reproducers, television image and sound recorders and reproducers, and
parts and accessories of such articles28.8%
Electrical machinery and equipment and parts thereof; sound recorders and reproducers, television image and sound recorders and reproducers, and
parts and accessories of such articles37.1%
Note: Based on 2-digit Harmonized System code.Source: ASEAN Secretariat.
Electrical machinery and equipment and parts thereof; sound recorders and reproducers, television image and sound recorders and reproducers, and parts and accessories of such articles and mineral fuels, oils and related products accounted for nearly 50% of the region’s trade with the Republic of Korea.

34 ASEAN Economic Chartbook 2016
ASEAN Trade in Goods with 4 Dialogue Partners Top 5 Traded Commodities with Russian Federation, 2015 4.13
Others36.6%
ExportsIn percent share
Imports
Rubber and articles thereof 3.6%
Coffee, tea, maté and spices 5.2%
Nuclear reactors, boilers, machinery and mechanical appliances; parts thereof 13.0%
Animal or vegetable fats and oils and their cleavage products; prepared edible fats; animal or vegetable waxes 14.2%
Others 9.0% Aluminium and articles thereof 1.6%
Nickel and articles thereof 2.9%
Iron and steel 6.1%
Fertilisers 7.8%
Electrical machinery and equipment and parts thereof; sound recorders and reproducers, television image and sound recorders
and reproducers, and parts and accessories of such articles 27.4%
Mineral fuels, mineral oils and products of their distillation; bituminous substances; mineral waxes
72.5%
Note: Based on 2-digit Harmonized System code.Source: ASEAN Secretariat.
The region’s chief export products to Russian Federation were electrical machinery/equipment, television image and sound recorders and reproducers, and parts thereof. On the other hand, mineral fuels, oils and related products accounted for three-fourths of ASEAN’s imported goods from the Russian Federation.

35ASEAN Economic Chartbook 2016
4 ASEAN Trade in Goods with Dialogue Partners4.14 Top 5 Traded Commodities with USA, 2015
ExportsIn percent share
Imports
Optical, photographic, cinematographic, measuring, checking, precision, medical or surgical instruments and apparatus; parts and accessories thereof 4.4%
Articles of apparel and clothing accessories, not knitted or crocheted 5.8%
Articles of apparel and clothing accessories, knitted or crocheted 8.9%
Nuclear reactors, boilers, machinery and mechanical appliances; parts thereof 16.8%
Plastics and articles thereof 3.4%
Optical, photographic, cinematographic, measuring, checking, precision, medical or surgical instruments and apparatus; parts and accessories thereof 6.4%
Aircraft, spacecraft, and parts thereof 11.8%
Nuclear reactors, boilers, machinery and mechanical appliances; parts thereof 18.8%
Electrical machinery and equipment and parts thereof; sound recorders and reproducers, television image and sound recorders
and reproducers, and parts and accessories of such articles22.8%
Electrical machinery and equipment and parts thereof; sound recorders and reproducers, television image and sound recorders
and reproducers, and parts and accessories of such articles 24.5%
Others39.7%
Others36.8%
Note: Based on 2-digit Harmonized System code.Source: ASEAN Secretariat.
Electrical machinery/equipment, television image and sound recorders and reproducers, and parts together with nuclear reactors, boilers, machinery and mechanical appliances and parts made up more than 40% of ASEAN’s trade with USA.

36 ASEAN Economic Chartbook 2016
ASEAN Trade in Services 5 Trade in Services 5.1
-50
0
50
100
150
200
250
300
350
2007 2008 2009 2010 2011 2012 2013 2014 2015
In billion US dollars
Total Exports 12.6%
Total Exports 12.6%
Total Imports 13.8% Total Imports
12.8%
0
2
4
6
8
10
12
14
16
18
20
2007 2008 2009 2010 2011 2012 2013 2014 2015
Total Import,312
Total Export,306
In percent share of GDP
Note: Based on IMF Balance of Payments Manual, 6th Edition.Source: ASEAN Secretariat.
ASEAN trade in services grew significantly between2007-2015period,with total imports andexports reachingUS$312billion andUS$306billionrespectively, both accounting for approximately 13% of the region’s GDP in 2015. ASEAN has always been a net importer of services.

37ASEAN Economic Chartbook 2016
5 ASEAN Trade in Services 5.2 Exports of Services by Broad Headings
26.4%
24.3%
22.9%
21.3%
22.5%
21.7%
31.8%
33.4%
34.6%
35.4%
34.2%
35.3%
21.7%
21.4%
22.7%
23.3%
23.5%
23.1%
0 20 40 60 80 100
2010
2011
2012
2013
2014
2015
In percent share
Manufacturing services on physical inputsowned by others
Maintenance and repair services n.i.e.
Transport
Travel
Construction
Insurance and pension services
Financial services
Charges for the use of intellectual propertyn.i.e
Telecommunications, computer, andinformation services
Other business services
Personal, cultural, and recreational services
Government goods and services, n.i.e.
Note: Based on IMF Balance of Payments Manual, 6th Edition.Source: ASEAN Secretariat.
The combined shares of Travel, Transportation and Other business services continued to account for 80% of ASEAN’s exports of services.
38 ASEAN Economic Chartbook 2016
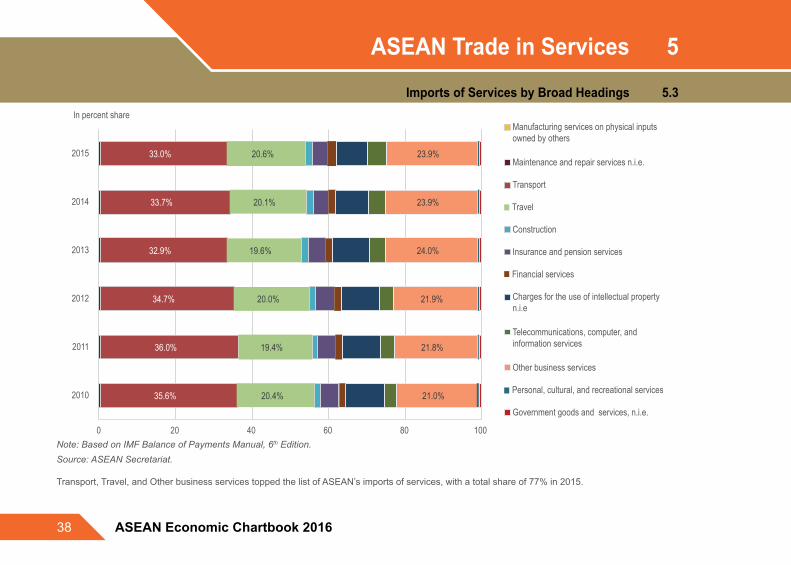
ASEAN Trade in Services 5 Imports of Services by Broad Headings 5.3
35.6%
36.0%
34.7%
32.9%
33.7%
33.0%
20.4%
19.4%
20.0%
19.6%
20.1%
20.6%
21.0%
21.8%
21.9%
24.0%
23.9%
23.9%
0 20 40 60 80 100
2010
2011
2012
2013
2014
2015
In percent shareManufacturing services on physical inputsowned by others
Maintenance and repair services n.i.e.
Transport
Travel
Construction
Insurance and pension services
Financial services
Charges for the use of intellectual propertyn.i.e
Telecommunications, computer, andinformation services
Other business services
Personal, cultural, and recreational services
Government goods and services, n.i.e.
Note: Based on IMF Balance of Payments Manual, 6th Edition.Source: ASEAN Secretariat.
Transport, Travel, and Other business services topped the list of ASEAN’s imports of services, with a total share of 77% in 2015.

39ASEAN Economic Chartbook 2016
5 ASEAN Trade in Services 5.4 Intra-ASEAN Exports of Services by Broad Headings
16.9%
16.7%
16.4%
15.6%
15.0%
16.0%
54.3%
54.4%
52.8%
53.4%
50.5%
47.8%
14.4%
15.1%
16.0%
16.0%
17.8%
17.7%
0 20 40 60 80 100
2010
2011
2012
2013
2014
2015
In percent share
Manufacturing services on physical inputsowned by others
Maintenance and repair services n.i.e.
Transport
Travel
Construction
Insurance and pension services
Financial services
Charges for the use of intellectual propertyn.i.e
Telecommunications, computer, andinformation services
Other business services
Personal, cultural, and recreational services
Government goods and services, n.i.e.
Note: Based on IMF Balance of Payments Manual, 6th Edition.Source: ASEAN Secretariat.
In 2015, Travel services along with Transport and Other business services accounted for more than 80% of intra-ASEAN’s exports of services.

40 ASEAN Economic Chartbook 2016
ASEAN Trade in Services 5 Intra-ASEAN Imports of Services by Broad Headings 5.5
29.7%
29.2%
26.6%
24.5%
25.8%
24.7%
40.4%
40.1%
43.1%
42.9%
41.9%
41.1%
17.3%
18.1%
17.1%
18.2%
18.5%
19.3%
0 20 40 60 80 100
2010
2011
2012
2013
2014
2015
In percent share
Manufacturing services on physical inputsowned by others
Maintenance and repair services n.i.e.
Transport
Travel
Construction
Insurance and pension services
Financial services
Charges for the use of intellectual propertyn.i.e
Telecommunications, computer, andinformation services
Other business services
Personal, cultural, and recreational services
Government goods and services, n.i.e.
Note: Based on IMF Balance of Payments Manual, 6th Edition.Source: ASEAN Secretariat.
Transport, Travel, and Other business services comprised 85% of intra-ASEAN’s imports of services in 2015.

41ASEAN Economic Chartbook 2016
6 Investments in ASEAN6.1 NetInflowsofFDIbyASEANMemberStates(ASEAN-6)
171
16,917
11,290
5,724
61,285
8,027
0
10,000
20,000
30,000
40,000
50,000
60,000
70,000
80,000
Brunei Darussalam Indonesia Malaysia Philippines Singapore Thailand
2007 2014 2015
In miilion US dollars
Note: ASEAN-6 = Brunei Darussalam, Indonesia, Malaysia, Philippines, Singapore, Thailand.Source: ASEAN Secretariat.
SingaporeremainedasthehighestrecipientofFDIamongtheASEAN-6countries,withinflowsamountingtoUS$61billionin2015.

42 ASEAN Economic Chartbook 2016
Investments in ASEAN 6 NetInflowsofFDIbyASEANMemberStates(CLMV) 6.2
0
2,000
4,000
6,000
8,000
10,000
12,000
14,000
Cambodia Lao PDR Myanmar Viet Nam
2007 2014 2015
In million US dollars
1,7011,079
2,824
11,800
Note: CLMV = Cambodia, Lao PDR, Myanmar, Viet Nam. Source: ASEAN Secretariat.
In2015,FDIinflowsinVietNamgrewby28%,reachingUS$11.8billion.Meanwhile,investmentsinMyanmarexpandedthreefoldatUS$2.8billionfromUS$946 million in 2014, posting the highest growth among all ASEAN Member States.

43ASEAN Economic Chartbook 2016
6 Investments in ASEAN6.3 NetinflowsofFDI,ExtraandIntra-ASEAN
8,435
22,232
78,886
120,819
0
20,000
40,000
60,000
80,000
100,000
120,000
140,000
2007 2008 2009 2010 2011 2012 2013 2014 2015
Intra-ASEAN Extra-ASEAN TotalIn million US dollars
Note: For 2012-2013, Lao PDR’s data on ‘by source country’ are not yet available; intra-/extra-ASEAN breakdowns for 2012-2013 were estimated by the ASEAN Secretariat.Source: ASEAN Secretariat.
FDI inflows inASEANdeclined by 7% fromUS$130billion in 2014 toUS$121billion in 2015.However, intra-ASEAN investment remained stableaccountingfor18.4%ofASEANnetFDIinflowscomparedto17.0%in2014.
44 ASEAN Economic Chartbook 2016
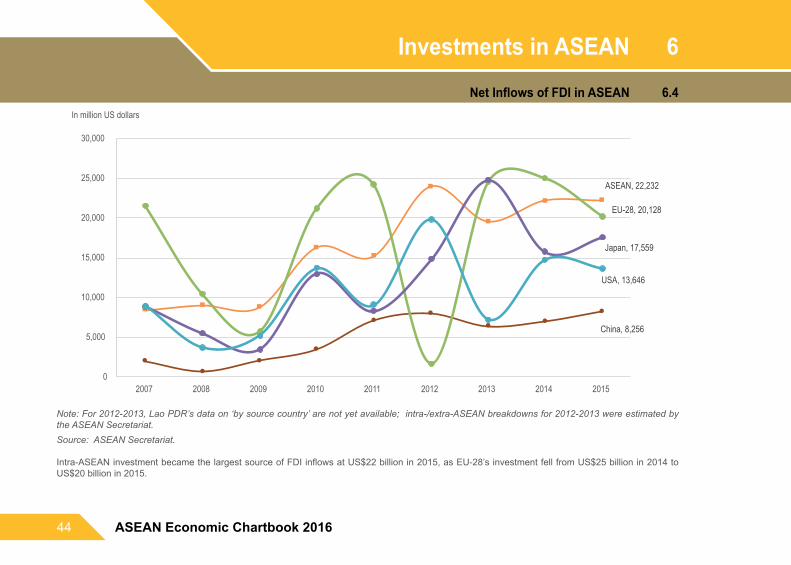
Investments in ASEAN 6 NetInflowsofFDIinASEAN 6.4
China, 8,256
EU-28, 20,128
Japan, 17,559
USA, 13,646
0
5,000
10,000
15,000
20,000
25,000
30,000
2007 2008 2009 2010 2011 2012 2013 2014 2015
In million US dollars
ASEAN, 22,232
Note: For 2012-2013, Lao PDR’s data on ‘by source country’ are not yet available; intra-/extra-ASEAN breakdowns for 2012-2013 were estimated by the ASEAN Secretariat.Source: ASEAN Secretariat.
Intra-ASEANinvestmentbecamethelargestsourceofFDIinflowsatUS$22billionin2015,asEU-28’sinvestmentfellfromUS$25billionin2014toUS$20 billion in 2015.
45ASEAN Economic Chartbook 2016
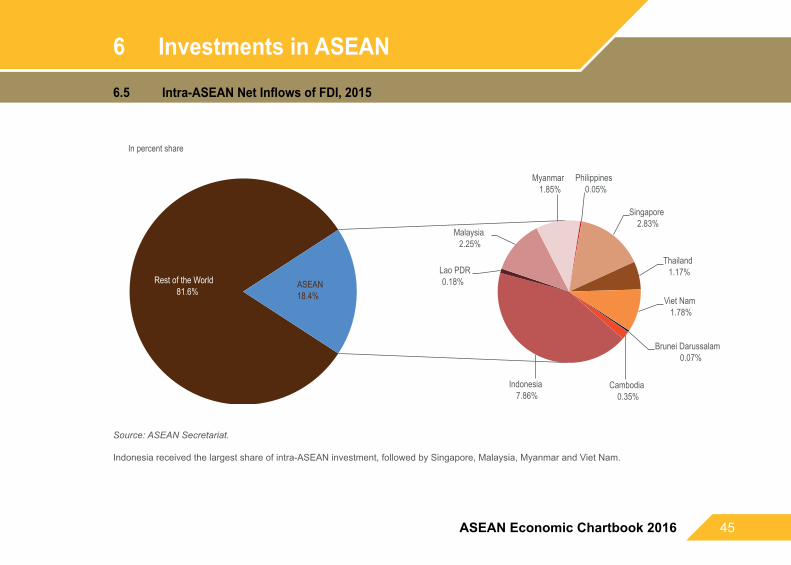
6 Investments in ASEAN6.5 Intra-ASEANNetInflowsofFDI,2015
Rest of the World81.6%
Brunei Darussalam0.07%
Cambodia0.35%
Indonesia7.86%
Lao PDR0.18%
Malaysia2.25%
Myanmar1.85%
Philippines0.05%
Singapore2.83%
Thailand1.17%
Viet Nam1.78%
ASEAN18.4%
In percent share
Source: ASEAN Secretariat.
Indonesia received the largest share of intra-ASEAN investment, followed by Singapore, Malaysia, Myanmar and Viet Nam.

46 ASEAN Economic Chartbook 2016
Investments in ASEAN 6 NetInflowsofFDIbyComponent 6.6
37,08432,077 29,555
63,848
49,526
62,663 65,558
89,55796,974
-20,000
0
20,000
40,000
60,000
80,000
100,000
2007 2008 2009 2010 2011 2012 2013 2014 2015
Equity Loans/Debt Instruments Reinvested Earning
In million US dollars
Note: No data available on net inflows of FDI by component for Lao PDR (2007-2015) and Myanmar (2009-2015).Source: ASEAN Secretariat.
In2015,equitycapitalremainedthemainsourceoffundingforFDIinASEAN.Incontrast,theuseofintracompanyloansdeclinedsignificantly,fromUS$18.2 billion in 2014 to US$1.3 billion in 2015.

47ASEAN Economic Chartbook 2016
6 Investments in ASEAN6.7 NetInflowsofFDIbyActivity,2015
In percent share
Financial and Insurance activities32.5%
Manufacturing24.1%
Information and communication1.5%
Accomodation and food service activities
0.4%
Transportation and storage2.7%
Wholesale and retail trade; repair of motor vehicles and motor cycles
9.2%
Construction0.8%
Water supply; sewerage, waste management and remediation
activities0.0%
Electricity, gas, steam and air conditioning supply
1.6%
Real estate activities7.6%Professional, scientific and technical activities0.2%Administrative and support service activities0.2%Public administration and defense; compulsory social security0.0%Education0.0%Human health and social work activities0.1%Arts, entertainment and recreation0.0%Other services activities5.1%Others/Unspecified3.2%Agriculture, forestry, and fishing 4.1%Mining and quarrying6.4%
Source: ASEAN Secretariat.
Investmentinfinancialandinsuranceactivitiescomprised32.5%oftheregion’stotalFDIinflows,followedbymanufacturing(24.1%),wholesaleandretailtrade(9.2%).Servicessectoraccountfor62.1%ofASEAN’sinvestmentinflows.

48 ASEAN Economic Chartbook 2016
Other Developments in the ASEAN 7 Economic Community Internet Subscribers/Users and Cellular Phone Density (per 100 persons) 7.1
Internet Subscribers/Users per 100 persons
68.8
19.0
22.0
18.2
71.1
21.8
40.7
82.1
39.3
52.7
0 20 40 60 80 100
BruneiDarussalam
Cambodia
Indonesia
Lao PDR
Malaysia
Myanmar
Philippines
Singapore
Thailand
Viet Nam
2015
2014
2007
Cellular Phones per 100 persons
108.1
133.0
132.3
53.1
143.9
76.7
118.1
146.1
125.8
130.6
0 50 100 150 200
BruneiDarussalam
Cambodia
Indonesia
Lao PDR
Malaysia
Myanmar
Philippines
Singapore
Thailand
Viet Nam
2015
2014
2007
Source: ASEAN Secretariat.
In 2015, the number of internet subscribers/users continued to increase in all ASEAN Member States. During the same period, the number of cellular phone users increased considerably in Myanmar, Philippines and Indonesia. There were more than 100 cellular phones per 100 persons in all ASEAN countries except for Lao PDR and Myanmar, indicating that 1 person owns more than 1 unit of cellular phone in these countries.

49ASEAN Economic Chartbook 2016
7 Other Developments in the ASEAN Economic Community 7.2 Ratio of Paved Road to Total Road Length
Brunei Darussalam
Cambodia
Indonesia
Lao PDR
Malaysia
Myanmar
Philippines
Singapore
Thailand
Viet Nam
0
10
20
30
40
50
60
70
80
90
100
2010 2011 2012 2013 2014 2015
In percent
Source: ASEAN Secretariat.
There is a marked improvement in Myanmar’s road condition as shown by the increase in the ratio of paved road to total road length from 24% in 2013 to 43% and in the Philippines during 2015.

50 ASEAN Economic Chartbook 2016
Other Developments in the ASEAN 7 Economic Community VisitorArrivals 7.3
218 4,77510,407
4,627
25,721
4,681 5,361
15,231
29,881
7,944
108,846
0
20,000
40,000
60,000
80,000
100,000
120,000
BruneiDarussalam
Cambodia Indonesia Lao PDR Malaysia Myanmar Philippines Singapore Thailand Viet Nam ASEAN
2007 2014 2015
In thousand persons
Note: In 2014, Brunei Darussalam’s data covered visitors arrivals by land and air transport. Source: ASEAN Secretariat.
Tourist arrivals in ASEAN grew by 3.6 percent, reaching nearly 109 million in 2015 from 105 million in 2014. Thailand was the favorite tourist destination in the region, with a share of 27% of the total visitor arrivals, followed closely by Malaysia (24%) and then Singapore (14%).

51ASEAN Economic Chartbook 2016
ASEAN
@ASEAN
www.asean.org
ASEANA COMMUNITY
OFOPPORTUNITIES
one visionone identity
one community
CHARTBOOK
2016ASEAN ECONOMIC COMMUNITY


