27
4Q16 Results Presentation| March 2017 Larrainvial 11th Annual Andean Conference Santiago
Asesores Financieros
4Q16 Results Presentation| March 2017
Larrainvial 11th Annual Andean Conference Santiago

Agenda
▪Resultados December-16
02Main
Consolidated
figures
03SK’s subsidiaries
Highlights
04Financial
Exhibits
01General Background

▪3
Company Overview
Source: Company
Note: The percents correspond to the ownership of Sigdo Koppers over its subsidiaries, as of December 2016
(1) Net Profit of 2011 have an extraordinary effect of US$157 millions mainly due to the sale of CTI
(2) Net Profit of 2013 have an extraordinary loss of US$29.2 millions mainly due to the sale of Sigdopack
Corporate Presentation |Sigdo Koppers .
Sales(US$ millions)
Consolidated EBITDA(US$ millions)
Net Profit (US$ millions)
Sigdo Koppers, Chilean conglomerate founded in
1960. One of the most dynamic and important
industrial groups in Chile. Our commitment is a
long term investment industrial approach, aiming to
be a comprehensive supplier of products and
services for the mining and industrial operations
worldwide.
286(1)
121(2)
SK ComercialIngeniería y
ConstrucciónEnaex Magotteaux
60,43% 60,72% 97,75% 86,82%
Enaex Magotteaux SK Comercial
SKBergéPuerto
VentanasCHBBSK Godelius
50,01% 58,19% 74,59% 40,00%

▪4
Others; 3,76%
Pension funds & Insurance companies; 8,43%
Stock Brokers; 8,02%
Mutual funds and other institutional investors; 4,37%
Corporate Governance
Ownership StructureBoard of Directors
Source: Santiago Stock Exchange. (1) Last 12 month
Corporate PresentationSigdo Koppers .
▪ Daily Average vol. traded (1): US$0.3 millions
▪ Market Cap: US$1.4 billions (As of March 1st 2017)
1. Juan Eduardo
Errázuriz Ossa
Chairman
2. Naoshi Matsumoto
Takahashi
Vicepresident
3. Horacio Pavez Aro
Director
4. Juan Andrés Fontaine
Talavera
Director
5. Canio Corbo Lioi
Independent Director
6. Jaime Vargas Serrano
Director
7. Norman Hansen Rosés
Director
Ownership structure as of Feb-17

5
ORE
PROCESSING
Supplier of products and services for the mining
✓ Strategic Focus: Provide products and
services for the mining and industry
✓ Involved in the main stages of the mining
value chain
✓ aprox. 75% of the SK’s Consolidated EBITDA
comes from the exposure to the mining activities
Corporate Presentation |Investment approach .
Anglo American - Minera Los Bronces:
…
MINING OPERATION SALES & LOGISTICSMINING
DEVELPOMENT
1 3 42
1 2 3 4+ + +
BHP Billiton - Minera Escondida:
1 2 3 4+ + +Codelco – Andina:
1 2 3+ +

Agenda
▪Results December-16
02Main
Consolidated
figures
03SK’s subsidiaries
Highlights
04Financial
Exhibits
01General Background

Dic-15 Dic-16 Var.
Sales 2.414.522 2.191.291 -9,2%
EBITDA (1) 377.711 291.026 -23,0%
EBITDA Margin 15,6% 13,3%
EBITDA Pro Forma (2) 432.684 336.351 -22,3%
Profi t (Loss ) 203.702 125.764 -38,3%
Sigdo Koppers Net Profit (non
recurrent)134.987 85.009 -37,0%
Dec-15 Dic-16 Var.
Total Assets 3.475.023 3.549.490 2,1%
Total Equity (3) 1.573.746 1.680.342 6,8%
Net Debt 875.910 810.854 -7,4%
Net Debt / EBITDA 2,31 2,78
ROE 216,16% 257,39%
ROCE 11,36% 6,70%
Consolidated Income StatementFigures in ThUS$
7
▪ Consolidated revenues decreased mainlyexplained by a lower level of sales in Magotteauxand Enaex and a tighter scenario with less activityin the businesses of leasing and selling ofmachinery (SK Comercial).
▪ Consolidated EBITDA amounted to US$291millions, a drop of 23% mainly due to a decline inthe activity in the Service, Commercial andAutomobile areas.
▪ Net profit totaled US$85 millions (-37%), adecrease explained by:
✓ More complex business scenario,particularly in mining and industryaffects the volumes and results of thebusiness areas of the company.
✓ Sigdo Koppers is executing plans ofreorganization and cost efficiency in itsdifferent subsidiaries
Highlights - December 2016▪
▪ Sigdo Koppers has a good consolidated Cashliquidity of US$299 millions and a conservativelevel of consolidated debt
▪ The net financial debt-to-EBITDA ratio is 2.8x andif we add consortiums net profit is 2.6x
(1) EBITDA = Ganancia Bruta + Otros Ingresos por Función – Costos de Distribución - Gastos de Administración – Otros Gastos por
Función + Gastos de Depreciación y Amortización
(3) EBITDA Pro-forma: considera las utilidades de empresas relacionadas que no consolidan.
Agenda
▪Results December-16
02Main
Consolidated
figures
03SK’s subsidiaries
Highlights
04Financial
Exhibits
01General Background

9
▪…
OPERACIÓNVENTA
Y LOGÍSTICA▪ DESARROLLO PROCESO
▪Resultados Sep-16
Main Subsidaries
60,43% 60,72% 85,77% 97,75%40,0% 50,01%
51,82%
53 años de experiencia en más de 300 proyectos de gran envergadura
(Presencia en Chile y Perú)
Producción de Nitrato de Amonio y Servicios de Tronadura
Venta, Arriendo y Servicio de Maquinaria de prestigiosas marcas
(Presencia en Chile, Perú Brasil y Colombia)
Comercialización de automóviles
(Presencia en Chile, Perú Argentina y Colombia)
Producción de Bolas de Molienda y Piezas de desgaste (casting)
(Presencia en 11 países)
Puerto de Carga a granel y combustible.
Dueña de 52% Fepasa (tpte. ferroviario)
Cadena de valor de la minería e industria
Results 4Q16

Dic-15 Dic-16 Var. 4Q15 4Q16 Var.
MM$ MM$ % MM$ MM$ %
Revenue 319.373 308.230 -3,5% 97.587 73.995 -24,2%
EBITDA 18.915 -1.219 -106,4% 6.428 2.549 -60,3%
EBITDA Margin 5,9% -0,4% 6,6% 3,4%
Pro-Forma EBITDA(*) 36.341 14.429 -60,3% 12.490 5.243 -58,0%
Pro-Forma EBITDA Margin 11,4% 4,7% 12,8% 7,1%
Control ler's net profi t 20.554 8.592 -58,2% 7.095 1.627 -77,1%
Horas
(Miles)
Horas
(Miles) Var.
Horas
(Miles)
Horas
(Miles) Var.
Total man-hours executed 22.458 17.458 -22,3% 4.753 5.081 6,9%
Ingeniería y Construcción Sigdo
Koppers
(*) Pro-Forma EBITDA: EBITDA + Related company profit
Ingeniería y Construcción SK
▪Resultados Sep-16
10
Results 4Q16
▪ Current Advance Works➢ Transmition line TEN/ECL reaches 75% advance and scheduled for completion 3T17.
➢ Project of Cochranne Thermoelectric plant and Desalinization plant for Escondida in final
phase.
▪ SSK-Peru➢ Earth Movement consortium with the company Excon with an extraordinary loss of $
7,594 million at EBITDA level.
▪ Backlog➢ Backlog equivalent to US$458 million (-2% compared to Sep-16). Main projects:
TEN/Engie transmition line, GEAlstom/substations assembly and Codelco/ underground
Chuquicamata tunnels.
➢ Projects awarded by US$363 million (Jan-Dec 2016)
➢ Major projects awarded: Talara (Peru), Marítime Terminal Penco Lirquen, maintenance
of Bio Bio refinery (Enap) and new transmission lines in Brazil
▪ Pipeline: Important opportunities for new transmission lines in Brazil.

Puerto Ventanas
Puerto Ventanas▪ Cargo Transfer
➢ Cu Concentrate transfer decreased (-12%) due to productionproblems at Codelco's Andina (-14%)
➢ Lower Coal transfers (-11%) due to high levels of inventoriesAESGener as of Dec-15.
➢ Swells have maintained the port with low operationalavailability during the 1S16.
▪ Investments
➢ New warehouse for Cu Concentrate : started Dec-16.
➢ Upgrade Site No.3: advance 25% and expected start Dec-17.
11
▪Resultados Sep-16Results 4Q16
Fepasa
▪ Mobilised load➢ Cargo movement of Cu Concentrate (-10%) affected by
production problems at Codelco Andina and Teniente.
➢ Movement of wood pulp cargo (-2%), impacted by thecollapse of the Toltén bridge on August 18 (lowervolumes and over costs). This situation will continueuntil the repair of the bridge by EFE. because of newcontracts with Arauco Forest.
➢ Increasing intermodal and logistics services haveincreased the costs of some contracts, a situation thatis expected to normalize during 2017.
➢ During 2017, Fepasa plans the start to carry copperconcentrate via railroad from the Las Tortolas Plant toPuerto Ventanas (Anglo American carga).
Dic-15 Dic-16 Var. 4Q15 4Q16 Var.
ThUS$ ThUS$ % ThUS$ ThUS$ %
Revenue 131.832 132.398 0,4% 33.238 35.080 5,5%
EBITDA 43.318 34.512 -20,3% 10.670 9.416 -11,8%
EBITDA Margin 32,9% 26,1% 32,1% 26,8%
Control ler's net profi t 24.895 19.457 -21,8% 6.127 5.041 -17,7%
PVSA - Tons transferred 5.928.225 5.216.119 -12,0% 1.477.672 1.394.214 -5,6%
Fepasa - Th Ton-Km 1.212.401 1.138.959 -6,1% 305.042 251.818 -17,4%
Puerto Ventanas
Consolidated
Dic-15 Dic-16 Var. 4Q15 4Q16 Var.
ThUS$ ThUS$ % ThUS$ ThUS$ %
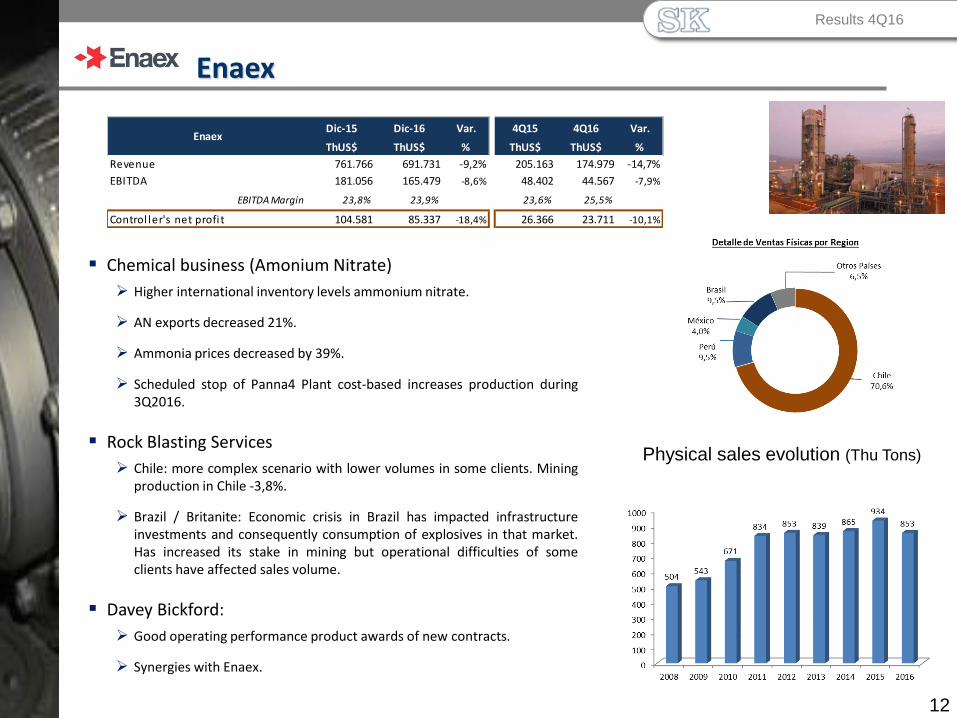
Revenue 761.766 691.731 -9,2% 205.163 174.979 -14,7%
EBITDA 181.056 165.479 -8,6% 48.402 44.567 -7,9%
EBITDA Margin 23,8% 23,9% 23,6% 25,5%
Control ler's net profi t 104.581 85.337 -18,4% 26.366 23.711 -10,1%
Enaex
12
Enaex
▪ Chemical business (Amonium Nitrate)
➢ Higher international inventory levels ammonium nitrate.
➢ AN exports decreased 21%.
➢ Ammonia prices decreased by 39%.
➢ Scheduled stop of Panna4 Plant cost-based increases production during3Q2016.
▪ Rock Blasting Services
➢ Chile: more complex scenario with lower volumes in some clients. Miningproduction in Chile -3,8%.
➢ Brazil / Britanite: Economic crisis in Brazil has impacted infrastructureinvestments and consequently consumption of explosives in that market.Has increased its stake in mining but operational difficulties of someclients have affected sales volume.
▪ Davey Bickford:
➢ Good operating performance product awards of new contracts.
➢ Synergies with Enaex.
▪Resultados Sep-16
Physical sales evolution (Thu Tons)
Results 4Q16

Dic-15 Dic-16 Var. 4Q15 4Q16 Var.
MUS$ MUS$ % MUS$ MUS$ %
Revenue 692.284 628.520 -9,2% 162.138 156.371 -3,6%
EBITDA 80.415 63.362 -21,2% 21.240 11.962 -43,7%
EBITDA Margin 11,6% 10,1% 13,1% 7,6%
Control ler's net profi t 29.396 22.936 -22,0% 7.786 4.576 -41,2%
Magotteaux Group
▪ Grinding Balls Business➢ HiCr balls lower volumes, particularly in the cement market of North
America and South America. Operation in Brazil remains positive butshocked by economic crisis in Brazil.
➢ Decline in international demand has led to a decrease in the utilizationratio of the different plants.
➢ New Plant in Thailand on track to achieve expected productivity.
➢ Increased sales of forged steel, but the market remains strongcompetition set by China.
▪ Casting business➢ Casting lower volumes (-7%), particularly in Asia.
➢ Improving margins hand of a better mix and higher level of productivityof plants.
▪ Reorganization Plan➢ SG&A expenses decreased 2,2% compared to Sep-15 (-12% vs. Sep-14)
➢ New reorganization phase , focused in greater independence for regions.
▪Resultados Sep-16
Magotteaux
13
Results 4Q16
Dic-15 Dic-16
Mil l Bal ls 321.722 308.793 -4,0%
Casting 50.138 47.254 -5,8%
Total 371.860 356.048 -4,3%
Magotteaux
Group
Var.
%

Dic-15 Dic-16 Var. 4Q15 4Q16 Var.
ThUS$ ThUS$ % ThUS$ ThUS$ %
Revenue 347.412 299.837 -13,7% 88.685 73.004 -17,7%
Distribution Business 257.465 214.732 -16,6% 66.961 54.079 -19,2%
Rental Business 134.181 112.819 -15,9% 31.101 24.985 -19,7%
Consolidation adjust -44.234 -27.715 -37,3% -9.377 -6.060 -35,4%
EBITDA 50.760 28.017 -44,8% 10.529 5.341 -49,3%
EBITDA Margin 14,6% 9,3% 11,9% 7,3%
Control ler's net profi t 224 -16.574 0,0% -798 -8.481 962,8%
SK Comercial
14
SK Comercial
▪ Machinery Distribution Business
➢ Chile’s machinery market remains depressed, although no furthersignificant falls are recorded. Market of construction machinery andearthworks has been the most affected (-30% to -50% vs.2013).
➢ Truck market in Chile -10% over Dec 2015 (-26% compared to Dec 2013).
➢ Closing Volvo operation in Peru.
▪ Machinery Rental Business
➢ Fleet: US$180 million (-16% vs. Dec-15)
➢ Rental markets in Chile and Peru has been adjusted downward.
➢ SKRental is in a fleet reduction strategy in Chile and Peru to fit the size ofthe market and lower investment cycle.
▪ Corporate reorganization
➢ Synergy projects in warehouses and workshops.
➢ Rationalisation of branches and maximizing the use of offices andoperations in Lampa (headquarters).
▪Resultados Sep-16 Results 4Q16

Dic-15 Dic-16 Var. 4Q15 4Q16 Var.
MM$ MM$ % MM$ MM$ %
Control ler's net profit 18.627 15.045 -19,2% 4.728 5.107 8,0%
SK Inversiones
Automotrices
SK Inversiones Automotrices
▪ SKIA had profits of MM$9,938 Chilean Pesos(US$17 millions) (-29%).
✓ Mainly due to lower margins in the Chileanmarket and lower sales in the Peruvian andColombian markets.
▪ SKBergé accounted sales for 49,987 units, adecrease of 7% compared to December 15.
✓ Lower level of sales in Chile: 24,560 units (-9%).
✓ Lower sales in Peru and Colombia: 25,427 units(-5%), as a consequence of a contraction of thePeruvian and Colombian markets.
▪ Sales of light vehicles in the Chilean marketreached 219,596 units as of December 16 (+7%).
▪Resultados Sep-16Results 4Q16
15
Perú
Argentina
Chile
Colombia
Agenda
▪Results December-16
02Main
Consolidated
figures
03SK’s subsidiaries
Highlights
04Financial
Exhibits
01General Background

Dic-15 Dic-16 Var. 4Q15 4Q16 Var.
Sales 2.414.522 2.191.291 -9,2% 629.780 551.181 -12,5%
Sales expenses -1.856.514 -1.707.389 8,0% -493.098 -427.347 13,3%
Gross income 558.008 483.902 -13,3% 136.682 123.834 -9,4%
Other operating income 14.688 21.873 48,9% 3.683 4.581 24,4%
Distribution costs -78.963 -75.787 4,0% -16.436 -17.921 -9,0%
Administrative expenses -226.128 -237.443 -5,0% -54.195 -57.516 -6,1%
Other operating expenses -13.355 -24.641 -84,5% -6.201 -6.050 2,4%
Operating income 254.250 167.904 -34,0% 63.533 46.928 -26,1%
EBITDA 377.711 291.026 -23,0% 97.918 80.001 -18,3%
% EBITDA Margin 15,6% 13,3% 0,0% 0,4%
Interest income 5.311 4.410 -17,0% 1.923 1.363 -29,1%
Interest expenses -52.569 -54.413 -3,5% -14.831 -13.644 8,0%
Related companies income 54.973 45.445 -17,3% 15.192 11.721 -22,8%
Exchange differentials -13.808 -1.459 89,4% -1.622 -2.408 -48,5%
Price - level restatement 2.198 -1.236 -156,2% -562 248 144,1%
Other income (losses) -882 4.490 609,1% -2.053 4.445 316,5%
Gain (losses) between book value and fair
value (financial assets) - - - -
Income before taxes 249.473 165.141 -33,8% 61.580 48.653 -21,0%
Income tax -45.771 -39.377 14,0% -7.940 -12.433 -56,6%
Income 203.702 125.764 -38,3% 53.640 36.220 -32,5%
Gain (losses) from uncontinnued
operations - - - -
Net income 203.702 125.764 -38,3% 53.640 36.220 -32,5%
Income attributable to Sigdo Koppers 134.987 85.009 -37,0% 36.332 23.939 -34,1%
Income attributable to non-controlling
interests68.715 40.755 -40,7% 17.308 12.282 -29,0%
Sigdo Koppers
Consolidated Income Statement
Figures in ThUS$ Cifras en MUS$
Sigdo Koppers Income Statement
17
▪Resultados Sep-16Results 4Q16

Dic-15 Dic-16 Var. 4Q15 4Q16 Var.
Services 619.850 587.841 -5,2% 174.649 146.257 -16,3%
Ingeniería y Construcción SK 488.018 455.443 -6,7% 141.411 111.177 -21,4%
Puerto Ventanas 131.832 132.398 0,4% 33.238 35.080 5,5%
Industrial 1.457.492 1.323.386 -9,2% 368.130 332.099 -9,8%
Enaex 761.766 691.731 -9,2% 205.163 174.979 -14,7%
Magotteaux (1) 692.284 628.520 -9,2% 162.138 156.371 -3,6%
SK Inv. Petroquímicas 3.442 3.135 -8,9% 829 749 -9,7%
Commercial & Automotive 347.412 299.837 -13,7% 88.685 73.004 -17,7%
SK Comercial 347.412 299.837 -13,7% 88.685 73.004 -17,7%
SKIA (2) - - - - - -
Parent company & adjustment(3) -10.232 -19.773 93,3% -1.684 -179 -89,4%
Consolidated Sales 2.414.522 2.191.291 -9,2% 629.780 551.181 -12,5%
Figures in ThUS$Revenue
Business Areas
Figures in ThUS$
Revenue Sigdo Koppers
18
▪Resultados Sep-16
(1) Magotteaux’s figures include income of SKSabo Chile S.A. The profits attributable to the controller were adjusted in the different companies
through which Sigdo Koppers controls Magotteaux.
(2) SK Inversiones Automotrices S.A. (SKIA) does not account for the income of SKBergé because it holds 40% of its shares and, therefore,
does not consolidate its financial statements.
(3) Eliminations and adjustments as of June are mainly the result of consolidated intercompany eliminations
Area Servicios
Area Industrial
Area Comercial
y Automotriz
Results 4Q16

Revenue by country (incl. SKBergé)▪D
19
▪Resultados Sep-16
▪ December 2015
▪December 2016
Results 4Q16
Chile Perú Colombia Brasil Asia Norte America Europa Otros Países
MUS$ MUS$ MUS$ MUS$ MUS$ MUS$ MUS$ MUS$
Área Servicios 86,7% 13,3% 0,0% 0,0% 0,0% 0,0% 0,0% 0,0%
Ingeniería y Construcción SK 82,9% 17,1% - - - - - -
Puerto Ventanas 100% - - - - - - -
Área Industrial 41,3% 1,2% 0,3% 10,8% 9,5% 12,5% 20,9% 3,4%
Enaex 67,6% 2,2% 0,7% 12,7% - - 14,2% 2,6%
Magotteaux 11,9% - - 8,9% 20,0% 26,4% 28,4% 4,4%
SK Inv. Petroquímicas 100% - - - - - - -
Área Comercial y Automotriz 57,4% 31,8% 6,4% 0,3% 0,0% 0,0% 0,0% 4,1%
SK Comercial 83,3% 13,3% 1,8% 1,6% - - - -
SKIA 51,6% 36,0% 7,4% - - - - 5,0%
Ventas Empresas SK 56,2% 17,3% 3,1% 4,2% 3,5% 4,7% 7,8% 3,2%
Ventas
Áreas de Negocios
Chile Perú Colombia Brasil Asia Norte America Europa Otros Países
MUS$ MUS$ MUS$ MUS$ MUS$ MUS$ MUS$ MUS$
Área Servicios 77,1% 22,9% 0,0% 0,0% 0,0% 0,0% 0,0% 0,0%
Ingeniería y Construcción SK 70,9% 29,1% - - - - - -
Puerto Ventanas 100% - - - - - - -
Área Industrial 48,2% 1,0% 0,0% 10,4% 8,6% 12,7% 15,4% 3,7%
Enaex 79,4% 2,0% - 9,9% - - 5,5% 3,2%
Magotteaux 13,5% - - 11,0% 18,2% 26,8% 26,3% 4,2%
SK Inv. Petroquímicas 100,0% - - - - - - -
Área Comercial y Automotriz 57,7% 32,1% 7,2% 0,4% 0,0% 0,0% 0,0% 2,6%
SK Comercial 77,8% 18,5% 1,6% 2,0% - - - -
SKIA 52,5% 35,6% 8,6% - - - - 3,3%
Ventas Empresas SK 57,2% 18,7% 3,2% 4,2% 3,3% 4,9% 5,9% 2,6%
Ventas
Áreas de Negocios
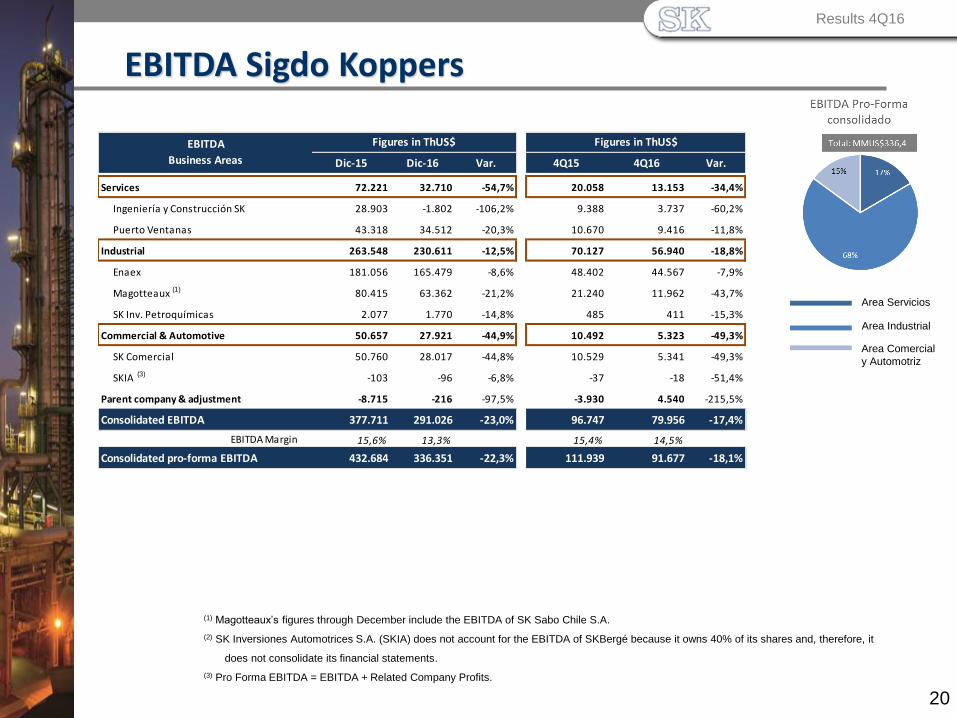
Dic-15 Dic-16 Var. 4Q15 4Q16 Var.
Services 72.221 32.710 -54,7% 20.058 13.153 -34,4%
Ingeniería y Construcción SK 28.903 -1.802 -106,2% 9.388 3.737 -60,2%
Puerto Ventanas 43.318 34.512 -20,3% 10.670 9.416 -11,8%
Industrial 263.548 230.611 -12,5% 70.127 56.940 -18,8%
Enaex 181.056 165.479 -8,6% 48.402 44.567 -7,9%
Magotteaux (1) 80.415 63.362 -21,2% 21.240 11.962 -43,7%
SK Inv. Petroquímicas 2.077 1.770 -14,8% 485 411 -15,3%
Commercial & Automotive 50.657 27.921 -44,9% 10.492 5.323 -49,3%
SK Comercial 50.760 28.017 -44,8% 10.529 5.341 -49,3%
SKIA (3) -103 -96 -6,8% -37 -18 -51,4%
Parent company & adjustment -8.715 -216 -97,5% -3.930 4.540 -215,5%
Consolidated EBITDA 377.711 291.026 -23,0% 96.747 79.956 -17,4%
EBITDA Margin 15,6% 13,3% 15,4% 14,5%
Consolidated pro-forma EBITDA 432.684 336.351 -22,3% 111.939 91.677 -18,1%
Figures in ThUS$EBITDA
Business Areas
Figures in ThUS$
EBITDA Sigdo Koppers
20
▪Resultados Sep-16
(1) Magotteaux’s figures through December include the EBITDA of SK Sabo Chile S.A.
(2) SK Inversiones Automotrices S.A. (SKIA) does not account for the EBITDA of SKBergé because it owns 40% of its shares and, therefore, it
does not consolidate its financial statements.
(3) Pro Forma EBITDA = EBITDA + Related Company Profits.
Area Servicios
Area Industrial
Area Comercial
y Automotriz
Results 4Q16
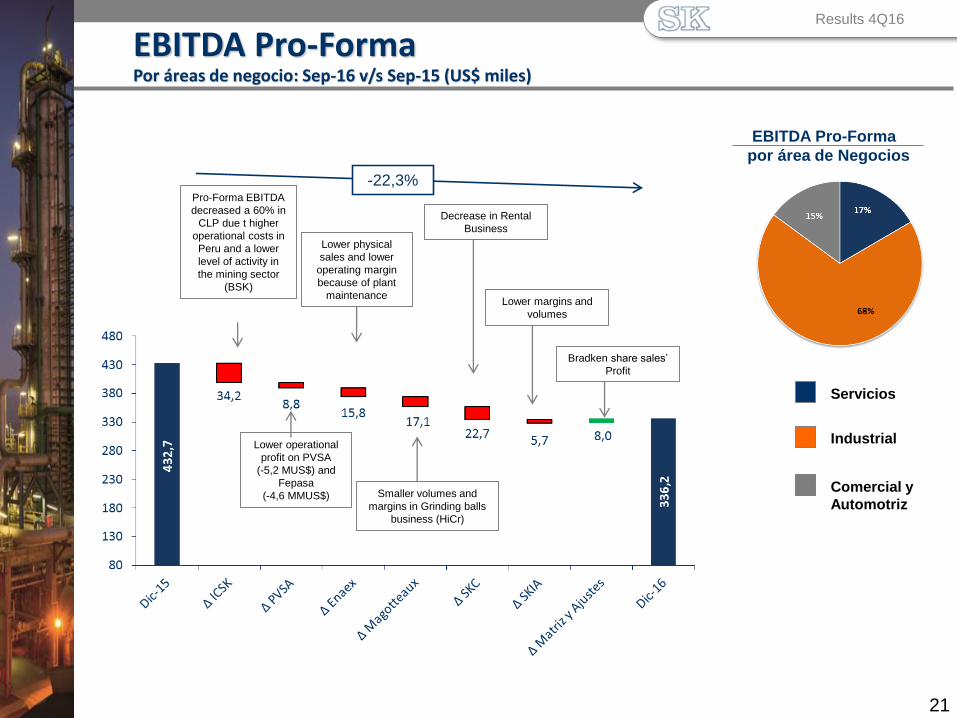
Pro-Forma EBITDA
decreased a 60% in
CLP due t higher
operational costs in
Peru and a lower
level of activity in
the mining sector
(BSK)
Decrease in Rental
Business
Lower physical
sales and lower
operating margin
because of plant
maintenance
Smaller volumes and
margins in Grinding balls
business (HiCr)
EBITDA Pro-Forma
por área de Negocios
21
EBITDA Pro-FormaPor áreas de negocio: Sep-16 v/s Sep-15 (US$ miles)
▪Results 4Q16
-22,3%
Servicios
Industrial
Comercial y
Automotriz
Lower margins and
volumes
Lower operational
profit on PVSA
(-5,2 MUS$) and
Fepasa
(-4,6 MMUS$)
Bradken share sales’
Profit

Dic-15 Dic-16 Var. Dic-16 Dic-15 Dic-16 Var.
Services 56.304 32.152 -42,9% 32.144 17.658 -45,1%
Ingeniería y Construcción SK 31.408 12.695 -59,6% 60,43% 18.980 7.672 -59,6%
Puerto Ventanas 24.896 19.457 -21,8% 50,01% 13.164 9.986 -24,1%
Industrial 135.420 109.480 -19,2% 89.640 70.344 -21,5%
Enaex 104.582 85.337 -18,4% 60,72% 63.503 51.818 -18,4%
Magotteaux (1) 29.396 22.936 -22,0% 95,00% 24.943 17.526 -29,7%
SK Inv. Petroquímicas (2) 1.442 1.207 -16,3% 74,59% 1.194 1.000 -16,2%
Commercial & Automotive 28.688 5.689 -80,2% 28.654 8.015 -72,0%
SK Comercial 225 -16.574 -7466,2% 85,77% 192 -14.216 -7504,2%
SKIA 28.463 22.263 -21,8% 99,99% 28.462 22.231 -21,9%
SK companies profit 220.412 147.321 -33,2% 150.438 96.017 -36,2%
Parent company & adjusments -15.451 -11.008
Total consolidated profit 134.987 85.009 -37,0%
Total Companies Attributable to parent companyNet profit
Business Areas
% SKFigures in ThUS$ Figures in ThUS$
Sigdo Koppers’ Net Profit
22
▪Resultados Sep-16
(1) Magotteaux’s figures include income of SK Sabo Chile S.A. The profits attributable to the controller were adjusted in the different companies through
which Sigdo Koppers controls Magotteaux.
(2) The profit of CHBB was adjusted in SK Inversiones Petroquímicas S.A. through which Sigdo Koppers controls CHBB.
Services
Industrial
Commercial &
Automobile
Results 4Q16
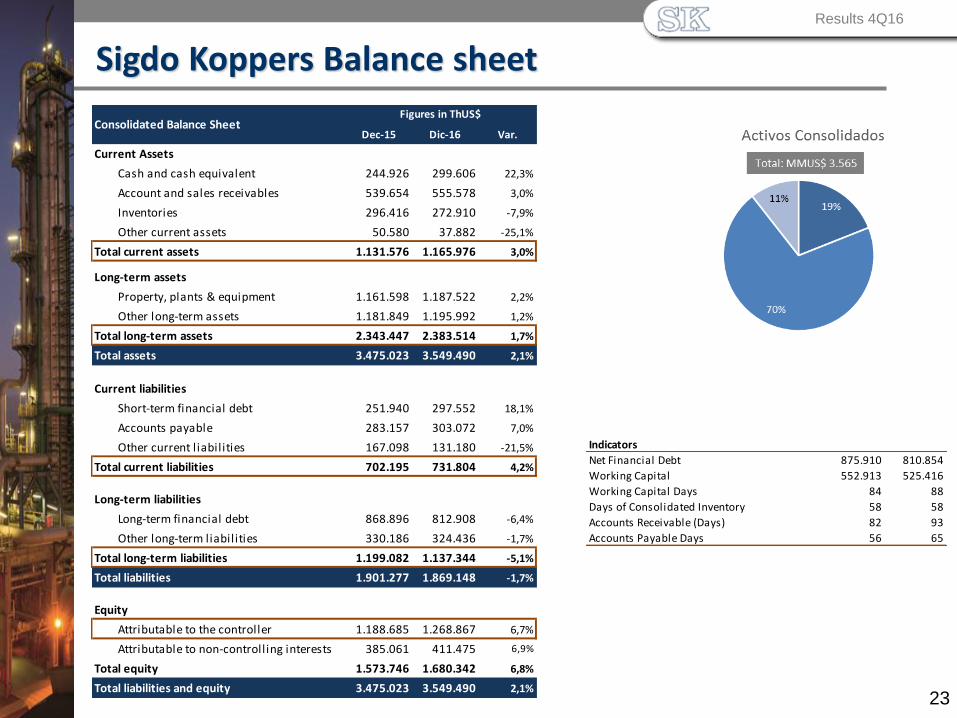
Indicators
Net Financial Debt 875.910 810.854
Working Capital 552.913 525.416
Working Capital Days 84 88
Days of Consolidated Inventory 58 58
Accounts Receivable (Days) 82 93
Accounts Payable Days 56 65
Dec-15 Dic-16 Var.
Current Assets
Cash and cash equivalent 244.926 299.606 22,3%
Account and sales receivables 539.654 555.578 3,0%
Inventories 296.416 272.910 -7,9%
Other current assets 50.580 37.882 -25,1%
Total current assets 1.131.576 1.165.976 3,0%
Long-term assets
Property, plants & equipment 1.161.598 1.187.522 2,2%
Other long-term assets 1.181.849 1.195.992 1,2%
Total long-term assets 2.343.447 2.383.514 1,7%
Total assets 3.475.023 3.549.490 2,1%
Current liabilities
Short-term financial debt 251.940 297.552 18,1%
Accounts payable 283.157 303.072 7,0%
Other current l iabilities 167.098 131.180 -21,5%
Total current liabilities 702.195 731.804 4,2%
Long-term liabilities
Long-term financial debt 868.896 812.908 -6,4%
Other long-term liabilities 330.186 324.436 -1,7%
Total long-term liabilities 1.199.082 1.137.344 -5,1%
Total liabilities 1.901.277 1.869.148 -1,7%
Equity
Attributable to the controller 1.188.685 1.268.867 6,7%
Attributable to non-controlling interests 385.061 411.475 6,9%
Total equity 1.573.746 1.680.342 6,8%
Total liabilities and equity 3.475.023 3.549.490 2,1%
Consolidated Balance SheetFigures in ThUS$
Sigdo Koppers Balance sheet
23
▪Resultados Sep-16Results 4Q16
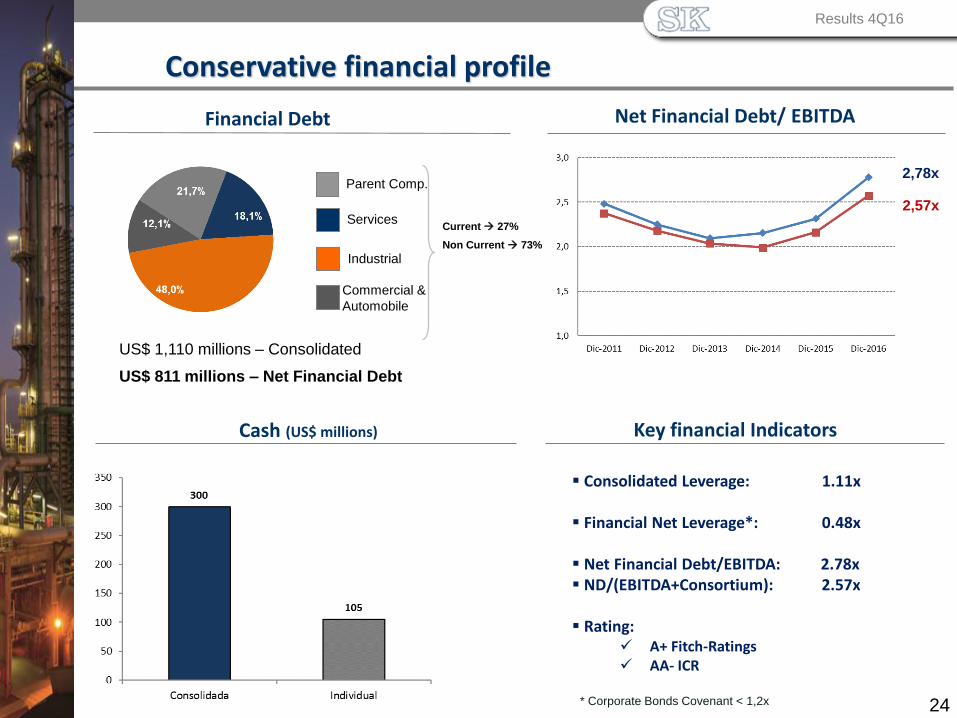
Net Financial Debt/ EBITDAFinancial Debt
24
Services
Industrial
Commercial &
Automobile
Parent Comp.
US$ 1,110 millions – Consolidated
US$ 811 millions – Net Financial Debt
Current 27%
Non Current 73%
Cash (US$ millions) Key financial Indicators
Conservative financial profile
▪Resultados Sep-16
▪ Consolidated Leverage: 1.11x
▪ Financial Net Leverage*: 0.48x
▪ Net Financial Debt/EBITDA: 2.78x▪ ND/(EBITDA+Consortium): 2.57x
▪ Rating: ✓ A+ Fitch-Ratings✓ AA- ICR
* Corporate Bonds Covenant < 1,2x
Results 4Q16
2,78x
2,57x
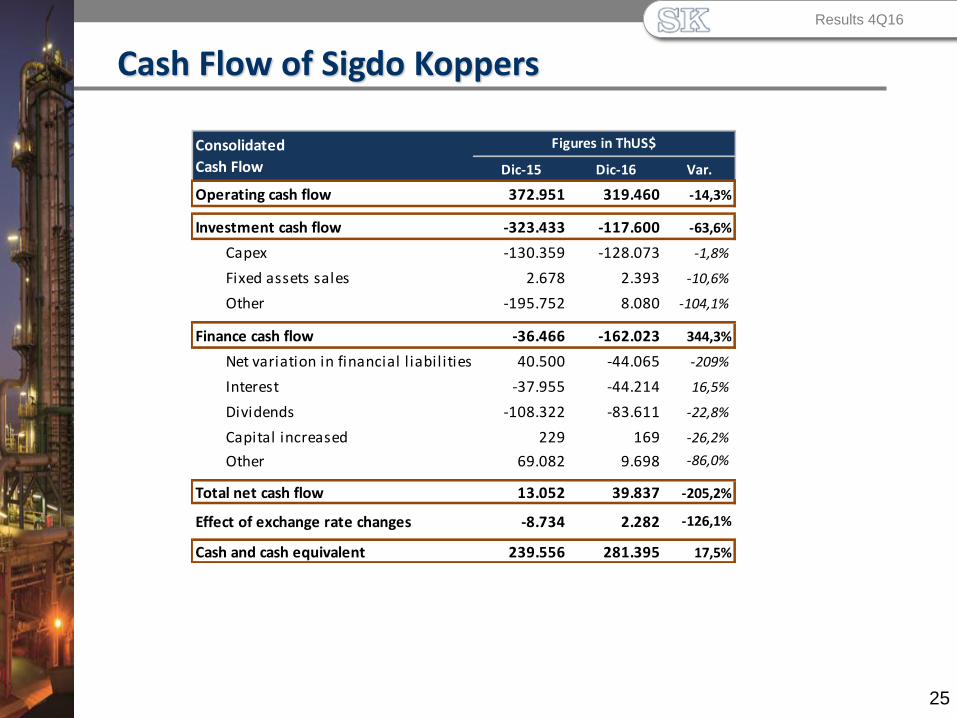
Dic-15 Dic-16 Var.
Operating cash flow 372.951 319.460 -14,3%
Investment cash flow -323.433 -117.600 -63,6%
Capex -130.359 -128.073 -1,8%
Fixed assets sales 2.678 2.393 -10,6%
Other -195.752 8.080 -104,1%
Finance cash flow -36.466 -162.023 344,3%
Net variation in financial l iabilities 40.500 -44.065 -209%
Interest -37.955 -44.214 16,5%
Dividends -108.322 -83.611 -22,8%
Capital increased 229 169 -26,2%
Other 69.082 9.698 -86,0%
Total net cash flow 13.052 39.837 -205,2%
Effect of exchange rate changes -8.734 2.282 -126,1%
Cash and cash equivalent 239.556 281.395 17,5%
Consolidated
Cash Flow
Figures in ThUS$
Cash Flow of Sigdo Koppers
25
▪Resultados Sep-16Results 4Q16
CAPEX
26
▪
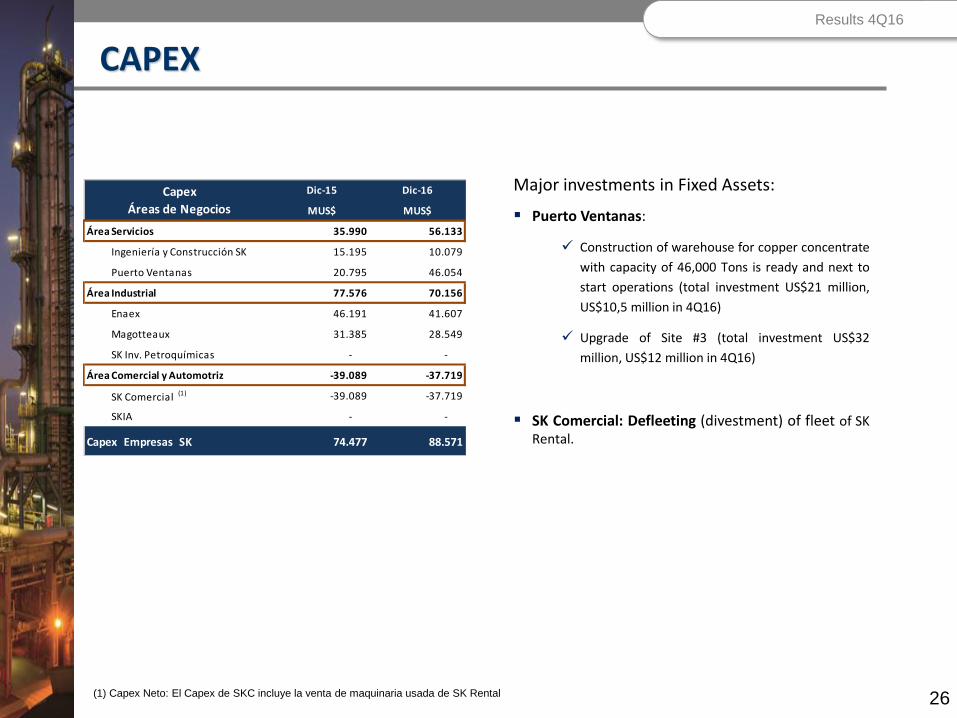
Major investments in Fixed Assets:
▪ Puerto Ventanas:
✓ Construction of warehouse for copper concentrate
with capacity of 46,000 Tons is ready and next to
start operations (total investment US$21 million,
US$10,5 million in 4Q16)
✓ Upgrade of Site #3 (total investment US$32
million, US$12 million in 4Q16)
▪ SK Comercial: Defleeting (divestment) of fleet of SKRental.
(1) Capex Neto: El Capex de SKC incluye la venta de maquinaria usada de SK Rental
Results 4Q16
Dic-15 Dic-16
MUS$ MUS$
Área Servicios 35.990 56.133
Ingeniería y Construcción SK 15.195 10.079
Puerto Ventanas 20.795 46.054
Área Industrial 77.576 70.156
Enaex 46.191 41.607
Magotteaux 31.385 28.549
SK Inv. Petroquímicas - -
Área Comercial y Automotriz -39.089 -37.719
SK Comercial (1) -39.089 -37.719
SKIA - -
Capex Empresas SK 74.477 88.571
Capex
Áreas de Negocios

▪Asesores Financieros
Results Presentation


