115
ASH – Active Session History Kyle Hailey Embarcadero Technologies Kyle. hailey @embarcadero.com http:// Oraperf.sourceforge.net
| Date post: | 24-Dec-2015 |
| Category: |
Documents |
| Upload: | brent-gray |
| View: | 223 times |
| Download: | 0 times |

ASH – Active Session History
Kyle HaileyEmbarcadero Technologies
[email protected]://Oraperf.sourceforge.net

ASH new Paradigm in Technology
The Power of ASH lies in
Simplifying Performance Tuning
• Totally new and exciting method Performance Monitoring
• Cheaper, Quicker, Richer and better tasting

Why should you care?
Because ASH can Change your life …
• 10g immediately Accessible– For Geeks: Via scripts in SQL– For non-geeks on your team: Graphical EM
• If you are not hip enough for 10g then 7,8,9 data is there, need scripts – via PL/SQL scripts– Then the power of ASH is accessible via SQL

Imagine with me folks …

You finally escaped dull Tech Support, promoted to head DBA …

It’s 3am – Do you know what your database is doing?
Because lives (and your job) depend on it

Cleary a job for Stats Pack
Because stats pack shows you every hour
• all the Stats!
• All the top Bottlenecks
• Almost all the top SQL
Feeling better ?

Feeling Better?
Hmmm … but … wait
• What if your database hits a bottleneck 15 minutes after the last stats pack?
• What about that coder who writes bad SQL … can you find his rogue module?
• Ok you found the top SQL but … now what?

If lives (and your job) depend on your database
• Is once an hour really enough ?
• Can it find a rogue user?
• Can it tell you why an SQL bottlenecked?
• PS … are you sure you can even decipher stats pack ?

Oh no … it’s 3am your manager calls “why is the database hanging?!”
But do you have an answer?
• Who did it?
• Where did the SQL get block?
• What if the bottlenecked started 5 minutes ago?

Statspack Can’t Tell You … but ASH Can

Introducing ASH
A technology capable of saving lives …
(And your job)

ASH A Revolution in Monitoring
Active Session History
• New 10g
• Every Second it collect data
• 1 hour of history in Memory for immediate access at your fingertips
This hour of data could change your life

It’s a Revolution and it’s an Evolution
• Oracle 6 … ie the dark ages … there was Cache Buffer Hit Ratio
• Oracle 7 … turned the lights on … Wait Events … hallelujah I can see the light
• Oracle 10g … ASH has landed

ASH – Intelligence for the new Millennium
• Selectively Collects Data– More active, more data collected
– Less active, less data collected
– It self adjusts for your needs
• Old methods collect everything – Costly
– Limits fine Granularity

ASH – In Memory
• Active sessions only
• History v$session_wait + v$session + extras• Circular Buffer - 1M to 128M (~2MB per CPU)
• Flushed every hour to disk or when buffer 2/3 full

ASH Sizing … bigger isn’t always better
• Avg row around 150bytes
• 3600 secs in an hour
• ~ ½ Meg per Active Session per hour
• That’s generally over an hour of ASH

ASH Samples
• What is Sampling?

Sampling Weather
Mon Tue Wed Thu Fri Sat Sun
Weather Changes but we want the main picture

Session 1Ash Samples Session State
TIME
10:00:00 10:00:01 10:00:02 10:00:03 10:00:04 10:00:05

Session 1Ash Samples Session State
TIME?? ?? ?? ?? ??
Sessions change a lot quicker but can get the main picture via sampling by sampling faster

If happens a lot or for long … we’ll catch it, guarenteed

Session States
IO CPU IdleWait

Session States
• Idle
• CPU
• Waiting
• I/O

IDLE
• Ex : SQL*Net Message from Client
• All Idle Events:
select name from v$event_name where
wait_class='Idle‘;
58 Rows

CPU
• ASH: SESSION_STATE = “ON CPU”
• ASH: wait_time > 0

WAITING• ASH: SESSION_STATE=‘WAITING’• ASH: WAIT_TIME=0• WAIT_CLASS
– Administrative– Application– Cluster– Commit– Concurrency– Configuration– Network– Other– Scheduler– System I/O
• 800+ WAIT

IO
• ASH:
SESSION_STATE=‘WAITING’
and
WAIT_CLASS=‘User I/O’

Session 1
Session 2
Session 3
Session 4
TIME
Samples for all users
10:15:00 10:15:01 10:15:02 10:15:03 10:15:04 10:15:05 10:15:06 10:15:07

ASH FieldsSQL> v$active_session_history
Name Null? Type
----------------------------------------- -------- ----------------------------
SAMPLE_ID NUMBER
SAMPLE_TIME TIMESTAMP(3)
SESSION_ID NUMBER
SESSION_SERIAL# NUMBER
USER_ID NUMBER
SQL_ID VARCHAR2(13)
SQL_CHILD_NUMBER NUMBER
SQL_PLAN_HASH_VALUE NUMBER
SQL_OPCODE NUMBER
SERVICE_HASH NUMBER
SESSION_TYPE VARCHAR2(10)
SESSION_STATE VARCHAR2(7)
QC_SESSION_ID NUMBER
QC_INSTANCE_ID NUMBER
EVENT VARCHAR2(64)
EVENT_ID NUMBER
EVENT# NUMBER
SEQ# NUMBER
P1 NUMBER
P2 NUMBER
P3 NUMBER
WAIT_TIME NUMBER
TIME_WAITED NUMBER
CURRENT_OBJ# NUMBER
CURRENT_FILE# NUMBER
CURRENT_BLOCK# NUMBER
PROGRAM VARCHAR2(48)
MODULE VARCHAR2(48)
ACTION VARCHAR2(32)
CLIENT_ID VARCHAR2(64)

v$active_session_history
SESSION_ID NUMBER SESSION_SERIAL# NUMBER USER_ID NUMBER SERVICE_HASH NUMBER SESSION_TYPE VARCHAR2(10) PROGRAM VARCHAR2(64) MODULE VARCHAR2(48) ACTION VARCHAR2(32) CLIENT_ID VARCHAR2(64)
EVENT VARCHAR2(64) EVENT_ID NUMBER EVENT# NUMBER SEQ# NUMBER P1 NUMBER P2 NUMBER P3 NUMBER WAIT_TIME NUMBER TIME_WAITED NUMBER CURRENT_OBJ# NUMBER CURRENT_FILE# NUMBER CURRENT_BLOCK# NUMBER0
SQL_ID VARCHAR2(13) SQL_CHILD_NUMBER NUMBER SQL_PLAN_HASH_VALUE NUMBER SQL_OPCODE NUMBER QC_SESSION_ID NUMBER QC_INSTANCE_ID NUMBER
SAMPLE_ID NUMBER SAMPLE_TIME TIMESTAMP(3) When
Session
SQL
Wait
SESSION_STATE VARCHAR2(7) WAIT_TIME NUMBER State
TIME_WAITED NUMBER
Duration

Primary Fields of ASH
SESSION_ID
EVENT
SQL_ID
SAMPLE_TIME When
Session
SQL
Wait
SESSION_STATE State
TIME_WAITED Duration

Amazing things you can do with ASH

Consumers
• Top Session• Top User• Top SQL• Top Object• Top Module.Action• Top Program • Top Service• Top Client• Top Wait
X
• CPU• Waits• I/O• Time

Groupings – Top ConsumerSESSION_IDSESSION_SERIAL# (signal SID reuse)SESSION_TYPE (FOREGROUND,BACKGROUND)
CURRENT_OBJ#CURRENT_FILE#CURRENT_BLOCK#
USER_ID
SERVICE_HASH
PROGRAM
MODULE.ACTION
CLIENT_ID
SQL_IDQC_SESSION_ID - Query CoordinatorQC_INSTANCE_ID
EVENT + P1, P2, P3

Top CPU Session Top CPU Session in last 5 minutes
Select session_id, count(*)
from v$active_session_history
where session_state= ‘ON CPU‘ and SAMPLE_TIME > sysdate – (5/(24*60))
group by session_id
order by count(*) desc;

Results Top CPU Session
SESSION_ID COUNT(*) ---------- ---------- 265 36 264 25 257 22 271 22 276 1

CPU with Bars
SESSION_ID COUNT(*) % Bar---------- ---------- ---------- ------------ 257 75 25 |*** | 263 62 21 |** | 256 32 11 |* | 264 9 3 | | 277 3 1 | | 258 1 0 | | 280 1 0 | |

Top Waiting Session• Top Waiting Session in last 5 minutes
Select
session_id,
count(*)
from
v$active_session_history
where
session_state=‘WAITING’ and
SAMPLE_TIME > SYSDATE - (5/(24*60))
group by
session_id
order by
count(*) desc;

Top Waiting Session Results
SESSION_ID COUNT(*)---------- ---------- 272 24 254 8 249 5 276 5 277 4 270 1

Top SQL from ASH select ash.SQL_ID , sum(decode(ash.session_state,'ON CPU',1,0)) "CPU", sum(decode(ash.session_state,'WAITING',1,0)) - sum(decode(ash.session_state,'WAITING', decode(en.wait_class, 'User I/O',1,0),0)) "WAIT" , sum(decode(ash.session_state,'WAITING', decode(en.wait_class, 'User I/O',1,0),0)) "IO" , sum(decode(ash.session_state,'ON CPU',1,1)) "TOTAL"from v$active_session_history ash, v$event_name enwhere SQL_ID is not NULL and en.event#=ash.event#group by sql_idorder by sum(decode(session_state,'ON CPU',1,1)) desc

Top SQL from ASH Results
SQL_ID CPU WAITING IO TOTAL------------- ---------- ---------- ---------- ----------4c1xvq9ufwcjc 23386 0 0 233866wjw6rz5uvbp3 99 0 23 122968dm8hr9qd03 97 0 22 119938jp5gasmrah 90 0 25 115cv8xnv81kf582 42 0 9 516p9bzu19v965k 21 0 0 215zu8pxnun66bu 15 0 0 15db2jr13nup72v 9 0 0 97ks5gnj38hghv 8 0 0 838gfa1vpmwvx6 5 0 0 56zw21jfzjsunv 5 0 0 578s8yj36j2w1t 4 1 0 56769wyy3yf66f 4 0 0 4aptc882suuy74 4 0 0 4

Top Sessionselect ash.session_id, ash.session_serial#, ash.user_id, ash.program, sum(decode(ash.session_state,'ON CPU',1,0)) "CPU", sum(decode(ash.session_state,'WAITING',1,0)) - sum(decode(ash.session_state,'WAITING', decode(en.wait_class,'User I/O',1, 0 ), 0)) "WAITING" , sum(decode(ash.session_state,'WAITING', decode(en.wait_class,'User I/O',1, 0 ), 0)) "IO" , sum(decode(session_state,'ON CPU',1,1)) "TOTAL"from v$active_session_history ash, v$event_name enwhere en.event# = ash.event#group by session_id,user_id,session_serial#,programorder by sum(decode(session_state,'ON CPU',1,1))

Top Session ResultsSESSION_ID SESSION_SERIAL# USER_ID PROGRAM CPU WAITING IO TOTAL---------- --------------- ---------- ------------------------- ---------- ---------- ---------- ---------- 247 61970 1 ChMgr304.exe 11698 0 0 11698 277 1 0 oracle@labsfrh903 (LGWR) 14 21 0 35 276 1 0 oracle@labsfrh903 (CKPT) 19 10 0 29 278 1 0 oracle@labsfrh903 (DBW0) 29 0 0 29 280 1 0 oracle@labsfrh903 (PMON) 19 0 0 19 254 22617 5 Executor.exe 13 0 3 16 255 12877 5 Executor.exe 11 0 5 16 257 33729 5 Executor.exe 15 0 1 16 255 13417 5 Executor.exe 14 0 2 16

Top Session w/ Usernameselect /* if sid not found in v$session then disconnected */ decode(nvl(to_char(s.sid),-1),-1,'DISCONNECTED','CONNECTED') "STATUS", topsession.session_id "SESSION_ID", u.name "NAME", topsession.program "PROGRAM", max(topsession.CPU) "CPU", max(topsession.WAITING) "WAITING", max(topsession.IO) "IO", max(topsession.TOTAL) "TOTAL" from ( previous query ) topsession, v$session s, user$ u where u.user# =topsession.user_id and /* outer join to v$session because the session might be disconnected */ topsession.session_id = s.sid (+) and topsession.session_serial# = s.serial# (+) group by topsession.session_id, topsession.session_serial#, topsession.user_id, topsession.program, s.username,s.sid,s.paddr,u.name order by max(topsession.TOTAL) desc

Top Session ResultsSTATUS SESSION_ID NAME PROGRAM CPU WAITING IO TOTAL--------------- ---------- ---------- ------------------------- ---------- ---------- ---------- ----------CONNECTED 247 CPU_Monger ChMgr304.exe 11704 0 0 11704CONNECTED 277 SYS oracle@labsfrh903 (LGWR) 14 19 0 33CONNECTED 278 SYS oracle@labsfrh903 (DBW0) 29 0 0 29CONNECTED 276 SYS oracle@labsfrh903 (CKPT) 18 9 0 27CONNECTED 280 SYS oracle@labsfrh903 (PMON) 20 0 0 20DISCONNECTED 255 SYSTEM Executor.exe 11 4 5 16DISCONNECTED 257 SYSTEM Executor.exe 13 0 3 16DISCONNECTED 255 SYSTEM Executor.exe 14 0 2 16DISCONNECTED 257 SYSTEM Executor.exe 13 0 3 16DISCONNECTED 254 SYSTEM Executor.exe 12 0 3 15DISCONNECTED 254 SYSTEM Executor.exe 13 0 2 15DISCONNECTED 256 SYSTEM Executor.exe 11 0 4 15DISCONNECTED 256 SYSTEM Executor.exe 12 0 3 15DISCONNECTED 256 SYSTEM Executor.exe 13 0 2 15DISCONNECTED 255 SYSTEM Executor.exe 14 0 1 15DISCONNECTED 254 SYSTEM Executor.exe 11 0 4 15DISCONNECTED 246 SYSTEM Executor.exe 11 0 3 14DISCONNECTED 246 SYSTEM Executor.exe 13 0 1 14

Top Wait
• How to Attack the problem?• Top SQL?
– Top wait for that SQL?
• Top Waiting Session ?– Top Waits for that Session
• Top Waits for Database?– Top Session waiting for that wait– Top SQL for that wait
With Ash you can attack the problem all these ways

Session 1
Session 2
Session 3
Session 4
TIME
Graphical ASH

Graph of User States

One Second Graph

15 Second Averages

Maximum CPU Line

Idle Users

OEM Perf Page

Symantec I3

Quest

OEM Perf Page
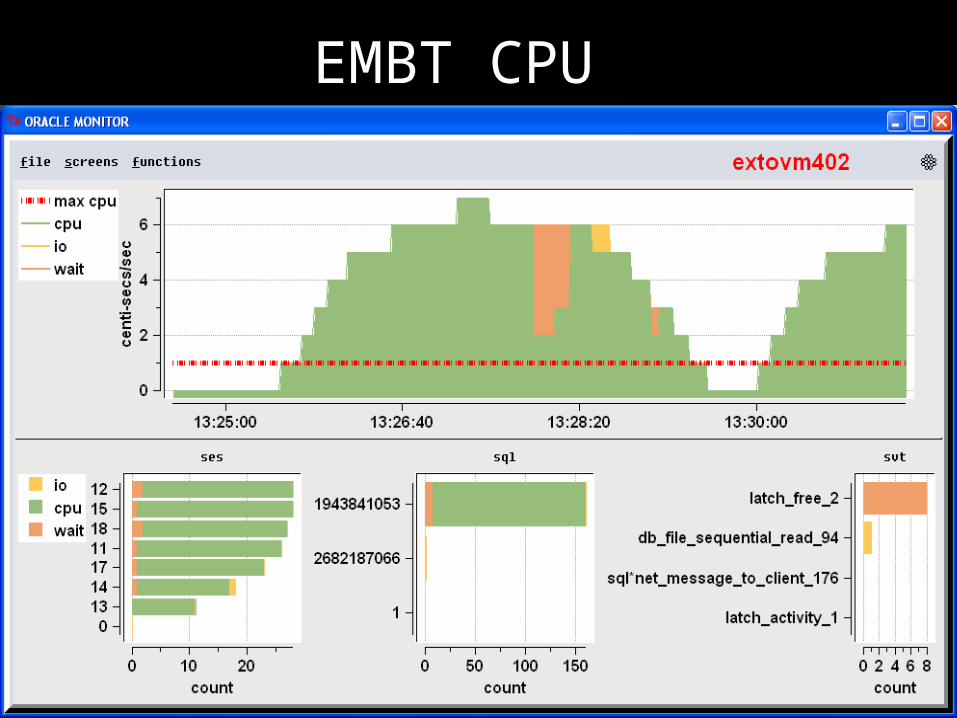
EMBT CPU

TCL Blocked Users (lock)

IO

Statistics vs Waits
• Cache Buffer Hit vs IO Waits
Why group around in the dark – just turn the lights on

CPU problem
• CPU is only updated at the end of the call.
• Long calls look deceiving like no CPU is being used

CPU in ASH vs Stats

Monitoring Waits can be Expensive
• Rows queried = # of sessions x # of waits
In 10g there are over 800 waits.
For example 100 user x 800 waits = 80,000 rows

Sampling Cheap
• With PL/SQL it’s less that 1 % CPU with 10 average active sessions
• ASH in 10g even cheaper
• ASH via Memory Scraping , 200x cheaper

ASH is Rich Data
• On top of being Cheap the data is multi-dimensional – you can cut it up in many different ways– Top Session– Top SQL– Top Module– Top Action– Top Program– Top Client– Top Service
• All ranked by CPU, IO, or any of 800 waits or time spent in wait, or by file accessed, or object accessed

Alert on Blocked Sessions
• Any session that is on a wait 15/15 samples can be called blocked whether or not they are on a row lock

ASH easily enables Drilldown Investigation
• See a spike in System Load (avg active sessions)
• Find out which SQL
• Find out what waits that SQL had

Simulating ASH
• ASH is new in 10g• Need Diagnostic Pack License • ASH data exist since V7 • Simulate it yourself
- Join v$session_wait & v$session- Save in a table
Consumes < 1% CPU for 10 active sessions (a lot)

Description of v$session_wait SID NUMBER SEQ# NUMBER
EVENT VARCHAR2(64) P1TEXT VARCHAR2(64) P1 NUMBER P1RAW RAW(4) P2TEXT VARCHAR2(64) P2 NUMBER P2RAW RAW(4) P3TEXT VARCHAR2(64) P3 NUMBER P3RAW RAW(4) WAIT_TIME NUMBER SECONDS_IN_WAIT NUMBER STATE VARCHAR2(19)
Session
Wait
WAIT_TIME NUMBER State

Description of v$active_session_history
SESSION_ID NUMBER SESSION_SERIAL# NUMBER USER_ID NUMBER SERVICE_HASH NUMBER SESSION_TYPE VARCHAR2(10) QC_SESSION_ID NUMBER QC_INSTANCE_ID NUMBER PROGRAM VARCHAR2(64) MODULE VARCHAR2(48) ACTION VARCHAR2(32) CLIENT_ID VARCHAR2(64)
EVENT VARCHAR2(64) EVENT_ID NUMBER EVENT# NUMBER SEQ# NUMBER P1 NUMBER P2 NUMBER P3 NUMBER WAIT_TIME NUMBER TIME_WAITED NUMBER CURRENT_OBJ# NUMBER CURRENT_FILE# NUMBER CURRENT_BLOCK# NUMBER
SQL_ID VARCHAR2(13) SQL_CHILD_NUMBER NUMBER SQL_PLAN_HASH_VALUE NUMBER SQL_OPCODE NUMBER
SAMPLE_ID NUMBER SAMPLE_TIME TIMESTAMP(3)
Time
Session
SQL
Wait
SESSION_STATE VARCHAR2(7) State
Calculated
v$session
v$session

Create a Package and Insert
• Create Package– Query v$session & v$session_wait joined– Sample 1 a second– Collect into a GTT– Insert into local or remote every 15 seconds– voila

Create ASH Storage Tabledrop table ash_data;create table ash_data ( target_id number, sample_id number, sample_time date, sid number, state varchar2(20), serial# number, user# number, sql_address# varchar2(20), sql_hash number, command number, session_type number, event# number, seq# number, p1 number, p2 number, p3 number, wait_time number, row_wait_obj# number, row_wait_file# number, row_wait_block# number, program varchar2(64), module_hash number, action_hash number);

Simulation Optimizations
• Partition ASH_DATA for efficient deletion of old data
• Run compaction routines to save history– Load – Top Session– Top sql– Top waits

*** How ASH Works ***

ASH buffer
V$session_wait + extras
MMON/MMNL
v$active_session_history
wrh$_active_session_history
Only writes out 1 in 10 rows via direct path inserts

Select reads backwards
-No latching
-No read consistency
-Index on time Insert point
ASH bufferInsert one direction

Select reads backwards
Insert point
x$ addr
ASH reading

Select reads backwards
Insert point
x$ addr
ASH reading

Family of ASH Tables
v$session_wait
V$active_session_history
Wrh$active_session_history
V$session_wait_history

Session Polling View : ASH
stats
Current V$session_wait
Current session waits
Recent V$session_wait_history
Last 10 waits per session
30 Minutes on Avg
extremely variable
V$active_session_history Polling at 1 second
Last 7 Days
AWRwrh$_active_session_history
dba_hist_active_sess_history
(1 in 10 values from v$active_session_history)

ASH Tables
v$session_wait SID
SEQ#
EVENT
P1TEXT
P1
P1RAW
P2TEXT
P2
P2RAW
P3TEXT
P3
P3RAW
WAIT_CLASS_ID
WAIT_CLASS#
WAIT_CLASS
WAIT_TIME
SECONDS_IN_WAIT
STATE
v$session_wait_history SID
SEQ#
EVENT#
EVENT
P1TEXT
P1
P2TEXT
P2
P3TEXT
P3
WAIT_TIME
v$event_nameEVENT_ID
EVENT#
EVENT_ID
NAME
PARAMETER1
PARAMETER2
PARAMETER3
WAIT_CLASS_ID
WAIT_CLASS#
WAIT_CLASS
v$active_session_historySAMPLE_ID
SAMPLE_TIME
SESSION_ID
SESSION_SERIAL#
USER_ID
SQL_ID
SQL_CHILD_NUMBER
SQL_PLAN_HASH_VALUE
SQL_OPCODE
SERVICE_HASH
SESSION_TYPE
SESSION_STATE
QC_SESSION_ID
QC_INSTANCE_ID
SEQ#
EVENT#
P1
P2
P3
WAIT_TIME
TIME_WAITED
CURRENT_OBJ#
CURRENT_FILE#
CURRENT_BLOCK#
PROGRAM
MODULE
ACTION
CLIENT_ID
current 10 samples Half hour
wrh$active_session_historySNAP_D
DBIDINSTANCE_NUMBER
SAMPLE_ID
SAMPLE_TIME
SESSION_ID
SESSION_SERIAL#
USER_ID
SQL_ID
SQL_CHILD_NUMBER
SQL_PLAN_HASH_VALUE
SQL_OPCODE
SERVICE_HASH
SESSION_TYPE
SESSION_STATE
QC_SESSION_ID
QC_INSTANCE_ID
SEQ#
EVENT_ID
P1
P2
P3
WAIT_TIME
TIME_WAITED
CURRENT_OBJ#
CURRENT_FILE#
CURRENT_BLOCK#
PROGRAM
MODULE
ACTION
CLIENT_ID
7 days (disk)

Wait Time vs Time Waited• SESSION_STATE
– Waiting, on CPU– Based on WAIT_TIME
• WAIT_TIME– 0 => waiting– >0 => CPU (value is time of last wait)
• TIME_WAITED – Actual time waited for event– 0 until wait finishes – Fix up values (no one else can do this)

Oradebug
• Dump to trace file
SQL> oradebug dump ash 5
SQL> Alter session set events ‘immediate tracename ashdump level 5’;
level 5 = # of minutesloader file rdbms/demo/ashldr.ctl

INIT.ORAASHstatistics_level=Typical (default)_active_session_history=TRUE (default)_ash_sampling_interval = 1000 (default, milliseconds)_ash_enable = false; [ A dynamic parameter will turn off ASH sampling,
flushing and the V$ views on ASH ] ADDM _addm_auto_enable = false; [ A dynamic parameter to turn off automatic
ADDM runs after every AWR snapshot ] AWR _swrf_mmon_flus = FALSE ; AWR metrics _swrf_mmon_metrics= FALSE ; METRICS DB Feature Usage _swrf_mmon_dbfus = FALSE ; DB Feature Usage _swrf_on_disk_enabled = FALSE ; disable all on disk, including manual,
AWR operations

Enabling Module and Action

Client Id• Setting Client ID dbms_session.set_identifier (client_id);
• Enabling trace for a client ID
dbms_monitor.client_id_trace_enable (client_id, TRUE, FALSE);
• Enabling statistics aggregation by client id
dbms_monitor.client_id_stat_enable (client_id);
• Script to Extract Client Trace trcsess

Session Dedicated
Oracle Database Host
Oracle
SessionsS1 S2 S3 S4 S4 S5 S6
Scott John Sue Mike Randy Tim Mary

Session Dedicated trace
Oracle Database Host
Oracle
SessionsS1 S2 S3 S4 S4 S5 S6
Scott John Sue Mike Randy Tim Mary
SQL_TRACE=TRUE

Session Pooling trace
Oracle Database Host
APP Server
1
Oracle
SessionsS1 S2 S3 S4 S4 S5 S6 S7
Scott John Sue Mike Randy Tim Mary
S1, sql_trace=true

Session Pooling
Oracle Database Host
APP Server
1
Oracle
SessionsS1 S2 S3 S4 S4 S5 S6 S7
Scott John Sue Mike Randy Tim Mary
Set client_id = SCOTT
dbms_monitor.client_id_trace_enable (client_id, TRUE, FALSE);

ASH – OS and other DBs
• SQL Server
• Linux
• DB2
• Sybase

GRID – 10.2 only !
depend on session pooling via JDBC and ODP.NET

The Challenger Incident

Launch: Pressure
Midnight before January 28, 1986 Lives are on the line

List of Past Problems

Correlated with Temperatures

Trying to Show data an Analysis

Congressional Hearings Evidence

Engineers Tried to Communicate

Even Clearer

Difficult
• NASA Engineers Fail• Congressional Investigators Fail• Data is Difficult
But …
Lack of Clarity can be devastating

High Stakes
Companies Depend on Databases
• Telecoms
• Banks
• Websites
• Hospitals
• Factories
• Nuclear Facilities

Anxiety
Manager ask … WHY ?!
• Response is slow• Database is hung• Batch job behind schedule
Need answers fast !

ConclusionSVRMGR>
SVRMGR> set charwidth 12
Charwidth 12
SVRMGR> set numwidth 10
Numwidth 10
SVRMGR> Rem Select Library cache statistics. The pin hit rate shoule be high.
SVRMGR> select namespace library,
2> gets,
3> round(decode(gethits,0,1,gethits)/decode(gets,0,1,gets),3)
4> gethitratio,
5> pins,
6> round(decode(pinhits,0,1,pinhits)/decode(pins,0,1,pins),3)
7> pinhitratio,
8> reloads, invalidations
9> from stats$lib;
LIBRARY GETS GETHITRATI PINS PINHITRATI RELOADS INVALIDATI
------------ ---------- ---------- ---------- ---------- ---------- ----------
BODY 40 .95 40 .4 0 0
CLUSTER 0 1 0 1 0 0
INDEX 0 1 0 1 0 0
OBJECT 0 1 0 1 0 0
PIPE 0 1 0 1 0 0
SQL AREA 835 .938 82110 .999 0 0
TABLE/PROCED 117 .778 485 .94 0 0
TRIGGER 0 1 0 1 0 0
8 rows selected.
SVRMGR>
SVRMGR> set charwidth 27;
Charwidth 27
SVRMGR> set numwidth 12;
Numwidth 12
SVRMGR> Rem The total is the total value of the statistic between the time
SVRMGR> Rem bstat was run and the time estat was run. Note that the estat

Imagine Trying to Drive your Car if you Dashboard looked like:
SVRMGR>
SVRMGR> set charwidth 12
Charwidth 12
SVRMGR> set numwidth 10
Numwidth 10
SVRMGR> Rem Select Library cache statistics. The pin hit rate shoule be high.
SVRMGR> select namespace library,
2> gets,
3> round(decode(gethits,0,1,gethits)/decode(gets,0,1,gets),3)
4> gethitratio,
5> pins,
6> round(decode(pinhits,0,1,pinhits)/decode(pins,0,1,pins),3)
7> pinhitratio,
8> reloads, invalidations
9> from stats$lib;
LIBRARY GETS GETHITRATI PINS PINHITRATI RELOADS INVALIDATI
------------ ---------- ---------- ---------- ---------- ---------- ----------
BODY 40 .95 40 .4 0 0
CLUSTER 0 1 0 1 0 0
INDEX 0 1 0 1 0 0
OBJECT 0 1 0 1 0 0
PIPE 0 1 0 1 0 0
SQL AREA 835 .938 82110 .999 0 0
TABLE/PROCED 117 .778 485 .94 0 0
TRIGGER 0 1 0 1 0 0
8 rows selected.
SVRMGR>
And is updated once and hourAnd is updated once and hour

Or This?
SVRMGR>
SVRMGR> set charwidth 12
Charwidth 12
SVRMGR> set numwidth 10
Numwidth 10
SVRMGR> Rem Select Library cache statistics. The pin hit rate shoule be high.
SVRMGR> select namespace library,
2> gets,
3> round(decode(gethits,0,1,gethits)/decode(gets,0,1,gets),3)
4> gethitratio,
5> pins,
6> round(decode(pinhits,0,1,pinhits)/decode(pins,0,1,pins),3)
7> pinhitratio,
8> reloads, invalidations
9> from stats$lib;
LIBRARY GETS GETHITRATI PINS PINHITRATI RELOADS INVALIDATI
------------ ---------- ---------- ---------- ---------- ---------- ----------
BODY 40 .95 40 .4 0 0
CLUSTER 0 1 0 1 0 0
INDEX 0 1 0 1 0 0
OBJECT 0 1 0 1 0 0
PIPE 0 1 0 1 0 0
SQL AREA 835 .938 82110 .999 0 0
TABLE/PROCED 117 .778 485 .94 0 0
TRIGGER 0 1 0 1 0 0
8 rows selected.
SVRMGR>


3 Types of Collecting
• Cumulative
• Current
• Sampling Current

Cumulative
• Cumulative Counters– v$sysstat– v$system_event– Electric meter

Cumulative Need Deltas
Time
Delta
Rate = Delta/time
Delta = value_time_B – value_time_A

Counters and Rates
• Statistics - good– Transactions/sec– Commits/sec– Watts/month
• Waits – weird, either– Delta = Seconds spend over time period– Rate = Centi-secs/sec

Statistics & Waits are Counters
Statistics just keep growing
physical_readsbuffer busy wait
Watts
v$sysstat
V$system_event
Electricity meter

Current
• Current– v$session_wait– Current Stats (logons current,opened cursors
current)– temperature

Sampling
• Sampling– ASH– Sunny days a year per city


