Page 1
Ash Pond Complex
Initial Safety Factor Assessment
Conesville Generating Plant
Conesville, Ohio
S&ME Project No. 7217-15-007A
Prepared for:
American Electric Power
1 Riverside Plaza, 22nd Floor
Columbus, Ohio 43215
Prepared by:
S&ME, Inc.
6190 Enterprise Court
Dublin, OH 43016
December 30, 2015
Page 2
Ash Pond Complex Initial Safety Factor Assessment
Conesville Power Plant
Conesville, Ohio
S&ME Project No. 7217-15-007A
December 30, 2015 ii
Table of Contents
1.0 Introduction ............................................................................................................ 1
1.1 Background ....................................................................................................................... 1
1.2 Location and Geologic Conditions ................................................................................. 1
1.3 Previous Investigations .................................................................................................... 2
2.0 Scope of Work ........................................................................................................ 2
3.0 Information Review and Site Visit .................................................................... 3
4.0 Safety Factor Assessment ..................................................................................... 4
4.1 Limit Equilibrium Analyses ............................................................................................ 4
4.2 Liquefaction Susceptibility of Embankment Soils........................................................ 5
4.3 Stability Analysis .............................................................................................................. 6
5.0 Action Value Recommendations ........................................................................ 6
5.1 Section A-A ........................................................................................................................ 7
5.2 Section B-B ......................................................................................................................... 7
5.3 Action Level Summary .................................................................................................... 8
6.0 References ............................................................................................................... 9
7.0 Certification .......................................................................................................... 10
List of Tables Table 4-1 – Safety Factor Summary .......................................................................................................... 6
Table 5-1: Summary of Existing Piezometers .......................................................................................... 7
Table 5-2 – Recommended Piezometer Reading Action Level for FOS = 1.5 ...................................... 8
Table 5-3 – Recommended Piezometer Reading Action Level for FOS = 1.0 ...................................... 9
Appendices Appendix I – Safety Factor Assessment Figures
Appendix II – Action Value Determination
Appendix III – Liquefaction Screening
Page 3
Ash Pond Complex Initial Safety Factor Assessment
Conesville Power Plant
Conesville, Ohio
S&ME Project No. 7217-15-007A
December 30, 2015 1
1.0 Introduction
1.1 Background
In April of 2015, the US EPA formally published national regulations for disposal of coal combustion
residuals (CCR) from electric facilities. As part of the rule, the owner or operator of the CCR unit must
obtain a certification from a qualified professional engineer stating that aspects of the CCR
impoundments are in accordance with the rules. Based on our understanding of the Request for Fee
Estimate received from AEP on April 29, 2015, AEP specifically requested P.E. certification to fulfill the
requirements of 40 CFR § 257.73(e), Periodic Safety Factor Assessments. In the employ of BBC&M
Engineering, Inc., the undersigned engineers conducted site investigations at the ash pond complex in
2009 and 2010. Due to our familiarity with the site, S&ME was selected to perform the Safety Factor
Assessment for this facility. S&ME understands that certification and/or documentation for other
structural integrity criteria will be performed by AEP or other consultants.
1.2 Location and Geologic Conditions
The Conesville Generating Plant is located in Conesville, Ohio in Coshocton County, east of the
Muskingum River, across from the town of Conesville. Adjacent to the plant is an approximate 100 acre
ash pond complex within which are a number of individual lagoons: Three fly ash ponds denoted as Fly
Ash Pond A, B and C, a bottom ash pond, and a Clearwater pond. The separator dike between each
lagoon is constructed of fly ash and bottom ash. Flow is conveyed between the ponds either through a
pipe or outlet structures. The overall complex is surrounded by an embankment ranging in height from
15 to 40 feet above the natural grade which has an overall length of approximately 9,300 feet. The ponds
are regularly dredged and the recovered fly ash and bottom ash is either being beneficially re-used or
taken to the nearby Abandoned Mine Lands reclamation projects or the nearby residual waste landfill.
The ponds are completely isolated from exterior surface water inflow.
The natural soils at the site generally consist of a relatively thin layer of alluvium silt and clay over glacial
outwash deposits of variable thickness overlying the bedrock surface. The alluvium clays and silts consist
of sedimentary matter and are generally no more than 10 feet thick, while the outwash materials typically
consist of sand, gravel and silt deposits. The ash pond complex is located near the edge of a buried
bedrock value, and was constructed within the present floodplain of the Muskingum River. Based on
available geologic literature, the glacial outwash extends to bedrock, estimated to be roughly 80 feet
below the ground surface. The upper most bedrock at the ash pond complex most likely consists of shale
and/or sandstone belonging to the Allegheny or Pottsville Group of the Pennsylvanian Period.
Page 4
Ash Pond Complex Initial Safety Factor Assessment
Conesville Power Plant
Conesville, Ohio
S&ME Project No. 7217-15-007A
December 30, 2015 2
Figure 1-1 – Location Map – Conesville Ash Pond Complex
1.3 Previous Investigations
In 2009, the undersigned engineers, when in the employment of BBC&M Engineering, Inc. completed a
limited subsurface investigation and analysis of the Ash Pond Complex. This assessment, dated July 28,
2009, concluded that at the two (2) cross-section embankments considered, the embankment exhibited
adequate factors of safety against slope failure under steady-state seepage and seismic loading
conditions relative to typical US Army Corps of Engineers requirements. In 2010, BBC&M Engineering, Inc.
performed additional geotechnical analyses of the ash pond complex. As part of this work, the initial
exploration was supplemented with additional borings and laboratory testing, and updated slope stability
analyses examining additional failure modes and cross-sections, were performed. A report documenting
the additional geotechnical analysis, dated December 22, 2010, was submitted as an addendum to the
2009 report.
2.0 Scope of Work
In accordance with AEP’s request, the following work items were performed by S&ME:
1. S&ME completed a cursory review of previously conducted assessment work performed by the
undersigned engineers, as well as a limited number of construction documents made available by
AEP.
Plant
Ash Pond
Complex
Page 5
Ash Pond Complex Initial Safety Factor Assessment
Conesville Power Plant
Conesville, Ohio
S&ME Project No. 7217-15-007A
December 30, 2015 3
2. S&ME visited the site along with personnel from AEP. The site visit was not a formal inspection, but
rather served to verify that no significant modifications or changed conditions have taken place since
the previous investigations.
3. Action values relating to instrumentation measurements were determined based on slope stability
analyses using the critical cross-section and examination of historical piezometer readings provided
by AEP.
4. Upon completing Tasks 1 through 4, S&ME’s determined that there was sufficient information to
certify the structural integrity of the surface impoundment in accordance with the requirements of 40
CFR § 257.73(e). A separate letter has been prepared to this effect.
3.0 Information Review and Site Visit
To support the safety factor assessment, S&ME conducted a cursory review of previous documents
relating to the bottom ash pond and conducted a site visit at the facility. AEP provided S&ME with the
following documents:
♦ Structural Ash Pond Modification Construction Drawings (Dwg. No. SY-110 to ST-115, Sheet No. 34
through 39), Black and Veatch, 1972.
♦ Borings Log Series SB-1 and AB-1 from original design were available for review, but no design
report was available.
♦ Report of Geotechnical Study of Raising Fly Ash Pond Water Elevation, Woodward-Clyde
Consultants, October 1983.
♦ Dam Inspection and Maintenance Program – Seepage at Downstream Toe of Coal Haul Road Dike –
Installation of piezometers 11, 12, 13 and 14, April 1987
♦ Ash Pond Complex Investigation and Analysis, Installation of piezometers 0901, 0902, 0903 and
0904, BBC&M Engineering, Inc., July, 2009
♦ Assessment of Dam Safety Coal Combustion Surface Impoundments (Task 3) Final Report, American
Electric Power, Conesville Generating Station, Prepared by: Clough Harbour, & Associates.,
February, 2010
♦ Addendum to Ash Pond Complex Investigation, BBC&M Engineering, Inc. December, 2010
♦ Bottom Ash Pond, Northwest Dike Improvements, Final Design Report, S&ME, Inc., May 2013.
♦ Instrumentation Data Summary (Figure 6), Excerpt from Ash Pond Complex Inspection Report, AEP,
2014
♦ Bottom Ash Pond Complex Northwest Dike Improvements As-Built Drawings (DWG No. 456-30240
to 456-30245 (6 Sheets)), S&ME, 2015
On July 7, 2015, the undersigned S&ME personnel met with Mr. Bill Smith (AEP Civil Engineering) and Mr.
Cyril Burkhart (Conesville Landfill Manager) at the Conesville Plant and conducted a site visit at the ash
pond complex. The participants discussed and observed the operations of the each internal lagoon and
the separator dikes, including the hydraulic structures within the ponds. The crest and inboard and
outboard slopes were observed and no significant geometry changes appeared to have been made since
the 2009 and 2010 investigations, with the exception of the construction of a new embankment at the
southwest corner, which was designed by S&ME and permitted through ODNR Dam Safety. While the
site visit was not considered to be a formal inspection, visual observations of the ash pond complex did
Page 6
Ash Pond Complex Initial Safety Factor Assessment
Conesville Power Plant
Conesville, Ohio
S&ME Project No. 7217-15-007A
December 30, 2015 4
not reveal any dam safety concerns, and the embankments appear to be in a similar conditions at the
cross-sections analyzed in 2009 and 2010 when our previous investigations were performed.
4.0 Safety Factor Assessment
As part of the safety factor assessment, S&ME completed Parts 1 and 2 of Section 257.73(e) of the Final
Rules for the Disposal of Coal Combustion Residuals from Electric Utilities published on April 17, 2015 in
the Federal Register. In accordance with the Rule, the analysis was performed for the critical cross-
sections(s) that are anticipated to be most susceptible of all cross-sections to structural failure based on
appropriate engineering considerations. The Rule specified the following loading conditions for analysis:
i. Static Factor of Safety under the long-term, maximum storage pool loading condition must equal
or exceed 1.50.
ii. Calculated static factor of safety under the maximum surcharge pool loading condition must
equal or exceed 1.50
iii. The calculated seismic factor of safety must equal or exceed 1.00
iv. For dikes constructed of soils susceptible to liquefaction, the calculated liquefaction factor of
safety must equal or exceed 1.20.
4.1 Limit Equilibrium Analyses
Our 2009 Investigation Report and the 2010 Addendum discuss in detail the subsurface investigation,
laboratory testing, parameter justification, seepage analyses and limit equilibrium slope stability analyses
that were performed to develop safety factors for the ash pond complex embankments. In summary, three
(3) sections on the northeast embankment, four (4) sections on the southeast embankment as well as one
(1) section on the southwest embankment were studied The northwest embankment rests at the toe of
the adjacent FGD Waste Area and therefore was not analyzed. Subsurface information for each section
was generally obtained by performing borings through the crest and toe of the embankment.
Additionally, four observation wells were installed to obtain groundwater readings within the
embankment and foundation. A copy of the Plan of Borings is included in this report for reference
purposes. Based on a review of all eight (8) sections explored, five (5) were selected for detailed limit
equilibrium stability analysis, one through the west side and one through the south side.
Prior to performing the limit equilibrium stability analyses, seepage analyses were performed to develop a
better understanding the likely phreatic surface within the embankment and foundation. The models were
calibrated by comparing both finite element and user-generated phreatic surfaces. Available groundwater
data was generally considered sufficient to establish the position of the phreatic surface and no significant
difference was observed between minimum factors of safety based on finite element and user-generated
phreatic surfaces developed in the 2009 investigation. As such, slope stability runs were performed on all
five (5) sections with a user-generated groundwater table matching the observed conditions. It should
also be noted that, the pool level within the pond is typically maintained a few feet below the crest for
operational purposes and varies between the different ponds within the complex. However, the analysis
was conservatively performed utilizing the maximum permitted pool elevation.
Page 7
Ash Pond Complex Initial Safety Factor Assessment
Conesville Power Plant
Conesville, Ohio
S&ME Project No. 7217-15-007A
December 30, 2015 5
The shear strength parameters developed for all soil layers were evaluated in consideration of the
laboratory testing results and subsurface investigation data (hand penetrometer measurements and
standard penetration tests). Critical failure surfaces were located through a deterministic search, with no
limitations on failure depth or failure surface location. The results are based on the maximum permitted
pool elevations, the groundwater measurements recorded from the observation wells and the subsurface
soil layer geometry as could be delineated from the existing subsurface information.
4.2 Liquefaction Susceptibility of Embankment Soils
S&ME evaluated the liquefaction potential of the embankment soils to liquefy during a seismic event. The
embankment material consists of three different materials defined within this report as cohesive
embankment fill, granular embankment fill and fly/bottom ash fill.
The cohesive embankment fill is classified as a fined grained material and the recovered samples with
gradation testing were evaluated following guidelines presented in the 2003 NEHRP (National Earthquake
Hazards Reduction Program) Recommended Provisions for Seismic Regulations for New Buildings and
Other Structures. The provisions in Chapter 7 indicate that liquefaction potential in fine grained soils
should be assessed provided the following criteria are met (Seed and Idriss 1982; Seed et al., 1983): the
weight of the soil particles finer than 0.005 mm is less than 15 percent of the dry unit weight of a
specimen of the soil; the liquid limit of soil is less than 35 percent; and the moisture content of the in-
place soil is greater than 0.9 times the liquid limit. If all three (3) of these criteria are not met, the soils
may be considered non-liquefiable.
Laboratory testing results from 9 samples were available from the 2009 and 2010 investigation for
evaluation of the screening criteria. Of the 9 samples, 6 samples contained data to check all three
screening criteria, one (1) sample contained data to check two (2) screening criterion, and two (2) samples
contained data to check one (1) screening criteria. Based on the results of the screening, no sample met
all 3 criteria; therefore, the embankment fill can be considered non-liquefiable.
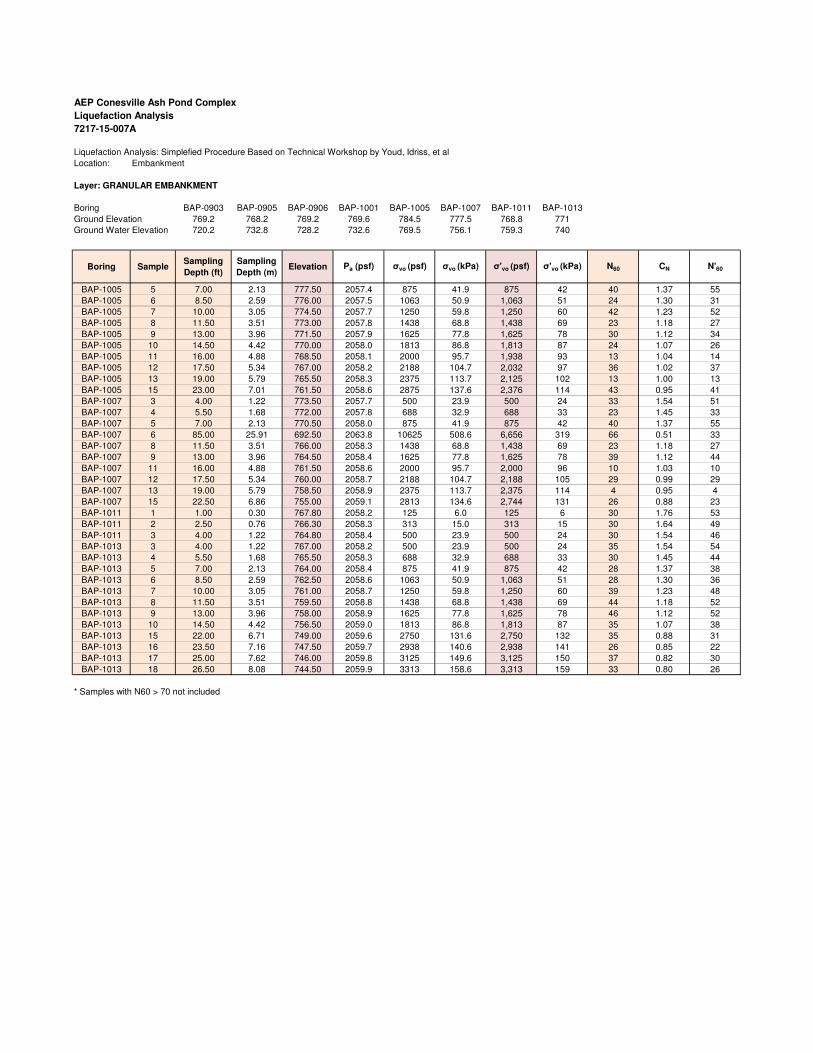
Liquefaction flow failure susceptibility for the granular embankment fill was evaluated as recommended
by Olson and Stark (2003) using the Fear and Robertson (1995) boundary. The boundary line provides an
estimate on whether or not the soils are likely to dilate or contract during seismic shaking. The plot
indicates the majority of the points are in the dilative soil state, and thus not susceptible to liquefaction.
Therefore, no further analysis was performed for the granular embankment fill.
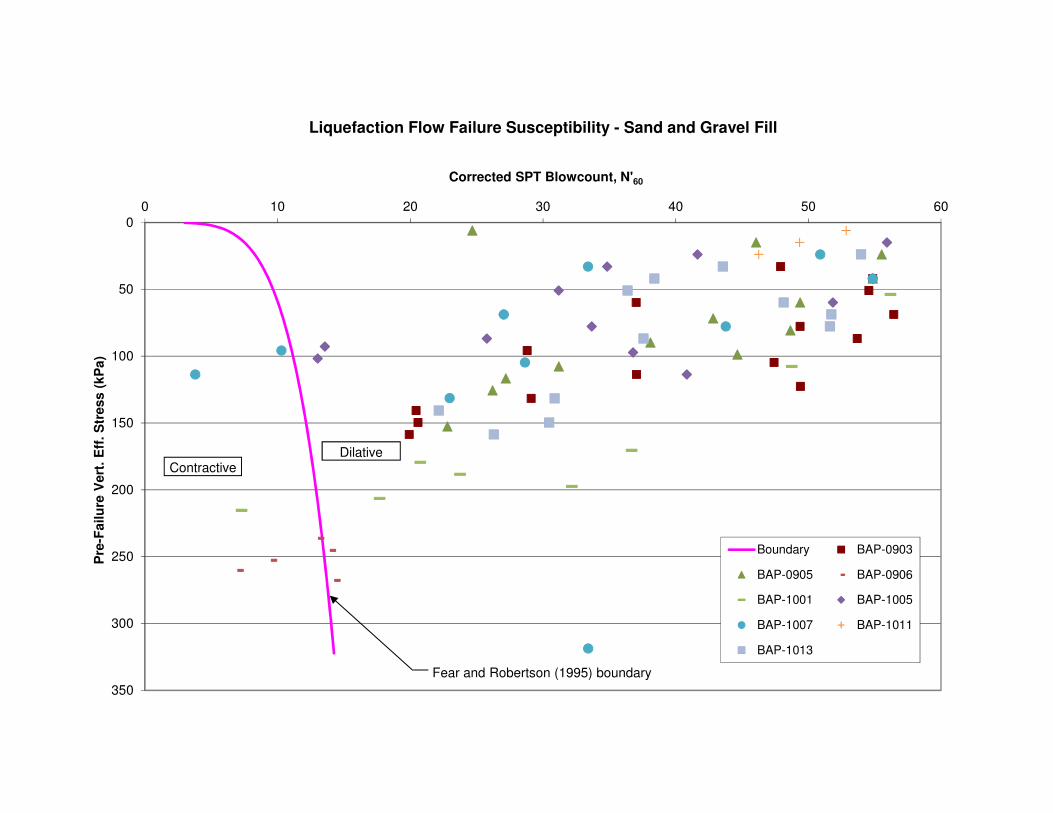
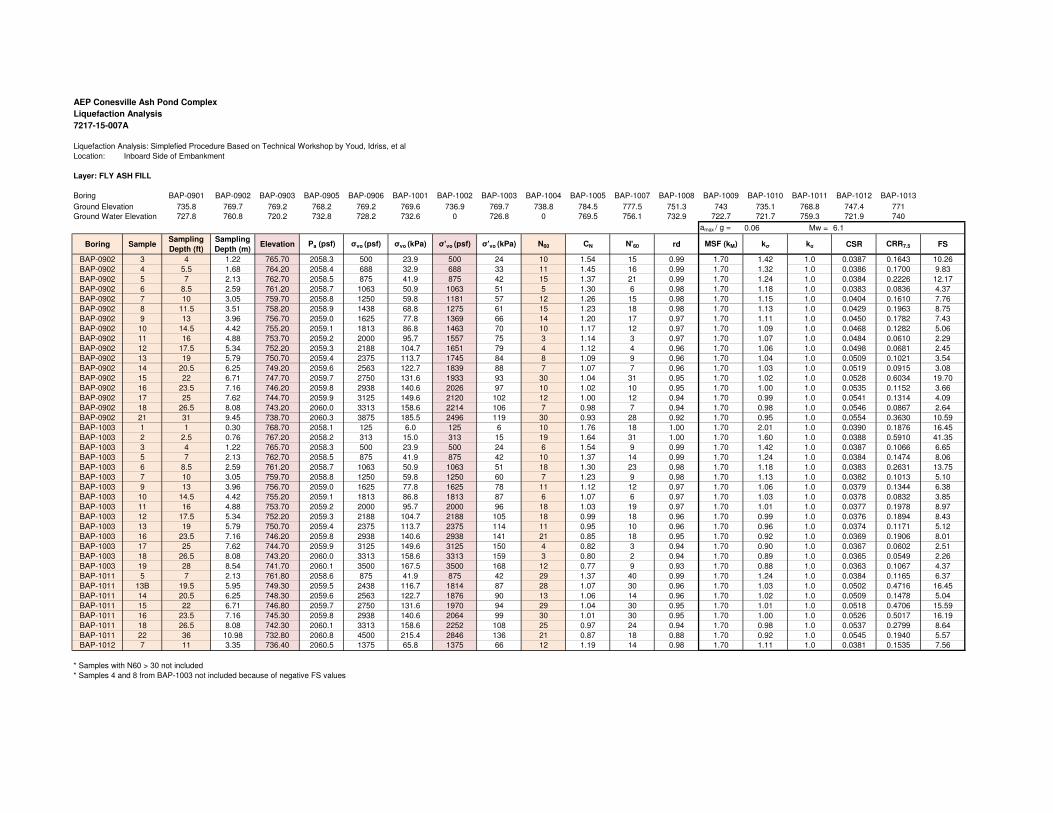
Liquefaction flow failure susceptibility could not be ruled our based on the Fear and Robertson (1995)
boundary line for the fly/bottom ash fill in the ash pond embankments. Therefore, the ability of this later
to resist liquefaction was determined using the simplified procedure based on recommendations by Youd,
Idriss, et al. (2001) as documented in the publication 'Liquefaction Resistance of Soils: Summary Report
from the 1996 NCEER and 1998 NCEER/NSF Workshops on Evaluation of Liquefaction Resistance of Soils'.
The simplified procedure incorporates corrected SPT blow counts and the seismic coefficients of
acceleration and magnitude. Liquefaction resistance is determined as a factor of safety, where calculated
factors of safety greater than 1.3 are considered resistive to liquefaction.
Based on the corrected SPT blow counts obtained during the investigation and the seismic coefficients for
the site, factors of safety ranging from 2.2 to 41.3 were calculated for the fly/bottom ash fill, thus
Page 8
Ash Pond Complex Initial Safety Factor Assessment
Conesville Power Plant
Conesville, Ohio
S&ME Project No. 7217-15-007A
December 30, 2015 6
indicating the granular fill soils are not susceptible to liquefaction. The supporting calculations are
included with this report in Appendix III.
4.3 Stability Analysis
As part of the safety factor assessment, S&ME reviewed the existing subsurface investigation and analysis
reports completed in 2009 and 2010. Based on these reports, Sections B and D were determined to be
the critical sections. Section B was the critical cross-section for the static analyses and Section D is the
critical cross-section for seismic analyses.
Based on our previous investigations and current assessment of the Ash Pond Complex at the Conesville
Generating Plant, S&ME certifies that this assessment meets the requirements of 40 CFR § 257.73(e),
Periodic Safety Factor Assessments. A summary of the computed safety factors for the critical cross-
section is provided in Table 5-1. Also included in the table are the minimum values defined in 40 CFR §
257.73(e)(1) subparts (i) through (iv). Graphical output corresponding to the analysis cases are presented
in Appendix I.
Table 4-1 – Safety Factor Summary
Cross-Section Analysis Case
Minimum Safety
Factor
Computed Safety
Factor
B-B Long-term, maximum
storage pool 1.50 1.55
B-B Maximum surcharge
pool* 1.40 1.55
D-D Pseudo-static seismic
loading 1.00 1.13
N/A Liquefaction 1.20 Not Liquefiable
*Based on surcharge pool of 3 feet as determined from design storm with consideration of plant inflows
in 2010 addendum report.
5.0 Action Value Recommendations
As requested, S&ME also has developed recommendations for establishing action values in relation to the
existing instrumentation measurements at the Conesville Ash Pond Complex. AEP provided historic data
for eight (8) open standpipe piezometers which are currently monitored quarterly as part of AEP’s
inspection program at the Ash Pond Complex. The most recent instrumentation data table provided by
AEP is included in Appendix II. S&ME reviewed the historic data which spans from March, 2009 to
September, 2014. Five (5) piezometers are located on the southeast embankment near Section B-B, two
(2) piezometers are on the northeast embankment near cross-section A-A and one piezometer is on the
southwest embankment, near cross-section H-H. The piezometers and cross-sections are summarized in
Table 5-1 and are shown on the base cross-sections in Appendix II. The piezometer installation data was
obtained from the documents listed in the historical information review, in a prior section of this report.
Page 9
Ash Pond Complex Initial Safety Factor Assessment
Conesville Power Plant
Conesville, Ohio
S&ME Project No. 7217-15-007A
December 30, 2015 7
Table 5-1: Summary of Existing Piezometers
Embankment Cross-
Section
Piezometers
(Date of Installation) Location Screened
Interval (Elev.)
Date of
Installation
Northeast A-A 0901 Toe 709.1 – 729.1 2009
0902 Crest 701.5 – 761.5 2009
Southeast B-B
0903 Crest 703.2 – 763.2 2009
0904 Toe 738.8 – 743.3 2009
P-11 Crest 724.3 – 731.3 1988
P-12 Crest 743.9 – 749.5 1988
P-13 Outboard
Slope 749.4 – 759.4 1988
Southwest H-H B-7 Crest 715.1 - 724.6 1983
Upon review of the existing piezometers, it was determined that based on the screened interval and
historical measurements, that B-7 and P-11 are most likely monitoring the groundwater table beneath the
ash pond embankment. As a result, no action levels were determined for these piezometers, as the
structural stability assessment is based on the phreatic surface within the embankment and is relatively
unaffected by the underlying groundwater table. However, it is recommended that they continue to be
monitored and recorded as the information obtained is valuable for any future analysis.
An action level determination was performed for the remaining piezometers at Sections A-A and B-B to
determine the action levels that would possibly represent a condition where the minimum factors of
safety are not achieved at the analyzed embankment cross-section. Slope stability analysis was performed
using the critical cross-section under static loading conditions to determine a phreatic surface that would
correspond to factor of safety equal to 1.5 and a factor of safety equal to 1.0. The elevation of the
simulated phreatic surface at the piezometer locations could then be interpreted as an action level since
the required minimum factor of safety is 1.5. The graphical slope stability output for both cases and
historic piezometer readings are presented in Appendix II.
5.1 Section A-A
At cross-section A-A, piezometer 0902 is located at the crest of the embankment and piezometer 0903 is
at the toe of the slope. Based on historical measurements provided by AEP, piezometer 0902 typically
records an elevation equal to or within 1-2 feet of the pool level in the pond. This piezometer is located
on the inboard side of the haul road at the crest of the slope. Measurements obtained in piezometer
0901 appear to have ranged from El. 725 to El. 732 since monitoring began in June, 2009. The ground
surface at piezometer 0901 is approximately El. 736.
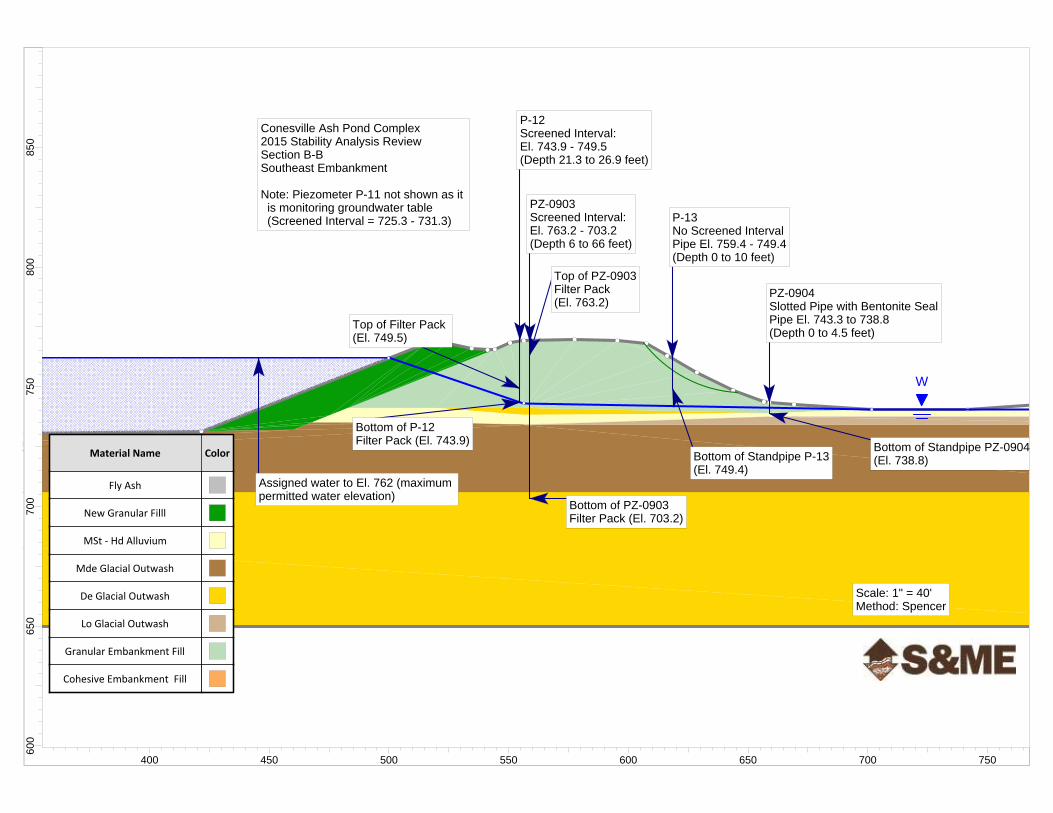
5.2 Section B-B
At cross-section A-A, piezometers 0903 and P-12 are located along the crest of the embankment,
piezometer P-13 is located along the outboard slope and piezometer 0904 is located at the toe of the
slope. It should be noted that the 09-series piezometers are at Cross-Section B-B and P-series
Page 10
Ash Pond Complex Initial Safety Factor Assessment
Conesville Power Plant
Conesville, Ohio
S&ME Project No. 7217-15-007A
December 30, 2015 8
piezometers are not at the exact same cross-section but rather in the same vicinity of Cross-Section B-B,
as shown on the revised plan of explorations included in Appendix I. Piezometer P-13 and 0904 were only
installed to depths of 10 and 4.5 feet, respectively. Both of these piezometers were slotted along their
entire length and the natural soil cuttings were used as backfill. In contrast, piezometers P-12 and 0903
were backfilled with a filter pack consisting of sand at the intervals provided in Table 5-1. Piezometer P-
12 is screened within the embankment soils, while piezometer 0903 is screened through the embankment,
alluvium and sand and gravel layers.
Based on historical measurements provided by AEP, piezometer 0903 and P-12 typically record an
elevation near El. 747 to 748 within the embankment fill layer. Piezometer P-13 typically records a
measured elevation near or slightly below El. 750. Since the installation log for P-13 indicates the bottom
of the riser was installed at Elev. 749.42, the recorded measurements indicate this piezometer/standpipe is
essentially ‘dry.’ Finally, the piezometer/standpipe 0904 at the toe of the slope for Section B-B has
historically recorded a measurement at or near the existing ground surface. This measurement was
analyzed as part of the stability analysis and acceptable factors of safety were achieved.
5.3 Action Level Summary
To reduce the factor of safety to a value of 1.5 at each cross-section, slope stability analyses were
performed using the critical cross-section under static loading conditions to determine a phreatic surface
that would correspond to factor of safety equal to 1.5 and 1.0. The phreatic surface determined from the
historical measurements and analyzed as part of the stability analysis for the existing conditions was
raised to reflect an elevated water level for both cross-sections. As shown in the attached analysis in
Appendix II measurement levels were determined that would reflect a condition where the factor of safety
could be reduced to values below the minimum required by the CCR rules. While these action levels in
Table 5.2 (FOS = 1.5) suggest inadequate factors of safety for slope stability, they are intended to signal a
changed condition that would require further evaluation, such as increased monitoring, evaluation, visual
inspections and possibly investigation of the pond embankments. The action levels in Table 5.3 (FOS =
1.0) are intended to signal a condition where embankment failure is imminent and emergency action must
be taken before these levels are reached.
Table 5-2 – Recommended Piezometer Reading Action Level for FOS = 1.5
Cross-Section Piezometer Piezometer Reading Action Level
(Elevation, Ft)
A-A 0901 733
0902 Above Existing Pool Level
B-B
P-11 N/A
0903 753
P-12 753
P-13 751
0904 743.5 (Above Existing Ground Surface)
H-H B-7 N/A
Page 11
Ash Pond Complex Initial Safety Factor Assessment
Conesville Power Plant
Conesville, Ohio
S&ME Project No. 7217-15-007A
December 30, 2015 9
Table 5-3 – Recommended Piezometer Reading Action Level for FOS = 1.0
Cross-Section Piezometer Piezometer Reading Action Level
(Elevation, Ft)
A-A 0901 736 (Above Existing Ground Surface)*
0902 Above Existing Pool Level
B-B
P-11 N/A
0903 759
P-12 759
P-13 755
0904 743.5 (Above Existing Ground Surface)#
H-H B-7 N/A
*Saturation of outboard embankment slope below El. 745. #Saturation of outboard embankment slope below El. 753.
6.0 References
Fear, C.E., and Robertson, P.K. (1995). “Estimating the undrained shear strength of sand: A theoretical
framework.” Canadian Geotechnical Journal, 32(4), pp. 859-870.
Seed, H.B., and Idriss, I.M. (1982) “Ground motions and soil liquefaction during earthquakes.” Earthquake
Engineering Research Institute Monograph, Oakland, CA.
Seed, H.B., Idriss, I.M. and Arango, I. (1983). “Evaluation of Liqiefaction Potential Using Field Performance
Data.” J. Geotech. Engrg., 109(3), 458-482
Seed, H. B., Tokimatsu, K., Harder, L. F., and Chung, R. M., 1985, “Influence of SPT Procedures in Soil
Liquefaction Resistance Evaluations,” Journal of Geotechnical Engineering, ASCE, Vol. 111, No. 12, pp.
1425 – 1445.
Olson, S.M., and Stark, T.D. 2003. Yield Strength Ratio and Liquefaction Analysis of Slope and
Embankments. Journal of Geotechnical and GeoEnvironmental Engineering, ASCE, 129(8) 727-737.
Youd, L.T., Idriss, I. M., 2001 “Liquefaction Resistance of Soils: Summary Report from the 1996 NCEER and
1998 NCEER/NSF Workshops on Evaluation of Liquefaction Resistance of Soils.” Journal of Geotechnical
and GeoEnvironmental Engineering, October, 2001, pp. 817 - 833.
Youd, L.T.. Liquefaction Hazard Assessment." April 8, 2008 Presentation, Northern Kentucky
Geotechnical Group.
Page 14
Appendix I – Safety Factor Assessment Figures
Page 15
P-11
COUNTY ROAD 273
FLY ASH POND 'C'
BOTTOM ASH POND
C
L
E
A
R
W
A
T
E
R
P
O
N
D
FLY ASH POND 'B'
FLY ASH POND 'A'
B-2
B-3
B-5
B-6
B-5A
81-3
FGD LANDFILL
81-4
81-5
81-6
81-1
81-2
P-12
LEGEND
BORING NUMBER AND LOCATION
BBCM 2010 INVESTIGATION
Revision DescriptionDate No. Approved By
BB
C&
M F
ile
na
me
: \\D
UB
OH
\C
AD
Da
ta
\P
ro
je
cts\7
21
7-C
ivil C
olu
mb
us\7
21
7-1
5-0
07
\C
on
esville
\7
21
7-1
5-0
07
A C
on
esville
P
OB
.d
wg
L
ayo
ut: 2
2x3
4
Plate Number
of
Project Number:
Total Sheets
Date Last Updated:
Designed By:
Drawn By:
Approved By:
Plot Scale:
Drawing Scale:
9-17-2015
MTR
MGR
1" = 200'
7217-15-007A
PLAN OF EXPLORATIONS
2010 Follow-Up Subsurface Investigation
Ash Pond Complex
AEP Conesville Plant
Conesville, Ohio
American Electric Power Service Corp.
Columbus, Ohio
1
1
1:1
CV-BAP-1001
400'200'0
HORIZONTAL
SCALE IN FEET
BORING NUMBER AND LOCATION
BBCM 2009 INVESTIGATION
CV-BAP-0901
BORING NUMBER AND APPROXIMATE LOCATION
WOODWARD CLYDE 1983 INVESTIGATION
B-1
CONE PENETROMETER PROBE NUMBER AND
APPROXIMATE LOCATION: WOODWARD-CLYDE 1983
INVESTIGATION
C-1
Note: Drawing recreated from AEP drawing '41798_Conesville_rev1'
'SOFT ALLUVIUM' CHARACTERISTICS
Boring
Depth to Top of
Layer*
Top of Layer
Elevation
Total Layer
Thickness
CV-BAP-0901
1.5 731.8 1.0
CV-BAP-0902
Not Encountered 0 0
CV-BAP-0903
5.5 735.7 1.5
CV-BAP-0904
N/A 0 0
CV-BAP-0905
Not Encountered - -
CV-BAP-0906
Not Encountered - -
CV-BAP-1001
Not Encountered - -
CV-BAP-1002
9.6 723.9 0.5
CV-BAP-1003
2.5 730.7 2.5
CV-BAP-1004
8.5 724.8 5.6
CV-BAP-1005
26 / 28.6 735 / 733 0.8 / 1.3
CV-BAP-1006
Not Performed - -
CV-BAP-1007
Not Encountered - -
CV-BAP-1008
6 / 19.5 742.8 / 729 0.5 / 2
CV-BAP-1009
0.3 / 13 738.7 / 726 1.2 / 7.5
CV-BAP-1010
0 732.2 3.5
CV-BAP-1011
Not Encountered - -
CV-BAP-1012
Not Encountered - -
CV-BAP-1013
9.8 724.0 2+
B-4
Not Encountered - -
B-5
Not Encountered - -
B-6
5 737 17
B-7
Not Encountered - -
'SOFT ALLUVIUM' LAYER DEFINED BY HAND PENETROMETER VALUES
RANGING FROM 0.0 TSF TO 1.0 TSF (VERY SOFT TO MEDIUM STIFF).
*DEPTH TO TOP OF LAYER IS DEPTH BELOW NATURAL GROUND SURFACE ENCOUNTER
BORING NUMBER AND APPROXIMATE LOCATION
BLACK AND VEATCH STRUCTURAL MODIFICATIONS
DESIGN, 1972
SB-1, AB-1
BORING NUMBER AND APPROXIMATE LOCATION
PREVIOUS INVESTIGATION
81-1
B
1
A
1
D
1
F
1
G
1
E
1
H
1
C
1
PIEZOMETER NUMBER AND APPROXIMATE
LOCATION, AMERICAN ELECTRIC POWER SEEPAGE
INVESTIGATION, 1987 (P-11, P-12, P-13, P-14)
P-11
WWW.SMEINC.COM
6190 ENTERPRISE COURT
DUBLIN, OH 43016
(614) 793-2226
ENGINEERING FIRM LICENSE NUMBER: 03530
Page 16
1.554
1.800
2.087
1.554
W
250.00 lb/ft2 1.554
1.800
2.087
1.554
Conesville Ash Pond Follow-Up InvestigationSlope Stability Analysis
Section B (BAP-0903, 0904, 0905, 1009)Static LoadingOutboard Slope
Est. Bedrock
Method: SpencerScale: 1" = 50'
BBCM Engineering
Minimum Failure Surface Depth = 6 ftSafety Factor
0.0000.2500.5000.7501.0001.2501.5001.7502.0002.2502.5002.7503.0003.2503.5003.7504.0004.2504.5004.7505.0005.2505.5005.7506.000+
900
850
800
750
700
650
600
550
300 350 400 450 500 550 600 650 700 750 800
2010 Investigation Result
Page 17
1.5541.554
W
250.00 lb/ft2
187.20 lb/ft2
1.5541.554
Conesville Ash Pond Follow-Up InvestigationSlope Stability Analysis
Section B (BAP-0903, 0904, 0905, 1009)Maximum Surcharge PoolOutboard Slope
Est. Bedrock
Method: SpencerScale: 1" = 50'
BBCM Engineering
Operating Pool El. = 764 ftSurcharge Pool El. = 767 ft
Surcharge pool of 3 feet represented by asurcharge load of 187.2 psf.
Safety Factor0.0000.2500.5000.7501.0001.2501.5001.7502.0002.2502.5002.7503.0003.2503.5003.7504.0004.2504.5004.7505.0005.2505.5005.7506.000+
900
850
800
750
700
650
600
300 350 400 450 500 550 600 650 700 750
2010 Investigation Result
Page 18
1.1351.135
W
1.1351.135
Conesville Ash Pond Follow-Up InvestigationSlope Stability Analysis
Section D (BAP-1003, 1004, 1013)Steady State Seepage with Seismic LoadingPsuedo-Static Force Approach
-Outboard Slope
Est. Bedrock
Method: SpencerScale: 1" = 50'
BBCM Engineering
Safety Factor0.0000.2500.5000.7501.0001.2501.5001.7502.0002.2502.5002.7503.0003.2503.5003.7504.0004.2504.5004.7505.0005.2505.5005.7506.000+
950
900
850
800
750
700
650
600
-150 -100 -50 0 50 100 150 200 250 300 350
0.06
2010 Investigation Result
Page 19
Appendix II – Action Value Determination
Page 20
720
725
730
735
740
745
750
755
760
765
770
ELE
VA
TIO
N, F
EE
T
TIME, QUARTERLY
FIGURE 6 - INSTRUMENTATION DATA.
FAP CWP B-7 P-11 P-12 P-13 B-0901 B-0902 B-0903 749.21 BAP
Page 21
PZ-0901
Screened Interval:
El. 729.1 - 709.1
(Depth 6.7 to 26.7 feet)
Bottom of PZ-0901 (El. 709.1)
Top of Screened Interval
(El. 729.1)
Conesville Ash Pond Complex
2015 Stability Analysis Review
Section A-A
Northeast Embankment
PZ-0902
Screened Interval:
El. 761.5 - 701.5
(Depth 8.2 to 68.2 feet)
Scale: 1" = 40'
Method: Spencer
Top of Screened Interval
(El. 761.5)
Assigned water to El. 762 (maximum
permitted water elevation)
Bottom of PZ-0902 (El. 701.5)
Material Name Color
Fly Ash
Cohesive Embankment Fill
MSt - Hd Alluvium
Mde Glacial Outwash
Lo Glacial Outwash
Granular Embankment Fill
85
08
00
75
07
00
65
06
00
450 500 550 600 650 700 750 800
Page 22
1.861.86
250.00 lbs/ft2
1.861.86
B-0902 - Typical Existing MeasurementNear Existing Pool Elevation
B-0901 - TypicalExisting Measurement = El. 728
Conesville Ash Pond Complex2015 Stability Analysis ReviewSection A-AStatic Loading
- Existing typical conditionsfor 0902 and 0901
Material Name ColorUnit Weight(lbs/ft3)
Cohesion(psf)
Phi(deg)
Fly Ash 100 0 30
Cohesive Embankment Fill 125 0 34
MSt ‐ Hd Alluvium 125 80 28
Mde Glacial Outwash 120 0 32
Lo Glacial Outwash 115 0 29
Granular Embankment Fill 125 0 34
Scale: 1" = 40'Method: Spencer
Assigned water to El. 762 (maximum permitted water elevation)
Note: Phreatic surface shownvaries from that estimated in 2010report. Phreatic surface between 0902 and 0901 is not known.
Safety Factor0.000.250.500.751.001.251.501.752.002.252.502.753.003.253.503.754.004.254.504.755.005.255.505.756.00+
850
800
750
700
650
400 450 500 550 600 650 700 750
Page 23
1.501.50
250.00 lbs/ft2
1.501.50
B-0902 - Action Level = No level specified
(Piezometer typically reads within 1 foot of pool level)B-0901 - Action Level = 733
Conesville Ash Pond Complex
2015 Stability Analysis Review
Section A-A
Static Loading
- Development of action levels
for 0902 and 0901
Material Name ColorUnit Weight
(lbs/�3)
Cohesion
(psf)
Phi
(deg)
Fly Ash 100 0 30
Cohesive Embankment Fill 125 0 34
MSt - Hd Alluvium 125 80 28
Mde Glacial Outwash 120 0 32
Lo Glacial Outwash 115 0 29
Granular Embankment Fill 125 0 34
Scale: 1" = 40'
Method: Spencer
Assigned water to El. 762 (maximum
permitted water elevation)
Safety Factor
0.00
0.25
0.50
0.75
1.00
1.25
1.50
1.75
2.00
2.25
2.50
2.75
3.00
3.25
3.50
3.75
4.00
4.25
4.50
4.75
5.00
5.25
5.50
5.75
6.00+
85
08
00
75
07
00
65
0
400 450 500 550 600 650 700 750
Page 24
1.001.00
250.00 lbs/ft2
1.001.00
B-0902 - Action Level = Existing Pool Level(Piezometer typically reads within 1 foot of pool level) B-0901 - Action Level = 736
(Existing Ground Surface)For Factor of Safety = 1.0
Conesville Ash Pond Complex2015 Stability Analysis ReviewSection A-AStatic Loading
- Phreatic surface required to reach FOS = 1.0 for Section A-A
Material Name ColorUnit Weight(lbs/ft3)
Cohesion(psf)
Phi(deg)
Fly Ash 100 0 30
Cohesive Embankment Fill 125 0 34
MSt ‐ Hd Alluvium 125 80 28
Mde Glacial Outwash 120 0 32
Lo Glacial Outwash 115 0 29
Granular Embankment Fill 125 0 34
Scale: 1" = 40'Method: Spencer
Assigned water to El. 762 (maximum permitted water elevation)
Seepage along slopebelow El. 745
Safety Factor0.000.250.500.751.001.251.501.752.002.252.502.753.003.253.503.754.004.254.504.755.005.255.505.756.00+
850
800
750
700
650
400 450 500 550 600 650 700 750
Page 25
W
Conesville Ash Pond Complex2015 Stability Analysis ReviewSection B-BSoutheast Embankment
Note: Piezometer P-11 not shown as it is monitoring groundwater table (Screened Interval = 725.3 - 731.3)
P-12Screened Interval:El. 743.9 - 749.5(Depth 21.3 to 26.9 feet)
Scale: 1" = 40'Method: Spencer
Top of Filter Pack (El. 749.5)
Assigned water to El. 762 (maximum permitted water elevation)
Bottom of P-12 Filter Pack (El. 743.9)
Material Name Color
Fly Ash
New Granular Filll
MSt ‐ Hd Alluvium
Mde Glacial Outwash
De Glacial Outwash
Lo Glacial Outwash
Granular Embankment Fill
Cohesive Embankment Fill
P-13No Screened IntervalPipe El. 759.4 - 749.4(Depth 0 to 10 feet)
Bottom of Standpipe P-13(El. 749.4)
PZ-0903Screened Interval:El. 763.2 - 703.2(Depth 6 to 66 feet)
Bottom of PZ-0903Filter Pack (El. 703.2)
Top of PZ-0903Filter Pack (El. 763.2)
Bottom of Standpipe PZ-0904(El. 738.8)
PZ-0904Slotted Pipe with Bentonite SealPipe El. 743.3 to 738.8(Depth 0 to 4.5 feet)
850
800
750
700
650
600
400 450 500 550 600 650 700 750
Page 26
1.5641.5641.5641.564
W
Conesville Ash Pond Complex2015 Stability Analysis ReviewStatic Loading
Existing Typical Conditions for P-12, P-13, PZ-0903 and PZ-0904
Scale: 1" = 40'Method: Spencer
Assigned water to El. 762 (maximum permitted water elevation)
Material Name ColorUnit Weight(lbs/ft3)
Cohesion(psf)
Phi(deg)
Fly Ash 100 0 30
New Granular Filll 125 0 34
MSt ‐ Hd Alluvium 125 80 28
Mde Glacial Outwash 120 0 32
De Glacial Outwash 125 0 36
Lo Glacial Outwash 115 0 29
Granular Embankment Fill 125 0 34
Cohesive Embankment Fill 125 100 29
P-13Typical Existing Measurement El. 750 - bottom of pipe'Dry'
PZ-0903 / P-12Typical Existing MeasurementEl. 747-748
PZ-0904Typical Existing MeasurementEl. 743.3 - Existing Ground Surface
Safety Factor0.0000.2500.5000.7501.0001.2501.5001.7502.0002.2502.5002.7503.0003.2503.5003.7504.0004.2504.5004.7505.0005.2505.5005.7506.000+
850
800
750
700
650
600
400 450 500 550 600 650 700 750
Page 27
1.501.50
W
250.00 lbs/ft2
1.501.50
Conesville Ash Pond Complex
2015 Stability Analysis Review
Static Loading
Development of Action Levels for P-12,
P-13, PZ-0903 and PZ-0904
Scale: 1" = 40'
Method: Spencer
Assigned water to El. 762 (maximum
permitted water elevation)
Material Name ColorUnit Weight
(lbs/�3)
Cohesion
(psf)
Phi
(deg)
Fly Ash 100 0 30
MSt - Hd Alluvium 125 80 28
Mde Glacial Outwash 120 0 32
Lo Glacial Outwash 115 0 29
Granular Embankment Fill 125 0 34
Cohesive Embankment Fill 125 100 29
P-13 - Slotted PVC
with natural backfill
Typically 'dry' - no action level
PZ-0903 / P-12
Action Level - El. 753
PZ-0904 - Slotted PVC with
natural backfill
Typical Existing Measurement is
at existing ground surface
- No action level.
Safety Factor
0.00
0.25
0.50
0.75
1.00
1.25
1.50
1.75
2.00
2.25
2.50
2.75
3.00
3.25
3.50
3.75
4.00
4.25
4.50
4.75
5.00
5.25
5.50
5.75
6.00+
85
08
00
75
07
00
65
06
00
400 450 500 550 600 650 700 750
Page 28
1.001.00
W
250.00 lbs/ft21.001.00
Conesville Ash Pond Complex2015 Stability Analysis ReviewStatic Loading
Development of Action Levels for P-12, P-13, PZ-0903 and PZ-0904 for a condition where factor of safety = 1.0
Scale: 1" = 40'Method: Spencer
Assigned water to El. 762 (maximum permitted water elevation)
Material Name ColorUnit Weight(lbs/ft3)
Cohesion(psf)
Phi(deg)
Fly Ash 100 0 30
New Granular Filll 125 0 34
MSt ‐ Hd Alluvium 125 80 28
Mde Glacial Outwash 120 0 32
De Glacial Outwash 125 0 36
Lo Glacial Outwash 115 0 29
Granular Embankment Fill 125 0 34
Cohesive Embankment Fill 125 100 29
P-13 - Slotted PVC with natural backfillTypically 'dry'Action Level = El. 755for FOS = 1.0
PZ-0903 / P-12Action Level - El. 759for FOS = 1.0
PZ-0904 - Slotted PVC with natural backfillTypical Existing Measurement is at existing ground surface - Action Level = Above Existing Ground Surface (El. 743.5) in combination with raised measurements in other piezometers
Seepage along slopebelow El. 753
Safety Factor0.000.250.500.751.001.251.501.752.002.252.502.753.003.253.503.754.004.254.504.755.005.255.505.756.00+
850
800
750
700
650
600
400 450 500 550 600 650 700 750
Page 29
Appendix III – Liquefaction Screening
Page 30
AEP Conesville Ash Pond Complex
Liquefaction Assessment
7217-15-007A
Liquefaction Resistance Evaluation
Screening Criteria No.2: Fines Content and Plasticity Index
Layer: Cohesive Embankment Fill
NATURAL LIQUID PLASTIC PLASTIC % Fines CLAY USCS
MOISTURE LIMIT LIMIT INDEX .005 mm .002 mm CLASSIFICATION Is Soil Sample Liqefiable
CONTENT % % % % % % % (meets all three criteria)
BAP-0902 18.25 26 15 - No - -
BAP-0902 27.25 0 4 SANDY LEAN CLAY CL - No - No
BAP-0902 36.75 19 28 18 10 0 37 44 23 18 SANDY LEAN CLAY CL Yes No No No
BAP-0906 5.75 10 24 17 7 20 44 27 14 10 SANDY SILT ML Yes Yes No No
BAP-1001 3.75 59 31 19 12 3 36 44 23 17 SANDY ORGANIC CLAY OL Yes No Yes No
BAP-1011 34.25 15 28 18 10 6 37 41 22 16 SAND LEAN CLAY CL Yes No No No
BAP-1013 3.25 12 36 21 15 No - No No
BAP-1013 31.75 23 23 19 4 2 47 40 16 12 SANDY SILTY CLAY CL-ML Yes No Yes No
BAP-1013 36.25 20 24 18 6 0 39 49 17 12 SANDY SILTY CLAY CL-ML Yes No No No
Fines Content and Plasticity Index Screening
LL < 35
% Passing
0.005 < 15 WC > 0.9LL
BORINGSAMPLE
DEPTH I.D.
GRAVEL
59
96
SAND SILT
Conesville Ash Pond Complex
Conesville, OhioLiquefaction Analysis of Cohesive Embankment Fill
Page 31
AEP Conesville Ash Pond Complex
Liquefaction Analysis
7217-15-007A
Liquefaction Analysis: Simplefied Procedure Based on Technical Workshop by Youd, Idriss, et al
Location: Embankment
Boring BAP-0903 BAP-0905 BAP-0906 BAP-1001 BAP-1005 BAP-1007 BAP-1011 BAP-1013
Ground Elevation 769.2 768.2 769.2 769.6 784.5 777.5 768.8 771
Ground Water Elevation 720.2 732.8 728.2 732.6 769.5 756.1 759.3 740
Boring SampleSampling
Depth (ft)
Sampling
Depth (m)Elevation Pa (psf) σvo (psf) σvo (kPa) σ'vo (psf) σ'vo (kPa) N60 CN N'60
BAP-0903 1 1.00 0.30 768.20 2058.1 125 6.0 125 6 37 1.76 65
BAP-0903 3 4.00 1.22 765.20 2058.4 500 23.9 500 24 40 1.54 62
BAP-0903 4 5.50 1.68 763.70 2058.5 688 32.9 688 33 33 1.45 48
BAP-0903 5 7.00 2.13 762.20 2058.6 875 41.9 875 42 40 1.37 55
BAP-0903 6 8.50 2.59 760.70 2058.7 1063 50.9 1,063 51 42 1.30 55
BAP-0903 7A/B 10.00 3.05 759.20 2058.8 1250 59.8 1,250 60 30 1.23 37
BAP-0903 8 11.50 3.51 757.70 2058.9 1438 68.8 1,438 69 48 1.18 56
BAP-0903 9 13.00 3.96 756.20 2059.0 1625 77.8 1,625 78 44 1.12 49
BAP-0903 10 14.50 4.42 754.70 2059.1 1813 86.8 1,813 87 50 1.07 54
BAP-0903 11 16.00 4.88 753.20 2059.3 2000 95.7 2,000 96 28 1.03 29
BAP-0903 12 17.50 5.34 751.70 2059.4 2188 104.7 2,188 105 48 0.99 47
BAP-0903 13 19.00 5.79 750.20 2059.5 2375 113.7 2,375 114 39 0.95 37
BAP-0903 14 20.50 6.25 748.70 2059.6 2563 122.7 2,563 123 54 0.91 49
BAP-0903 15 22.00 6.71 747.20 2059.7 2750 131.6 2,750 132 33 0.88 29
BAP-0903 16 23.50 7.16 745.70 2059.8 2938 140.6 2,938 141 24 0.85 20
BAP-0903 17 25.00 7.62 744.20 2059.9 3125 149.6 3,125 150 25 0.82 21
BAP-0903 18 26.50 8.08 742.70 2060.0 3313 158.6 3,313 159 25 0.80 20
BAP-0905 1 1.00 0.30 767.20 2058.2 125 6.0 125 6 14 1.76 25
BAP-0905 2 2.50 0.76 765.70 2058.3 313 15.0 313 15 28 1.64 46
BAP-0905 3 4.00 1.22 764.20 2058.4 500 23.9 500 24 36 1.54 56
BAP-0905 5 7.00 2.13 761.20 2058.7 875 41.9 875 42 40 1.37 55
BAP-0905 6 8.50 2.59 759.70 2058.8 1063 50.9 1,063 51 47 1.30 61
BAP-0905 7 10.00 3.05 758.20 2058.9 1250 59.8 1,250 60 40 1.23 49
BAP-0905 8 12.00 3.66 756.20 2059.0 1500 71.8 1,500 72 37 1.16 43
BAP-0905 9 13.50 4.12 754.70 2059.1 1688 80.8 1,688 81 44 1.11 49
BAP-0905 10 15.00 4.57 753.20 2059.3 1875 89.8 1,875 90 36 1.06 38
BAP-0905 11 16.50 5.03 751.70 2059.4 2063 98.7 2,063 99 44 1.01 45
BAP-0905 12 18.00 5.49 750.20 2059.5 2250 107.7 2,250 108 32 0.97 31
BAP-0905 13 19.50 5.95 748.70 2059.6 2438 116.7 2,438 117 29 0.94 27
BAP-0905 14 21.00 6.40 747.20 2059.7 2625 125.7 2,625 126 29 0.90 26
BAP-0905 17 25.50 7.77 742.70 2060.0 3188 152.6 3,188 153 28 0.81 23
BAP-0906 5 7.50 2.29 761.70 2058.6 938 44.9 938 45 30 1.35 40
BAP-0906 6 9.00 2.74 760.20 2058.7 1125 53.9 1,125 54 32 1.28 41
BAP-0906 7 10.50 3.20 758.70 2058.8 1313 62.8 1,313 63 40 1.21 49
BAP-0906 8 12.00 3.66 757.20 2059.0 1500 71.8 1,500 72 51 1.16 59
BAP-0906 11 16.50 5.03 752.70 2059.3 2063 98.7 2,063 99 36 1.01 37
BAP-0906 12 18.00 5.49 751.20 2059.4 2250 107.7 2,250 108 44 0.97 43
BAP-0906 13 19.50 5.95 749.70 2059.5 2438 116.7 2,438 117 66 0.94 62
BAP-0906 14 21.50 6.55 747.70 2059.7 2688 128.7 2,688 129 59 0.89 53
BAP-0906 15 23.00 7.01 746.20 2059.8 2875 137.6 2,875 138 29 0.86 25
BAP-0906 17 26.00 7.93 743.20 2060.0 3250 155.6 3,250 156 60 0.81 48
BAP-0906 18 27.50 8.38 741.70 2060.1 3438 164.6 3,438 165 33 0.78 26
BAP-0906 19 29.00 8.84 740.20 2060.2 3625 173.5 3,625 174 24 0.76 18
BAP-0906 20 30.50 9.30 738.70 2060.3 3813 182.5 3,813 183 39 0.73 29
BAP-0906 21 32.00 9.76 737.20 2060.5 4000 191.5 4,000 191 42 0.71 30
BAP-0906 23 35.00 10.67 734.20 2060.7 4375 209.4 4,375 209 43 0.67 29
BAP-0906 24 36.50 11.13 732.70 2060.8 4563 218.4 4,563 218 25 0.66 16
BAP-1001 6B 9.00 2.74 760.60 2058.7 1125 53.9 1,125 54 44 1.28 56
BAP-1001 7 10.50 3.20 759.10 2058.8 1313 62.8 1,313 63 58 1.21 70
BAP-1001 11 16.50 5.03 753.10 2059.3 2063 98.7 2,063 99 62 1.01 63
BAP-1001 12 18.00 5.49 751.60 2059.4 2250 107.7 2,250 108 50 0.97 49
BAP-1001 19 28.50 8.69 741.10 2060.2 3563 170.5 3,563 171 48 0.76 37
BAP-1001 20 30.00 9.15 739.60 2060.3 3750 179.5 3,750 180 28 0.74 21
BAP-1001 21 31.50 9.60 738.10 2060.4 3938 188.5 3,938 188 33 0.72 24
BAP-1001 22 33.00 10.06 736.60 2060.5 4125 197.5 4,125 197 46 0.70 32
BAP-1001 23 34.50 10.52 735.10 2060.6 4313 206.4 4,313 206 26 0.68 18
BAP-1001 25 36.00 10.98 733.60 2060.7 4500 215.4 4,500 215 11 0.66 7
BAP-1005 2A/B 2.50 0.76 782.00 2057.1 313 15.0 313 15 34 1.64 56
BAP-1005 3 4.00 1.22 780.50 2057.2 500 23.9 500 24 27 1.54 42
BAP-1005 4 5.50 1.68 779.00 2057.3 688 32.9 688 33 24 1.45 35
Layer: GRANULAR EMBANKMENT
Page 32
AEP Conesville Ash Pond Complex
Liquefaction Analysis
7217-15-007A
Liquefaction Analysis: Simplefied Procedure Based on Technical Workshop by Youd, Idriss, et al
Location: Embankment
Boring BAP-0903 BAP-0905 BAP-0906 BAP-1001 BAP-1005 BAP-1007 BAP-1011 BAP-1013
Ground Elevation 769.2 768.2 769.2 769.6 784.5 777.5 768.8 771
Ground Water Elevation 720.2 732.8 728.2 732.6 769.5 756.1 759.3 740
Boring SampleSampling
Depth (ft)
Sampling
Depth (m)Elevation Pa (psf) σvo (psf) σvo (kPa) σ'vo (psf) σ'vo (kPa) N60 CN N'60
Layer: GRANULAR EMBANKMENT
BAP-1005 5 7.00 2.13 777.50 2057.4 875 41.9 875 42 40 1.37 55
BAP-1005 6 8.50 2.59 776.00 2057.5 1063 50.9 1,063 51 24 1.30 31
BAP-1005 7 10.00 3.05 774.50 2057.7 1250 59.8 1,250 60 42 1.23 52
BAP-1005 8 11.50 3.51 773.00 2057.8 1438 68.8 1,438 69 23 1.18 27
BAP-1005 9 13.00 3.96 771.50 2057.9 1625 77.8 1,625 78 30 1.12 34
BAP-1005 10 14.50 4.42 770.00 2058.0 1813 86.8 1,813 87 24 1.07 26
BAP-1005 11 16.00 4.88 768.50 2058.1 2000 95.7 1,938 93 13 1.04 14
BAP-1005 12 17.50 5.34 767.00 2058.2 2188 104.7 2,032 97 36 1.02 37
BAP-1005 13 19.00 5.79 765.50 2058.3 2375 113.7 2,125 102 13 1.00 13
BAP-1005 15 23.00 7.01 761.50 2058.6 2875 137.6 2,376 114 43 0.95 41
BAP-1007 3 4.00 1.22 773.50 2057.7 500 23.9 500 24 33 1.54 51
BAP-1007 4 5.50 1.68 772.00 2057.8 688 32.9 688 33 23 1.45 33
BAP-1007 5 7.00 2.13 770.50 2058.0 875 41.9 875 42 40 1.37 55
BAP-1007 6 85.00 25.91 692.50 2063.8 10625 508.6 6,656 319 66 0.51 33
BAP-1007 8 11.50 3.51 766.00 2058.3 1438 68.8 1,438 69 23 1.18 27
BAP-1007 9 13.00 3.96 764.50 2058.4 1625 77.8 1,625 78 39 1.12 44
BAP-1007 11 16.00 4.88 761.50 2058.6 2000 95.7 2,000 96 10 1.03 10
BAP-1007 12 17.50 5.34 760.00 2058.7 2188 104.7 2,188 105 29 0.99 29
BAP-1007 13 19.00 5.79 758.50 2058.9 2375 113.7 2,375 114 4 0.95 4
BAP-1007 15 22.50 6.86 755.00 2059.1 2813 134.6 2,744 131 26 0.88 23
BAP-1011 1 1.00 0.30 767.80 2058.2 125 6.0 125 6 30 1.76 53
BAP-1011 2 2.50 0.76 766.30 2058.3 313 15.0 313 15 30 1.64 49
BAP-1011 3 4.00 1.22 764.80 2058.4 500 23.9 500 24 30 1.54 46
BAP-1013 3 4.00 1.22 767.00 2058.2 500 23.9 500 24 35 1.54 54
BAP-1013 4 5.50 1.68 765.50 2058.3 688 32.9 688 33 30 1.45 44
BAP-1013 5 7.00 2.13 764.00 2058.4 875 41.9 875 42 28 1.37 38
BAP-1013 6 8.50 2.59 762.50 2058.6 1063 50.9 1,063 51 28 1.30 36
BAP-1013 7 10.00 3.05 761.00 2058.7 1250 59.8 1,250 60 39 1.23 48
BAP-1013 8 11.50 3.51 759.50 2058.8 1438 68.8 1,438 69 44 1.18 52
BAP-1013 9 13.00 3.96 758.00 2058.9 1625 77.8 1,625 78 46 1.12 52
BAP-1013 10 14.50 4.42 756.50 2059.0 1813 86.8 1,813 87 35 1.07 38
BAP-1013 15 22.00 6.71 749.00 2059.6 2750 131.6 2,750 132 35 0.88 31
BAP-1013 16 23.50 7.16 747.50 2059.7 2938 140.6 2,938 141 26 0.85 22
BAP-1013 17 25.00 7.62 746.00 2059.8 3125 149.6 3,125 150 37 0.82 30
BAP-1013 18 26.50 8.08 744.50 2059.9 3313 158.6 3,313 159 33 0.80 26
* Samples with N60 > 70 not included
Page 33
0
50
100
150
200
250
300
350
0 10 20 30 40 50 60
Pre
-Failu
re V
ert
. E
ff. S
tress (
kP
a)
Corrected SPT Blowcount, N'60
Liquefaction Flow Failure Susceptibility - Sand and Gravel Fill
Boundary BAP-0903
BAP-0905 BAP-0906
BAP-1001 BAP-1005
BAP-1007 BAP-1011
BAP-1013
Fear and Robertson (1995) boundary
Contractive
Dilative
Page 34
AEP Conesville Ash Pond Complex
Liquefaction Analysis
7217-15-007A
Liquefaction Analysis: Simplefied Procedure Based on Technical Workshop by Youd, Idriss, et al
Location: Inboard Side of Embankment
Layer: FLY ASH FILL
Boring BAP-0901 BAP-0902 BAP-0903 BAP-0905 BAP-0906 BAP-1001 BAP-1002 BAP-1003 BAP-1004 BAP-1005 BAP-1007 BAP-1008 BAP-1009 BAP-1010 BAP-1011 BAP-1012 BAP-1013
Ground Elevation 735.8 769.7 769.2 768.2 769.2 769.6 736.9 769.7 738.8 784.5 777.5 751.3 743 735.1 768.8 747.4 771
Ground Water Elevation 727.8 760.8 720.2 732.8 728.2 732.6 0 726.8 0 769.5 756.1 732.9 722.7 721.7 759.3 721.9 740
amax / g = 0.06 Mw = 6.1
Boring SampleSampling
Depth (ft)
Sampling
Depth (m)Elevation Pa (psf) σvo (psf) σvo (kPa) σ'vo (psf) σ'vo (kPa) N60 CN N'60 rd MSF (kM) kσ kα CSR CRR7.5 FS
BAP-0902 3 4 1.22 765.70 2058.3 500 23.9 500 24 10 1.54 15 0.99 1.70 1.42 1.0 0.0387 0.1643 10.26
BAP-0902 4 5.5 1.68 764.20 2058.4 688 32.9 688 33 11 1.45 16 0.99 1.70 1.32 1.0 0.0386 0.1700 9.83
BAP-0902 5 7 2.13 762.70 2058.5 875 41.9 875 42 15 1.37 21 0.99 1.70 1.24 1.0 0.0384 0.2226 12.17
BAP-0902 6 8.5 2.59 761.20 2058.7 1063 50.9 1063 51 5 1.30 6 0.98 1.70 1.18 1.0 0.0383 0.0836 4.37
BAP-0902 7 10 3.05 759.70 2058.8 1250 59.8 1181 57 12 1.26 15 0.98 1.70 1.15 1.0 0.0404 0.1610 7.76
BAP-0902 8 11.5 3.51 758.20 2058.9 1438 68.8 1275 61 15 1.23 18 0.98 1.70 1.13 1.0 0.0429 0.1963 8.75
BAP-0902 9 13 3.96 756.70 2059.0 1625 77.8 1369 66 14 1.20 17 0.97 1.70 1.11 1.0 0.0450 0.1782 7.43
BAP-0902 10 14.5 4.42 755.20 2059.1 1813 86.8 1463 70 10 1.17 12 0.97 1.70 1.09 1.0 0.0468 0.1282 5.06
BAP-0902 11 16 4.88 753.70 2059.2 2000 95.7 1557 75 3 1.14 3 0.97 1.70 1.07 1.0 0.0484 0.0610 2.29
BAP-0902 12 17.5 5.34 752.20 2059.3 2188 104.7 1651 79 4 1.12 4 0.96 1.70 1.06 1.0 0.0498 0.0681 2.45
BAP-0902 13 19 5.79 750.70 2059.4 2375 113.7 1745 84 8 1.09 9 0.96 1.70 1.04 1.0 0.0509 0.1021 3.54
BAP-0902 14 20.5 6.25 749.20 2059.6 2563 122.7 1839 88 7 1.07 7 0.96 1.70 1.03 1.0 0.0519 0.0915 3.08
BAP-0902 15 22 6.71 747.70 2059.7 2750 131.6 1933 93 30 1.04 31 0.95 1.70 1.02 1.0 0.0528 0.6034 19.70
BAP-0902 16 23.5 7.16 746.20 2059.8 2938 140.6 2026 97 10 1.02 10 0.95 1.70 1.00 1.0 0.0535 0.1152 3.66
BAP-0902 17 25 7.62 744.70 2059.9 3125 149.6 2120 102 12 1.00 12 0.94 1.70 0.99 1.0 0.0541 0.1314 4.09
BAP-0902 18 26.5 8.08 743.20 2060.0 3313 158.6 2214 106 7 0.98 7 0.94 1.70 0.98 1.0 0.0546 0.0867 2.64
BAP-0902 21 31 9.45 738.70 2060.3 3875 185.5 2496 119 30 0.93 28 0.92 1.70 0.95 1.0 0.0554 0.3630 10.59
BAP-1003 1 1 0.30 768.70 2058.1 125 6.0 125 6 10 1.76 18 1.00 1.70 2.01 1.0 0.0390 0.1876 16.45
BAP-1003 2 2.5 0.76 767.20 2058.2 313 15.0 313 15 19 1.64 31 1.00 1.70 1.60 1.0 0.0388 0.5910 41.35
BAP-1003 3 4 1.22 765.70 2058.3 500 23.9 500 24 6 1.54 9 0.99 1.70 1.42 1.0 0.0387 0.1066 6.65
BAP-1003 5 7 2.13 762.70 2058.5 875 41.9 875 42 10 1.37 14 0.99 1.70 1.24 1.0 0.0384 0.1474 8.06
BAP-1003 6 8.5 2.59 761.20 2058.7 1063 50.9 1063 51 18 1.30 23 0.98 1.70 1.18 1.0 0.0383 0.2631 13.75
BAP-1003 7 10 3.05 759.70 2058.8 1250 59.8 1250 60 7 1.23 9 0.98 1.70 1.13 1.0 0.0382 0.1013 5.10
BAP-1003 9 13 3.96 756.70 2059.0 1625 77.8 1625 78 11 1.12 12 0.97 1.70 1.06 1.0 0.0379 0.1344 6.38
BAP-1003 10 14.5 4.42 755.20 2059.1 1813 86.8 1813 87 6 1.07 6 0.97 1.70 1.03 1.0 0.0378 0.0832 3.85
BAP-1003 11 16 4.88 753.70 2059.2 2000 95.7 2000 96 18 1.03 19 0.97 1.70 1.01 1.0 0.0377 0.1978 8.97
BAP-1003 12 17.5 5.34 752.20 2059.3 2188 104.7 2188 105 18 0.99 18 0.96 1.70 0.99 1.0 0.0376 0.1894 8.43
BAP-1003 13 19 5.79 750.70 2059.4 2375 113.7 2375 114 11 0.95 10 0.96 1.70 0.96 1.0 0.0374 0.1171 5.12
BAP-1003 16 23.5 7.16 746.20 2059.8 2938 140.6 2938 141 21 0.85 18 0.95 1.70 0.92 1.0 0.0369 0.1906 8.01
BAP-1003 17 25 7.62 744.70 2059.9 3125 149.6 3125 150 4 0.82 3 0.94 1.70 0.90 1.0 0.0367 0.0602 2.51
BAP-1003 18 26.5 8.08 743.20 2060.0 3313 158.6 3313 159 3 0.80 2 0.94 1.70 0.89 1.0 0.0365 0.0549 2.26
BAP-1003 19 28 8.54 741.70 2060.1 3500 167.5 3500 168 12 0.77 9 0.93 1.70 0.88 1.0 0.0363 0.1067 4.37
BAP-1011 5 7 2.13 761.80 2058.6 875 41.9 875 42 29 1.37 40 0.99 1.70 1.24 1.0 0.0384 0.1165 6.37
BAP-1011 13B 19.5 5.95 749.30 2059.5 2438 116.7 1814 87 28 1.07 30 0.96 1.70 1.03 1.0 0.0502 0.4716 16.45
BAP-1011 14 20.5 6.25 748.30 2059.6 2563 122.7 1876 90 13 1.06 14 0.96 1.70 1.02 1.0 0.0509 0.1478 5.04
BAP-1011 15 22 6.71 746.80 2059.7 2750 131.6 1970 94 29 1.04 30 0.95 1.70 1.01 1.0 0.0518 0.4706 15.59
BAP-1011 16 23.5 7.16 745.30 2059.8 2938 140.6 2064 99 30 1.01 30 0.95 1.70 1.00 1.0 0.0526 0.5017 16.19
BAP-1011 18 26.5 8.08 742.30 2060.1 3313 158.6 2252 108 25 0.97 24 0.94 1.70 0.98 1.0 0.0537 0.2799 8.64
BAP-1011 22 36 10.98 732.80 2060.8 4500 215.4 2846 136 21 0.87 18 0.88 1.70 0.92 1.0 0.0545 0.1940 5.57
BAP-1012 7 11 3.35 736.40 2060.5 1375 65.8 1375 66 12 1.19 14 0.98 1.70 1.11 1.0 0.0381 0.1535 7.56
* Samples with N60 > 30 not included
* Samples 4 and 8 from BAP-1003 not included because of negative FS values
Page 35
0
50
100
150
0 5 10 15 20 25 30 35 40 45 50
rt. E
ff. S
tres
s (k
Pa)
Corrected SPT Blowcount, N'60
Liquefaction Flow Failure Susceptibility - Ash
ContractiveDilative
200
250
300
350
Pre-
Failu
re V
e
Boundary
BAP-0902
BAP-1003
BAP-1011
BAP-1012
Fear and Robertson (1995) boundary