64
HEADING I Q3 2012 Issue 3 | Volume 1 The Electronic Trading Resource for Asia Asia E trader ASEAN Link Explained e Truth About HFT in Asia
| Date post: | 11-Mar-2016 |
| Category: |
Documents |
| Upload: | the-magazine-production-company |
| View: | 227 times |
| Download: | 2 times |

heading iQ3 2012Issue 3 | Volume 1
The Electronic Trading Resource for Asia
Asia Etrader
ASEAN Link Explained The Truth About HFT in Asia
*Standard data rates apply.
“Bank of America Merrill Lynch” is the marketing name for the global banking and global markets businesses of Bank of America Corporation. Lending, derivatives, and other commercial banking activities
are performed globally by banking af� liates of Bank of America Corporation, including Bank of America, N.A., member FDIC. Securities, strategic advisory, and other investment banking activities are
performed globally by investment banking af� liates of Bank of America Corporation (“Investment Banking Af� liates”), including, in the United States, Merrill Lynch, Pierce, Fenner & Smith Incorporated
and Merrill Lynch Professional Clearing Corp., both of which are registered broker-dealers and members of FINRA and SIPC, and, in other jurisdictions, by locally registered entities. Investment products
offered by Investment Banking Af� liates: Are Not FDIC Insured May Lose Value Are Not Bank Guaranteed. TAKING YOUR OPPORTUNITY FURTHER is a trademark of Bank of America Corporation,
registered in the U.S. Patent and Trademark Of� ce. ©2012 Bank of America Corporation
Asia +852.2161.7550 | Japan +813.6225.8398 | Europe +44.20.799.64521 | New York +1.212.449.6090
View the Instinct® videos.*ba.ml.com/instinct
A good trader spots all the right signals at just the right time.All on Instinct.
The new Instinct® Algo.
Combining the strengths of our widely used algorithms, the new Instinct® Algo
recognizes and adapts to more signals and more conditions more quickly than ever.
Yet for all its innate sophistication, it’s incredibly easy to use. When you want to
perform at the highest levels, go with our Instinct.
Taking your opportunity further. That’s return on relationship.
Email: [email protected] Bloomberg: MSG MLAPDSA<GO>

1
www.asiaetrading.com z Q3 2012 z asia etrader
HEADING IQ3 2012Issue 3 | Volume 1
The Electronic Trading Resource for Asia
Asia Etrader
ASEAN Link Explained � e Truth About HFT in Asia
leader
The Summer of Change
CREDITS
Chief EditorStephen [email protected]
Contributing WritersDan [email protected]
Roger [email protected]
Keiren [email protected]
Frederic [email protected]
Cover DesignNadia [email protected]
Graphic DesignMariel [email protected]
Magazine DesignThe Magazine Production Company,Adur Business Centre, Little High Street,Shoreham-by-Sea, West Sussex, BN43 5EG
PrinterCentury View Printing Limited Units B3, B4 & A1; 10/F Ko Fai Industrial Building7 Ko Fai Road Yau TongKowloon Hong Kong
Advertising [email protected]
Subscription [email protected]
Scan the Quick Response Codewith your iPhone or Android Phoneto take you to the Subscription page
Wild Wild Web Ltd.GPO Box 11108Hong Kong
www.asiaetrading.com
©2012
The summer issue of the Asia Etrader
brings with it the demise of Chi-east and
the birth of the ASEAN Trading Link. It
was a very busy quarter with a number
of new developments across the region
– short sale reporting in Hong Kong, new
listed futures contracts, new exchange
trading members, growing connectivity
options and of course the HKEx’s bid
for the LME. Despite the slowdown in
China and the Euro zone problems Asia
keeps moving forward developing its
own distinct market structure among
the global trading community.
Competition is growing in Japan, Australia and India (yes India). India,
while still restricted, has to be the largest arena for exchange competition
in Asia. We can see BSE’s market share in equities being eaten into and
new entrants like the MCX-SX and the exchange in Delhi will make the sub-
continent a battleground for liquidity. The Mainland government is pushing
reforms through now at a faster rate to prop up the flagging economy and
there could be a few surprises in the coming months. Not to forget Japan
whose regulators are trying to rewrite commodity trading policy and deal
with the TSE and OSE merger to ensure that country remains a viable and
competitive trading destination. Then we have Hong Kong and the LME
acquisition. Did they offer too much? How will an exchange known for its
IPOs and its weak secondary market absorb an asset class it knows little
about? Could this be the White Knight that Hong Kong needs to keep it a
viable market after the mainland opens up? And let us not forget Singapore.
A blow to exchange competition and best execution in Asia with the closing
of Chi-east. But the ASEAN Link is a development we can look forward
to. Perhaps this is the first steps to a pan-regional regulatory framework.
Whatever it and all the rest are, Asia sure is an exciting and dynamic place
and we are honoured to bring you the latest issue of our humble publication.
Have a safe and relaxing holiday this summer. The Fall season is going
to be hectic.
Stephen J. Edge
Editor
*Standard data rates apply.
“Bank of America Merrill Lynch” is the marketing name for the global banking and global markets businesses of Bank of America Corporation. Lending, derivatives, and other commercial banking activities
are performed globally by banking af� liates of Bank of America Corporation, including Bank of America, N.A., member FDIC. Securities, strategic advisory, and other investment banking activities are
performed globally by investment banking af� liates of Bank of America Corporation (“Investment Banking Af� liates”), including, in the United States, Merrill Lynch, Pierce, Fenner & Smith Incorporated
and Merrill Lynch Professional Clearing Corp., both of which are registered broker-dealers and members of FINRA and SIPC, and, in other jurisdictions, by locally registered entities. Investment products
offered by Investment Banking Af� liates: Are Not FDIC Insured May Lose Value Are Not Bank Guaranteed. TAKING YOUR OPPORTUNITY FURTHER is a trademark of Bank of America Corporation,
registered in the U.S. Patent and Trademark Of� ce. ©2012 Bank of America Corporation
Asia +852.2161.7550 | Japan +813.6225.8398 | Europe +44.20.799.64521 | New York +1.212.449.6090
View the Instinct® videos.*ba.ml.com/instinct
A good trader spots all the right signals at just the right time.All on Instinct.
The new Instinct® Algo.
Combining the strengths of our widely used algorithms, the new Instinct® Algo
recognizes and adapts to more signals and more conditions more quickly than ever.
Yet for all its innate sophistication, it’s incredibly easy to use. When you want to
perform at the highest levels, go with our Instinct.
Taking your opportunity further. That’s return on relationship.
Email: [email protected] Bloomberg: MSG MLAPDSA<GO>
asia etrader z Q3 2012 z www.asiaetrading.com
ConTenTS2
Contents
IN THE ZONE
our quarterly round-up of industry news and developments across asia last quarter.
Page 4
COvEr STOrIES
ASEAN Trading Link Explained – a significant development for exchange cooperation
and regional harmonisation as the aSean Trading link is about to go live. how does it
work? Who are the players, and who stands to benefit? Page 6
The Truth About HFT in Asia – high Frequency Trading is a global buzzword for a poorly
understood group of buy-side. This article looks at how prevalent hFT is in asia, who is
doing it and why they aren’t. Page 14
OPINION & ANALySIS
Market Data With Asian Characteristics – Keiren harris, a renowned market data
expert in asia, gives us his views on the regional market data playing field. Page 12
DErIvATIvES
Asia’s Increasing Appetite for Futures Trading. exchanges across asia are adding
more derivatives products to a growing community of sophisticated buyside. Find out
where on Page 20
Asia Futures Trading Q2 2012 recap. See our quarterly update on which
exchanges are trading the most futures around asia. Page 22
volatility in Asia Q2 2012. read our report on the how asia’s markets are reacting to
macro and local events. Page 24
BUy SIDE
Who’s Got the Biggest Blocks in Australia? Finding liquidity is becoming increasingly
challenging in a fragmenting australia so where can you find the biggest block?
Page 26
The Broker Panel. Three of asia’s leading buy-sides sat with asia etrader in a Q&a
discussion on how they are choosing the right broker for their execution needs.
Page 28
EXCHANGE SPOTLIGHT vultures Swoop Over Bombay Stock Exchange. This article that looks at the
competitive pressures the BSe is under from the nSe and new exchanges in india.
Page 31
www.asiaetrading.com z Q3 2012 z asia etrader
ConTenTS 3
rISK
Market Surveillance Technology Spearheads Integrity Drive Across Asia
Exchanges. The industry is focusing on weeding out rogue traders and
protecting participants. Page 34
WHO’S WHO emily Yu, head of the iT Strategy and Planning department at the Shenzhen Stock
exchange (SZSe), sat down with asia etrader and gave us her views and insights.
Page 36
EQUITIES The Autopsy of Chi-east. We held a roundtable discussion on the demise of Chi-east
and our panelists had some interesting insights on the reasons. Page 40
Asia’s Fragmentation Footprint Q2 2012. Fragmentation and the regulations supporting
it are gaining momentum. See just where liquidity in asia equities markets is going.
Page 42
Asia Equity Trading Q2 2012 recap. our quarterly review of turnover, average trade
sizes, spread and market impact costs on asia’s exchanges. Page 46
Short report Q2 2012 recap. hong Kong updated its short selling reporting
requirements and we expanded our coverage to australia. Page 48
OPINION POLLS How Do you Measure Trade Performance? Measuring the cost of trading goes
beyond commission and exchange fees. hear what our expert says on the matter.
Page 50
Are you ready for The HKEx Clearing House reforms? hong Kong is modernizing
its risk requirements for its members but are they ready? our expert shares his views.
Page 52
TECHNOLOGy Competitive Advantage in the Cloud. The added flexibility of leveraging The Cloud
can make all the difference to retain and win new business. Page 54
BACK PAGE 56 Careers – The latest career opportunities and job market insights
Dates – exchange holidays and important industry events
Directory – a listing of asia’s electronic trading industry participants
Social Media – news and information on the trends in Social Media of asia’s
financial industry
asia etrader z Q3 2012 z www.asiaetrading.com
in The Zone4
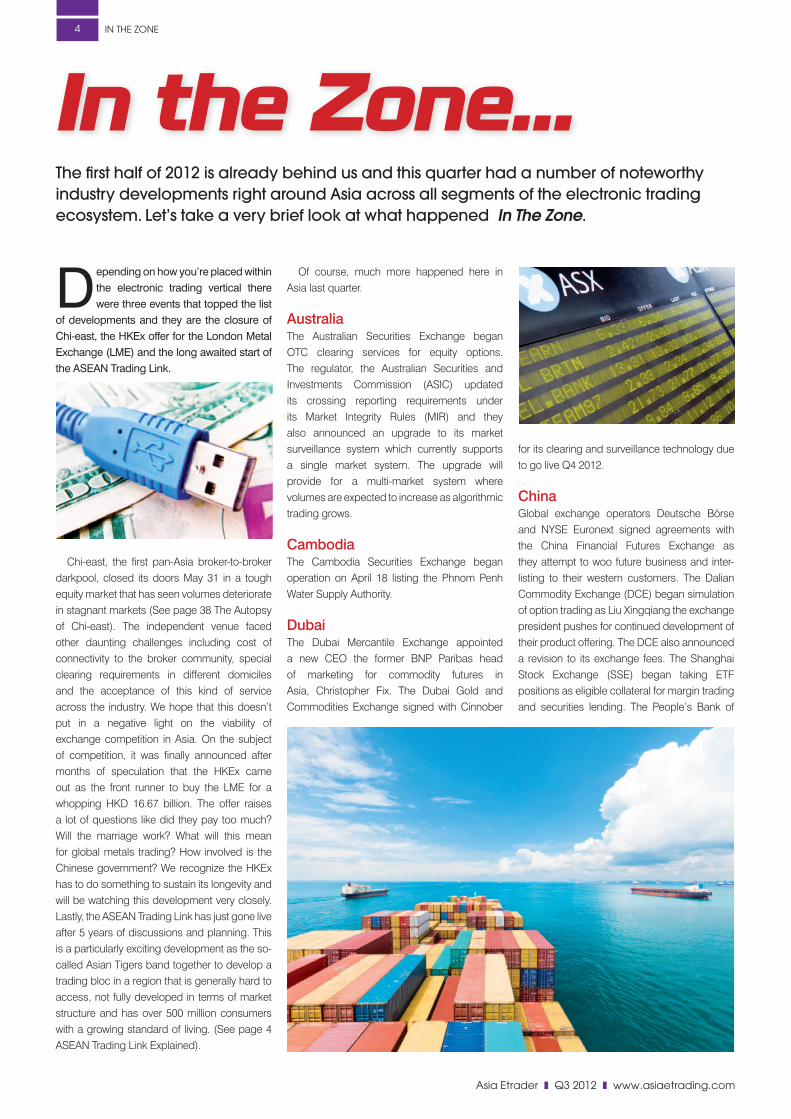
Depending on how you’re placed within the electronic trading vertical there were three events that topped the list
of developments and they are the closure of Chi-east, the HKEx offer for the London Metal Exchange (LME) and the long awaited start of the ASEAN Trading Link.
Chi-east, the first pan-Asia broker-to-broker darkpool, closed its doors May 31 in a tough equity market that has seen volumes deteriorate in stagnant markets (See page 38 The Autopsy of Chi-east). The independent venue faced other daunting challenges including cost of connectivity to the broker community, special clearing requirements in different domiciles and the acceptance of this kind of service across the industry. We hope that this doesn’t put in a negative light on the viability of exchange competition in Asia. On the subject of competition, it was finally announced after months of speculation that the HKEx came out as the front runner to buy the LME for a whopping HKD 16.67 billion. The offer raises a lot of questions like did they pay too much? Will the marriage work? What will this mean for global metals trading? How involved is the Chinese government? We recognize the HKEx has to do something to sustain its longevity and will be watching this development very closely. Lastly, the ASEAN Trading Link has just gone live after 5 years of discussions and planning. This is a particularly exciting development as the so-called Asian Tigers band together to develop a trading bloc in a region that is generally hard to access, not fully developed in terms of market structure and has over 500 million consumers with a growing standard of living. (See page 4 ASEAN Trading Link Explained).
Of course, much more happened here in Asia last quarter.
AustraliaThe Australian Securities Exchange began OTC clearing services for equity options. The regulator, the Australian Securities and Investments Commission (ASIC) updated its crossing reporting requirements under its Market Integrity Rules (MIR) and they also announced an upgrade to its market surveillance system which currently supports a single market system. The upgrade will provide for a multi-market system where volumes are expected to increase as algorithmic trading grows.
CambodiaThe Cambodia Securities Exchange began operation on April 18 listing the Phnom Penh Water Supply Authority.
DubaiThe Dubai Mercantile Exchange appointed a new CEO the former BNP Paribas head of marketing for commodity futures in Asia, Christopher Fix. The Dubai Gold and Commodities Exchange signed with Cinnober
for its clearing and surveillance technology due to go live Q4 2012.
ChinaGlobal exchange operators Deutsche Börse and NYSE Euronext signed agreements with the China Financial Futures Exchange as they attempt to woo future business and inter-listing to their western customers. The Dalian Commodity Exchange (DCE) began simulation of option trading as Liu Xingqiang the exchange president pushes for continued development of their product offering. The DCE also announced a revision to its exchange fees. The Shanghai Stock Exchange (SSE) began taking ETF positions as eligible collateral for margin trading and securities lending. The People’s Bank of
In the Zone... The first half of 2012 is already behind us and this quarter had a number of noteworthy industry developments right around Asia across all segments of the electronic trading ecosystem. Let’s take a very brief look at what happened In The Zone.

www.asiaetrading.com z Q3 2012 z asia etrader
in The Zone 5
China, the central bank, announced April 14 that it would the yuan’s daily trading limit against US dollar currency to 1 percent from 0.5%
Hong KongBesides the LME announcement the exchange made known it had received regulatory approval for the launch of the first listed RMB currency future. The HKEx also appointed Chow Chung Kong as Chairman, Stephen Marzo as Chief Financial Officer and Henry Ingrouille as its Chief Administrative Officer. The Ministry of Finance of China signed a MOU with the HKEx to begin listing and trading of RMB-denominated sovereign bonds in Hong Kong. The Hong Kong regulator rolled out new short selling regulations requiring positions to be reported. The Hong Kong Mercantile exchange was busy signing BOCOM International Securities and China Everbright as new members and their flagship gold future surpassed 10,000 traded contracts in one day. Goldman Sachs was censured by the exchange back in April. It was related to derivative warrants they had issued that incorrectly calculated the settlement conditions for the product by multiply rather than dividing the exchange rate. GS bought the warrants back at $1.10 on the dollar.
IndiaSEBI, India’s regulator, issued guidelines on algorithmic trading including a definition, exchange requirements and minimum risk checks. Lambertus Rutten would not renew his contract as CEO of MCX but would remain on the board.
IndonesiaIndonesia’s commodity exchange, the ICDX, has adopted Bloomberg’s Open Symbology and launched 27 currency pair futures contracts as this country continues its rise within the region.
JapanThe Tokyo Commodity Exchange added a new member in Phillip Securities and the announcement that the Tokyo Grain Exchange
would consolidate to TOCOM was made in June. It was announced that Masamichi Kono of the Japan FSA would lead IOSCOs new board and the Tokyo Stock Exchange signed an MOU with the central bank of Myanmar for establishing a securities exchange. SBI Japannext began the launch of X-Market, a service for retail brokers to trade on the PTS without the need to adapt to the smaller tick size.
KoreaThe Korea Exchange was also busy developing relationships where it signed an MoU with the Bolsa de Valores de Lima. MSCI passed over the country for an upgrade from emerging to developed.
MalaysiaBursa Malaysia began a consultation to amend rules for exchange traded bonds and its derivatives arm revamped its options on Malaysia’s composite index future the FKLI.
New ZealandCaroline Leckie resigned as Head of Market Supervision at the NZX. Tim Bennett the CEO
announced that two new positions would be created at the exchange, CFO and a Head of Cash Markets and the dairy future contract broker 20,000 contracts after 18 months of trading.
Singapore
The Singapore exchange was busy as usual extending its REACH program to Chicago and London via BT. They also began to offer cash settled MSCI Indonesia futures, brought some enhancements to OTC clearing for commodities and reported US$67 million in third quarter profits. Concord Futures became a new member and GFI Group executed the first iron ore swap cleared via STP with the exchange. Lastly, Project Mars, their surveillance system went live based on the Delta Stream CEP of First Derivatives. The Monetary Authority of Singapore issued a response to feedback on its proposed regulation of the derivatives market and issued a response to the regulator being accused of regulatory arbitrage. Equinix spent US$28.5 million on the expansion of their Singapore 2 data center.
TaiwanThe GreTai Securities Market, Taiwans SME exchange, was busy forging relationships in its push to raise its profile. They signed agreements with NASDAQ OMX, the Tokyo Stock Exchange and Deutsche Börse of Germany
ThailandThe Thai Futures Exchange began trading in its USD currency futures and its parent company launched the Thai Depository Portal on May 1. The local derivatives market continues to expand with KT ZMICO Securities offering Sungard’s Valdi trader front end.
TO SUBSCRIBE:
http://www.asiaetrading.com/asia-etrader-magazine/
Email:[email protected]
asia etrader z Q3 2012 z www.asiaetrading.com
Cover STorY6
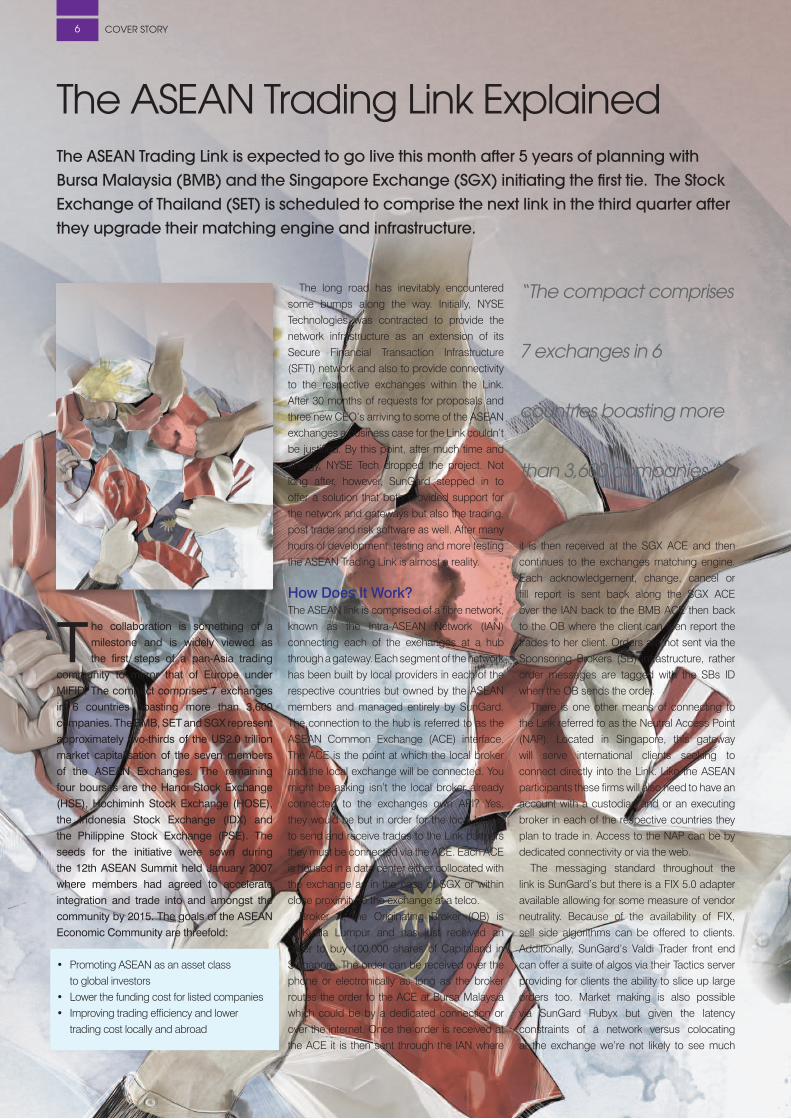
The collaboration is something of a milestone and is widely viewed as the first steps of a pan-Asia trading
community to mirror that of Europe under MIFID. The compact comprises 7 exchanges in 6 countries boasting more than 3,600 companies. The BMB, SET and SGX represent approximately two-thirds of the US2.0 trillion market capitalisation of the seven members of the ASEAN Exchanges. The remaining four bourses are the Hanoi Stock Exchange (HSE), Hochiminh Stock Exchange (HOSE), the Indonesia Stock Exchange (IDX) and the Philippine Stock Exchange (PSE). The seeds for the initiative were sown during the 12th ASEAN Summit held January 2007 where members had agreed to accelerate integration and trade into and amongst the community by 2015. The goals of the ASEAN Economic Community are threefold:
• Promoting ASEAN as an asset class to global investors
• Lower the funding cost for listed companies• Improving trading efficiency and lower
trading cost locally and abroad
The long road has inevitably encountered some bumps along the way. Initially, NYSE Technologies was contracted to provide the network infrastructure as an extension of its Secure Financial Transaction Infrastructure (SFTI) network and also to provide connectivity to the respective exchanges within the Link. After 30 months of requests for proposals and three new CEO’s arriving to some of the ASEAN exchanges a business case for the Link couldn’t be justified. By this point, after much time and energy, NYSE Tech dropped the project. Not long after, however, SunGard stepped in to offer a solution that both provided support for the network and gateways but also the trading, post trade and risk software as well. After many hours of development, testing and more testing the ASEAN Trading Link is almost a reality.
How Does It Work?The ASEAN link is comprised of a fibre network, known as the Intra-ASEAN Network (IAN) connecting each of the exchanges at a hub through a gateway. Each segment of the network has been built by local providers in each of the respective countries but owned by the ASEAN members and managed entirely by SunGard. The connection to the hub is referred to as the ASEAN Common Exchange (ACE) interface. The ACE is the point at which the local broker and the local exchange will be connected. You might be asking isn’t the local broker already connected to the exchanges own API? Yes, they would be but in order for the local broker to send and receive trades to the Link partners they must be connected via the ACE. Each ACE is housed in a data center either collocated with the exchange as in the case of SGX or within close proximity to the exchange at a telco.
Broker A, the Originating Broker (OB) is in Kuala Lumpur and has just received an order to buy 100,000 shares of Capitaland in Singapore. The order can be received over the phone or electronically as long as the broker routes the order to the ACE at Bursa Malaysia which could be by a dedicated connection or over the internet. Once the order is received at the ACE it is then sent through the IAN where
it is then received at the SGX ACE and then continues to the exchanges matching engine. Each acknowledgement, change, cancel or fill report is sent back along the SGX ACE over the IAN back to the BMB ACE then back to the OB where the client can then report the trades to her client. Orders are not sent via the Sponsoring Brokers (SB) infrastructure, rather order messages are tagged with the SBs ID when the OB sends the order.
There is one other means of connecting to the Link referred to as the Neutral Access Point (NAP). Located in Singapore, this gateway will serve international clients seeking to connect directly into the Link. Like the ASEAN participants these firms will also need to have an account with a custodian and or an executing broker in each of the respective countries they plan to trade in. Access to the NAP can be by dedicated connectivity or via the web.
The messaging standard throughout the link is SunGard’s but there is a FIX 5.0 adapter available allowing for some measure of vendor neutrality. Because of the availability of FIX, sell side algorithms can be offered to clients. Additionally, SunGard’s Valdi Trader front end can offer a suite of algos via their Tactics server providing for clients the ability to slice up large orders too. Market making is also possible via SunGard Rubyx but given the latency constraints of a network versus colocating at the exchange we’re not likely to see much
The aSean Trading link explainedThe ASEAN Trading Link is expected to go live this month after 5 years of planning with Bursa Malaysia (BMB) and the Singapore Exchange (SGX) initiating the first tie. The Stock Exchange of Thailand (SET) is scheduled to comprise the next link in the third quarter after they upgrade their matching engine and infrastructure.
“The compact comprises
7 exchanges in 6
countries boasting more
than 3,600 companies.”

www.asiaetrading.com z Q3 2012 z asia etrader
Cover STorY 7
TO SUBSCRIBE:
http://www.asiaetrading.com/asia-etrader-magazine/
Email:[email protected]

cross-border market making over the Link.Risk is affected by SunGard’s Selector
product. Here, the SB assigns firm level restrictions to the OB such as equity limits, position limits and fat finger limits. The sponsor will also be allowed to view and cancel trades. The OB, under the firm level limits, will then provide risk limits to each of their clients applying the same limit types found at the firm level. The OB will also be allowed to view positions and cancel trades but only those under the firm ID as provided by the SB. The key point is that the broker in the home country where the securities are executed bares the risk of the trade and sets the risk limits of the originating broker in aggregate. Of course, each firm will have their own risk policy as required by local regulations and best practices.
Clearing and Settlement falls under the inter-broker model meaning that payment and transfer of securities will be the responsibility of the Sponsoring Broker (or Custodian) as designated by the Originating Broker. Trades are settled in the local currency, that is to say, in the example above the broker in Kuala Lumpur will need to convert Ringgit to Singapore Dollars when purchasing Capitaland. Under the FIX set up drop copies of the trades are available and under the SunGard structure end of day reporting will be available.
Market data is distributed by the local exchange to each of the respective exchange ACE gateways in real-time. This provides for a single point of access for the data of every exchange. Order flow goes from the client to the OB then on to the exchange via the executing ACE but the market data travels in the opposite direction over the same network.
The key piece in the entire architecture is the ASEAN Common Exchange. This gateway routes orders to the respective ACE of the executing country, sends orders directly to the exchange, disseminates and receives the market data from each of the respective exchanges, holds the risk and client set up module and translates FIX messages into the proprietary protocol of the network.
The Link will expand to include a depository element offering custodian services helping to push down costs further. The depository is expected to come on line by the end of 2012 or early 2013. Then in 2013, a pan-regional clearing entity will be formed to bolster the region as one large exchange and to better manage risk. Additionally, Cambodia, Laos and Burma are likely to be folded into the mix at some point in the future.
Who Will Benefit?There are many beneficiaries of the ASEAN link. First of all the sponsoring broker in the
local market through just the connection to the ACE will be able to offer all its clients access to all the ASEAN markets that are part of the IAN (provided that broker has accounts setup with the respective sponsoring broker). Before, brokers would have had to establish point to point connections with brokers in the markets that they wished to trade in. They would have borne the cost of the network, hardware for routing orders, failover provisions and the staff needed to support it. By connecting into the link the broker will realize significant savings and offer trading in the region focusing on broking rather than providing technology.
An improved user experience for clients through the stability and lower latency within the network where before traders might have been subject to web based trading through ISPs or incongruent service level agreements (SLA) among network providers. The network managed by SunGard will offer central support, a standard level of service and experts who are managing the technology effectively.
Singapore and its exchange will stand to benefit from the trading link for a number of reasons. Firstly, Singapore has placed itself as a hub for trading between the ASEAN members and the markets it serves through its REACH program that it launched 15 August, 2011. Under REACH, SGX unveiled its latest matching engine and erected a new data center for colocation services. The other element of REACH is that in London, New York, Chicago and Tokyo the
exchange setup access points so that local participants in those international markets could access SGX by simply connecting to the local access point. With its position in the ASEAN Link, member participants can access, via Singapore, international financial centers and conversely international investors can now access the ASEAN link with Singapore right in the middle. This could prove to be a critical and important development for Singapore and its brokerage community if the Link proves successful standing at the gateway of more than 500 million people.
SunGard as the key technology provider stands to gain enormously. As part of the support agreement for the ASEAN link, Sungard is to provide several Valdi Trader screens to each exchange for 18 months giving them a stronger foothold into the region. Their risk software, Selector, is housed within each exchange ACE giving them a permanent home within crucial points of the infrastructure. Additionally, the trading community within the ASEAN is small and developing. Some of these markets have only begun to offer DMA, and algorithmic trading is just concentrated in Singapore, Malaysia and Thailand. As the national wealth of ASEAN grows, pension systems evolve and electronic trading expands SunGard will have a leg in as a technology provider across the trading vertical from Valdi in the front end, Selector providing risk and Clearvision in the post trade among others.
SunGard, too, has its own global network (SGN) where it will now extend its reach to the Link. SunGard has a large data center in Singapore providing easy access to both the SGX and the Neutral Access Point. Much like SGX REACH, SunGard will be able to provide connectivity for any customer connected to the SGN into ASEAN and also ASEAN members will be able to send trades to SunGard clients anywhere in the network. They are weaving themselves in to the fabric of the South East Asia’s electronic trading industry.
FIX protocol as a standard will be given a boost with the help of the ASEAN Link. FIX is widely used in Asia largely amongst the institutional brokerage community who are offering algorithms such as VWAP, Iceberg and Implementation Shortfall to clients. Having a FIX API at the ACE will offer vendor neutrality to the Link and also kick start the local and regional firms to look more closely at solutions that employ utilizing FIX. As a global standard, firms in the Link will be able to accept order with a wider trading community outside their market.
ASEAN investors are also going to benefit with the onset of the Link with access to a broader and more diverse portfolio of stocks to invest in and at a lower cost than what they might
Cover STorY8
asia etrader z Q3 2012 z www.asiaetrading.com
“The sponsoring broker in
the local market through
just the connection to
the ACE will be able to
offer all its clients access
to all the ASEAN markets.”

www.asiaetrading.com z Q3 2012 z asia etrader
Cover STorY 9
HANOI ACB DABACO HABUBANK KLS TIFOPLAST OCH.JSC PV GAS SOUTHERN PLC PVI PTSC PVC SACOMREAL SHB VINACONEX.,JSC VICOSTONE
HO CHI MINH
BAOVIET HOLDINGS BECAMEX IJC EXIMBANK FPT CORP HAGL KINH DO CORP MASAN GROUP CORP OGC PVFCCO REE JS COMPANY SACOMBANK SSI VIETCOMBANK VINAMILK VINCOM JSC
INDONESIAASTRA AGRO LESTA ADARO ENERGY TBK ANEKA TAMBANG ASTRA INTL TBK BNK CENTRAL ASIA BANK BNI TBK BANK RAKYAT INDO BANK DANAMON TBK BANK MANDIRI TBK BUMI RESOURCES CHAROEN POKPHAN XL AXIATA GUDANG GARAM TBK HARUM ENERGY
INDOFOOD CBP VALE INDONESIA INDOFOOD S M TBK INDOCEMENT T P INDO TAMBANGRAYA JASA MARGA KALBE FARMA TBK LIPPO KARAWACI LONDON SUMATRA P GAS NEGARA TBK TB BUKIT ASAM SALIM IVOMAS PRA SEMEN GRESIK TBK TELKOM INDONESIA UNITED TRACTORS UNILEVER INDONES
MALAYSIAAIRASIA BHD AMMB HLDGS BHD AXIATA GROUP BHD BRITISH AME TOBA BUMI ARMADA CIMB GRP BHD DIGI.COM GENTING MYS BHD GENTING BHD HONG LEONG BANK HONG LEONG FINAN IOI CORP BHD K.LUMPUR KEPONG MAYBANK BHD MALAYSIA MARINE MMC CORPORATION MAXIS BERHAD PETRONAS CHEML PPB GROUP BHD PETRONAS DAGANG PETRONAS GAS PUBLIC BANK BHD RHB CAPITAL SIME DARBY BHD TENAGA NASIONAL TELEKOM MALAYSIA UEM LAND HLDGS UMW HOLDINGS YTL POWER YTL CORPORATION
PHILIPPINES
AYALA CORP ABOITIZ EQUITY ALLIANCE GLOBAL AYALA LAND ABOITIZ POWER BDO UNIBANK BELLE CORP BK OF PHI ISLAND CEBU AIR INC DMCI HOLDINGS ENERGY DEVELOP FIRST GEN GLOBE TELECOM INTL CONTAINER JOLLIBEE FOODS JG SUMMIT METROPOLITAN BK MEGAWORLD CORP MANILA ELECTRIC METRO PACIFI INV MANILA WATER CO PHILEX MINING-A ROBINSONS LAND SEMIRARA MINING SM INVESTMENT SAN MIGUEL CORP SM DEVT CORP SM PRIME HLDGS PHI LONG DIS TEL UNIVERSAL ROBINA
SINGAPORECAPITALAND CAPITAMALLS ASIA COMFORTDELGRO CAPMALL TRUST CITY DEVT LTD DBS GRP HLDGS FRASER & NEAVE GOLDEN AGRI GENTING SPORE GLOBAL LOG PROP HONGKONG LAND JARDINE MATH 400 JARDINE C&C JARDINE STR 500 KEPPEL CORP NEPTUNE OL LTD
NOBLE GROUP
OCBC
OLAM INTER
SEMBCORP INDUST
SEMBCORP MARINE
SGX
SIA ENGR
SIA LTD
SPORE PRESS HLDG
STARHUB
ST ENGRG
SINGTEL
UOB LTD
WILMAR INTL
THAILANDADVANCED INFO SV
AIRPORTS OF TH
BANPU50
BANK OF AYUDHYA
BANGKOK BANK
BEC WORLD
BKK DUSIT MED
BIG C SUPER
CP ALL
CHAROEN
CENTRAL PAT
TOTAL ACCESS
ELECTRIC GEN
GLOW ENERGY
IRPC
INDORAMA VENT
KASIKORNBANK
KRUNG THAI BANK
LAND & HOUSE
PTT
PTT EXP & PROD
PTT GLOBAL CHE
RATCHABURI
SIAM COM BANK
SIAM CEMENT
SIAM CITY
THAI AIRWAYS
TMB BANK
THAI OIL
THAI UNION FRO
ASEAN STARS
The ASEAN Stars index will comprise the 30 largest and most liquid companies (total 180) from each of the member countries with banking and real estate representing the two largest sectors of the benchmark. With the advent of the ASEAN Stars investors will be able to allocate assets in the regional Blue Chips and provide for an identifiable reference for fund managers and exchange traded funds (ETF).

asia etrader z Q3 2012 z www.asiaetrading.com
Cover STorY10
otherwise have to pay. ASEAN as a whole will have a larger voice within the global economic community where they have lived in the shadow of China and India . Cooperation amongst the ASEAN Exchanges will increase its visibility and capability to the global investor. According to data from the World Federation of Exchanges the sum of the exchanges market capitalization from the ASEAN members would rank them ahead of BM&F Bovespa in Brazil and just behind the TMX group in Canada.
With the creation of the ASEAN link will come the STARS index. The Index while not finalized will comprise the 30 largest and most liquid companies (total 180) from each of the member countries with banking and real estate representing the two largest sectors of the benchmark. With the advent of the ASEAN Stars investors will be able to allocate assets in the regional Blue Chips and provide for an identifiable reference for fund managers and exchange traded funds (ETF)
The Link members are currently formalising an agreement with an index provider. At the time of this writing the talks were ongoing with an unnamed company to provide a range of ASEAN market data and analytics. There is currently an ASEAN 40 index provided by FTSE but the final details about the Stars Index such as whether it will be tradable or a reference index are still under negotiation.
The Challenges AheadWith such an ambitious regional cross border initiative the viability of the Link has come under scrutiny. The Philippine Stock Exchange disclosed last November that it would postpone its plans to join the link claiming that the local brokerage industry and investing public hadn’t been as supportive of entering the arrangement as initially expected. The announcement went on to say that the PSE would join the link at a future date but felt the more technically advanced bourses should be the first to see if they can bring the project to market. The PSE upgraded their matching engine in 2010 using NYSE Technologies products. The Indonesia Stock Exchange has also pulled back on their commitment to the Link as they too wait and see how successful the initial development becomes. There is also a belief that the potential for the economy and financial industry will outstrip the rest of the ASEAN members and that connecting to the Link may not be necessary. That could very well be true. Moody’s recently upgraded Indonesia to investment grade and the economy is expected to grow by 7% this year in that nation of 240 million people despite the global economic travails.
Regulations also pose a challenge to the development of the linkage. Each country has its own rules and policies to police and preserve the integrity of their respective capital markets. There are different rules for foreign investors accessing each county, ownership rules, qualified institutions and retail investors are subject to differing guidelines. What would be ideal would be a supra-regulator to govern the bloc and this notion, some believe, is that the Link could be the catalyst for a common set of rules. Of course there are no guarantees that a regional policy would work as we see how the Europe story is unfolding.
The Back Office issues faced by the compact will need to be addressed. The post trade is the most expensive and least automated segment of the trading business in every part of the world so how is this less developed region going to cope with multi-market, multi-currency settlement instructions? How will foreign holding tax be managed or, as in Singapore, will the members have to charge GST on its trades and if so, how do they pay that bill? How will Treasury cope with the currency demands? Will the post trade be overwhelmed by the onset of algorithmic trading and each and every confirmation that has to be created? Each country will also have different settlement calendars and oversight on
failed trades too. It is a daunting task and will be an eye opener to the most sophisticated back office.
ConclusionThe ASEAN members are expected to yield 6% growth in GDP between 2011-2015 amongst its 568 million inhabitants. The population are young, educated and will need somewhere to put their growing savings. Economic, political and regulatory union are by no means easy but this attempt to bring about a common market in this part of the world has to be commended. The worst case scenario is that the union will fail but the local exchanges will have had a taste of international interest and an improved trading infrastructure. The upside is a successful partnership that could form a key market for anyone’s portfolio. Regardless of the outcome it is a win-win for the region. Our hope is that the ASEAN Trading Link succeeds and will bring the world one step closer to an international electronic trading venue.
“How will foreign holding tax be
managed or, as in Singapore,
will the members have to charge
GST on its trades.”
TO SUBSCRIBE:
http://www.asiaetrading.com/asia-etrader-magazine/
Email:[email protected]

www.asiaetrading.com z Q3 2012 z asia etrader
Cover STorY 11

asia etrader z Q3 2012 z www.asiaetrading.com
oPinion & analYSiS12
Strong organic growth, and increasing overseas investment have transformed Asian Financial markets since
2000. Unsurprisingly the regional market data industry mirrors these developments. However the transition from vanilla based investing in Equities, Fixed Income, and FX/Money Markets to more sophisticated electronic trading, a wider range of financial instruments and greater overseas participation has not changed the simple fact each market remains domestically oriented and fragmented with the exception of regional hubs Hong Kong and Singapore.
The reasons for this fragmentation are well known, open and closed barriers to entry, cultural issues, and the underlying cost of operating across a very large percentage of the Earth’s surface.
The Asian market data industry naturally reflects both these trends, and arguably, the future could well see greater levels of fragmentation as new entrants seek a slice of a growing pie. However, especially in Asia, to be successful they need to differentiate their offerings to leverage unique product strengths rather than taking on the two Tier 1 universal aggregators, Bloomberg and Thomson Reuters. To a degree the Tier 2s, such as IDC, Morningstar, and SIX Telekurs, and specialist vendors have followed global clients into Asian markets as penetrating local institutions unwilling to invest in market data is often unprofitable.
This fragmentation is increasing on two levels geographically where there are 5 keymarket areas, China, Japan, Korea, Hong Kong Singapore, and the parochial domestic markets of the rest, though Indonesia is developing rapidly.
The result is that global vendors can offer pan-regional services with near universal content coverage with an entrenched institutional client base. Unfortunately for Tier 2 vendors their weaker OTC and contributed data coverage has until now limited their Asian aspirations. In contrast domestic vendors focus primarily on their local equity markets offering low cost, low margin, market depth coverage for a domestic and retail audience.
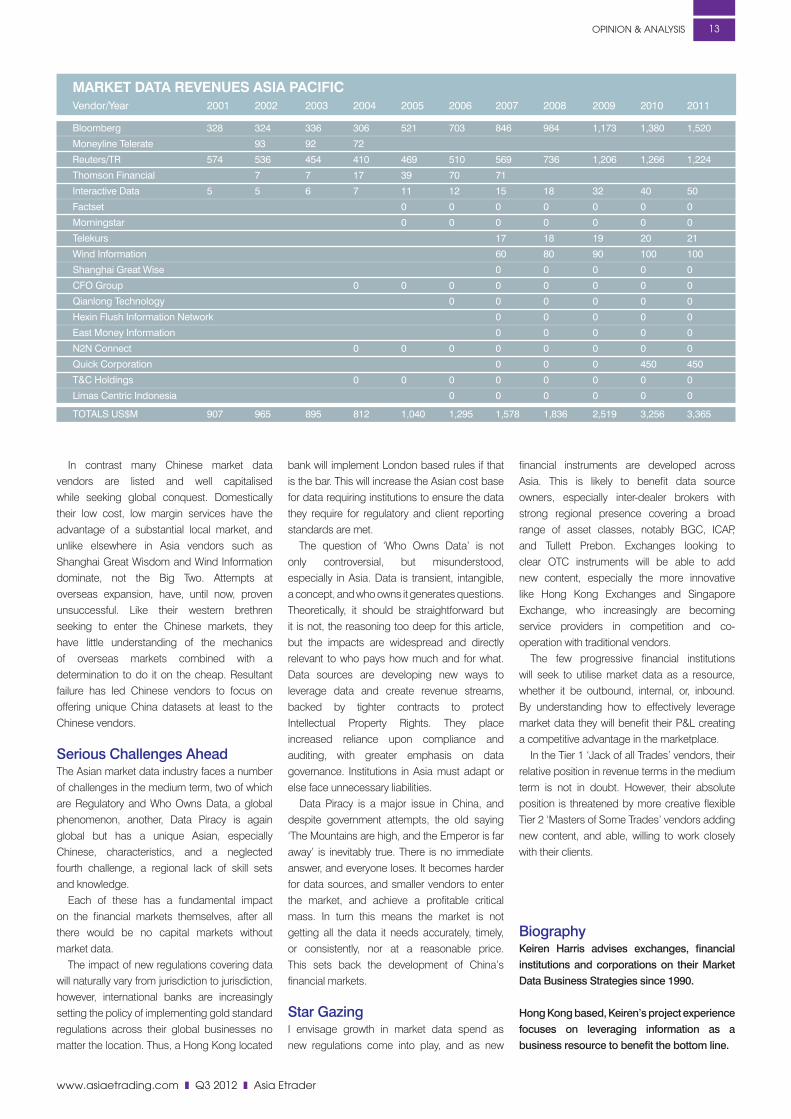
Demand DriversSadly, there is limited and unreliable information on market data revenues in Asia. However,
reliable estimates indicate growth for 16 leading vendors from US$2.241 Billion in 2007 to US$3.742 Billion in 2011. This excludes the many privately held vendors, exchanges and brokers, as well as other sources.
As terminal based services and applications revenue in Asia has apparently remained static, where does the market growth come from? Naturally we must look to developments in the financial markets themselves. Since 2007 increased electronic trading in liquid and open markets where global institutions have access has driven the data boom.
Increasingly liquidity not only drives data demand in the front office it fuels enterprise wide requirements from trade to post trade. The expansion of Asian electronic trading and Direct Market Access (DMA) generates an increased need for feeds, with the corollary requirement for reference data and evaluated pricing services. One feeding the other, so the same data can be put to multiple uses, and often charged multiple times as well.
Like in other global financial centres data usage has expanded from the Front Office throughout the business, and with increased use comes higher costs meaning for many institutions Market Data is now the third largest cost line item. This has meant institutions view Market Data as a cost to be managed, not a resource to be leveraged to benefit the business, as many institutions generate their own data, rarely seeking to exploit it, nor appreciating what is happening to their own data internally or externally.
Regional AspirationsBloomberg and Thomson Reuters overwhelmingly have dominated increasing their market share from 66.3% to 73.3%. The reason for this success? Comprehensive data coverage globally especially for OTC markets, via B-Pipe and Datascope products able to meet existing institutional client demand for expanding electronic trading and enterprise data usage. Arguably this is the fastest and strongest growing regional market segment, where competition, especially from Tier 2 global vendors has been weak, and exacerbated by poorer Asian OTC coverage.
Fortunately for Tier 2 vendors, they have prospered where Bloomberg and Thomson Reuters are traditionally weak, especially for
reference data and evaluated pricing. This is aided by institutions wary of the overwhelming dominance of the Big Two as well as an increasing amount of customer dissatisfaction with these vendors. This is generated by a perception of arrogance and high costs for Bloomberg, and the eternal internal collision of the Thomson/Reuters merger combined with a bewilderingly poorly supported product line up.
While Bloomberg’s and Thomson Reuters’ terminal services are not likely to be seriously challenged in the medium term, despite the efforts of the likes of Sungard’s ‘MarketMap’, their overall dominance is not sustainable as the market reaches saturation point.
Tier 2 vendors are increasing content coverage, while leveraging lower cost bases with more flexible market approaches to transition from the reference data space into offering competitive data feeds, where institutions require a second feed to back up Bloomberg and/or Thomson Reuters. The latter has left itself in a weaker position. Bloomberg’s move to open source instrument codes while Thomson Reuters labours in a somewhat dinosaur attempt to keep its RICS proprietary means the likes of IDC, already mapping to Bloomberg codes, can make displacing Thomson Reuters a less painful process than removing Bloomberg in the key datafeed market.
Local ExpectationsAcross Asia, there are many small privately held local vendors focusing on domestic equity markets with a retail oriented client bases, offering low cost, low margin, yet relatively sophisticated terminal based applications with market depth not distributed by global vendors. However, with few exceptions they are blighted by business blindness, unwilling to invest in new content or datafeeds with limited development strategies. Unattractive to potential buyers, and owner egos discouraging consolidation make it difficult to predict these vendors’ long term potential.
As usual Japan is an exception, despite stagnant domestic markets, it supports an almost universal vendor, Nikkei owned Quick Corporation with its loyal Japanese client base. Past failed attempts at overseas expansion has limited Quick to Japan placing a cap on growth, but not aggressive competition from global vendors attracted by the high fee environment.
Market data With asian Characteristics By Keiren Harris
TO SUBSCRIBE:
http://www.asiaetrading.com/asia-etrader-magazine/
Email:[email protected]
www.asiaetrading.com z Q3 2012 z asia etrader
oPinion & analYSiS 13
In contrast many Chinese market data vendors are listed and well capitalised while seeking global conquest. Domestically their low cost, low margin services have the advantage of a substantial local market, and unlike elsewhere in Asia vendors such as Shanghai Great Wisdom and Wind Information dominate, not the Big Two. Attempts at overseas expansion, have, until now, proven unsuccessful. Like their western brethren seeking to enter the Chinese markets, they have little understanding of the mechanics of overseas markets combined with a determination to do it on the cheap. Resultant failure has led Chinese vendors to focus on offering unique China datasets at least to the Chinese vendors.
Serious Challenges AheadThe Asian market data industry faces a number of challenges in the medium term, two of which are Regulatory and Who Owns Data, a global phenomenon, another, Data Piracy is again global but has a unique Asian, especially Chinese, characteristics, and a neglected fourth challenge, a regional lack of skill sets and knowledge.
Each of these has a fundamental impact on the financial markets themselves, after all there would be no capital markets without market data.
The impact of new regulations covering data will naturally vary from jurisdiction to jurisdiction, however, international banks are increasingly setting the policy of implementing gold standard regulations across their global businesses no matter the location. Thus, a Hong Kong located
bank will implement London based rules if that is the bar. This will increase the Asian cost base for data requiring institutions to ensure the data they require for regulatory and client reporting standards are met.
The question of ‘Who Owns Data’ is not only controversial, but misunderstood, especially in Asia. Data is transient, intangible, a concept, and who owns it generates questions. Theoretically, it should be straightforward but it is not, the reasoning too deep for this article, but the impacts are widespread and directly relevant to who pays how much and for what. Data sources are developing new ways to leverage data and create revenue streams, backed by tighter contracts to protect Intellectual Property Rights. They place increased reliance upon compliance and auditing, with greater emphasis on data governance. Institutions in Asia must adapt or else face unnecessary liabilities.
Data Piracy is a major issue in China, and despite government attempts, the old saying ‘The Mountains are high, and the Emperor is far away’ is inevitably true. There is no immediate answer, and everyone loses. It becomes harder for data sources, and smaller vendors to enter the market, and achieve a profitable critical mass. In turn this means the market is not getting all the data it needs accurately, timely, or consistently, nor at a reasonable price. This sets back the development of China’s financial markets.
Star GazingI envisage growth in market data spend as new regulations come into play, and as new
financial instruments are developed across Asia. This is likely to benefit data source owners, especially inter-dealer brokers with strong regional presence covering a broad range of asset classes, notably BGC, ICAP, and Tullett Prebon. Exchanges looking to clear OTC instruments will be able to add new content, especially the more innovative like Hong Kong Exchanges and Singapore Exchange, who increasingly are becoming service providers in competition and co-operation with traditional vendors.
The few progressive financial institutions will seek to utilise market data as a resource, whether it be outbound, internal, or, inbound. By understanding how to effectively leverage market data they will benefit their P&L creating a competitive advantage in the marketplace.
In the Tier 1 ‘Jack of all Trades’ vendors, their relative position in revenue terms in the medium term is not in doubt. However, their absolute position is threatened by more creative flexible Tier 2 ‘Masters of Some Trades’ vendors adding new content, and able, willing to work closely with their clients.
BiographyKeiren Harris advises exchanges, financial institutions and corporations on their Market Data Business Strategies since 1990. Hong Kong based, Keiren’s project experience focuses on leveraging information as a business resource to benefit the bottom line.
MARKET DATA REVENUES ASIA PACIFIC Vendor/Year 2001 2002 2003 2004 2005 2006 2007 2008 2009 2010 2011
Bloomberg 328 324 336 306 521 703 846 984 1,173 1,380 1,520
Moneyline Telerate 93 92 72
Reuters/TR 574 536 454 410 469 510 569 736 1,206 1,266 1,224
Thomson Financial 7 7 17 39 70 71
Interactive Data 5 5 6 7 11 12 15 18 32 40 50
Factset 0 0 0 0 0 0 0
Morningstar 0 0 0 0 0 0 0
Telekurs 17 18 19 20 21
Wind Information 60 80 90 100 100
Shanghai Great Wise 0 0 0 0 0
CFO Group 0 0 0 0 0 0 0 0
Qianlong Technology 0 0 0 0 0 0
Hexin Flush Information Network 0 0 0 0 0
East Money Information 0 0 0 0 0
N2N Connect 0 0 0 0 0 0 0 0
Quick Corporation 0 0 0 450 450
T&C Holdings 0 0 0 0 0 0 0 0
Limas Centric Indonesia 0 0 0 0 0 0
TOTALS US$M 907 965 895 812 1,040 1,295 1,578 1,836 2,519 3,256 3,365

asia etrader z Q3 2012 z www.asiaetrading.com
Cover STorY 214
High Frequency Traders are drawn to a market under certain specific conditions generally comprising of low cost execution fees (sometimes rebated), low market impact
costs (liquidity), low clearing fees and tax. Other sunk costs include connectivity, rack space at a colocation or proximity facility, hardware, software for trading, for risk, developers to build the algorithms and real time streaming tick data captured in a large database. The exchange’s trading platform must be able to process thousands of order per second capable of matching trades within 100 microseconds or less. When taking all of these elements into account does HFT really take place in Asia?
The short answer is that High Frequency Trading does go on in Asia. There is a misconception that, largely rendered by an uninformed media, HFT is the domain of equity trading alone brought on by exchange competition and fueling fragmentation. The reality is that it is a multi-asset class pursuit attracting those that can afford to be the fastest.
One of the oldest HFT strategies is market making. The dealer markets like Nasdaq before RegNMS was a hive of computer driven trading where the market maker earns her money by capturing the spread; buying at the bid and selling at the offer all day. Another long time HFT strategy found in options market making are what are called reversals and conversions. These strategies are borne from a concept known as put-call parity where the value of a call option, at one strike price, implies a certain fair value for the put at the same strike price. Any deviation from this relationship would generate an arbitrage opportunity. There is plenty of finance literature that can explain this concept in detail. More recently, because of exchange competition, arbitrage between two or more venues has presented an opportunity for HFT strategies where buying in one venue and selling in another venue at a profit can be achieved. HFT within the derivatives space is all over Asia – Korea’s KOSPI, India’s NIFTY, Osaka’s Nikkei and Australia’s SPI to name just a few but what of HFT in the equity markets?
The Truth about hFT in asiaHigh Frequency Trading (HFT) is a difficult to define trading method but is universally accepted as requiring huge amounts of real-time tick data, hardware to process the data which feeds the algorithms affecting a trading decision sending an order over as short as possible length of fibre to a central order book. Positions are typically held for seconds or minutes and the trader goes home at the end of the day with no exposure to the market.
TO SUBSCRIBE:
http://www.asiaetrading.com/asia-etrader-magazine/
Email:[email protected]
www.asiaetrading.com z Q3 2012 z asia etrader
Cover STorY 2 15
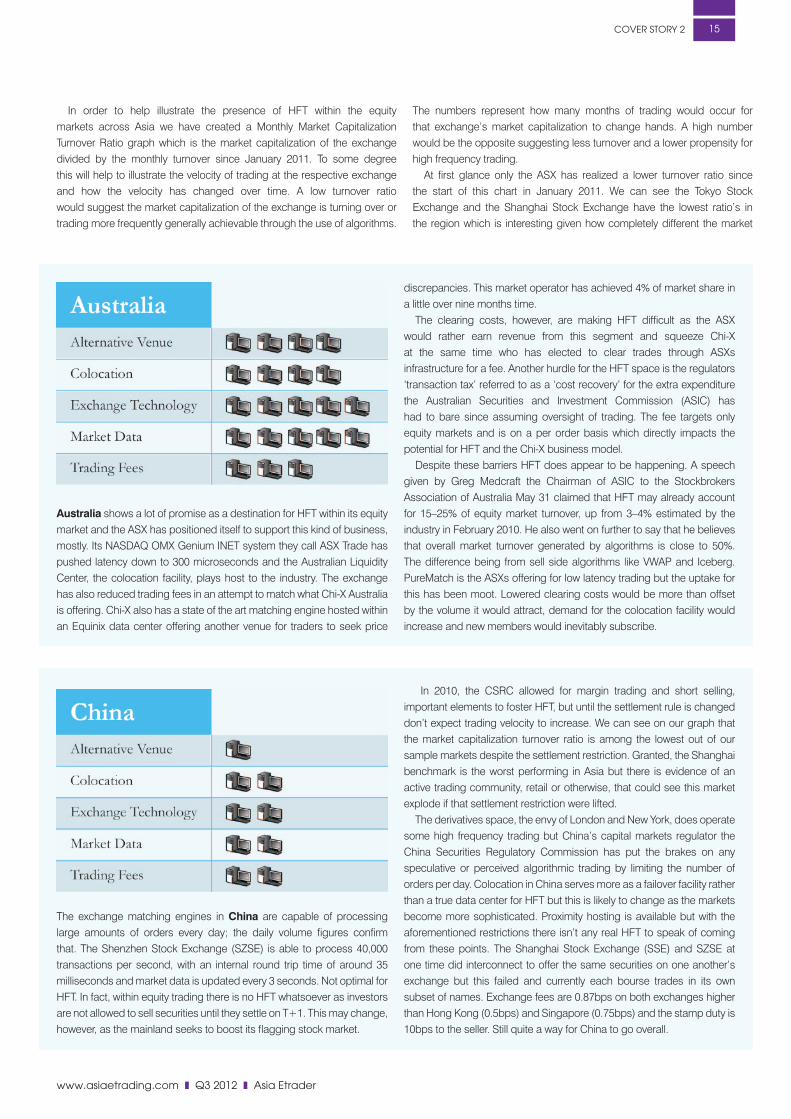
Australia shows a lot of promise as a destination for HFT within its equity market and the ASX has positioned itself to support this kind of business, mostly. Its NASDAQ OMX Genium INET system they call ASX Trade has pushed latency down to 300 microseconds and the Australian Liquidity Center, the colocation facility, plays host to the industry. The exchange has also reduced trading fees in an attempt to match what Chi-X Australia is offering. Chi-X also has a state of the art matching engine hosted within an Equinix data center offering another venue for traders to seek price
discrepancies. This market operator has achieved 4% of market share in a little over nine months time.
The clearing costs, however, are making HFT difficult as the ASX would rather earn revenue from this segment and squeeze Chi-X at the same time who has elected to clear trades through ASXs infrastructure for a fee. Another hurdle for the HFT space is the regulators ‘transaction tax’ referred to as a ‘cost recovery’ for the extra expenditure the Australian Securities and Investment Commission (ASIC) has had to bare since assuming oversight of trading. The fee targets only equity markets and is on a per order basis which directly impacts the potential for HFT and the Chi-X business model.
Despite these barriers HFT does appear to be happening. A speech given by Greg Medcraft the Chairman of ASIC to the Stockbrokers Association of Australia May 31 claimed that HFT may already account for 15–25% of equity market turnover, up from 3–4% estimated by the industry in February 2010. He also went on further to say that he believes that overall market turnover generated by algorithms is close to 50%. The difference being from sell side algorithms like VWAP and Iceberg. PureMatch is the ASXs offering for low latency trading but the uptake for this has been moot. Lowered clearing costs would be more than offset by the volume it would attract, demand for the colocation facility would increase and new members would inevitably subscribe.
The exchange matching engines in China are capable of processing large amounts of orders every day; the daily volume figures confirm that. The Shenzhen Stock Exchange (SZSE) is able to process 40,000 transactions per second, with an internal round trip time of around 35 milliseconds and market data is updated every 3 seconds. Not optimal for HFT. In fact, within equity trading there is no HFT whatsoever as investors are not allowed to sell securities until they settle on T+1. This may change, however, as the mainland seeks to boost its flagging stock market.
In 2010, the CSRC allowed for margin trading and short selling, important elements to foster HFT, but until the settlement rule is changed don’t expect trading velocity to increase. We can see on our graph that the market capitalization turnover ratio is among the lowest out of our sample markets despite the settlement restriction. Granted, the Shanghai benchmark is the worst performing in Asia but there is evidence of an active trading community, retail or otherwise, that could see this market explode if that settlement restriction were lifted.
The derivatives space, the envy of London and New York, does operate some high frequency trading but China’s capital markets regulator the China Securities Regulatory Commission has put the brakes on any speculative or perceived algorithmic trading by limiting the number of orders per day. Colocation in China serves more as a failover facility rather than a true data center for HFT but this is likely to change as the markets become more sophisticated. Proximity hosting is available but with the aforementioned restrictions there isn’t any real HFT to speak of coming from these points. The Shanghai Stock Exchange (SSE) and SZSE at one time did interconnect to offer the same securities on one another’s exchange but this failed and currently each bourse trades in its own subset of names. Exchange fees are 0.87bps on both exchanges higher than Hong Kong (0.5bps) and Singapore (0.75bps) and the stamp duty is 10bps to the seller. Still quite a way for China to go overall.
In order to help illustrate the presence of HFT within the equity markets across Asia we have created a Monthly Market Capitalization Turnover Ratio graph which is the market capitalization of the exchange divided by the monthly turnover since January 2011. To some degree this will help to illustrate the velocity of trading at the respective exchange and how the velocity has changed over time. A low turnover ratio would suggest the market capitalization of the exchange is turning over or trading more frequently generally achievable through the use of algorithms.
The numbers represent how many months of trading would occur for that exchange’s market capitalization to change hands. A high number would be the opposite suggesting less turnover and a lower propensity for high frequency trading.
At first glance only the ASX has realized a lower turnover ratio since the start of this chart in January 2011. We can see the Tokyo Stock Exchange and the Shanghai Stock Exchange have the lowest ratio’s in the region which is interesting given how completely different the market

asia etrader z Q3 2012 z www.asiaetrading.com
“Xxxxxxxx”
Cover STorY 216
Hong Kong is not a suitable HFT environment for the most part. The cost of trading, clearing and the government stamp duty makes trading the spread a loss making venture. The matching engine is the slowest in developed Asia (Thailand is faster) and there isn’t a colocation facility to speak of yet though proximity services are plentiful. The latter two points are to be rectified by the HKEx in Q3 with the new Tsuen Kwan O data centre but this will do little to fan the HFT flames given the hefty relative cost of trading. There are bright spots in the derivatives space
– the warrant market which are bank issued and the Hang Seng index options – but within equities it’s a difficult proposition. The government’s 10bps stamp duty is a real drag on trading but generates a significant proportion of the city’s income. In order for Hong Kong to eliminate this tax they would have to seek revenue in other places such as income tax which could hurt the SARs standing as a low tax business centre.
There is a line of thinking that if the stamp duty were cut then more trading would arise offsetting the revenue deficit. It could also attract highly skilled workers in the trading space who could then be taxed and spend their incomes locally. In recent days there has been an exodus of highly skilled traders and their highly paid jobs from Hong Kong. IMC, the Amsterdam-based trading firm, all but closed down their office in Hong Kong retaining a skeleton staff as a regulatory requirement, relocating key personal to Australia and their Netherlands headquarters. All Options, headed by Ralph Van Put, another Dutch trader shut its doors last year and Optiver, another algo-centric trading firm also has its regional headquarters in Australia.
On the subject of exchange competition there isn’t much to say. Unless the Hong Kong government lifts the monopoly the HKEx enjoys we won’t see much of any professional trading outside the warrants market or long-only fund managers putting in to question the validity that Hong Kong is an international financial center.
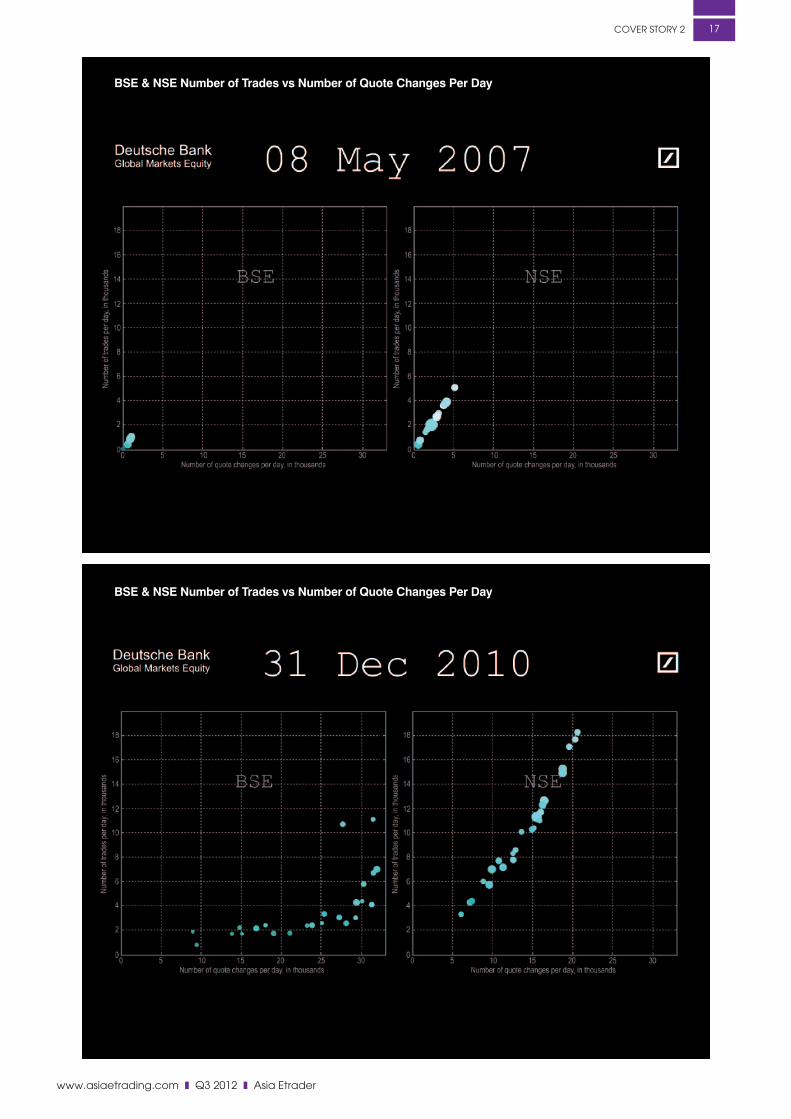
Since the Securities and Exchange Board of India (SEBI) permitted DMA in April 2008 there has been a large uptake of algorithmic trading on the sub-continent. We can illustrate the market structure changes that have occurred pre- and post-DMA. Graph A and B show a time series of quotes vs trades with the BSE on the left and the NSE on the right. The X-axis shows the number of quote changes per day and the Y-axis shows the number of trades per day. In May 2007, almost one year before DMA was introduced we can see that the ratio of trades to quotes is 5 to 1 in favour of the NSE. Graph B skips ahead to December 31, 2010 more than 18 months after the introduction of DMA revealing a resounding change in the India market.
While both of the exchanges liquidity profiles have changed dramatically the BSEs has been more extensive as the number of
quotes have increased substantially clearly indicative of automated market making and other algorithmic trading strategies. The BSE has no restriction on how many times quotes can be updated each day but the NSE does when the order to trade ratio exceeds 500 to 1 generating a denial of service fee when breeched.
At the heart of the NSE is its matching engine which has been benchmarked at 250 microseconds serving 100,000 messages per second. Five years ago the exchange was handling about 30 million messages per day and today that figure has jumped 10 fold to 300 million messages per day.
It is estimated that algo trading on the BSE is about 8-10 percent of all volume and the NSE is higher at around 15-20% in the equities segment.
There are some structural problems in India that do make it difficult to trade across exchanges and one of them is the clearing. Each exchange has their own clearing house where trades must settle through and no netting occurs between clearing houses forcing participants to carry two margins. Another factor preventing cross exchange arbitrage is that the cost of connecting to both the exchanges and building a Smart Order Router is too high so brokers prefer to connect to the former where most of the liquidity resides. This is expected to be further burdensome to the industry as the MCX-SX is lobbying SEBI for its equities market license which it was denied last year and the arrival of the Delhi Exchange, a platform for HFT, is expected very soon.
Each exchange does have a collocation facility and offers streaming tick data. Once the clearing issue is resolved and trading costs are reduced this will be a very exciting market.
“The reality is that HFT is a multi-asset class pursuit attracting
those that can afford to be the fastest.”
TO SUBSCRIBE:
http://www.asiaetrading.com/asia-etrader-magazine/
Email:[email protected]
www.asiaetrading.com z Q3 2012 z asia etrader
Cover STorY 2 17
BSE & NSE Number of Trades vs Number of Quote Changes Per Day
BSE & NSE Number of Trades vs Number of Quote Changes Per Day

asia etrader z Q3 2012 z www.asiaetrading.com
Cover STorY 218
Since the Arrowhead launch in January 2010 HFT, at least in equities, has been growing. Inter-venue arbitrage which drives fragmentation has seen the largest portion of HFT strategies. Volumes have been moving from the primary TSE to Chi-X and SBI Japannext with the PTSs achieving a record 6 percent of market share last January. There are obvious reasons for the onset of HFT in that market, new exchange technology, equally cutting edge hardware at the PTSs, the JSCC now clearing PTS trades lowering costs and eliminating counterparty risk and colocation facilities available at each venue. If we look to the Percentage of TSE Colo Orders graph the percentage of orders originating in the colo site for cash equities continues to trend upward. This does support the idea
the HFT is indeed growing in Japan. We have heard that 30%-40% of turnover on the TSE is HFT but this has not been confirmed or supported with any data. The monthly turnover ratio is difficult to determine if HFT trading is supported as the data is skewed by the Tsunami shock in March 2011 and the US credit rating downgrade also last year in August.
Market share on the PTSs is expected to continue to grow as the Japan FSA has recently removed one of the key barriers for the PTS and that is the Takeover Bid Rule. (See Fragmentation Footprint article for more on that). Another factor that will push fragmentation and HFT further is that the TSE offers a 1 yen tick size on its securities but the PTSs a 1/10 of 1 yen tick size which has favoured the alternative venues. The TSE could lower its tick size but isn’t likely to as Japan’s financial industry’s technology would need to upgrade their systems in order to cope with the fractional tick sizes. For the time being the PTSs have a tick size advantage and will attract more inter-venue HFT arbitrage.
The Osaka exchange’s flagship Nikkei 225 futures have been the focus of a great deal of HFT for quite some time. Newedge is the largest member on the OSE and services the most market makers trading that future. Trading strategies range from reversals and conversions, index basket trading and arbitrage between the SGX listed Nikkei and the CME listed Nikkei futures. Given the long geographical distances between matching engines – 67 milliseconds between Tokyo and Singapore and 128 milliseconds to Chicago – relatively speaking this would not necessarily be fast but high in frequency.
TO SUBSCRIBE:
http://www.asiaetrading.com/asia-etrader-magazine/
Email:[email protected]
www.asiaetrading.com z Q3 2012 z asia etrader
Cover STorY 2 19
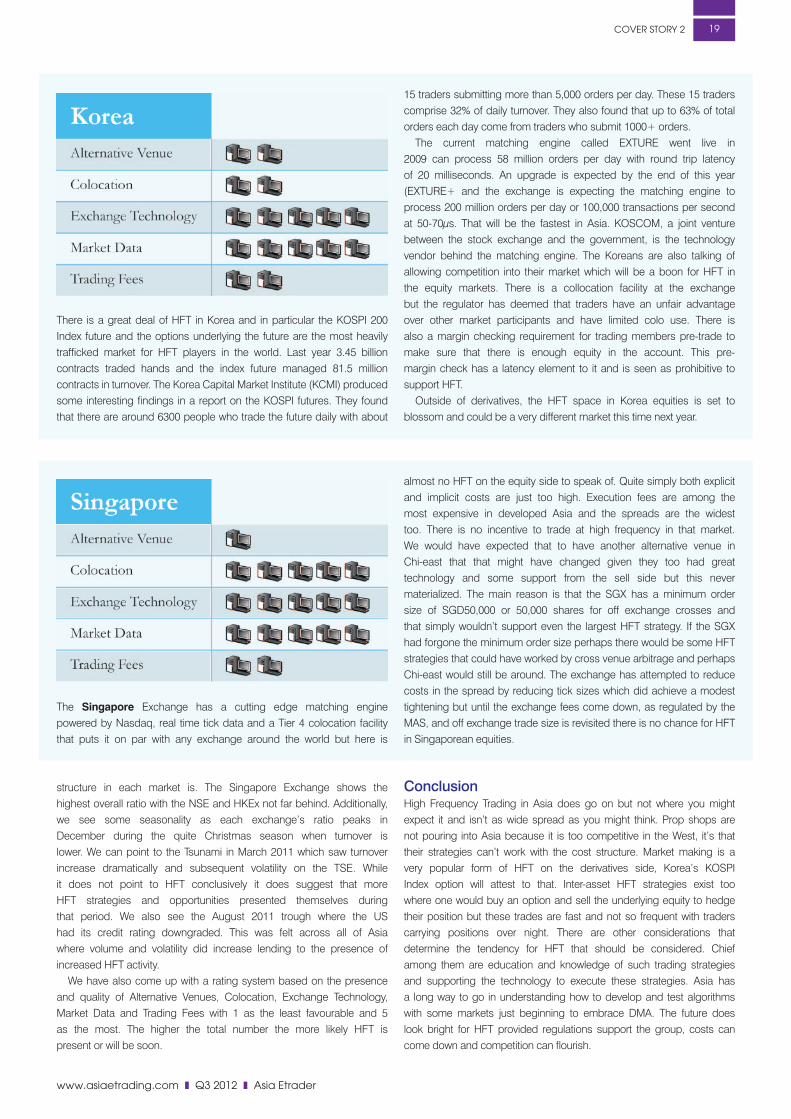
There is a great deal of HFT in Korea and in particular the KOSPI 200 Index future and the options underlying the future are the most heavily trafficked market for HFT players in the world. Last year 3.45 billion contracts traded hands and the index future managed 81.5 million contracts in turnover. The Korea Capital Market Institute (KCMI) produced some interesting findings in a report on the KOSPI futures. They found that there are around 6300 people who trade the future daily with about
15 traders submitting more than 5,000 orders per day. These 15 traders comprise 32% of daily turnover. They also found that up to 63% of total orders each day come from traders who submit 1000+ orders.
The current matching engine called EXTURE went live in 2009 can process 58 million orders per day with round trip latency of 20 milliseconds. An upgrade is expected by the end of this year (EXTURE+ and the exchange is expecting the matching engine to process 200 million orders per day or 100,000 transactions per second at 50-70μs. That will be the fastest in Asia. KOSCOM, a joint venture between the stock exchange and the government, is the technology vendor behind the matching engine. The Koreans are also talking of allowing competition into their market which will be a boon for HFT in the equity markets. There is a collocation facility at the exchange but the regulator has deemed that traders have an unfair advantage over other market participants and have limited colo use. There is also a margin checking requirement for trading members pre-trade to make sure that there is enough equity in the account. This pre-margin check has a latency element to it and is seen as prohibitive to support HFT.
Outside of derivatives, the HFT space in Korea equities is set to blossom and could be a very different market this time next year.
The Singapore Exchange has a cutting edge matching engine powered by Nasdaq, real time tick data and a Tier 4 colocation facility that puts it on par with any exchange around the world but here is
almost no HFT on the equity side to speak of. Quite simply both explicit and implicit costs are just too high. Execution fees are among the most expensive in developed Asia and the spreads are the widest too. There is no incentive to trade at high frequency in that market. We would have expected that to have another alternative venue in Chi-east that that might have changed given they too had great technology and some support from the sell side but this never materialized. The main reason is that the SGX has a minimum order size of SGD50,000 or 50,000 shares for off exchange crosses and that simply wouldn’t support even the largest HFT strategy. If the SGX had forgone the minimum order size perhaps there would be some HFT strategies that could have worked by cross venue arbitrage and perhaps Chi-east would still be around. The exchange has attempted to reduce costs in the spread by reducing tick sizes which did achieve a modest tightening but until the exchange fees come down, as regulated by the MAS, and off exchange trade size is revisited there is no chance for HFT in Singaporean equities.
structure in each market is. The Singapore Exchange shows the highest overall ratio with the NSE and HKEx not far behind. Additionally, we see some seasonality as each exchange’s ratio peaks in December during the quite Christmas season when turnover is lower. We can point to the Tsunami in March 2011 which saw turnover increase dramatically and subsequent volatility on the TSE. While it does not point to HFT conclusively it does suggest that more HFT strategies and opportunities presented themselves during that period. We also see the August 2011 trough where the US had its credit rating downgraded. This was felt across all of Asia where volume and volatility did increase lending to the presence of increased HFT activity.
We have also come up with a rating system based on the presence and quality of Alternative Venues, Colocation, Exchange Technology, Market Data and Trading Fees with 1 as the least favourable and 5 as the most. The higher the total number the more likely HFT is present or will be soon.
ConclusionHigh Frequency Trading in Asia does go on but not where you might expect it and isn’t as wide spread as you might think. Prop shops are not pouring into Asia because it is too competitive in the West, it’s that their strategies can’t work with the cost structure. Market making is a very popular form of HFT on the derivatives side, Korea’s KOSPI Index option will attest to that. Inter-asset HFT strategies exist too where one would buy an option and sell the underlying equity to hedge their position but these trades are fast and not so frequent with traders carrying positions over night. There are other considerations that determine the tendency for HFT that should be considered. Chief among them are education and knowledge of such trading strategies and supporting the technology to execute these strategies. Asia has a long way to go in understanding how to develop and test algorithms with some markets just beginning to embrace DMA. The future does look bright for HFT provided regulations support the group, costs can come down and competition can flourish.
asia etrader z Q3 2012 z www.asiaetrading.com
Derivatives trading in China and India have seen huge growth over the years and is the envy of the West
and the Japanese who have missed out on the global commodities boom entirely. Rising affluence and global trade are seen as the primary causes for fueling Asia’s commodity bread basket. Though notional volumes are small and reflect individual purchasing power, appetite for futures trading continues to evolve along with the sophistication of players who seek new ways to hedge risk, speculate and access other time zones and markets. The first half of 2012 saw the addition of no less than ten new listed futures products across Asia in currency, precious metals, interest rate, index and volatility derivatives. And that’s not all, more contracts have been announced for the second half building on the momentum in one of the few bright spots in the trading business.
Trading Volumes Incite ChangeIncreasing and sometimes record-setting trading volume at exchanges have precipitated bourse’s to update and add new products. Uncertainty and volatility in financial markets around the globe have been the drivers for increased hedging activity and the resulting higher trading volume. Bursa Malaysia’s derivatives (BMD) segment and the Tokyo Stock Exchange (TSE) have each seen new records in terms of turnover. On 16 May, BMD reported that 77,703 contracts changed hands that day with their crude palm oil (FCPO) contract comprising 63,019 units of that total. Also, five days later on 21 May the exchange re-introduced options underlying the KLCI future in an attempt to broaden trading strategies amongst local participants. The options are also listed on CME’s Globex platform as well to tap into international players.
The OSE made some modifications too by improving its strategy trading allowing these order types to be placed during the opening auction in addition to the regular session. They also plan to reduce the tick size for the Nikkei 225 future from 5 yen to 1 yen with both of these changes set to take effect 26 November.
In an effort to reduce retail participation the Korea Exchange increased the multiplier of the KOSPI index option, the world’s largest
traded derivative, from 100,000 to 500,000. The regulator believes that retail participants are at risk of losing too much money and they have stepped in to curb these players. Conversely, Eurex’s night session KOSPI option hit a volume record this quarter as well.
The Tokyo Stock Price Index (TOPIX) at the TSE has also reported record volumes early this year and on the 7 June the Japan Government Bond (JGB) saw a new one-day high with more than 102,000 contracts turning over.
Currency FuturesEveryone, now it seems, wants to access the currency market with Thailand, the HKEx and Indonesia joining the club now offering their own futures. The Thailand Futures Exchange (TFEX) last month launched its US dollar futures. The new product, underlying US1,000, will provide Thai investors the ability to hedge Thai baht through derivatives and access to the multi-trillion dollar currency market. For now, investors must be of Thai nationality or a resident of Thailand.
In its effort to position itself as the center for offshore RMB trading the HKEx announced the arrival of the Renminbi currency future. Scheduled for the third quarter of this year, the product will be the first exchange-traded currency futures settled in RMB. At expiration, the seller will be required to deliver US dollars
to the buyer who makes payment of the final settlement value in RMB to the seller. Contracts will be quoted in RMB per USD and margined in RMB where the final settlement price will be based on the spot USD/RMB fixing published by the Treasury Market Association at 11:15 am on the last trading day (two business days before the third Wednesday of the month).
Indonesia’s Commodity and Derivatives Exchange will launch 27 new currency pairs this quarter to facilitate a growing need by industry to hedge. These will be the first financial contracts ever listed on the bourse as this nation raises the bar and begins its ascent to becoming a regional financial center.
Volatility Index FuturesBoth the Osaka Securities Exchange (OSE) and the HKEx introduced volatility index futures this year.
The Nikkei 225 VI is based on the Nikkei Stock Average Volatility Index and is calculated by using prices from the Nikkei 225 futures and its underlying options. This cash-settled contract trades out for eight months, has a multiplier of 10,000 Yen and is available to trade as a spread. As of March 10, 2012 the US under CFTC Rule 30.13 allowed this product to be sold to US investors.
The HSI Volatility Index (VHSI) future began trading in February and has a tick size about six times larger than the OSE’s version. Subscribing to the CBOE’s VIX methodology this contract will help in pricing options, hedge risk and manage volatility in a market that tends to have higher volatility than most in Asia. Hong Kong index option volume is quite low and this product should help turnover in that market.
Stock Index FuturesIn addition to the volatility future, the OSE introduced a Dow Jones Industrial Average (DJIA) index future. OSE DJIA futures underly the same index as the DJIA futures traded on the Chicago Board of Trade (CBOT) but have a different trading currency which means the contracts do not necessarily trade at the same price. This allows for arbitrage of both these products much like the US- and Yen-based Nikkei 225 also on the CME. Furthermore, it allows the local Japanese market access to the US market in their local currency.
asia’s increasing appetite for Futures Trading
derivaTiveS20
“Volatility in financial
markets around the
globe have been the
drivers for increased
hedging activity and
the resulting higher
trading volume.”

www.asiaetrading.com z Q3 2012 z asia etrader
derivaTiveS 21
The Singapore Exchange (SGX) began trading an index future based on the MSCI Indonesia Index in June. This is the world’s first offshore Indonesian equity future of which the SGX is known for listing such regional benchmarks. In January, the SGX announced that the CFTC allowed US investors to directly trade its FTSE Asia A50 and MSCI Asia APEX 50 futures contracts from within the US. Then, on 23 March, the CFTC also granted approval for the SGX’s Euro Stoxx 50 Index as well.
The five founding members of the BRICS Exchanges Alliance (Brazil, Russia, India, China, South Africa) began cross-listing each other’s benchmark index futures in March. Announced last October at the World Federation of Exchanges annual conference the Alliance aims to expand their product offerings beyond their home markets giving investors exposure to the increasingly important BRICS economies. The participating derivatives include Brazil’s IBOVESPA, Russia’s MICES Index, India’s Sensex Index, Hong Kong’s Hang Seng Index and Hang Seng China Enterprises Index and the South African FTSE/JSE Top 40 futures.
Precious MetalsCash settled gold and silver contracts were launched 8 May on the Singapore Mercantile Exchange (SMX). SME E-Gold and SME E-Silver are priced on their respective counterparts in
India. The gold future’s underlying is 1kg and the silver contract is 30kg with both contracts settled in US dollars. The Hong Kong Mercantile Exchange is also expected to begin trading in RMB settled gold this quarter as well. The Shanghai Futures Exchange began trading physically delivered silver futures May the 10th as that bourse expands its footprint in global metals trading.
Fixed IncomeThe resumption of T-Bond trading at the China Financial Futures Exchange (CFFEX) is expected later this year. The CFFEX has completed the initial design of the futures contract which would track the price of a medium term bond. SEBI, India’s regulator, has allowed for trading in 2- and 5-year Government of India bonds. The contract size of these cash settled futures will be INR200,000 (US3,600)
Asia is continuing to develop its commodity markets and the flurry of activity this past 6 months and the foreseeable future attest to the rapid growth of this segment in Asia. The HKEx takeover of the LME are further tipping the scales and adding to the momentum of commodity price discovery shifting to Asia. Derivatives are a more sophisticated product to trade and manage risk than traditional cash and its increased adoption provides clear indication that the Asian trading community has an increasing appetite for futures trading.
Contract Exchange Launched Type Size T+1 Silver Shanghai Futures Exchange 10 May 2012 Physical 15kg No
HSI Volatility Index Stock Exchange of Hong Kong 20 Feb 2012 Cash 5,000 x Index No
USD Currency Thailand Futures Exchange 07 Jun 2012 Cash USD1,000 No
MSCI Indonesia Index Singapore Exchange 11 Jun 2012 Cash US$2 x SGX MSCI Indonesia Index Yes
Gold Singapore Mercantile Exchange 08 May 2012 Cash 1 kg No
Silver Singapore Mercantile Exchange 08 May 2012 Cash 30 kg No
Nikkei 225 VI Futures Osaka Securities Exchange 27 Feb 2012 Cash 10,000 x Index No
DJIA Futures Osaka Securities Exchange 28 May 2012 Cash 100 x Index Yes
Six-Month Euroyen LIBOR Tokyo Financial Exchange 30 Jan 2012 Cash ¥100,000,000 Yes
BRICs Futures (4) SEHK and BSE 30 Mar 2012 Cash Varies No
Coming This Year
Interest Rate SEBI Approved in India TBD Cash TBD No
Treasury Bonds China Financial Futures Exchange Q4 2012 Cash TBD No
RMB Currency Stock Exchange of Hong Kong Q3 2012 Cash No
RMB Settled Products Hong Kong Mercantile Exchange Q4 2012 TBD
Currency Pairs Indonesia Commodity and Derivatives Exchange Q3 2012 Cash 10,000
“Everyone, now it
seems, wants to access
the currency market
with Thailand, the HKEx
and Indonesia joining
the club.”
TO SUBSCRIBE:
http://www.asiaetrading.com/asia-etrader-magazine/
Email:[email protected]

derivaTiveS22
TOP 55 Futures Contract By Volume In Asia For Q2 2012 Exchange Product Q2 Vol Q1 Vol Difference Type
National Stock Exchange of India US Dollar/Indian Rupee 149,060,527 138,416,873 10,643,654 Currency
Dalian Commodity Exchange Soy Meal 141,405,400 32,744,240 108,661,160 Agriculture
Multi Commodity Exchange US Dollar/Indian Rupee 138,299,625 134,559,286 3,740,339 Currency
Zhengzhou Commodity Exchange White Sugar 71,162,772 28,063,278 43,099,494 Commodity
Zhengzhou Commodity Exchange Pure Terephthalic Acid (PTA) 44,188,344 39,317,946 4,870,398 Commodity
Shanghai Futures Exchange Steel Rebar 38,603,280 32,442,824 6,160,456 Metal
Shanghai Futures Exchange Copper 34,741,296 31,378,606 3,362,690 Metal
Dalian Commodity Exchange Linear Low Density Polyethylene (LLDPE) 33,427,790 38,364,802 -4,937,012 Commodity
Dalian Commodity Exchange Soy Oil 32,517,342 19,866,312 12,651,030 Agriculture
Shanghai Futures Exchange Rubber 26,383,670 51,710,834 -25,327,164 Commodity
Dalian Commodity Exchange Corn 24,692,472 17,891,848 6,800,624 Agriculture
Zhengzhou Commodity Exchange Cotton No. 1 17,355,272 8,159,886 9,195,386 Commodity
Zhengzhou Commodity Exchange Strong Gluten Wheat 16,617,090 11,943,450 4,673,640 Agriculture
Korea Exchange US Dollar 15,074,724 13,889,216 1,185,508 Currency
Dalian Commodity Exchange Palm Oil 14,819,420 7,507,430 7,311,990 Agriculture
Multi Commodity Exchange Silver Micro 13,816,331 14,760,348 -944,017 Metal
Multi Commodity Exchange Crude Oil 13,258,858 10,848,042 2,410,816 Energy
Shanghai Futures Exchange Silver 12443308 NA 12443308 Metal
Dalian Commodity Exchange No. 1 Soybeans 12,093,468 7,803,936 4,289,532 Agriculture
Australian Securities Exchange 3 Year Treasury Bond 11,761,826 10,424,619 1,337,207 Interest Rate
Multi Commodity Exchange Gold Petal 10,146,158 13,127,207 -2,981,049 Metal
Shanghai Futures Exchange Zinc Futures 10,108,028 15,219,758 -5,111,730 Metal
Multi Commodity Exchange Copper 9,767,287 9,095,915 671,372 Metal
Multi Commodity Exchange Silver Mini 9,604,576 10,237,962 -633,386 Metal
Multi Commodity Exchange Natural Gas 6,473,757 5,792,952 680,805 Energy
Australian Securities Exchange 90 Day Bank Bills 6,178,550 5,131,834 1,046,716 Interest Rate
Multi Commodity Exchange Gold Mini 5,913,675 5,963,119 -49,444 Metal
Zhengzhou Commodity Exchange Rapeseed Oil 5687122 1,498,030 4,189,092 Agriculture
Multi Commodity Exchange Mini Copper 5,196,578 4,443,053 753,525 Metal
Tokyo Financial Exchange Australian Dollar/ Japanese Yen 5,085,512 5,633,692 -548,180 Currency
Australian Securities Exchange 10 Year Bond 4,878,661 4,267,614 611,047 Interest Rate
Multi Commodity Exchange Silver 4,536,372 4,668,271 -131,899 Metal
Tokyo Financial Exchange Euro/ Japanese Yen 4,352,112 5,588,420 -1,236,308 Currency
Multi Commodity Exchange Nickel 3,608,958 3,938,502 -329,544 Metal
Dalian Commodity Exchange Polyvinyl Chloride (PVC) 3,161,222 4,953,456 -1,792,234 Commodity
Shanghai Futures Exchange Gold 3,144,420 3,269,380 -124,960 Metal
Tokyo Commodity Exchange Gold 2,729,826 3,210,084 -480,258 Metal
Multi Commodity Exchange Gold 2,624,932 2,692,842 -67,910 Metal
Shanghai Futures Exchange Aluminum 2,367,616 1,489,042 878,574 Metal
Tokyo Financial Exchange US Dollar/ Japanese Yen 2,208,607 3,645,093 -1,436,486 Currency
Tokyo Stock Exchange 10 Yr Japan Government Bond 2,422,461 2,049,138 373,323 Interest Rate
National Commodity & Derivatives Exchange Ref Soya Oil 1,839,497 2,167,717 -328,220 Agriculture
Zhengzhou Commodity Exchange Methanol 1821166 1,574,690 246,476 Energy
Zhengzhou Commodity Exchange Rice, Early 1701792 1,174,272 527,520 Agriculture
National Commodity & Derivatives Exchange Soybeans 1,579,639 1,996,753 -417,114 Agriculture
National Commodity & Derivatives Exchange Cotton Seed 1,422,729 969,945 452,784 Agriculture
Tokyo Financial Exchange British Pound/ Japanese Yen 1,208,037 1,315,002 -106,965 Currency
Tokyo Financial Exchange 3 Month Euroyen 1,151,016 1,040,131 110,885 Interest Rate
National Commodity & Derivatives Exchange Chana 1,108,870 1,963,396 -854,526 Agriculture
National Stock Exchange of India Euro/ Indian Rupee 1,074,989 1,271,060 -196,071 Currency
Tokyo Commodity Exchange Gold Mini 784,525 919,922 -135,397 Metal
Tokyo Commodity Exchange Platinum 746,196 877,555 -131,359 Metal
Tokyo Commodity Exchange Gasoline 621,717 605,570 16,147 Energy
United Stock Exchange US Dollar/Indian Rupee 580,719 1,717,183 -1,136,464 Currency
Tokyo Commodity Exchange Rubber 546,819 561,330 -14,511 Commodity
Total 988,106,956 784,163,666 203,943,290
* estima
ted
Sou
rce
: exch
an
ge
We
bsite
s
TO SUBSCRIBE:
http://www.asiaetrading.com/asia-etrader-magazine/
Email:[email protected]
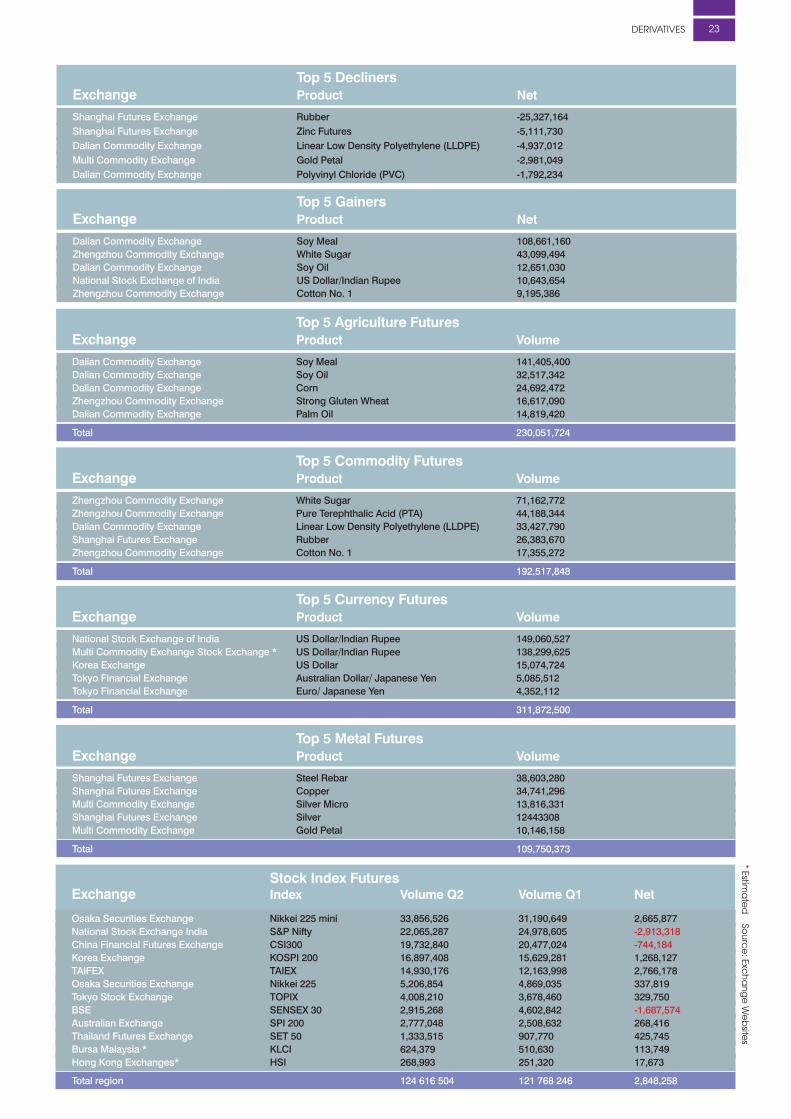
derivaTiveS 23
Top 5 Agriculture Futures Exchange Product Volume
Dalian Commodity Exchange Soy Meal 141,405,400 Dalian Commodity Exchange Soy Oil 32,517,342 Dalian Commodity Exchange Corn 24,692,472 Zhengzhou Commodity Exchange Strong Gluten Wheat 16,617,090 Dalian Commodity Exchange Palm Oil 14,819,420
Total 230,051,724
Top 5 Commodity Futures Exchange Product Volume
Zhengzhou Commodity Exchange White Sugar 71,162,772 Zhengzhou Commodity Exchange Pure Terephthalic Acid (PTA) 44,188,344 Dalian Commodity Exchange Linear Low Density Polyethylene (LLDPE) 33,427,790 Shanghai Futures Exchange Rubber 26,383,670 Zhengzhou Commodity Exchange Cotton No. 1 17,355,272
Total 192,517,848
Top 5 Currency Futures Exchange Product Volume
National Stock Exchange of India US Dollar/Indian Rupee 149,060,527 Multi Commodity Exchange Stock Exchange * US Dollar/Indian Rupee 138,299,625 Korea Exchange US Dollar 15,074,724 Tokyo Financial Exchange Australian Dollar/ Japanese Yen 5,085,512 Tokyo Financial Exchange Euro/ Japanese Yen 4,352,112
Total 311,872,500
Top 5 Metal Futures Exchange Product Volume
Shanghai Futures Exchange Steel Rebar 38,603,280 Shanghai Futures Exchange Copper 34,741,296 Multi Commodity Exchange Silver Micro 13,816,331 Shanghai Futures Exchange Silver 12443308 Multi Commodity Exchange Gold Petal 10,146,158
Total 109,750,373
Top 5 Decliners Exchange Product Net
Shanghai Futures Exchange Rubber -25,327,164 Shanghai Futures Exchange Zinc Futures -5,111,730 Dalian Commodity Exchange Linear Low Density Polyethylene (LLDPE) -4,937,012 Multi Commodity Exchange Gold Petal -2,981,049 Dalian Commodity Exchange Polyvinyl Chloride (PVC) -1,792,234
Top 5 Gainers Exchange Product Net
Dalian Commodity Exchange Soy Meal 108,661,160 Zhengzhou Commodity Exchange White Sugar 43,099,494 Dalian Commodity Exchange Soy Oil 12,651,030 National Stock Exchange of India US Dollar/Indian Rupee 10,643,654 Zhengzhou Commodity Exchange Cotton No. 1 9,195,386
Stock Index Futures Exchange Index Volume Q2 Volume Q1 Net
Osaka Securities Exchange Nikkei 225 mini 33,856,526 31,190,649 2,665,877 National Stock Exchange India S&P Nifty 22,065,287 24,978,605 -2,913,318 China Financial Futures Exchange CSI300 19,732,840 20,477,024 -744,184 Korea Exchange KOSPI 200 16,897,408 15,629,281 1,268,127 TAIFEX TAIEX 14,930,176 12,163,998 2,766,178 Osaka Securities Exchange Nikkei 225 5,206,854 4,869,035 337,819 Tokyo Stock Exchange TOPIX 4,008,210 3,678,460 329,750 BSE SENSEX 30 2,915,268 4,602,842 -1,687,574 Australian Exchange SPI 200 2,777,048 2,508,632 268,416 Thailand Futures Exchange SET 50 1,333,515 907,770 425,745 Bursa Malaysia * KLCI 624,379 510,630 113,749 Hong Kong Exchanges* HSI 268,993 251,320 17,673
Total region 124 616 504 121 768 246 2,848,258
* estima
ted
Sou
rce
: exch
an
ge
We
bsite
s
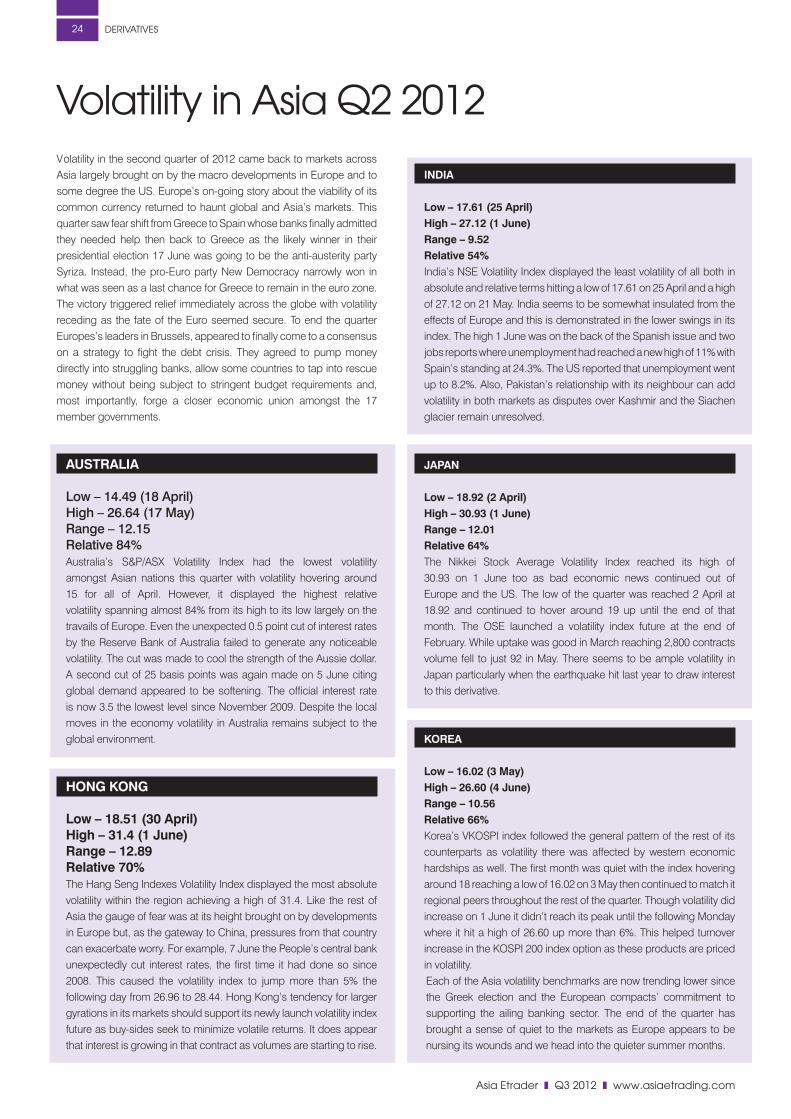
asia etrader z Q3 2012 z www.asiaetrading.com
derivaTiveS24
Volatility in the second quarter of 2012 came back to markets across Asia largely brought on by the macro developments in Europe and to some degree the US. Europe’s on-going story about the viability of its common currency returned to haunt global and Asia’s markets. This quarter saw fear shift from Greece to Spain whose banks finally admitted they needed help then back to Greece as the likely winner in their presidential election 17 June was going to be the anti-austerity party Syriza. Instead, the pro-Euro party New Democracy narrowly won in what was seen as a last chance for Greece to remain in the euro zone. The victory triggered relief immediately across the globe with volatility receding as the fate of the Euro seemed secure. To end the quarter Europes’s leaders in Brussels, appeared to finally come to a consensus on a strategy to fight the debt crisis. They agreed to pump money directly into struggling banks, allow some countries to tap into rescue money without being subject to stringent budget requirements and, most importantly, forge a closer economic union amongst the 17 member governments.
AUSTRALIA Low – 14.49 (18 April) High – 26.64 (17 May) Range – 12.15 Relative 84% Australia’s S&P/ASX Volatility Index had the lowest volatility
amongst Asian nations this quarter with volatility hovering around 15 for all of April. However, it displayed the highest relative volatility spanning almost 84% from its high to its low largely on the travails of Europe. Even the unexpected 0.5 point cut of interest rates by the Reserve Bank of Australia failed to generate any noticeable volatility. The cut was made to cool the strength of the Aussie dollar. A second cut of 25 basis points was again made on 5 June citing global demand appeared to be softening. The official interest rate is now 3.5 the lowest level since November 2009. Despite the local moves in the economy volatility in Australia remains subject to the global environment.
HONG KONG Low – 18.51 (30 April) High – 31.4 (1 June) Range – 12.89 Relative 70% The Hang Seng Indexes Volatility Index displayed the most absolute
volatility within the region achieving a high of 31.4. Like the rest of Asia the gauge of fear was at its height brought on by developments in Europe but, as the gateway to China, pressures from that country can exacerbate worry. For example, 7 June the People’s central bank unexpectedly cut interest rates, the first time it had done so since 2008. This caused the volatility index to jump more than 5% the following day from 26.96 to 28.44. Hong Kong’s tendency for larger gyrations in its markets should support its newly launch volatility index future as buy-sides seek to minimize volatile returns. It does appear that interest is growing in that contract as volumes are starting to rise.
INDIA Low – 17.61 (25 April) High – 27.12 (1 June) Range – 9.52 Relative 54% India’s NSE Volatility Index displayed the least volatility of all both in
absolute and relative terms hitting a low of 17.61 on 25 April and a high of 27.12 on 21 May. India seems to be somewhat insulated from the effects of Europe and this is demonstrated in the lower swings in its index. The high 1 June was on the back of the Spanish issue and two jobs reports where unemployment had reached a new high of 11% with Spain’s standing at 24.3%. The US reported that unemployment went up to 8.2%. Also, Pakistan’s relationship with its neighbour can add volatility in both markets as disputes over Kashmir and the Siachen glacier remain unresolved.
JAPAN Low – 18.92 (2 April) High – 30.93 (1 June) Range – 12.01 Relative 64% The Nikkei Stock Average Volatility Index reached its high of
30.93 on 1 June too as bad economic news continued out of Europe and the US. The low of the quarter was reached 2 April at 18.92 and continued to hover around 19 up until the end of that month. The OSE launched a volatility index future at the end of February. While uptake was good in March reaching 2,800 contracts volume fell to just 92 in May. There seems to be ample volatility in Japan particularly when the earthquake hit last year to draw interest to this derivative.
KOREA Low – 16.02 (3 May) High – 26.60 (4 June) Range – 10.56 Relative 66% Korea’s VKOSPI index followed the general pattern of the rest of its
counterparts as volatility there was affected by western economic hardships as well. The first month was quiet with the index hovering around 18 reaching a low of 16.02 on 3 May then continued to match it regional peers throughout the rest of the quarter. Though volatility did increase on 1 June it didn’t reach its peak until the following Monday where it hit a high of 26.60 up more than 6%. This helped turnover increase in the KOSPI 200 index option as these products are priced in volatility. Each of the Asia volatility benchmarks are now trending lower since the Greek election and the European compacts’ commitment to supporting the ailing banking sector. The end of the quarter has brought a sense of quiet to the markets as Europe appears to be nursing its wounds and we head into the quieter summer months.
volatility in asia Q2 2012

www.asiaetrading.com z Q3 2012 z asia etrader
derivaTiveS 25
TO SUBSCRIBE:
http://www.asiaetrading.com/asia-etrader-magazine/
Email:[email protected]

asia etrader z Q3 2012 z www.asiaetrading.com
Liquidnet has long been the buy-side traders block trading venue of choice in Australia, but they will be spoilt for
choice from July, when the Australian Securities Exchange (ASX) launches Centre Point Block (CPB), a centralised block-order matching service that will combine liquidity from all types of market participants.
“Traditionally about 18% of market volumes are being traded in off-exchange blocks and reported,” says Glenn Lesko, CEO of Instinet Asia. “It is a blocky market. It is difficult for institutions to get the liquidity they need in the market place. Different venues have different offerings and ASX and Chi-X are both examples.”
Block orders suffer from higher market impact than smaller orders as they take longer to fill. Once other firms know another investor plans to buy or sell a large amount of stock they can compete to be the other side of that trade at
the best price to themselves, knowing they have a guaranteed buyer/seller. Electronic market-making and inter-market arbitrage trading desks are best placed to game block orders in this manner, either within brokers’ operations or as proprietary trading firms.
Hiding your handThe ASX already offers Centre Point (CP), a dark pool (meaning there is no pre-trade disclosure of order information), which crosses anonymous orders at the midpoint of the best bid-offer price on the exchange’s central limit order book, its transparent order matching system used for normal trading.
As orders crossed on CP do not have their details disclosed pre-trade, other firms do not have the ability to game the order so easily, however a well-known loophole still makes gaming possible; because there is no lower
limit on order size, they can be posted as low as a single share, which allows firms to identify whether an order is buy or sell at the midpoint based on a very small trade. The exchange’s Centre Point Crossing (CPC) allows sell-side members to cross their client trades against their own book or against other client orders.
Trading volumes are increasing. CP saw around 750,000 trades worth almost AUS$2.5 billion in May 2012 up from 130,000 trades in May 2011 worth approximately AUS$500 million.
Will Psomadelis, head of trading at asset manager Schroders Australia, says, “As firms have become more comfortable using venues such as Liquidnet, where a midpoint cross offers price improvement to both sides, traders are beginning to consider it the acceptable price for ‘grey market’ transactions, such as sales trader blocks. As a result they
Who’s got the Biggest Blocks in australia?
BuY-Side26
Ian ChambersHead of Institutional Equities, Australia Morgan Stanley “Clients naturally are struggling with decreased
liquidity in the market”
David Stocken Senior Manager, Institutional Sales ASX Limited
“We think the MAQ will expand the universe
of stocks where Centre Point trades.”
James ChatfieldHead Liquidnet Australia
“You want to have as many tools in your kit
as possible.”
TO SUBSCRIBE:
http://www.asiaetrading.com/asia-etrader-magazine/
Email:[email protected]
www.asiaetrading.com z Q3 2012 z asia etrader
are starting to use Centre Point as a trade reporting facility.”
He notes that while CP is used directly by both sell-side and buy-side thanks to direct market access provision, CPC acts primarily as a trade reporting tool. Blocks are apparent on both. CP’s top three largest trades by value in May 2012 were AUS$6.3 million, AUS$3.8 million and AUS$3.6 million respectively. The ten largest trades on CP by average traded volume include two trades with a value of over AUS$1 million.
Some brokers are crossing trades on CPC at a size that rivals buy-side block trading venue Liquidnet. Morgan Stanley’s average trade size on CPC has been AUS$1.5 million over the last seven months, hitting an average size of AUS$3 million in September 2011, although it has fallen since, dropping to around AUS$450,000 for the last three months. Liquidnet saw an average execution size of $1.6m in May 2012, which is up 37% over the first quarter average for 2012. Brokers see the tough market condition as contributing to their increased matching of block trades.
“Up to 31 May the market value traded is down 16% year-on-year,” said Ian Chambers, head of institutional equities, Australia at Morgan Stanley. “Clients naturally are struggling with decreased liquidity in the market. Our increased block activity in venues like Centre Point reflects our willingness to provide facilitation liquidity to our clients.”
New block on the block“The answer to who has the biggest blocks in Australia changes daily and is purely a function of who is trading the block on that day,” says Psomadelis.”That is why live time transaction cost analysis is so important, identifying where successful execution is coming from. What venue gives you good execution one day and nothing the next day.”
Although CP and CPC are already destinations for some blocks, they do not represent the average trade sizes, which for CP are closer to AUS$3000, and for CPC around AUS$270,000.
One buy-side trader, who asked to remain anonymous, said they used CP regularly knowing full well that firms would try to game their orders, but they traded in such a way as to avoid giving away useful information that might signal their trading intentions.
“Everyone worked that out pretty early on,” says Steve Davis, director of electronic trading at Morgan Stanley. “The new Centre Point Block will tackle that by imposing a minimum
order value of AUS$50,000 with the ability to set a minimum number of shares you want to buy or sell, which means you would only show your hand if someone else was prepared to trade big blocks.”
ASX calls this limit a minimum acceptable quantity (MAQ), which will prevent the signalling risk that CP and CPC currently have.
“We think the MAQ will expand the universe of stocks where Centre Point trades,” says David Stocken, senior manager of institutional sales at ASX. “The other feature is that CPB will also interact with other CP orders. Several smaller Centre Point orders can aggregate and match against the CP block if they satisfy the block’s MAQ threshold.”
Six brokers – BTIG, BSLA, ITG, JP Morgan, Merrill Lynch and UBS – will be offering CPB via direct market access (DMA) from its launch in the first week of July, available either via their trading algorithms or through the IRESS trading platform.
“If you’re a buy-side guy you have to be looking at all of the ASX markets, Chi-X, Liquidnet and maybe ten broker dark pools,” says Stocken. “One thing that is true of all of those venues, with the exception of Liquidnet, is average trade sizes are quite small. If you are resting liquidity in a couple of dark pools you could be missing the action which is going on in a couple of others. That’s why we introduced a centralised block matching product.”
Fragmented too far?Whenever the number of venues increases, liquidity fragments as a consequence, but the the risk of liquidity in block venues being excessively split up is not seen as a concern yet.
Liquidnet’s director, James Chatfield, a former buy-side trader himself, says that increased block trading options should be welcomed by asset management traders.
“I was always of the view that you want to have as many tools in your kit as possible,” he said. “The outcomes we can provide as Liquidnet are quite unique, we have stringent entry requirements, but I think the other dark pool offerings also have their place.”
Fragmentation into 1000 venues would be going too far says Psomadelis, but he adds that order routing technology makes it is easy to access different venues; the harm really comes from the increased information leakage and cost.
“The problem is when fragmentation affects execution quality and that is mainly a result of increased numbers of intermediaries,” he says. “We have a situation where if we sell into a broker dark pool or a lit market, by the time
that hits another institutional investor it has passed through a number of hands. The difference between when we have sold the stock and where the eventual owner has bought the stock is the frictional cost that we are trying to minimise.”
Despite the new facility, the fundamentals of trading remains the same says Matt McKeith, an experienced buy-side trader, and former global head of equity dealing at First State Investments.
“Unless buy-side traders are willing, and have market opportunity at the time of trading, to piece together multiple parts of a single source block by seeking to match smaller trade sizes across multiple venues, it remains difficult to complete sizeable block trades with effectiveness electronically,” he said. “So despite the changing regulatory and market environment in Australia, there remains value in the traditional broker service of sourcing and matching blocks for clients, and the use of capital to facilitate such trades for their clients if required.”
“The problem is when
fragmentation affects
execution quality and
that is mainly a result of
increased numbers of
intermediaries.”
– Will Psomadelis
BuY-Side 27

asia etrader z Q3 2012 z www.asiaetrading.com
BuY-Side28
Paying for the broker services of research and execution can be inexact, and buy-side firms use a variety of methods to ensure they support the best sell-side firms and that payment for services
are transparent to the client funds that the asset managers service.Traditionally brokers were nominated to a panel or list, with buy-side
staff voting to determine the amount they were each paid according to the service received. Concerns arose in some countries over the degree to which additional ‘services’ were being included in commission payments, which in the US and UK notoriously stretched to ‘entertainment’
and other less reputable pursuits. In those countries firms were pressured to unbundle the different payments made for research and execution as a result. Commission sharing arrangements (CSAs) have been promoted as methods for unbundling, which allocate research credits to research providers, which the executing broker then pays out of total commission.
The method of broker payment varies widely from country to country. Asia Etrader spoke to three buy-side traders on their firms’ approach to dealing with the broker vote.
The Broker Panel
Q. How does the broker panel/vote system work within your firm?A. Counterparties can be empanelled following requests from fund managers, analysts, dealers or other parties based on the needs of each specific team and the overall interests of our underlying clients. Once a request has been made, we have a documented procedure that will encompass various checks including credit assessments. Every six months there will be an official vote driven by the fund management team. That vote will include input from every analyst and fund manager and once the vote is finalised, results will be shared with counterparties in a formal review. That review will also include input from the dealing team based on execution results.
The dealing team will also conduct its own reviews, based primarily on quantitative result but also including discussions around general service levels. Independently measured execution analytics are shared monthly with each executing counterparty, split by market and broken down into cash, program, electronic and facilitation trading. At the six monthly reviews this analysis, based on previous 12 months, will be included in the overall review.
Q. Has the broker vote changed over the years?A. The general principles remain the same, but the adoption of commission sharing agreements (CSAs) has led to greater autonomy for the dealing team.
Q. How has the global financial crisis affected it?A. The global financial crisis has led to an industry-wide tightening of credit checks when looking at new counterparties. Such checks have always been a part of our empanelment process but there is a danger in complacency, so procedures are constantly reviewed to ensure they are fit for purpose.
Q. Is the provision of research and execution by brokers changing?A. We have been in a lower volume environment since the financial crisis and lower volumes equate to lower revenues for the broking community. As a result brokers have upped their service and fought harder for the commission dollar. From a dealing perspective we have noticed a change in attitude from certain bulge bracket firms with far greater attention paid to execution quality and to how dealing desks are serviced.
Q. How closely is the broker vote able to mirror these changes?A. I believe our biannual reviews work well, balancing speed of reaction with allowing brokers enough time to prove their worth. In addition if a market event occurs between reviews, we would react accordingly.
Q. Has the number of brokers on the panel been affected?A. We run a stable counterparty list and do not indulge in frequent additions or removals. I believe this is in the best interests of our clients as we are then able to build long-standing relationships that are more akin to partnerships between ourselves and our brokers. We still raise issues when they occur but we do not operate in a climate of fear that can arise if brokers fear being cut at any point. Having mutual understanding and trust is, I believe, important for relationships between an asset manager and their counterparties.
Q. Are broker panels different in different countries?A. We have a core list of counterparties that we will use across Asia. In addition we will add local brokers in each market for additional corporate coverage and trade flow.
Q. What is your opinion of alternative methods of rewarding the sell-side e.g. commission sharing agreements?A. We have used CSAs for a number of years now and we believe that this benefits our clients by giving them access to the best research on the street as well as allowing our dealers to trade based on execution quality, not on research commission targets.
Richard CoulstockDirector, Head of DealingEastspring Investments
TO SUBSCRIBE:
http://www.asiaetrading.com/asia-etrader-magazine/
Email:[email protected]
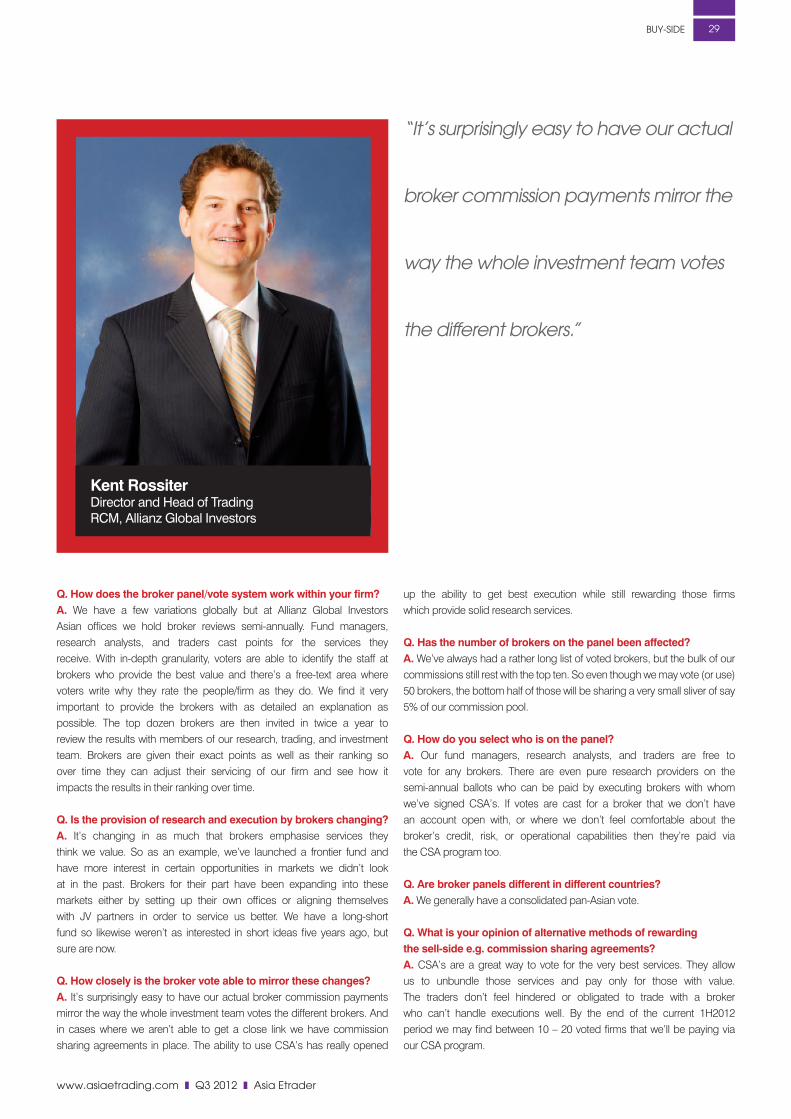
www.asiaetrading.com z Q3 2012 z asia etrader
BuY-Side 29
Q. How does the broker panel/vote system work within your firm?A. We have a few variations globally but at Allianz Global Investors Asian offices we hold broker reviews semi-annually. Fund managers, research analysts, and traders cast points for the services they receive. With in-depth granularity, voters are able to identify the staff at brokers who provide the best value and there’s a free-text area where voters write why they rate the people/firm as they do. We find it very important to provide the brokers with as detailed an explanation as possible. The top dozen brokers are then invited in twice a year to review the results with members of our research, trading, and investment team. Brokers are given their exact points as well as their ranking so over time they can adjust their servicing of our firm and see how it impacts the results in their ranking over time.
Q. Is the provision of research and execution by brokers changing?A. It’s changing in as much that brokers emphasise services they think we value. So as an example, we’ve launched a frontier fund and have more interest in certain opportunities in markets we didn’t look at in the past. Brokers for their part have been expanding into these markets either by setting up their own offices or aligning themselves with JV partners in order to service us better. We have a long-short fund so likewise weren’t as interested in short ideas five years ago, but sure are now.
Q. How closely is the broker vote able to mirror these changes?A. It’s surprisingly easy to have our actual broker commission payments mirror the way the whole investment team votes the different brokers. And in cases where we aren’t able to get a close link we have commission sharing agreements in place. The ability to use CSA’s has really opened
up the ability to get best execution while still rewarding those firms which provide solid research services.
Q. Has the number of brokers on the panel been affected?A. We’ve always had a rather long list of voted brokers, but the bulk of our commissions still rest with the top ten. So even though we may vote (or use) 50 brokers, the bottom half of those will be sharing a very small sliver of say 5% of our commission pool.
Q. How do you select who is on the panel?A. Our fund managers, research analysts, and traders are free to vote for any brokers. There are even pure research providers on the semi-annual ballots who can be paid by executing brokers with whom we’ve signed CSA’s. If votes are cast for a broker that we don’t have an account open with, or where we don’t feel comfortable about the broker’s credit, risk, or operational capabilities then they’re paid via the CSA program too.
Q. Are broker panels different in different countries?A. We generally have a consolidated pan-Asian vote.
Q. What is your opinion of alternative methods of rewarding the sell-side e.g. commission sharing agreements?A. CSA’s are a great way to vote for the very best services. They allow us to unbundle those services and pay only for those with value. The traders don’t feel hindered or obligated to trade with a broker who can’t handle executions well. By the end of the current 1H2012 period we may find between 10 – 20 voted firms that we’ll be paying via our CSA program.
Kent RossiterDirector and Head of TradingRCM, Allianz Global Investors
“It’s surprisingly easy to have our actual
broker commission payments mirror the
way the whole investment team votes
the different brokers.”

asia etrader z Q3 2012 z www.asiaetrading.com
BuY-Side30
Q. How does the broker panel/vote system work within your firm?A. Ideologically we support unbundling, we believe there is huge value with both execution and research when you split the two. What that means for us is that we can trade and be more reactive to liquidity rather than following the best research broker even though their liquidity might at times be suboptimal.
If you look at Australia most firms are on a panel system where people pay for research through execution which in my view isn’t the right model. The panel is designed around best research, and often that conflicts with the best execution model. It’s been hard to cut cheques, especially across the bulge bracket brokers. There’s a still a reluctance to move on to the model that the rest of the world is adopting and works. Certainly for smaller brokers, we have been cutting cheques for research and to be honest with the larger brokers it’s more difficult so we’ve been looking at other methods of payment such as customisation of algorithms to ensure our execution doesn’t suffer. Unbundling though has not meant that we don’t trade with smaller brokers; it just means that we trade with them when they have liquidity and the result is that their value proposition improves.
Q. Has the broker vote changed over the years?A. We have certainly been splitting research and trading increasingly over the past few years to maximise our returns on both. It is no secret that a lot of firms in Australia are accelerating their adoption of CSA’s for some of their larger execution brokers to help achieve best execution. This should not have the effect of slashing commissions across the street, rather what is designed to do is improve implicit costs (market impact) for the same amount of explicit costs therefore boosting returns for clients through a reduction in slippage.
Q. Is the provision of research and execution by brokers changing?A. Microstructure has changed so most brokers now have some kind of internalisation engine, Block trading facilities have now become far more important now however Sales traders still provide a vital function in block trading. We would rather trade against natural block liquidity because, from a market impact point of view, evidence shows that’s its most efficient way of trading. When we trade though broker dark pools the problem is that the chase for market share can sometimes distort the original objective of the dark pool. That is when you see facilitated trades in internalisation engines (self-described obligation free market makers). Brokers can generally exclude certain participants from their internalisation engines; however a Minimum Acceptable Quantity (MAQ) can have a similar effect on slippage reduction.
What we are trying to do now is look at what our adverse selection risk is when we are executing in certain broker dark pools or at certain venues, such as the ASX dark pool, through various brokers. Five years ago we had one market to trade off and a bunch of upstairs market sales traders and now with 17 venues to trade on now (that we know of!) with most of our trading being algorithmic in nature, we’ve moved to a strict analysis of when we do trade on venues, what our impact and reversion is. If we are identifying poor quality fills we decide if we should continue with a venue or chop it out for a period of time to determine if the venue increases our adverse selection risk.
Q. Do you think that the current system works well?A. The most important thing for a buy-side trader to understand where you are executing and sometimes you get more information from executing in a venue and identifying characteristics around the aggregated results of individual trades than you do from the corresponding marketing material. Unfortunately what we can’t see is where our child orders have been prior to execution and whether we have traded against principal or agent (Fix tag 29).
We use multiple providers of TCA who each have different strengths in analysing various components of a trade. It is now vital for measurement of broker, strategy and venue selection and NOT for patting ourselves on the back for beating a benchmark. We also use it to tweak our customised strategies and brokers are working with us in allowing us to switch on and off venues during the day.
Insourcing of a lot of the analysis has been helpful and the ability to identify and trade where pockets of liquidity are rather than being forced into a destination because of an analyst’s research paper is a huge positive. Our system works very well but is always evolving as technology is always improving and points of information leakage are constantly changing.
Will Psomadelis Head of Trading: Australia Schroders Investment Management Australia Limited
“we support unbundling, we believe
there is huge value with both execution
and research when you split the two.”
TO SUBSCRIBE:
http://www.asiaetrading.com/asia-etrader-magazine/
Email:[email protected]
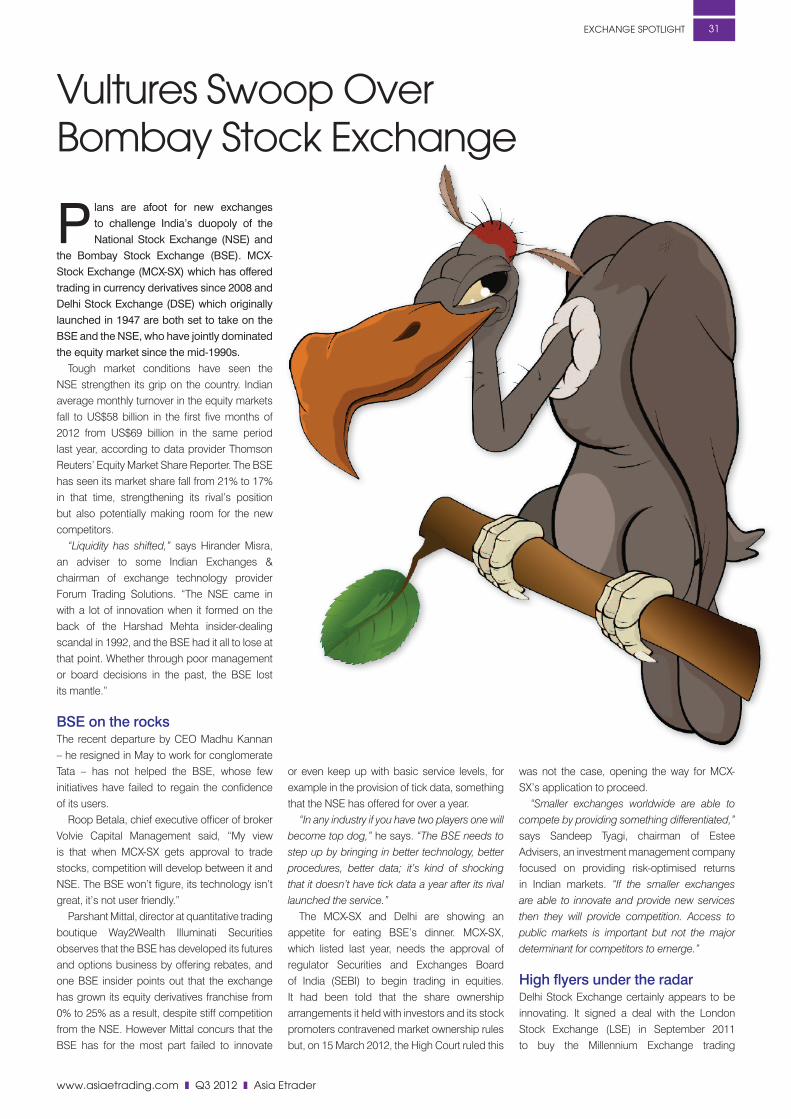
www.asiaetrading.com z Q3 2012 z asia etrader
Plans are afoot for new exchanges to challenge India’s duopoly of the National Stock Exchange (NSE) and
the Bombay Stock Exchange (BSE). MCX-Stock Exchange (MCX-SX) which has offered trading in currency derivatives since 2008 and Delhi Stock Exchange (DSE) which originally launched in 1947 are both set to take on the BSE and the NSE, who have jointly dominated the equity market since the mid-1990s.
Tough market conditions have seen the NSE strengthen its grip on the country. Indian average monthly turnover in the equity markets fall to US$58 billion in the first five months of 2012 from US$69 billion in the same period last year, according to data provider Thomson Reuters’ Equity Market Share Reporter. The BSE has seen its market share fall from 21% to 17% in that time, strengthening its rival’s position but also potentially making room for the new competitors.
“Liquidity has shifted,” says Hirander Misra, an adviser to some Indian Exchanges & chairman of exchange technology provider Forum Trading Solutions. “The NSE came in with a lot of innovation when it formed on the back of the Harshad Mehta insider-dealing scandal in 1992, and the BSE had it all to lose at that point. Whether through poor management or board decisions in the past, the BSE lost its mantle.”
BSE on the rocksThe recent departure by CEO Madhu Kannan – he resigned in May to work for conglomerate Tata – has not helped the BSE, whose few initiatives have failed to regain the confidence of its users.
Roop Betala, chief executive officer of broker Volvie Capital Management said, “My view is that when MCX-SX gets approval to trade stocks, competition will develop between it and NSE. The BSE won’t figure, its technology isn’t great, it’s not user friendly.”
Parshant Mittal, director at quantitative trading boutique Way2Wealth Illuminati Securities observes that the BSE has developed its futures and options business by offering rebates, and one BSE insider points out that the exchange has grown its equity derivatives franchise from 0% to 25% as a result, despite stiff competition from the NSE. However Mittal concurs that the BSE has for the most part failed to innovate
or even keep up with basic service levels, for example in the provision of tick data, something that the NSE has offered for over a year.
“In any industry if you have two players one will become top dog,” he says. “The BSE needs to step up by bringing in better technology, better procedures, better data; it’s kind of shocking that it doesn’t have tick data a year after its rival launched the service.”
The MCX-SX and Delhi are showing an appetite for eating BSE’s dinner. MCX-SX, which listed last year, needs the approval of regulator Securities and Exchanges Board of India (SEBI) to begin trading in equities. It had been told that the share ownership arrangements it held with investors and its stock promoters contravened market ownership rules but, on 15 March 2012, the High Court ruled this
was not the case, opening the way for MCX-SX’s application to proceed.
“Smaller exchanges worldwide are able to compete by providing something differentiated,” says Sandeep Tyagi, chairman of Estee Advisers, an investment management company focused on providing risk-optimised returns in Indian markets. “If the smaller exchanges are able to innovate and provide new services then they will provide competition. Access to public markets is important but not the major determinant for competitors to emerge.”
High flyers under the radarDelhi Stock Exchange certainly appears to be innovating. It signed a deal with the London Stock Exchange (LSE) in September 2011 to buy the Millennium Exchange trading
exChange SPoTlighT 31
vultures Swoop over Bombay Stock exchange

asia etrader z Q3 2012 z www.asiaetrading.com
exChange SPoTlighT32
platform. The system was developed by Millennium IT, the Sri Lankan technology provider headed by Tony Weeresinghe, which was acquired by the LSE in 2009 for £18 million. It is used by the LSE and will reportedly provide the members of the DSE with a roundtrip latency of 100-120 microseconds and a throughput of 50,000-100,000 messages a second. By comparison the NSE’s systems, the better of the two incumbents, offer 5-10 milliseconds roundtrip latency and 1000 messages per second. Such an increase in capacity could allow high-frequency, quantitative trading firms to employ more sophisticated strategies.
Weeresinghe is one of the DSE’s eight shareholder directors and Misra, who helped launch alternative venue Chi-X in Europe as its chief operations officer, is tipped by some observers to be the likely new head of the DSE. They are both big names to have linked to the project. Some market participants have even speculated that the London Stock Exchange Group, which had a merger with the Canadian market operator TMX quashed in June last year, could become more heavily involved with the Delhi market.
Misra says that the links with the LSE’s international investor community will mean the launch into cash equities by DSE at the
end of the year, could fly under the radar of the incumbents.
“I would argue it would do better than MCX because it is better enabled, better suited to algo trading as well as to domestic flow,” he says. “The DSE with 3000 listings has the second largest number after the BSE with 6000, and ahead of the NSE with 1500. It has a national license allowing it to trade ‘permitted securities’, approximately 1000 blue-chip stocks listed on other exchanges. Although Mumbai is the financial centre, about 40% of the liquidity on the NSE originates from Delhi. Of the DSE’s 600 members, 30 account for a large proportion of that flow.”
Keeping tabs on algosThe profile of algorithmic trading in India has changed even over the last year. The securities transaction tax that applies to cash equities takes two-thirds of the cost of a trade. As a result only dedicated electronic market makers such as Optiver have been active in the market. Algorithmic trading is used but is often accessed by a trader via a terminal rather than being a fully automated system.
However India is the largest market in Asia for single stock options according to industry body the World Federation of Exchanges; as a result it is attracting greater numbers of
overseas high-frequency trading (HFT) firms looking to access the market with support from their prime brokers or even by setting up on the ground as a broker.
However SEBI issued guidelines in April that could severely restrict the use of algos by HFT firms. Recommendations were made by SEBI’s Technical Advisory Committee (TAC) and Secondary Market Advisory Committee (SMAC) for all orders generated using automated execution logic. Among these were the imposition of “economic disincentives” by stock exchanges for order cancellation by trading firms. This would hit HFT firms in particular as they are estimated to cancel between 60-80% of their orders, ostensibly to avoid the large orders they place being adversely impacted by tiny price movements, but potentially to identify the price and direction that buy-side firms are trading stocks at, without having to commit large amounts of capital. Direct access to the market was restricted without first being routed via the server of an India-based broker.
As a precaution exchanges were also advised to identify instances of order flooding (where firms slow the exchange’s trading systems by overloading it with orders) and ‘rogue’ algos (where automated systems get caught in a feedback loop) and to deliver mechanisms for either warning the trader in question to remove

www.asiaetrading.com z Q3 2012 z asia etrader
exChange SPoTlighT 33
orders, or even shut down the trader’s terminal.With these precautions in place HFT firms will have to be more careful, but assuming an exchange’s infrastructure is up to speed, proprietary trading firms are confident that new business opportunities will open up.
All to play for“The DSE has Millennium IT Technology; that will be good,” says Mittal. “The numbers I have seen makes it are faster than the NSE according to its own quotes in the media. For latency sensitive arbitrage guys, that is a big plus. But the DSE needs to bring in both the liquidity providers and takers.”
Tyagi says that although competition is likely to launch this year, there are still obstacles to be overcome by both challengers.
“I would not be surprised if after the July deadline for SEBI approval, MCX-SX announces plans to launch equities,” he says, “That may increase the need for centralisation or inter-operability of depositories. There is a mixed feeling on increased competition – we need more depth in the markets so fragmentation is not good but on the other hand competition is helpful in prompting innovation and keeping prices low.”
The issue of post-trade infrastructure is a potential problem. The existing exchanges each
own separate clearing houses and settlement depositories effectively operating vertical silos, with no interoperability between them.
“The settlement fund is needed to provide the settlement guarantee and Delhi does not have that kind of capital, whereas MCX-SX has capital and if it wanted to raise more capital that should not be an issue for them,” says Betala.
Post-trade prequisiteMisra believes that there is the potential to work around the current system.
“You have a choice of settlement location and depot transfer between the two is quite efficient, on a T+0 basis without extra cost, but the issue is that everything settles on a gross basis not a net basis. When creating a derivatives market with separate clearing that creates additional open interest and collateral costs which is a challenge as the BSE has found.”
The use of a siloed model in derivatives trading has proven to be a strong defensive strategy for German exchange operator Deutsche Börse, whose Eurex derivatives platform has its own clearing and settlement system. As all trades conducted via its platform allow firms to net-off collateral, i.e. only post what is needed after both buy and sell positions are taken into account, the use of other clearing houses seems expensive, as additional collateral is needed
on top of that being used with Eurex. That has made firms reluctant to trade elsewhere, cementing Deutsche Börse’s dominant position and leading other exchanges, such as the LSE, to lobby regulators to open the market to competition.
“New markets can potentially use the existing clearing houses; the BSE aren’t averse to other exchanges using their clearing, the NSE might have some resistance because they have the dominant position” says Misra. He posits that by courting the new markets, BSE could help develop critical mass on its own clearing house which would support its own equity derivatives trading strategy. It would also create a better economics proposition as the current margin requirements can be up to 18% on the NSE which he observes would kill high-frequency trading (HFT) activity.
Overcoming the oddsHowever SEBI may have made the post-trade issue a moot point. At a board meeting on 2 April 2012, it discussed a committee “Review of Ownership and Governance of Market Infrastructure Institutions (MIIs)” and decided that “the central role of the clearing function will be separated into an independent corporation with its own prescribed net worth,” and that “an expert committee will be set up by SEBI to examine the viability of introducing a single clearing corporation or interoperability between different clearing corporations.” Robert Barnes, CEO of UBS Multilateral Trading Facility, an alternative trading venue in Europe, has spoken at a SEBI event on his firm’s advocacy of interoperability and the success it has had in Europe clearly made an impression, say sources.
“My prediction is that rather than create interoperability you will see the clearing houses merging over the next three years,” says Misra.
SEBI is to consider MCX-SX’s application before the end of July; Delhi has its own schedule to work to. The NSE has shown itself to be tough competition for the BSE. If the regulatory and infrastructural challenges are overcome, it seems the NSE will be the opponent and BSE a potential source of food for the other two exchanges.
Liquidity is more mobile than ever, says Mittal making MCX-SX and DSE a real threat.
“I think DSE will take a portion of the NSE’s trading,” he asserts. “Some 30% of its volume is algo driven; with electronic communication it is not difficult to go from one venue to another. Even retail order flow driven via a broker website can be automatically routed to the DSE, BSE or NSE with ease.”
TO SUBSCRIBE:
http://www.asiaetrading.com/asia-etrader-magazine/
Email:[email protected]

asia etrader z Q3 2012 z www.asiaetrading.com
riSK34
Market Surveillance Technology Spearheads integrity drive across asia exchangesRogue trading scandals to befall UBS in London in late 2011 drew parallels with the e4.9bn hit taken at Societe Generale in 2008 and Barings before that. Roger Aitken examines the landscape and developments amongst exchanges and regulators in Asia for market surveillance technology aimed at trying to ensure market integrity and spot insider trading and other abuses.
Jerome Kerviel a trader at Societe Generale lost US$6.7 billion dollars in 2008.
My dream is that we would never have to penalize any of the trading participants because they will be
following the rules. We want to have a dialogue with them and know what their problems are.” So remarked Antonio Garcia Jr., President of the Philippine Stock Exchange’s (PSE) Capital Markets Integrity Corp (CMIC) this May as it rolled out its new Total Market Surveillance system (TMS) – developed by the Korea Stock Exchange (KRX).
Hardly a day seems to pass without another rogue trading or market manipulation scandal hitting the headlines. At its most dangerous it can result in massive losses for financial institutions, as UBS and SocGen found to their cost and where traders used knowledge of back office systems to exploit loopholes. Forms of rogue trading and market abuse span a plethora of descriptions such as painting the tape and marking the close.
One of the more recent high profile cases of market manipulation in Asia occurred in late 2010 and relates to options trades by Deutsche Bank Korea (DBK) manipulating of the closing price of the index, so the KOSPI option would be in the money. It yielded US$40 million profit for the bank but also saw it receive the maximum fine of KRW 1 billion (US$900,000) from KRX’s
Market Oversight Commission (MOC), the regulator. Deutsche Securities Korea was also banned from the KRX for six months.
The trades in question were executed on November 11, 2010 ten minutes before the exchange closed on option expiration day. Initially, DBK wrote calls and bought puts underlying the KOSPI200. Then, in the last 10 minutes of trading 199 names of the underlying KOSPI index were sold across seven trades valued at USD2.2 billion – sending the index lower by 2.79% to 247.51. That decreased the short call premium and increased the long put premium.
The topic of market surveillance now seems high on the agenda for exchanges, regulators and trading firms in the region. And, despite the fragmented nature of trading venues across Asia and its less homogenised landscape vis-à-vis Europe and North America, recent market surveillance upgrades and new deployments suggest Asia is maturing.
Amir Orad, CEO for NICE Actimize, a vendor serving financial institutions across APAC with financial crime, risk and compliance solutions, states: “The diversity and the disparity in the Asia region means that every country has a different development pace. But in the more mature
countries where investment banking is big, market surveillance is clearly a priority.”
In Hong Kong the regulator is closely watching market misconduct activity and pressing financial institutions to ensure that they have the right procedures in place to monitor them. Indeed, in the past five years (since March 2007) Hong Kong’s regulator has secured more than 170 market misconduct convictions.
Orad adds: “They’re committed to the development of software solutions that will combine with their own observation, instinct and experience in identifying market misconduct. In addition, a number of European customers are using our market surveillance solution across the Asia Pacific region.”
In Australia, the Australian Securities & Investment Commission (ASIC), the financial regulator, assumed responsibility for market supervision and real-time surveillance of front-line trading from the Australian Stock Exchange (ASX) on 1 August 2010. Supervision of Chi-X Australia is included.
The regulator has been using the SMARTS real-time market surveillance system since August 2010, with the ASX having surveillance responsibility now for ensuring compliance by listed companies via continuous disclosure obligations. The exchange also uses the
“

www.asiaetrading.com z Q3 2012 z asia etrader
riSK 35
SMARTS application, a system developed by SMARTS Group, an Australian vendor to exchanges, regulators and brokers, which Nasdaq OMX announced it would acquire in July 2010.
Greg Medcraft, ASIC Chairman, speaking to the Stockbrokers Association of Australia’s annual conference this June referred to a federal budget commitment by the Government for ASIC to invest in a new and enhanced market surveillance system. This would allow for a future that includes handling significantly increased messaging traffic, new technologies and trading techniques, as well as heightened competition between trading venues.
Medcraft stated: “It will replace the existing market surveillance system and improve on technology, which was originally designed for a single market environment. It will be a significant system upgrade, which will allow for greater capacity and capability, as well as cope with the increase in HFT and algorithmic trading.”
The system will also have “superior capabilities to search data records and identify suspicious trading by connecting patterns and relationships.” Medcraft noted it would improve ASIC’s strategic priority for “detection of insider trading relationships.”
For exchanges and regulators SMARTS Integrity, a market supervision and control tool, provides real-time and T+1 systems for market surveillance, market supervision and market compliance. For brokers, SMARTS Broker –delivered via a browser-based application – is a managed service designed for this community, FCM’s and other market participants to help them comply with internal market surveillance and risk policies.
Fredrik Backlund, Head of Marketing at Cinnober Financial Technology, a Swedish-
based IT supplier, commenting says: “There is clearly growing interest and demand for market surveillance and compliance technology globally. Asia is now coming up increasingly on the radar and there is a high level of interest.”
The Scila Surveillance system being deployed by Cinnober today is utilized by a leading trading venues such as Deutsche Börse, newer initiatives like Burgundy (a Nordic MTF), Turquoise Derivatives and the Hong Kong Mercantile Exchange (HKMex).
“HKMex was one of Cinnober’s first customers to opt and deploy the Scila surveillance technology when the exchange marketplace launched some three years ago,” Backlund explains. “In respect to Scila and HKMex the technology has shown its capabilities on the exchange to monitor trading in instruments as diverse as equities, futures and options, CFDs, FX and energy contracts.”
In a forthcoming development, Backlund revealed: “Following an evaluation process involving all system suppliers with international operations, the Stock Exchange of Thailand (SET) selected Cinnober as its technology partner when replacing its entire infrastructure for order matching, data distribution and market surveillance for their equities and derivatives trading.”
He added: “The rollout of the new system will start to go live in 2012 for equities and thereafter for derivatives in 2013.” For equities the expectation is early Q3 2012. SET is understood to be replacing SMARTS with Scila Surveillance.
TMS, the Philippines Stock Exchange CMIC’s new state-of-the-art surveillance system aims to develop and promote a culture of transparency, integrity and creating a fair market place. CMIC President Garcia Jr. indicated that TMS would enable the exchange to conduct
further investigations and crack down on price manipulation and other illegal or unregulated trading prices.
The system is equipped to monitor at least one million orders/trades per trading day and takes a real-time data feed directly from the exchange’s trading engine, processes it in real time, automatically spotting anomalies and generating alerts.
Turning to South Korea, KRX’s MOC introduced an upgraded its market surveillance back in early January 2011. The development was held up as an aid to enhance the credibility of KRX’s markets and its ability to protect the investors. Today, KRX MOC operates the COSMOSS market surveillance system covering equities, derivatives and other asset classes.
The system brought in during 2011 touted major features such as an improved unfair trading detection model, automation of analysis of the accounts suspicious of being involved in unfair trading, plus various analytical tools such as a visual analysis system. Surveillance officers could use these in identifying abnormal trading.
Technology certainly contributes in significant measure to catching rogue trading and other frauds like money laundering. “It’s also critical to have staff behind the IT systems responding and examining alerts and taking further investigations to decide if certain situations presents a major issue,” Orad argues.
Chief Risk Officers at banks and trading firms – be they in Europe, North America or Asia Pacific – need also to rely on far more data for detection and “connect up the dots” – not solely look at trades. The age of Chief Rogue Trading Deterrence Officer might just be dawning soon in some large financial institutions.
Nicholas Leeson former head trader of Barings Bank lost US$1.5 billion in 1995. Yasuo Hamanaka of Sumitomo Corporation of Japan lost US$2.6 billion dollars in 1998.John Rusnak, a trader employed by Allied Irish Bank lost US$750 million dollars in 2002.
TO SUBSCRIBE:
http://www.asiaetrading.com/asia-etrader-magazine/
Email:[email protected]

asia etrader z Q3 2012 z www.asiaetrading.com
36 oPinion & analYSiS
Asia Etrader: How did you start your career in electronic trading?Emily Yu: The beginning of my career in electronic trading was in April 1993 when I joined the SZSE. At that time, the exchange was planning to develop the second generation trading system where I was recruited for the research and development of that trading platform. By understanding the existing trading system, I was involved in implementing the matching engine rules under the existing regulations. During the past 19 years my major experience has been in trading system planning, designing and development having participated in the second, the third and the fourth generation trading systems at the SZSE. Currently, I am leading a team to develop the fifth generation trading system.
AE: Tell us about the exchange matching engine technology including orders per second, latency, and market data dissemination.EY: The SZSE matching engine is currently the fourth generation. The SZSE is at multi-tier market that includes the Main Board, the SME (Small Medium Enterprise) board, ChiNext and also supports OTC . As such, there are two sets of matching engines in production, one serving the Main Board, the SME Board and the ChiNext and the other one serving the OTC market. One system is able to process 40,000 transactions per second, with an internal Round Trip Time
of approximately 35 milliseconds. For our market data, Level 1 information is updated every 3 seconds, Level 2 data mainly provides the commercial service of tick by tick trade. We have been doing our best to improve our trading system. The first step will be to improve the present performance by doubling the current speed to reach 80,000 transactions per second. This is expected to go live on or before June 2013. We are also expanding the functionality at the application level to support the development of the China Market. Meanwhile, we have started development of the fifth generation trading system on 11th November 2011, and it’s expected to go live by 2015. Our goal of the upgrade plan is to achieve both high performance at low cost. We are planning to reach a target of executing 200,000 to 300,000 transactions per second with a round trip time of 5 – 10 milliseconds.
AE: Tell us about the SZSE surveillance system?EY: Our exchange surveillance system and matching engine were developed between 1999 and 2001 at the same time when we built our fourth generation technology. The surveillance system is divided into two major parts. The first section is real time surveillance and the other piece is the after-trade investigation and analysis system. The core concept of this surveillance system is setting up a series of alarm indicators
based on common investor behaviors. Based on these indicators, the system will collect real time orders and trades in the market and then process at real time for monitoring allowing us to receive timely alerts and reports of abnormal trades. Also, the after- trade system can follow unusual active trading in the market say from news releases, where we can shortlist certain accounts for in-depth analysis to ascertain if there is any market manipulation or inside trading. Our surveillance system is very robust and effectively handling hundreds of millions of orders per day.
AE: What are the exchanges plans for offering co-location?
Emily Yu, Head of the IT Strategy and Planning Department at the Shenzhen Stock Exchange (SZSE), sat down with Asia Etrader and gave us her insights on the developing electronic trading space in China, the SZSE and the HKEx, alternative trading venues and dark pools, algorithmic trading and high frequency trading, surveillance and the ‘Flash Crash’, how the industry has changed in the last five years and what to expect in the next five.
emily Yu
“...system is able
to process 40,000
transactions per
second, with an internal
Round Trip Time of
approximately 35
milliseconds.”
Who’S Who36
asia etrader z Q3 2012 z www.asiaetrading.com
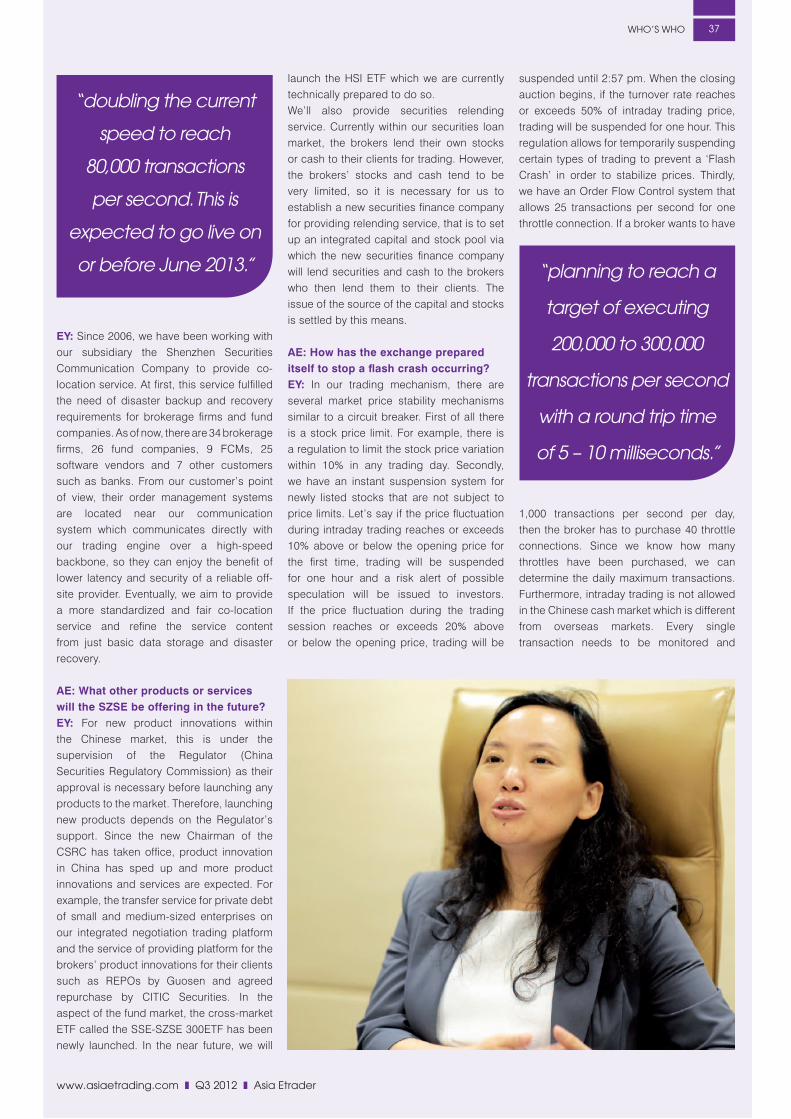
www.asiaetrading.com z Q3 2012 z asia etrader
oPinion & analYSiS 37
EY: Since 2006, we have been working with our subsidiary the Shenzhen Securities Communication Company to provide co-location service. At first, this service fulfilled the need of disaster backup and recovery requirements for brokerage firms and fund companies. As of now, there are 34 brokerage firms, 26 fund companies, 9 FCMs, 25 software vendors and 7 other customers such as banks. From our customer’s point of view, their order management systems are located near our communication system which communicates directly with our trading engine over a high-speed backbone, so they can enjoy the benefit of lower latency and security of a reliable off-site provider. Eventually, we aim to provide a more standardized and fair co-location service and refine the service content from just basic data storage and disaster recovery.
AE: What other products or services will the SZSE be offering in the future?EY: For new product innovations within the Chinese market, this is under the supervision of the Regulator (China Securities Regulatory Commission) as their approval is necessary before launching any products to the market. Therefore, launching new products depends on the Regulator’s support. Since the new Chairman of the CSRC has taken office, product innovation in China has sped up and more product innovations and services are expected. For example, the transfer service for private debt of small and medium-sized enterprises on our integrated negotiation trading platform and the service of providing platform for the brokers’ product innovations for their clients such as REPOs by Guosen and agreed repurchase by CITIC Securities. In the aspect of the fund market, the cross-market ETF called the SSE-SZSE 300ETF has been newly launched. In the near future, we will
launch the HSI ETF which we are currently technically prepared to do so. We’ll also provide securities relending service. Currently within our securities loan market, the brokers lend their own stocks or cash to their clients for trading. However, the brokers’ stocks and cash tend to be very limited, so it is necessary for us to establish a new securities finance company for providing relending service, that is to set up an integrated capital and stock pool via which the new securities finance company will lend securities and cash to the brokers who then lend them to their clients. The issue of the source of the capital and stocks is settled by this means.
AE: How has the exchange prepared itself to stop a flash crash occurring?EY: In our trading mechanism, there are several market price stability mechanisms similar to a circuit breaker. First of all there is a stock price limit. For example, there is a regulation to limit the stock price variation within 10% in any trading day. Secondly, we have an instant suspension system for newly listed stocks that are not subject to price limits. Let’s say if the price fluctuation during intraday trading reaches or exceeds 10% above or below the opening price for the first time, trading will be suspended for one hour and a risk alert of possible speculation will be issued to investors. If the price fluctuation during the trading session reaches or exceeds 20% above or below the opening price, trading will be
suspended until 2:57 pm. When the closing auction begins, if the turnover rate reaches or exceeds 50% of intraday trading price, trading will be suspended for one hour. This regulation allows for temporarily suspending certain types of trading to prevent a ‘Flash Crash’ in order to stabilize prices. Thirdly, we have an Order Flow Control system that allows 25 transactions per second for one throttle connection. If a broker wants to have
1,000 transactions per second per day, then the broker has to purchase 40 throttle connections. Since we know how many throttles have been purchased, we can determine the daily maximum transactions. Furthermore, intraday trading is not allowed in the Chinese cash market which is different from overseas markets. Every single transaction needs to be monitored and
“doubling the current
speed to reach
80,000 transactions
per second. This is
expected to go live on
or before June 2013.” “planning to reach a
target of executing
200,000 to 300,000
transactions per second
with a round trip time
of 5 – 10 milliseconds.”
Who’S Who 37
www.asiaetrading.com z Q3 2012 z asia etrader

checked for a position first which means you can sell only the shares you have on hand. Under the above mechanisms the ‘Flash Crash’ that occurred in the US market last year won’t appear in our market.
AE: Do you see the HKEx being a dominant player in China in the future?EY: The HKEx serves as a bridge between the Chinese and the international capital markets. In many respects, the HKEx provides for us a learning opportunity for our mainland exchanges in order to help us better understand the needs of the international players. On the other hand, the HKEx is one of our competitors with respect to listing companies as many of China’s firms are choosing to raise money
across the border in Hong Kong. However, the services provided by the Shanghai Stock Exchange, Shenzhen Stock Exchange and the HKEx have their own unique functions and differentiation in the capital market. Certainly, the international profile and product line of the HKEx provides a great model for us to learn by. In the future, we will have many chances to cooperate on cross-market projects such as ETFs and we also look forward to building the exchange link among the China markets in the near future.
AE: What are some of the regulatory challenges China’s trading community faces? EY: In my opinion, there are three regulatory challenges. First is fairness, not only for investors, but also the regulator and exchanges are concerned with how they can provide fairness in the market to all participants. The second is transparency of information. Information relevant to traded products and their issuers may be sent in a misleading way causing unfair trading. Trading has to be transparent and open and everyone should receive the same information. This is one of the goals of the stock exchange and the regulator. The third challenge is risk prevention. Under this premise the exchanges have set up the price stability system mentioned earlier as well as surveillance and trade monitoring. To this end we require tight pre-trade risk controls.
For brokers, we have strict regulations before sending trades. All brokers must undergo a pre-trade risk control certification where accounts and positions are validated. The exchange has strict guidelines in order to minimize risk to the market preventing among other things Flash Crashes and other events that undermine investor confidence.
AE: What is your opinion on High Frequency Trading? EY: Fairness and information disclosure are the basic requirements for algorithmic and high frequency trading in China. This trading style is a growing trend and expanding rapidly in the US and European markets while China is only at the beginning stage. Our regulator pays special attention to program trading and high frequency trading as they are becoming more popular in the market. The regulator is writing the trading
rules and regulations to supervise these new trading styles. When considering certain activities such as dark pool trading, we are also discussing the implications of fairness and taking into account transparency issues before we offer these types of trading venues into market.
AE: Why has High Frequency Trading been slow to grow in China? EY: There are some restrictions on high frequency trading. Intra-day trading of stocks is not allowed as you can only sell positions which are settled. In China that is T+1. Secondly, our market data update frequency is not fast enough, as real-time tick data is necessary for investors to make decisions that are high frequency in nature. Also, the stamp duty is relatively high among markets making it prohibitively expensive. All of these factors together have restricted the development of high frequency trading. I believe in the future, high frequency trading
“SZSE’s block trade
market has become
increasingly active,
its trading value
achieved over 70 billion
Yuan in 2011.”
“The major restriction
to offering alternative
trading venues is
that our regulators
have to believe they
make sense .”
Who’S Who38
asia etrader z Q3 2012 z www.asiaetrading.com
TO SUBSCRIBE:
http://www.asiaetrading.com/asia-etrader-magazine/
Email:[email protected]
will develop quickly when these barriers are removed. Also when the market has more options for hedging different products this will boost the demand for high frequency trading strategies.
AE: How does block trading occur in China?EY: Block trading is a secondary trading process in China. With the surging demand to sell unlocked shares since 2008, SZSE’s block trade market has become increasingly active, its trading value achieved over 70 billion Yuan in 2011, but block trading accounts for only about 0.3% of all trading value. We also find that professional institutional investors including fund companies account for less than 3% of all block trading value. Block orders are usually handled by a fund company’s own order management systems that splits blocks into small orders. We do have an integrated negotiation trading platform supporting block trading though it is inactive because it is difficult to find firms willing to take the other side. Block transactions are subject to regulatory scrutiny under fair trade practices which, depending on who is on the other side of the transaction, may trigger an investigation. To avoid any regulatory intervention institutional investors seldom trade block orders on the public platform but prefer using the OMS to slice small orders to send to the exchange’s order book.
AE: Do you expect the CSRC to permit the operation of Dark Pool trading? EY: I think we need to examine if there is a need for dark pool trading in the market. We also need to observe the impact of dark pools in international markets. As I mentioned, all newly implemented trading services have to come with a set of regulations and measurements. Recently, we researched the feasibility of an ECN in China which would allow for brokers to become ECNs on a small scale, so that when an order is placed with a broker, they will first try to match that order internally with those trades not being matched sent to the exchange. There is a wide ranging discussion of ECNs among industry pioneers and experts on
this topic, setting up policies and rules like RegNMS and MIFID in the west. The venues may have a better chance in ten years time but not in five year from my personal point of view. The major restriction to offering alternative trading venues is that our regulators have to believe they make sense and that they are prepared to manage different kinds of ECNs under intense competition.
AE: How has trading in China changed in the last 5 years? EY: In the last 5 years, the China market has grown rapidly in terms of shares available for trading and products available for investment. The number of SZSE listed companies, our SZSE ETF product and the launch of stock index futures are just some of the examples. From the view point of investors, market
participation has also been growing fast. In one single market there are over one hundred million active accounts and the institutional investor base is growing equally fast in terms of size and quantity. Market structure has also improved greatly. The exchanges are capable of handling many transactions ranking China among the top exchanges worldwide in terms of volume. Another major change is investor access through the internet and cell phones. Previously, we had more than 3,000 sales offices where many investors placed their orders through a representative at a counter or through a machine but with the availability of the internet and cell phones over 85% of our investors are now placing orders via these channels. Another change is that brokers are centralizing the trading management and clearing and settlement process from local offices to a central point, usually the head office. The use of program trading and algorithmic trading has seen a big change though the size of
such trading is not very large now but we still see a lot of brokers and funds investing in research and development. Finally, I see the participants are putting more resources into IT system over the last 5 years, largely because securities companies have put in place policies that they should invest a certain amount into trading technology. This sustains the development of the market going forward.
AE: How do you see electronic trading in China evolving over the next 5 years?EY: Firstly, I think the trading regulations will have further developed to improve the overall market environment, such as allowing intraday trading for unsettled securities and allowing for more new products to certain investor groups. We will see the development of algorithmic trading and program trading which will bring in a new set of rules from the regulator and the exchange to serve and support this kind of trading. I also see trading system technology and functionality will be improved in terms of efficiency and the number of features available. This will lower development cycles, reduce system upgrades and handle orders much more effectively. Improvement in IT will also contribute to the development of algorithmic and high frequency trading in the future. Cooperation between exchanges will continue to evolve and will not be limited to the domestic players but also to those outside of China. By doing so, we can expand the scope of participants and
investors attracting overseas players to the China market. I see the China capital markets will further open up which will cultivate a competitive environment among domestic brokers and the exchanges to foreign players. In the meantime, we will have to equip ourselves to be ready for global competition in the future. Also, we will have to learn new trading architecture and infrastructure techniques from overseas firms such as the ‘Cloud’ and complex event processing (CEP).
“Since the new
Chairman of the CSRC
has taken office,
product innovation in
China has sped up.”
Who’S Who 39
www.asiaetrading.com z Q3 2012 z asia etrader
“there are over one
hundred million
active accounts.”
“There is a regulation
to limit the stock price
variation within 10% in
any trading day.”

asia etrader z Q3 2012 z www.asiaetrading.com
It was designed to act as an independent liquidity aggregator for the sell-side. It also offered another execution option in the form
of a dark pool, that expanded the range of available execution options, conducting block transactions and offering price improvement.
Chi-East was a pioneer for choice in Asia’s markets and was the first to bring the central counterparty model to Asia with LCH.Clearnet. It even won awards. The roundtable asked simply; what happened?
Tony Mackay, former Chairman of Chi-X Europe said that his first thought was one of disappointment but not complete surprise.
“If you look at what we did in Europe with Chi-X there had been a few failures beforehand,” he said. “The consortium ‘Tradepoint’ was
expected to succeed but didn’t. Instinet had tried with an alternative market in Europe and that hadn’t worked. In Asia Chi-East pioneered an exchange-backed model, alternative clearing and trying to get people to change there habits leads to the ultimate chicken and egg situation. The problem is that firms tell you to come back to them when you have got more liquidity.”
The complexity of the offering was seen as a barrier for new users by Steve Grob, head of strategy at trading system supplier Fidessa. He noted that new pioneering alternative venues had to articulate in “cat and dog language” how they make trading better or cheaper and for who.
“Chi-X and others have done this very well but for Chi-East it was more difficult; it had the joint
venture parentage, uncertainty over the names it had to trade and it conflicted with brokers’ own crossing networks on whom it was dependent for liquidity,” he said. “So it did not articulate a clear business proposition.”
Another challenge was the lack of a core supplier of liquidity to the system, Mackay observed. When he launched Chi-X in Europe it had six firms, including Optiver, Getco and Citadel who were bringing high frequency trading (HFT) liquidity for the first time. He said that Chi-East had drawn its model from John Lowrey’s experience with Baikal and the London Stock Exchange (LSE). Lehman Brothers had been intended to stand behind Baikal with the commitment to provide two-way liquidity.
“There wasn’t same pool with Chi-East,
eQuiTieS40
Chi-East commenced operations on 11 November 2010, trading securities listed in Hong Kong, Japan and Singapore; access to Australian securities was prevented when the data feed it was using was cut off just prior to launch by the Australian Securities Exchange (ASX).
The autopsy of Chi-east

eQuiTieS 41
www.asiaetrading.com z Q3 2012 z asia etrader
people want to see liquidity and no-one likes to be the first person at the party,” said Mackay. “Chi-East didn’t attract that and so was fighting a losing battle.”
Josephine Kim, director SE Asia Bank of America Merrill Lynch, added that the disappointment about Chi-East was also felt by brokers, for whom its failure was also not a surprise.
“When they initially approached us we did conduct studies internally to evaluate if we should take part from the start,” she said. “Our decision was to wait for the go-live date to see how it goes. The timing was critical; the second and third tier brokers were spending time trying to develop their dark pools, so it was beyond their resources trying to reach out and do something with an external vendor.”
Beyond the lack of connection to brokers, Grob also wondered if the connection to a primary exchange set it apart from many alternative venues which identify themselves as a way to show unhappiness with the primary exchange.
McKay acknowledged there was little differentiation with SGX but noted it was trying to bring a centralised hub to trading other major markets in the Asia Pacific region.
“It just wasn’t that classic David and Goliath,” said Grob.
Asked if they felt the regulatory environment may have been too restrictive, Mackay explained that although there were some difficulties operating out of Singapore with minimum cross sizes and capital requirements, “There isn’t a perfect place in Asia, as no other market has created rules to set up any sort of alternative exchange, giving the confidence that it can operate in the same way in a few years’ time.”
The level of regulation on Chi-East had been higher than for most broker crossing networks so that had some impact on its success he said, “The size of the minimum trade didn’t offer protection to the firms coming to Chi-East; the whole objective should have been professional investors trading and they don’t need the size to trade at mandated, so that was a factor.”
“What we hear from clients is that there is a demand from the buy-side, asking why we need to go through venues separately rather than
via an aggregated pool,” said Kim. “They see that happening elsewhere and want to know why this is not happening in Asia. There are brokers looking at ways to make this happen so I’m optimistic this will be seen in Asia, we are getting studies from the quant teams to see if there is any specificity in the pools, so I think that this is the right time to move into something more aggregated.”
The advantage of doing a project like this on a global basis would be to save on the large amounts of money being spent by the sell-side on connecting crossing networks and by the buy-side and vendors connecting to them all.
“So there’s an opportunity to take some of that spend on the arms race and take the cost off the table, it could be win-win,” he asserted.
The type of liquidity that Chi-East tried to attract was one of its weak points the panellists agreed. HFT liquidity was not an option said Grob; Chi-X Europe had brought in Optiver, Getco, and other HFT electronic liquidity provision firms, whose model only works if liquidity is spread over multiple venues.
“HFT in dark pools is different; it is trying to sniff out trading intentions by dropping in breadcrumbs of liquidity and then getting large block orders to following it around different pools of liquidity,” said Grob. “So I never saw Chi-East as HFT friendly.”
Mackay added that most institutions that want to trade blocks of stock try to trade natural liquidity against natural liquidity against not HFT liquidity provision, even from an electronic liquidity provider.
“If you keep to that, the natural/natural crossing rate is between 5-10% and that is the problem Chi-East had,” he said.
Still, the panellists were positive about similar model’s future prospects in Asia. “I think this will open the doors,” said Kim. “We are learning from the experience. There are other exchanges offering pools, Korea is doing something similar. Liquidity is getting thin, there is demand in Asia whether it is brokers aggregating or another vendor, exchange-linked or a joint venture, I think there will be a lot of other potential forms.”
“The genie is out of the bottle,” added Mackay. “But dark pools need to work on developing the same ability they used to have when brokers were crossing on the telephone. If the buy-side had a big order in the past they could go to someone to get a price in size for them, a capital commitment, they could give the order to a trusted broker who would phone around, find the other side and work it on the floor. Technology has left firms with much dumber matching engines. The next breed of dark pools will involve liquidity aggregation without disenfranchising the sell-side.”
“Why do we need to
go through venues
separately rather than
via an aggregated pool.”
TO SUBSCRIBE:
http://www.asiaetrading.com/asia-etrader-magazine/
Email:[email protected]
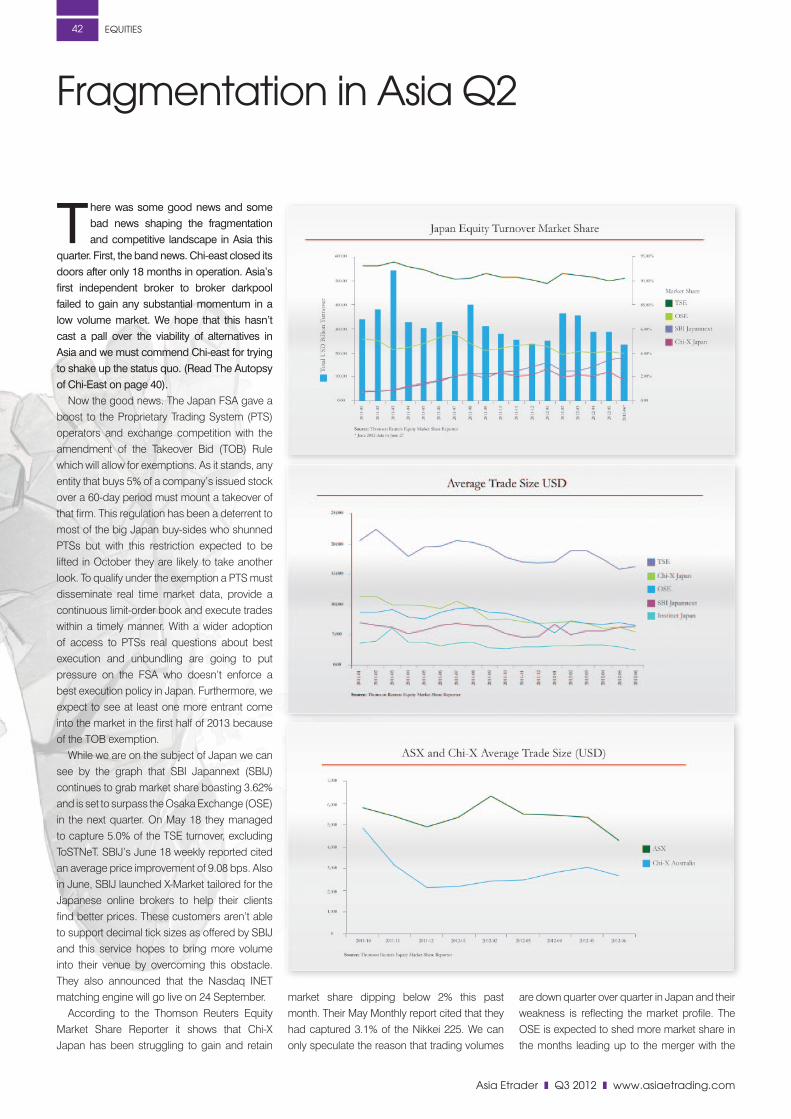
asia etrader z Q3 2012 z www.asiaetrading.com
eQuiTieS42
There was some good news and some bad news shaping the fragmentation and competitive landscape in Asia this
quarter. First, the band news. Chi-east closed its doors after only 18 months in operation. Asia’s first independent broker to broker darkpool failed to gain any substantial momentum in a low volume market. We hope that this hasn’t cast a pall over the viability of alternatives in Asia and we must commend Chi-east for trying to shake up the status quo. (Read The Autopsy of Chi-East on page 40).
Now the good news. The Japan FSA gave a boost to the Proprietary Trading System (PTS) operators and exchange competition with the amendment of the Takeover Bid (TOB) Rule which will allow for exemptions. As it stands, any entity that buys 5% of a company’s issued stock over a 60-day period must mount a takeover of that firm. This regulation has been a deterrent to most of the big Japan buy-sides who shunned PTSs but with this restriction expected to be lifted in October they are likely to take another look. To qualify under the exemption a PTS must disseminate real time market data, provide a continuous limit-order book and execute trades within a timely manner. With a wider adoption of access to PTSs real questions about best execution and unbundling are going to put pressure on the FSA who doesn’t enforce a best execution policy in Japan. Furthermore, we expect to see at least one more entrant come into the market in the first half of 2013 because of the TOB exemption.
While we are on the subject of Japan we can see by the graph that SBI Japannext (SBIJ) continues to grab market share boasting 3.62% and is set to surpass the Osaka Exchange (OSE) in the next quarter. On May 18 they managed to capture 5.0% of the TSE turnover, excluding ToSTNeT. SBIJ’s June 18 weekly reported cited an average price improvement of 9.08 bps. Also in June, SBIJ launched X-Market tailored for the Japanese online brokers to help their clients find better prices. These customers aren’t able to support decimal tick sizes as offered by SBIJ and this service hopes to bring more volume into their venue by overcoming this obstacle. They also announced that the Nasdaq INET matching engine will go live on 24 September.
According to the Thomson Reuters Equity Market Share Reporter it shows that Chi-X Japan has been struggling to gain and retain
market share dipping below 2% this past month. Their May Monthly report cited that they had captured 3.1% of the Nikkei 225. We can only speculate the reason that trading volumes
are down quarter over quarter in Japan and their weakness is reflecting the market profile. The OSE is expected to shed more market share in the months leading up to the merger with the
Fragmentation in asia Q2

www.asiaetrading.com z Q3 2012 z asia etrader
eQuiTieS 43
TSE. Its core business has been in derivatives and that segment has been performing well.
An examination of the average trade size on the various venues shows that this trend is lower except for SBIJ which has maintained a tight 12 month average of just above US5,800. The decreasing trend lends to an increase in algorithmic trading whether it be high frequency or sell side algos slicing ever smaller child orders. As mentioned, trading volume is down and this doesn’t necessarily support the HFT camp. While Instinet Japan is not a JSCC-clearing PTS we thought it worthwhile to include them in the tick size graph to show that there’s is amongst the smallest in the industry with a 12 month rolling average of just over US3,100. We suspect the Nighthawk algo is well placed with liquidity centers and is able to find a better price despite the volume.
AustraliaOverall trading volume is down quarter over quarter in Australia too but despite this Chi-X has managed to retain its market share of close to 2.6%. Its volume this quarter more than doubled compared to the first quarter of the year. We thought it worth mentioning that Chi-X doesn’t offer an auction session and have compared their market share results with the regular trading session of the ASX and market share, according to Thomson Reuters Equity Market Share Reporter, jumps to over 5%. Volume in ASX’s auction section has averaged over 12% of total trading volume in the last 12 months.
Average trade size continues to trend lower on the ASX and Chi-X is finding its legs around the US2,800 level. Chi-X’s weekly report ended June 22 claimed a market share of 3.01% of the overall market and an average price improvement of 22.74 bps.
ASX publishes monthly data on its advanced order types and among them information on its successful Centre Point venue that anonymously matches at the mid-point. In May, volume achieved a record A$2.4 billion on 741,566 trades with an average trade size of A$3,271. It should be noted that this data is double counted. According to David Raper, ASX General Manager Trade Execution and Information Services, “Centre Point has delivered over A$70 million in price improvement to customers since its launch in 2010”.
We have listed the top 5 brokers by volume and value using Centre Point and the global investments banks dominate with very small trade sizes. Instinet has the lowest trade size of all members at just A$724. It suggests that Nighthawk once again is able
to find the smallest amount of liquidity in Australia. Virtu Financial is a market making firm and have made it to the top 5 in terms of volume. We’ll be watching this company as something of a bellwether for HFT Down Under.
The ASX plans to launch Centre Point Block as an extension of its Center Point order type. Here, clients will be able to select
minimum order sizes for their trades. They will also introduce a ‘sweep’ functionality that will seek price improvement in Centre Point for marketable orders before sending the trade to the main CLOB.
In other news, Liquidnet set a new trading record in Australia during May trading over AU $1 billion with an average trade size of AU $1,573,916.
Top 5 Brokers By Volume Trades Value Traded ($M) AVG Trade Size
UBS SECURITIES 312,192 $848.80 2,719
DEUTSCHE 279,796 $727.00 2,598
VIRTU FINANCIAL 110,438 $239.50 2,169
INSTINET 109,157 $79.00 724
CITIGROUP 107,162 $497.40 4,642
Top 5 Brokers By Value Value Traded ($M) Trades AVG Trade Size
UBS SECURITIES $848.80 312,192 2,719
DEUTSCHE $727.00 279,796 2,598
CITIGROUP $497.40 107,162 4,642
CREDIT SUISSE $304.40 32,186 9,458
MORGAN STANLEY $262.30 55,085 4,762
Centre Point Highlights
TO SUBSCRIBE:
http://www.asiaetrading.com/asia-etrader-magazine/
Email:[email protected]
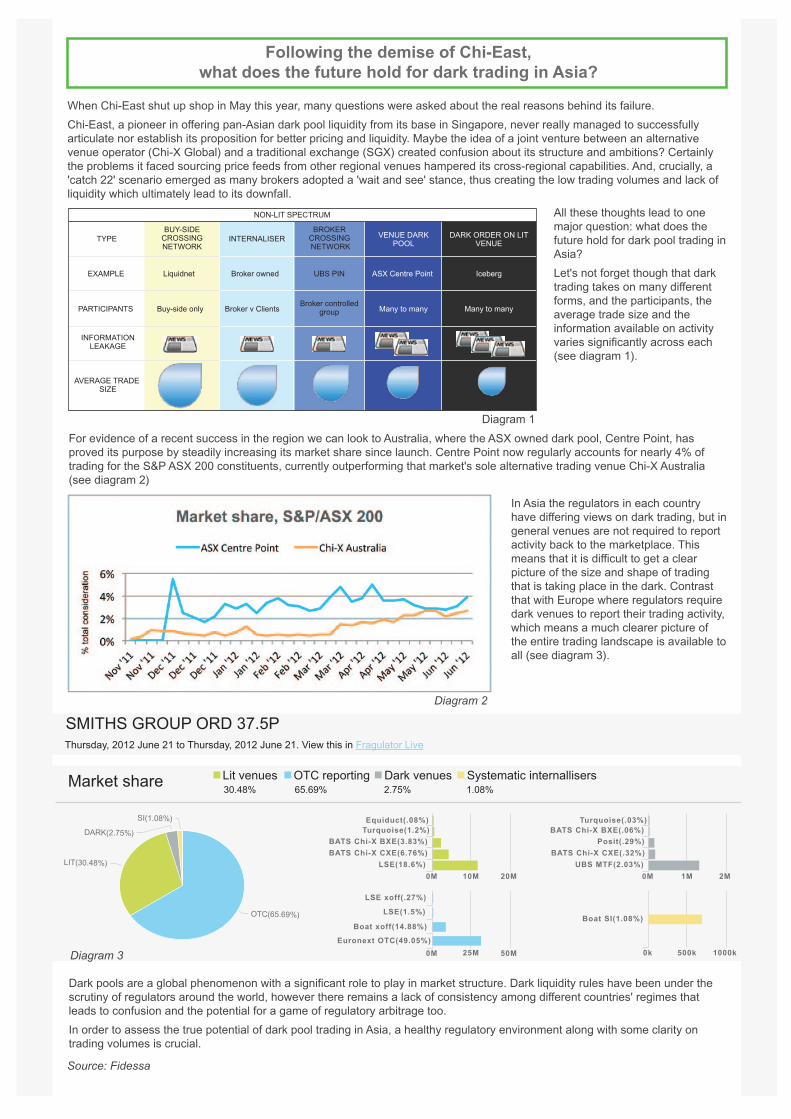
Following the demise of Chi-East, what does the future hold for dark trading in Asia?
When Chi-East shut up shop in May this year, many questions were asked about the real reasons behind its failure.
Chi-East, a pioneer in offering pan-Asian dark pool liquidity from its base in Singapore, never really managed to successfully articulate nor establish its proposition for better pricing and liquidity. Maybe the idea of a joint venture between an alternative venue operator (Chi-X Global) and a traditional exchange (SGX) created confusion about its structure and ambitions? Certainly the problems it faced sourcing price feeds from other regional venues hampered its cross-regional capabilities. And, crucially, a 'catch 22' scenario emerged as many brokers adopted a 'wait and see' stance, thus creating the low trading volumes and lack of liquidity which ultimately lead to its downfall.
For evidence of a recent success in the region we can look to Australia, where the ASX owned dark pool, Centre Point, has proved its purpose by steadily increasing its market share since launch. Centre Point now regularly accounts for nearly 4% of trading for the S&P ASX 200 constituents, currently outperforming that market's sole alternative trading venue Chi-X Australia (see diagram 2)
Dark pools are a global phenomenon with a significant role to play in market structure. Dark liquidity rules have been under the scrutiny of regulators around the world, however there remains a lack of consistency among different countries' regimes that leads to confusion and the potential for a game of regulatory arbitrage too.
In order to assess the true potential of dark pool trading in Asia, a healthy regulatory environment along with some clarity on trading volumes is crucial.
Source: Fidessa
All these thoughts lead to one major question: what does the future hold for dark pool trading in Asia?
Let's not forget though that dark trading takes on many different forms, and the participants, the average trade size and the information available on activity varies significantly across each (see diagram 1).
In Asia the regulators in each country have differing views on dark trading, but in general venues are not required to report activity back to the marketplace. This means that it is difficult to get a clear picture of the size and shape of trading that is taking place in the dark. Contrast that with Europe where regulators require dark venues to report their trading activity, which means a much clearer picture of the entire trading landscape is available to all (see diagram 3).
Diagram 2
Diagram 1
TYPEBUY-SIDE
CROSSINGNETWORK
INTERNALISERBROKER
CROSSING NETWORK
NON-LIT SPECTRUM
VENUE DARKPOOL
DARK ORDER ON LITVENUE
ASX Centre Point Iceberg
Many to manyMany to many
UBS PIN
Broker controlledgroup
Broker owned
Broker v Clients
Liquidnet
Buy-side only
EXAMPLE
PARTICIPANTS
INFORMATIONLEAKAGE
AVERAGE TRADE SIZE
SMITHS GROUP ORD 37.5P
Market share Lit venues30.48%
DARK(2.75%)
SI(1.08%)
LIT(30.48%)
OTC(65.69%)
65.69% 2.75% 1.08%
OTC reporting Dark venues Systematic internallisers
Thursday, 2012 June 21 to Thursday, 2012 June 21. View this in Fragulator Live
Turquoise(1.2%)
BATS Chi-X BXE(3.83%)
BATS Chi-X CXE(6.76%)
LSE(18.6%)
0M 20M10M
25M
Equiduct(.08%)
Posit(.29%)
BATS Chi-X BXE(.06%)
BATS Chi-X CXE(.32%)
UBS MTF(2.03%)
0M 2M1M
Turquoise(.03%)
LSE(1.5%)
Boat xoff(14.88%)
Euronext OTC(49.05%)
0M 50M
LSE xoff(.27%)
Boat SI(1.08%)
0k 1000k500kDiagram 3

www.asiaetrading.com z Q3 2012 z asia etrader
eQuiTieS 45
E
xcha
nge
Ave
rage
Tra
de S
ize
Ave
rage
Tra
de S
ize
A
vera
ge T
rade
Siz
e S
hare
Tra
de S
ize
Q
2 20
12 (U
SD
) Q
1 20
12 (U
SD
) C
hang
e Q
2 20
12 (U
SD
) Q
1 20
12 (U
SD
) C
hang
e
A
ustr
alia
n S
ecur
ities
Exc
hang
e 5,
927
6,65
0 -7
24
2,65
4 2,
886
-233
B
SE
52
6 61
6 -8
9 27
5 31
1 -3
7
H
anoi
Sto
ck E
xcha
nge
1,14
4 1,
043
102
2,36
7 2,
530
-162
H
ochi
min
h S
tock
Exc
hang
e 2,
974
2,83
4 14
1 4,
184
4,28
3 -9
9
H
ong
Kon
g E
xcha
nges
13
,462
14
,532
-1
,070
20
,889
25
,934
-5
,045
In
done
sia
Sto
ck E
xcha
nge
3,29
1 3,
415
-124
26
,509
27
,518
-1
,009
K
orea
Exc
hang
e 3,
196
3,62
1 -4
25
371
365
6
K
OS
DA
Q
914
1,20
8 -2
94
331
361
-30
B
ursa
Mal
ysia
6,
397
5,80
1 59
6 13
,182
14
,850
-1
,668
N
ew Z
eala
nd E
xcha
nge
9,61
2 10
,220
-6
08
3,77
8 4,
059
-281
N
atio
nal S
tock
Exc
hang
e of
Indi
a 1,
236
1,48
9 -2
53
400
467
-66
O
saka
Sec
uriti
es E
xcha
nge
6,76
0 7,
169
-409
76
1 99
2 -2
31
P
hilip
pine
Sto
ck E
xcha
nge
7,52
5 6,
743
782
109,
642
231,
065
-121
,423
S
inag
pore
Exc
hang
e 9,
920
11,5
47
-1,6
27
23,2
09
18,0
06
5,20
3
S
hang
hai S
tock
Exc
hang
e 2,
918
2,89
1 27
2,
127
2,21
4 -8
7
S
henz
en S
tock
Exc
hang
e 7,
400
7,44
3 -4
3 4,
825
4,84
7 -2
2
Ta
iwan
Sto
ck E
xcha
ge
14,5
89
17,6
37
-3,0
48
10,7
23
13,9
64
-3,2
40
S
tock
Exc
hang
e of
Tha
iland
5,
146
5,98
3 -8
37
22,3
48
24,0
98
-1,7
50
To
kyo
Sto
ck E
xcha
nge
16,4
78
18,3
22
-1,8
44
2,13
9 2,
567
-428
Source: Thomson reuters equity Market Share reporter
equity Trading recap
E
xcha
nge
Valu
e S
hare
Tra
ding
Va
lue
Sha
re T
radi
ng
S
hare
Vol
ume
Sha
re V
olum
e
Num
ber T
rade
s N
umbe
r Tra
des
Q2
2012
(US
D)
Q1
2012
(US
D)
Net
Q
2 20
12
Q1
2012
N
et
Q2
2012
Q
1 20
12
Net
A
ustr
alia
n S
ecur
ities
Exc
hang
e 23
6,23
6,52
5,94
7 25
8,26
5,03
1,80
6 -2
2,02
8,50
5,85
9 10
5,76
5,53
2,75
2 11
2,08
8,66
9,67
8 -6
,323
,136
,926
39
,858
,659
38
,833
,935
1,
024,
724
B
SE
23
,434
,830
,982
35
,745
,282
,191
-1
2,31
0,45
1,20
9 12
,227
,153
,638
18
,078
,873
,716
-5
,851
,720
,078
44
,511
,363
58
,070
,540
-1
3,55
9,17
7
H
anoi
Sto
ck E
xcha
nge
846,
455,
192
609,
116,
514
237,
338,
678
1,75
0,83
3,20
0 1,
477,
430,
500
273,
402,
700
739,
611
584,
078
155,
533
H
ochi
min
h 3,
079,
762,
631
1,99
2,22
3,48
9 1,
087,
539,
142
4,33
2,31
4,68
0 3,
011,
068,
530
1,32
1,24
6,15
0 1,
035,
435
703,
014
332,
421
H
ong
Kon
g E
xcha
nges
26
6,52
5,92
1,38
2 33
6,50
3,76
4,92
5 -6
9,97
7,84
3,54
3 41
3,55
4,82
0,52
3 60
0,52
0,37
1,83
6 -1
86,9
65,5
51,3
13
19,7
97,7
53
23,1
55,3
30
-3,3
57,5
77
In
done
sia
Sto
ck E
xcha
nge
24,9
61,8
67,9
61
24,8
06,7
40,9
44
155,
127,
017
201,
062,
200,
514
199,
892,
157,
858
1,17
0,04
2,65
6 7,
584,
577
7,26
3,94
3 32
0,63
4
K
orea
Exc
hang
e 26
1,83
0,08
6,34
7 34
0,54
9,04
2,35
9 -7
8,71
8,95
6,01
2 30
,425
,186
,052
34
,336
,021
,562
-3
,910
,835
,510
81
,912
,074
94
,042
,608
-1
2,13
0,53
4
K
OS
DA
Q
92,3
56,6
46,3
83
144,
993,
072,
920
-52,
636,
426,
537
33,4
68,6
90,1
42
43,3
58,1
46,6
14
-9,8
89,4
56,4
72
100,
996,
813
119,
990,
441
-18,
993,
628
B
ursa
Mal
ysia
28
,056
,818
,643
32
,951
,715
,002
-4
,894
,896
,359
57
,813
,822
,500
84
,347
,702
,600
-2
6,53
3,88
0,10
0 4,
385,
721
5,67
9,98
5 -1
,294
,264
N
ew Z
eala
nd E
xcha
nge
2,05
7,49
8,10
9 1,
772,
801,
267
284,
696,
842
808,
718,
126
704,
015,
156
104,
702,
970
214,
053
173,
456
40,5
97
N
atio
nal S
tock
Exc
hang
e of
Indi
a 11
3,68
6,17
3,86
7 16
4,38
3,53
7,03
0 -5
0,69
7,36
3,16
3 36
,822
,508
,988
51
,514
,039
,074
-1
4,69
1,53
0,08
6 91
,963
,608
11
0,40
7,14
5 -1
8,44
3,53
7
O
saka
Sec
uriti
es E
xcha
nge
38,3
13,7
15,4
97
44,4
36,8
91,9
65
-6,1
23,1
76,4
68
4,31
3,11
1,49
6 6,
147,
231,
313
-1,8
34,1
19,8
17
5,66
7,82
0 6,
198,
345
-530
,525
P
hilip
pine
Sto
ck E
xcha
nge
10,1
71,2
42,4
80
11,4
09,4
80,9
69
-1,2
38,2
38,4
89
148,
199,
551,
759
390,
997,
491,
976
-242
,797
,940
,217
1,
351,
664
1,69
2,15
3 -3
40,4
89
S
inag
pore
Exc
hang
e 52
,647
,721
,858
68
,204
,755
,366
-1
5,55
7,03
3,50
8 12
3,18
1,57
9,68
8 10
6,35
7,93
7,71
0 16
,823
,641
,978
5,
307,
405
5,90
6,65
8 -5
99,2
53
S
hang
hai S
tock
Exc
hang
e 72
5,55
5,26
1,27
5 74
6,34
6,90
9,74
9 -2
0,79
1,64
8,47
4 52
8,85
9,40
7,98
4 57
1,53
2,75
1,70
1 -4
2,67
3,34
3,71
7 24
8,67
0,98
2 25
8,20
2,95
7 -9
,531
,975
S
henz
en S
tock
Exc
hang
e 61
6,38
9,54
1,66
9 65
2,11
6,23
4,40
3 -3
5,72
6,69
2,73
4 40
1,90
2,31
0,71
2 42
4,65
9,39
3,58
9 -2
2,75
7,08
2,87
7 83
,299
,703
87
,613
,471
-4
,313
,768
Ta
iwan
Sto
ck E
xcha
ge
149,
544,
648,
883
208,
851,
955,
777
-59,
307,
306,
894
109,
923,
984,
900
165,
354,
464,
900
-55,
430,
480,
000
10,2
50,8
33
11,8
41,7
69
-1,5
90,9
36
S
tock
Exc
hang
e of
Tha
iland
50
,713
,416
,256
58
,204
,974
,834
-7
,491
,558
,578
22
0,23
2,42
8,03
0 23
4,43
8,38
9,97
0 -1
4,20
5,96
1,94
0 9,
854,
602
9,72
8,50
0 12
6,10
2
To
kyo
Sto
ck E
xcha
nge
851,
178,
802,
402
973,
296,
106,
235
-122
,117
,303
,833
11
0,46
2,73
9,01
1 13
6,34
4,04
7,26
5 -2
5,88
1,30
8,25
4 51
,654
,083
53
,121
,345
-1
,467
,262
To
tal
3,54
7,58
6,93
7,76
4 4,
105,
439,
637,
745
-557
,852
,699
,981
2,
545,
106,
894,
695
3,18
5,16
0,20
5,54
8 -6
40,0
53,3
10,8
53
809,
056,
759
893,
209,
673
-84,
152,
914
TO SUBSCRIBE:
http://www.asiaetrading.com/asia-etrader-magazine/
Email:[email protected]

asia etrader z Q3 2012 z www.asiaetrading.com
eQuiTieS46
TO SUBSCRIBE:
http://www.asiaetrading.com/asia-etrader-magazine/
Email:[email protected]
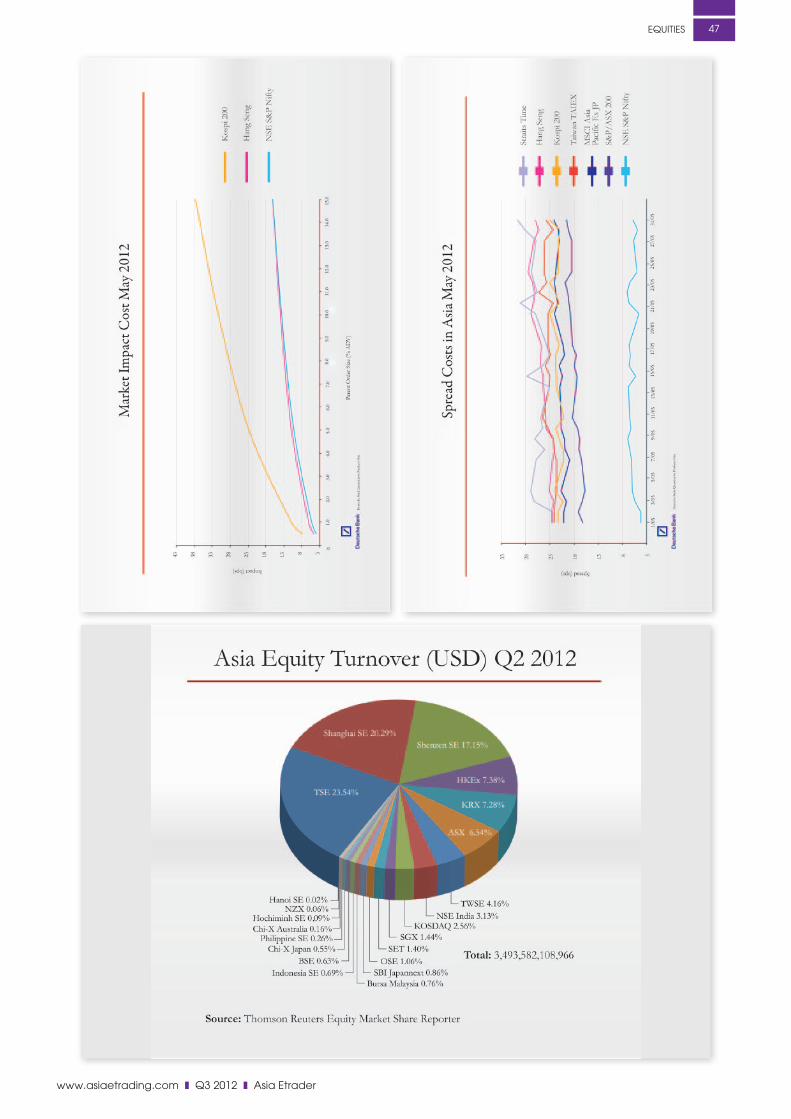
www.asiaetrading.com z Q3 2012 z asia etrader
eQuiTieS 47

asia etrader z Q3 2012 z www.asiaetrading.com
eQuiTieS48
A new reporting regime for holders of ‘net short’ positions in shares traded on the Hong Kong Stock Exchange (‘HKEx’) came into effect on 18 June 2012, as originally proposed in ‘Conclusions on Further Consultation on the Securities & Futures (Short Position Reporting) Rules’ (10 Feb 2012), a 25-page paper published by Hong Kong’s financial regulator, the Securities and Futures Commission (SFC).
It comes less than a month after short selling of stocks in Hong Kong surged to their highest level since 1999 on 23 May 2012. Hong Kong already has a fairly stringent short selling regime, which was introduced after the 1998 Asian financial crisis. Only ‘covered’ short selling is permitted subject to the seller meeting certain eligibility requirements.
The SFC decided to begin a market consultation process in 2009 following the Lehman collapse in September 2008, with a proposal to make short selling activities more transparent to the regulator. The SFC’s latest consultation received ten written responses from financial institutions and professional bodies, with most respondents supporting reporting of net short positions.
Objectives of New RegimeThe new rules require that a person holding a short position as beneficial owner of ‘specified shares’ – the value of which equals or exceeds prescribed thresholds – and report its position to the SFC weekly. The regime does not extend to positions held through derivatives.
The objective is to increase the SFC’s understanding of any stock-specific or marketwise risks on a weekly basis – and daily if necessary – by increasing overall transparency of short selling activities.
This will enable assessment to be made as to whether any action needs to be taken to prevent disruption to the market.
The SFC intends to publish the aggregated reported short position for each stock on its web site through a portal – the Short Positions Reporting Service (SPRS). However, disclosure will not reveal publicly the names or positions of individual short sellers. Failure to comply with the new reporting rules will be a criminal offence, unless persons with the reportable position have a reasonable excuse.
Key FeaturesA short position in relation to any ‘specified shares’ is defined as the position in those shares that a person has as a result of selling the shares at or through the HKEx or by one or more
specified authorized automated trading services.A net short position must be reported to the SFC, if as at the
close of trading on the Friday of any week (the ‘Reporting Day’) the short position value held in a stock equals or exceeds the lesser of: (a) HK$30 million (c.US$3.87m); and, (b) 0.02% of the value of the total number of shares issued by the applicable listed company. Calculation is made by multiplying closing price of shares by total number of shares.
It should be noted that a reportable short position held on a reporting day must be reported to the SFC within two business days after the reporting day.
The SFC’s ‘Short Positions Reporting Service’ has been added to the regulator’s Online Services Portal through which market participants submit reportable short positions using a downloadable template. This is in a Comma Separated Value (CSV) format, which is commonly used for exchanging data. Publishing of data on aggregated short positions is proposed to commence on 7 September 2012.
Specified shares are constituents of the Hang Seng Index and the Hang Seng China Enterprise Index plus other ‘designated’ securities determined by HKEx. These will be published on the SFC’s website (www.sfc.hk), with subscribers notified of any changes through an email alert service – Short Position Reporting Related Matters.
There are also specific reporting requirements where the short position is held in trust, by a collective investment scheme or by a partnership (e.g. an investment fund). Prior to first time reporting, a person who has the duty to report under the rules must register with the SPR Service.
hong Kong ‘Short-Selling’ reporting regime introduced to Plan by Roger Aitken
Note: The SFC’s online portal can be accessed by market participants via: https://portal.sfc.hk/sfcportal/sfc_online_portal/online_service.html
TO SUBSCRIBE:
http://www.asiaetrading.com/asia-etrader-magazine/
Email:[email protected]

www.asiaetrading.com z Q3 2012 z asia etrader
eQuiTieS 49
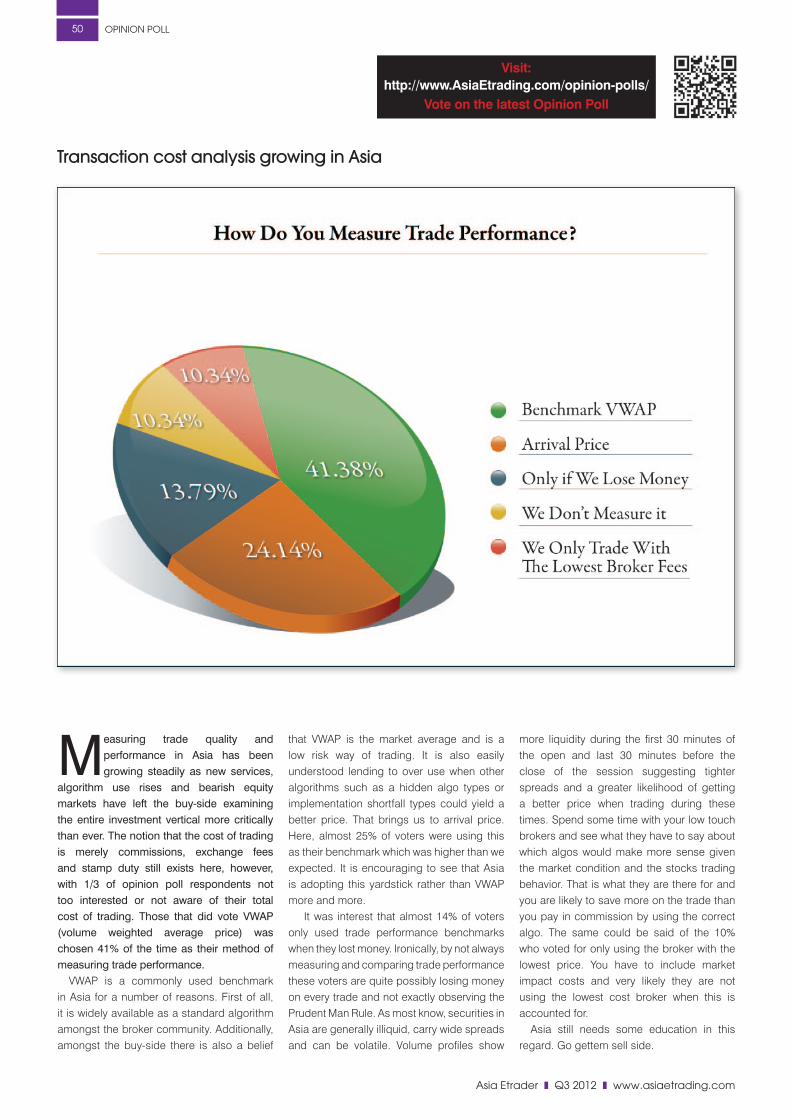
asia etrader z Q3 2012 z www.asiaetrading.com
oPinion Poll50
Measuring trade quality and performance in Asia has been growing steadily as new services,
algorithm use rises and bearish equity markets have left the buy-side examining the entire investment vertical more critically than ever. The notion that the cost of trading is merely commissions, exchange fees and stamp duty still exists here, however, with 1/3 of opinion poll respondents not too interested or not aware of their total cost of trading. Those that did vote VWAP (volume weighted average price) was chosen 41% of the time as their method of measuring trade performance.
VWAP is a commonly used benchmark in Asia for a number of reasons. First of all, it is widely available as a standard algorithm amongst the broker community. Additionally, amongst the buy-side there is also a belief
that VWAP is the market average and is a low risk way of trading. It is also easily understood lending to over use when other algorithms such as a hidden algo types or implementation shortfall types could yield a better price. That brings us to arrival price. Here, almost 25% of voters were using this as their benchmark which was higher than we expected. It is encouraging to see that Asia is adopting this yardstick rather than VWAP more and more.
It was interest that almost 14% of voters only used trade performance benchmarks when they lost money. Ironically, by not always measuring and comparing trade performance these voters are quite possibly losing money on every trade and not exactly observing the Prudent Man Rule. As most know, securities in Asia are generally illiquid, carry wide spreads and can be volatile. Volume profiles show
more liquidity during the first 30 minutes of the open and last 30 minutes before the close of the session suggesting tighter spreads and a greater likelihood of getting a better price when trading during these times. Spend some time with your low touch brokers and see what they have to say about which algos would make more sense given the market condition and the stocks trading behavior. That is what they are there for and you are likely to save more on the trade than you pay in commission by using the correct algo. The same could be said of the 10% who voted for only using the broker with the lowest price. You have to include market impact costs and very likely they are not using the lowest cost broker when this is accounted for.
Asia still needs some education in this regard. Go gettem sell side.
Visit: http://www.AsiaEtrading.com/opinion-polls/
Vote on the latest Opinion Poll
Transaction cost analysis growing in Asia
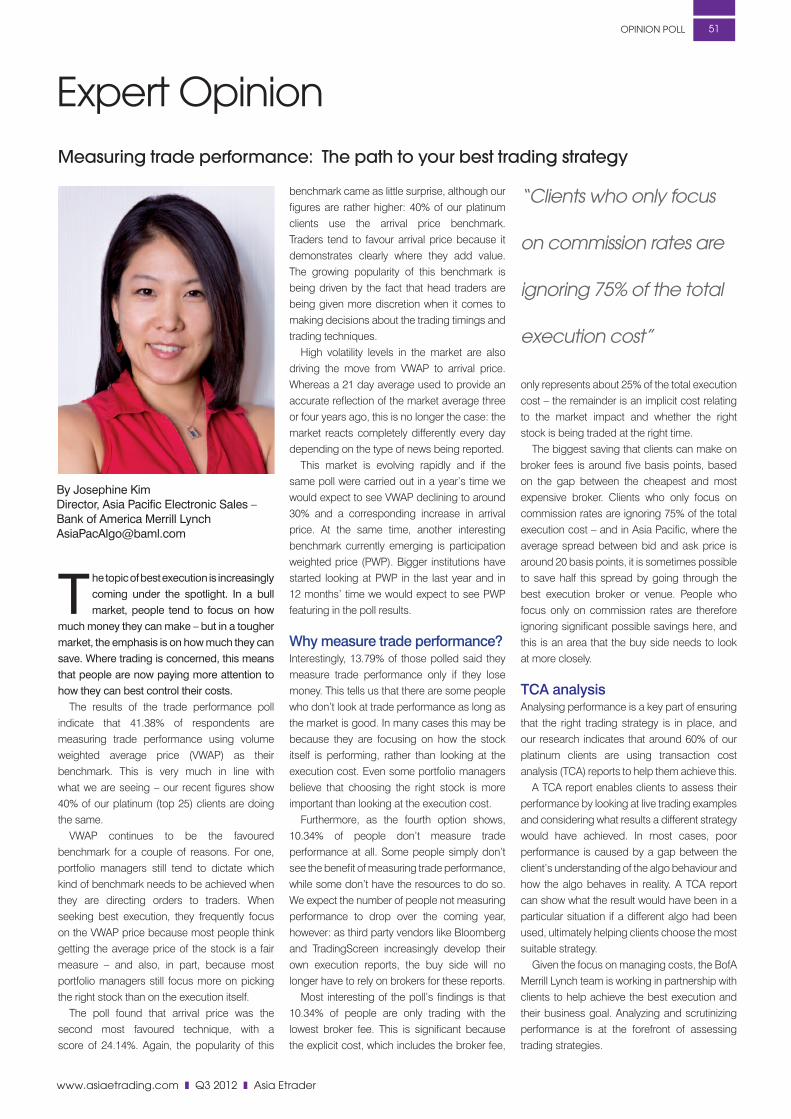
www.asiaetrading.com z Q3 2012 z asia etrader
oPinion Poll 51
expert opinion
The topic of best execution is increasingly coming under the spotlight. In a bull market, people tend to focus on how
much money they can make – but in a tougher market, the emphasis is on how much they can save. Where trading is concerned, this means that people are now paying more attention to how they can best control their costs.
The results of the trade performance poll indicate that 41.38% of respondents are measuring trade performance using volume weighted average price (VWAP) as their benchmark. This is very much in line with what we are seeing – our recent figures show 40% of our platinum (top 25) clients are doing the same.
VWAP continues to be the favoured benchmark for a couple of reasons. For one, portfolio managers still tend to dictate which kind of benchmark needs to be achieved when they are directing orders to traders. When seeking best execution, they frequently focus on the VWAP price because most people think getting the average price of the stock is a fair measure – and also, in part, because most portfolio managers still focus more on picking the right stock than on the execution itself.
The poll found that arrival price was the second most favoured technique, with a score of 24.14%. Again, the popularity of this
benchmark came as little surprise, although our figures are rather higher: 40% of our platinum clients use the arrival price benchmark. Traders tend to favour arrival price because it demonstrates clearly where they add value. The growing popularity of this benchmark is being driven by the fact that head traders are being given more discretion when it comes to making decisions about the trading timings and trading techniques.
High volatility levels in the market are also driving the move from VWAP to arrival price. Whereas a 21 day average used to provide an accurate reflection of the market average three or four years ago, this is no longer the case: the market reacts completely differently every day depending on the type of news being reported.
This market is evolving rapidly and if the same poll were carried out in a year’s time we would expect to see VWAP declining to around 30% and a corresponding increase in arrival price. At the same time, another interesting benchmark currently emerging is participation weighted price (PWP). Bigger institutions have started looking at PWP in the last year and in 12 months’ time we would expect to see PWP featuring in the poll results.
Why measure trade performance?Interestingly, 13.79% of those polled said they measure trade performance only if they lose money. This tells us that there are some people who don’t look at trade performance as long as the market is good. In many cases this may be because they are focusing on how the stock itself is performing, rather than looking at the execution cost. Even some portfolio managers believe that choosing the right stock is more important than looking at the execution cost.
Furthermore, as the fourth option shows, 10.34% of people don’t measure trade performance at all. Some people simply don’t see the benefit of measuring trade performance, while some don’t have the resources to do so. We expect the number of people not measuring performance to drop over the coming year, however: as third party vendors like Bloomberg and TradingScreen increasingly develop their own execution reports, the buy side will no longer have to rely on brokers for these reports.
Most interesting of the poll’s findings is that 10.34% of people are only trading with the lowest broker fee. This is significant because the explicit cost, which includes the broker fee,
only represents about 25% of the total execution cost – the remainder is an implicit cost relating to the market impact and whether the right stock is being traded at the right time.
The biggest saving that clients can make on broker fees is around five basis points, based on the gap between the cheapest and most expensive broker. Clients who only focus on commission rates are ignoring 75% of the total execution cost – and in Asia Pacific, where the average spread between bid and ask price is around 20 basis points, it is sometimes possible to save half this spread by going through the best execution broker or venue. People who focus only on commission rates are therefore ignoring significant possible savings here, and this is an area that the buy side needs to look at more closely.
TCA analysisAnalysing performance is a key part of ensuring that the right trading strategy is in place, and our research indicates that around 60% of our platinum clients are using transaction cost analysis (TCA) reports to help them achieve this.
A TCA report enables clients to assess their performance by looking at live trading examples and considering what results a different strategy would have achieved. In most cases, poor performance is caused by a gap between the client’s understanding of the algo behaviour and how the algo behaves in reality. A TCA report can show what the result would have been in a particular situation if a different algo had been used, ultimately helping clients choose the most suitable strategy.
Given the focus on managing costs, the BofA Merrill Lynch team is working in partnership with clients to help achieve the best execution and their business goal. Analyzing and scrutinizing performance is at the forefront of assessing trading strategies.
Measuring trade performance: The path to your best trading strategy
By Josephine KimDirector, Asia Pacific Electronic Sales – Bank of America Merrill Lynch [email protected]
“Clients who only focus
on commission rates are
ignoring 75% of the total
execution cost”
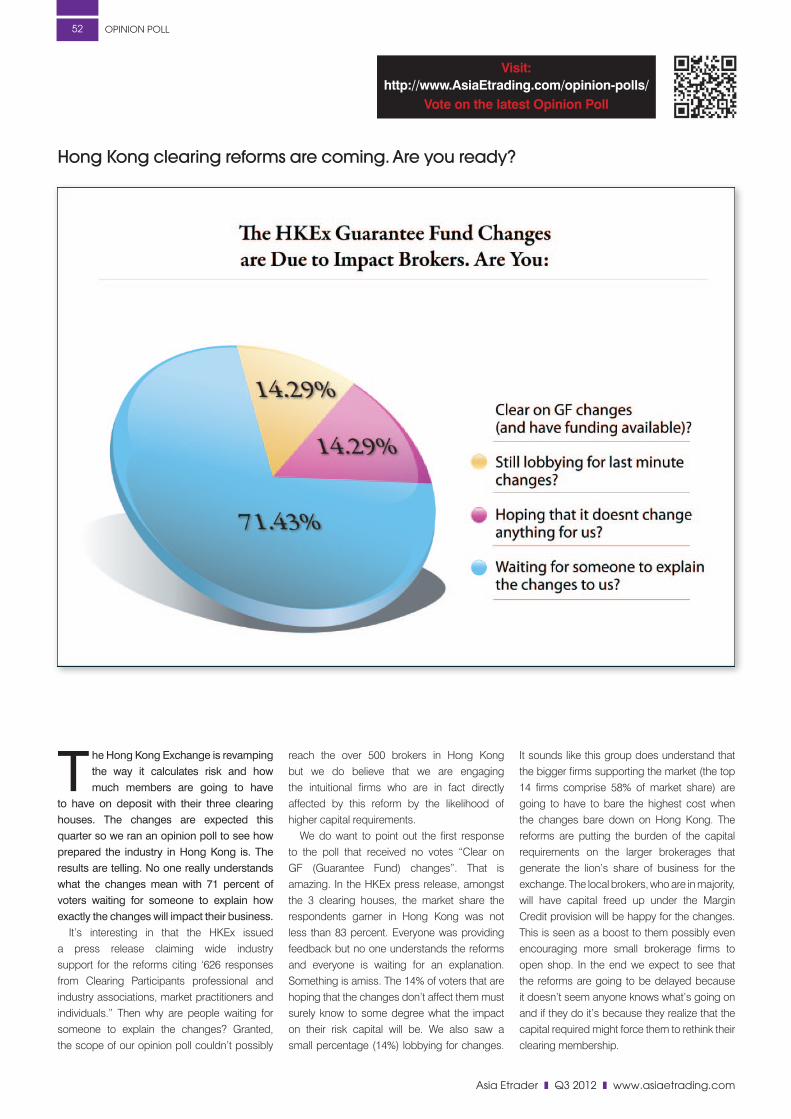
asia etrader z Q3 2012 z www.asiaetrading.com
oPinion Poll52
The Hong Kong Exchange is revamping the way it calculates risk and how much members are going to have
to have on deposit with their three clearing houses. The changes are expected this quarter so we ran an opinion poll to see how prepared the industry in Hong Kong is. The results are telling. No one really understands what the changes mean with 71 percent of voters waiting for someone to explain how exactly the changes will impact their business.
It’s interesting in that the HKEx issued a press release claiming wide industry support for the reforms citing ‘626 responses from Clearing Participants professional and industry associations, market practitioners and individuals.” Then why are people waiting for someone to explain the changes? Granted, the scope of our opinion poll couldn’t possibly
reach the over 500 brokers in Hong Kong but we do believe that we are engaging the intuitional firms who are in fact directly affected by this reform by the likelihood of higher capital requirements.
We do want to point out the first response to the poll that received no votes “Clear on GF (Guarantee Fund) changes”. That is amazing. In the HKEx press release, amongst the 3 clearing houses, the market share the respondents garner in Hong Kong was not less than 83 percent. Everyone was providing feedback but no one understands the reforms and everyone is waiting for an explanation. Something is amiss. The 14% of voters that are hoping that the changes don’t affect them must surely know to some degree what the impact on their risk capital will be. We also saw a small percentage (14%) lobbying for changes.
It sounds like this group does understand that the bigger firms supporting the market (the top 14 firms comprise 58% of market share) are going to have to bare the highest cost when the changes bare down on Hong Kong. The reforms are putting the burden of the capital requirements on the larger brokerages that generate the lion’s share of business for the exchange. The local brokers, who are in majority, will have capital freed up under the Margin Credit provision will be happy for the changes. This is seen as a boost to them possibly even encouraging more small brokerage firms to open shop. In the end we expect to see that the reforms are going to be delayed because it doesn’t seem anyone knows what’s going on and if they do it’s because they realize that the capital required might force them to rethink their clearing membership.
Hong Kong clearing reforms are coming. Are you ready?
Visit: http://www.AsiaEtrading.com/opinion-polls/
Vote on the latest Opinion Poll

www.asiaetrading.com z Q3 2012 z asia etrader
oPinion Poll 53
expert opinion
The imminent reforms to the HKEx’s risk management framework does not seem to be bothering many people. In
the recent BNP Paribas / Asia Etrading online poll, not a single respondent could say that they were clear on the impact of these changes on their business – and over 70% are “still waiting for someone to explain it to them”. Given the sizable projected impact of these changes and their historic role in reshaping clearing in other markets, why do Hong Kong’s clearing participants seem so removed from what is around the corner?
What is all the fuss about?Announced on 11 March 2012, the “HKEx Clearing House Risk Management Reform Measures” are the Territory’s response to an extended local consultation and to the recommendations of IOSCO (the world association of securities and futures regulators). Motivated originally by the lessons learnt during the collapse of Lehman Brothers, the measures envisage a departure from the largely stable Guarantee Fund (GF) structure of today – towards a more dynamic “user pays” principle designed to ensure that participants who create risk pay for it in terms of collateral requirements at the HKEx. The reforms will increase the total daily collateral held by the HKEx by approximately HKD2.5 billion.
In practice, this means that Hong Kong’s top 100 clearing participants will be asked to fund an exponential increase in exchange collateral. This increase will be sourced through the introduction of an Initial Margin and a Dynamic Guarantee Fund. The combined effect of these elements will be to ensure that brokers’ collateral requirements remain variable and based on market conditions at all times – meaning not only an initial shock event upon implementation, but also a continuing need to source and manage liquidity as trading volatility rises and falls.
As an example, a Participant clearing 1% of the Hong Kong market would be required to post the following approximate levels of collateral (excluding Marks):
Most importantly, these changes are due to be implemented in September; less than three months from today.
It’s not ready yet.In an era of unprecedented liquidity scarcity and given the significant financial requirements, why are more people not concerned about this? One answer is that some of Hong Kong’s more informed brokers are still lobbying for revisions to the proposed framework in the hope that change can be achieved in the coming months.
Most notably, many brokers hope that the SFC and the HKEx will be able to agree on a framework under which the new GF contributions can be counted towards their regulatory capital (their FRR). Without this essential change, the additional capital and collateral requirements placed on Hong Kong’s brokers will significantly impact the viability of their Hong Kong businesses – tipping some into negative territory.
To date however, there has been no confirmation that this concession has been agreed to.
A treasury problem....Far more widespread is the belief that someone else is taking care of this. In the face of an increasing regulatory burden in the region, many C-level executives are assuming that, like many other recent requirements, their finance or compliance teams are leading the way on
this initiative. The proposed measures are seen and managed solely in the context of a liquidity question – to which the answer is, however painfully, to ask their overseas “HQ” for more cash.
...with an operational solutionThis approach is fundamentally flawed.
Aside from the evident dangers in assuming that “colleagues have it covered”, evidence of similar reforms in other markets show that the solution lies not on the balance sheet but in the operating model.
In Australia and in markets across Europe, IOSCO-led reforms in the last three years have driven a surprising number of participants to give up their clearing memberships and to transfer their clearing obligations to a Global Clearing Member (or Participant) “GCP”. Under this model, the clearing house risk is assumed by the GCP who is, in turn, able to provide economies of scale and to offer a consolidated (ie cross market or cross asset) and hence reduced margin requirement to the broker.
This model (also known as Third party clearing) has gained appeal in Hong Kong only in the last two years – since GCPs such as BNP Paribas began to clear over 5% of HKEx’s turnover on behalf of other Exchange members. Hong Kong’s brokers are now faced with a choice in terms of operating models – and hence they have more answers to the question of how to deal with the HKEx reforms.
What should I do now?Our belief is that it is essential for C-level executives to use this as an opportunity to review and improve their clearing model in Hong Kong. Managed well, these reforms could trigger an improvement in the liquidity model for many brokers – simply through a few key steps.1. Contact the HKEx: Ask for a simulation of
the impact of the proposed reforms on your clearing account. This can be provided free of charge and will help you to size the impact quickly.
2. Seek a comparative view from Hong Kong’s major GCPs to help understand the collateral pact of the third party clearing model for you.
3. Ensure that your operations, finance and compliance teams are all aligned on the best approach to proceed.
Whatever you do, don’t sit and wait until September.
Hong Kong exchange’s clearing house reforms: Not my problem?
By Barnaby Nelson Head of Client Development, Asia Banks, Broker Dealers and Corporate Issuers BNP Paribas Securities Services
Today From Q3 2012
HK$2.5 million Fixed Guarantee Fund HK$2.5million
N/A Dynamic Guarantee Fund HK$12million
N/A Initial Margin HK$35millionTO SUBSCRIBE:
http://www.asiaetrading.com/asia-etrader-magazine/
Email:[email protected]

asia etrader z Q3 2012 z www.asiaetrading.com
TeChnologY54
In today’s ultra-competitive and low margin trading environment it is incumbent upon companies to have a service-oriented
approach in order to differentiate themselves from the rest of the pack. Typically when a new trading service was required to win new business, inevitably leading to an IT project, project managers spent weeks or even months devising this bespoke solution, designing a new system, purchasing hardware for both production and disaster recovery and even upgrading existing technology to ensure the business was happy. Customers can’t wait months and CTOs aren’t writing as many checks as they used to. Companies today are turning to “The Cloud” to improve business agility, reduce costs and accelerate business innovation.
Cloud computing redefines the way IT assets are deployed and dramatically affects the way data center networks are architected. Conventional hierarchical data center networks built to support traditional siloed IT architectures simply can’t meet the security, flexibility and price versus performance requirements of virtualized cloud computing environments. Public cloud service providers and companies deploying private clouds must implement flatter, simpler data center networks to support the bandwidth intensive, latency sensitive server-to-server traffic flows that accompany cloud computing. CTOs must also evolve and adopt new management systems and practices to administer and secure virtual resources and orchestrate on-demand services.
What is Cloud exactly?Virtualization is the core attribute of cloud computing. Virtualization refers to a technology design to provide a layer of abstraction between computer hardware systems and the software running on them. By providing a logical view of computing resources, rather than a physical view, virtualization solutions make it possible to do a couple of very useful things. For example, they allow for configurations where the operating system believes that a group of
servers is a single pool of computing resources. Conversely, virtualization can allow for running multiple operating systems simultaneously on a single machine. The key components of the cloud are on-demand self-service, broad network access, resource pooling, rapid elasticity, and measured services.
The benefits of virtualization are numerous:• Significant cost savings by reducing the
numbers and types of servers that support the business applications – eliminating server consolidation projects, by keeping to a minimum underutilized computing resources saving rack space and energy. It also reduces extra services and staff costs to support high availability, disaster recovery and workload balancing.
• Enhancement of the organization’s business nimbleness. CTOs that employ clustering, partitioning, workload management and other virtualization techniques to configure groups of servers into reusable pools of resources are better positioned to respond to the changing demands their business places on those resources.
• Greater efficiency of staff resources shifting the focus from the technology to the services the technology can provide.
• Decrease of operational risk such as security or failure due to the inherent ability of a cloud to provide efficient integrated controls.
Cloud facilitates concepts such as Software-as-a-Service (SaaS), Infrastructure-as-a-Service (IaaS) and Platform-as-a-Service (PaaS). SaaS is a software delivery model in which software and associated data are centrally hosted on the cloud. IaaS provides computers, physical or more often as virtual machines, storage capacity, firewalls, load balancers, and networks. PaaS delivers a computing platform and offering solutions that include operating systems, programming language execution environment, databases, and web servers. Through these cloud services the resources of the IT department can focus more acutely
delivering the services your organization needs. We can imagine, for example, having a team of highly proficient platform specialists dedicated to providing defined capacity for hosting software, databases and web applications on major operating systems. If a company wants flexibility by having enough capacity in advance to provide new services to his customers, then this capacity can be proactively managed so that onboarding of these new services won’t be threatened by the need to add more capacity in the pre-Cloud world.
Cloud is particularly adapted for Content Management Systems (CMS) allowing for a large number of people to share and contribute to stored data, collaboration and social tools or Customer Relationship Management (CRM). There are three types of applications that are ideally suited to the cloud environment –applications with unpredictable growth, with variable volume (such as daily financial market activity) and applications with large scale data analytics.
How Can Cloud Services Be Deployed?In a public cloud model, a provider establishes a cloud-based service as a commercial offering. Technology assets are shared, and services are provided to multiple companies, often on a per-use basis such as compliance or client services.In a private cloud deployment model, services are delivered to users and groups within an individual company. Middle and back offices systems are potential candidates for this architecture.In a hybrid model a company employs a combination of private and public cloud services. The hybrid approach affords a business to take advantage of the scalability and cost-effectiveness that a public cloud computing environment offers without exposing mission-critical applications and data to third-party externalities.
If you are planning to implement a private Cloud big players do exist in the market.
Competitive advantage in the Cloud Moving your technology assets into the Cloud can offer lowered costs, scalability and shortened development lifecycles. The added flexibility can make all the difference when retaining and winning new business.
by Frederic Stephan

www.asiaetrading.com z Q3 2012 z asia etrader
TeChnologY 55
External consultants may also provide valuable help during the process as well. First, there is an architectural phase where you will consider the appropriate design for your target architecture. Secondly, there is the operation phase which includes considerations for running your architecture. Finally, an assessment of the organization and users who will build and run your Cloud needs to be undertaken. You may choose a basic implementation which is most commonly referred to as “per-use”, a committed implementation for a specific application or group of customers, or a dedicated implementation for an exclusive use provided you can bear the cost.
Cloud technology is modular in the sense that providers propose a series of options to choose from. It may be related to a development framework such as the Java programming language, a specific application server, a database, or some management modules needed for performance or processes monitoring.
What About Virtual Desktops?Because every business is different there is no one-size-fits-all solution; there are endless architectures and technology options to consider. CTOs responsible for hundreds or thousands of desktops appreciate the complexity when maintenance and upgrades are needed. Remote offices and mobile workers further complicate matters. For the past 20
years, desktop virtualization has failed to gain traction but now new technologies and infrastructure exist and organizations are eager to cut costs and rapidly deploy solutions to customers. Companies with 50 to 500 employees are estimated to have 12% of their users with virtual desktops now and plan to increase this to 15% within two years. These users are essentially executive managers, mobile and temporary workers. Building the business case can be challenging for CTOs who want to implement virtualization because there is an upfront cost that needs upgrades to back-end infrastructure across servers, storage, network and system management software. There are different forms of desktop virtualization to consider; the full environment running in protected states on a server, specifics applications running on a server or desktops executing on a protected environment on the user’s PC.
Data Centers to Help YouData center providers selling cloud technology offer additional services such as capacity in major business markets, access to public and private networks of your clients and providers, deliver latency targets and can also provide direct access to key partners for rapid integration of services. On top of managing racks and space, they provide invaluable services that can now be outsourced freeing up internal resources to focus on delivering to
the front office. Ensuring a business continuity plan has never been so straightforward. Expanding or contracting a business line can be completed rapidly proving crucial in today’s competitive environment. Targeting new markets and having the best capacity to access local resources is appealing to companies who can now deliver a technology service in a shortened period of time.
Cost comparisons between different providers and architectures is difficult due to the diversified offerings and your future expectations of growth. Comparison with the non-Cloud options should take into account more than the cost of hardware and software which is by no means trivial. This is a big budget project which, if wisely aligned with potential benefits and company goals, could prove the difference between retaining and winning new business from your competitors.
It is important to add that Cloud solutions will impact matters such as privacy, data protection, cyber security and intellectual property rights. These considerations must be carefully assessed with local regulatory bodies and internal compliance.
The advantages of the cloud are compelling and should be given serious thought. The global cloud computing market is estimated at $20 billion today and expected to double every three years for the decade to come. If you are not looking at Cloud your competitors may just be one step ahead.
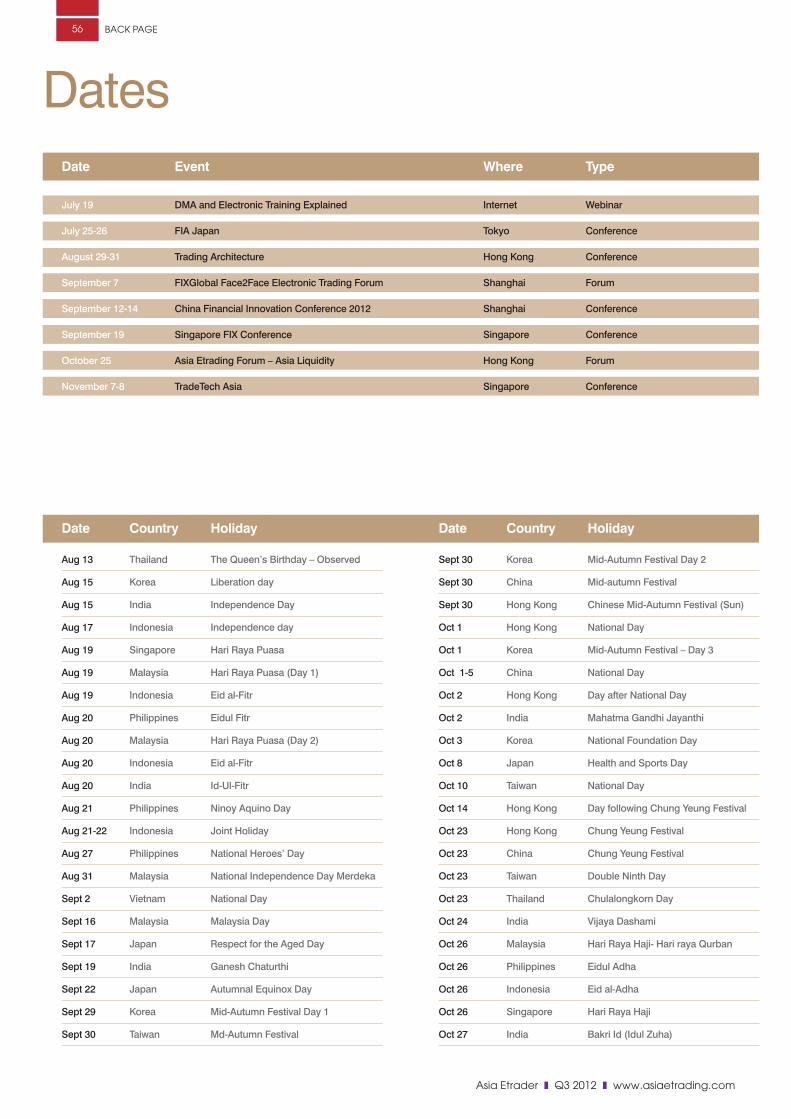
asia etrader z Q3 2012 z www.asiaetrading.com
BaCK Page5656
DatesDate Event Where Type
July 19 DMA and Electronic Training Explained Internet Webinar
July 25-26 FIA Japan Tokyo Conference
August 29-31 Trading Architecture Hong Kong Conference
September 7 FIXGlobal Face2Face Electronic Trading Forum Shanghai Forum
September 12-14 China Financial Innovation Conference 2012 Shanghai Conference
September 19 Singapore FIX Conference Singapore Conference
October 25 Asia Etrading Forum – Asia Liquidity Hong Kong Forum
November 7-8 TradeTech Asia Singapore Conference
Date Country Holiday
Aug 13 Thailand The Queen’s Birthday – Observed
Aug 15 Korea Liberation day
Aug 15 India Independence Day
Aug 17 Indonesia Independence day
Aug 19 Singapore Hari Raya Puasa
Aug 19 Malaysia Hari Raya Puasa (Day 1)
Aug 19 Indonesia Eid al-Fitr
Aug 20 Philippines Eidul Fitr
Aug 20 Malaysia Hari Raya Puasa (Day 2)
Aug 20 Indonesia Eid al-Fitr
Aug 20 India Id-Ul-Fitr
Aug 21 Philippines Ninoy Aquino Day
Aug 21-22 Indonesia Joint Holiday
Aug 27 Philippines National Heroes’ Day
Aug 31 Malaysia National Independence Day Merdeka
Sept 2 Vietnam National Day
Sept 16 Malaysia Malaysia Day
Sept 17 Japan Respect for the Aged Day
Sept 19 India Ganesh Chaturthi
Sept 22 Japan Autumnal Equinox Day
Sept 29 Korea Mid-Autumn Festival Day 1
Sept 30 Taiwan Md-Autumn Festival
Date Country Holiday
Sept 30 Korea Mid-Autumn Festival Day 2
Sept 30 China Mid-autumn Festival
Sept 30 Hong Kong Chinese Mid-Autumn Festival (Sun)
Oct 1 Hong Kong National Day
Oct 1 Korea Mid-Autumn Festival – Day 3
Oct 1-5 China National Day
Oct 2 Hong Kong Day after National Day
Oct 2 India Mahatma Gandhi Jayanthi
Oct 3 Korea National Foundation Day
Oct 8 Japan Health and Sports Day
Oct 10 Taiwan National Day
Oct 14 Hong Kong Day following Chung Yeung Festival
Oct 23 Hong Kong Chung Yeung Festival
Oct 23 China Chung Yeung Festival
Oct 23 Taiwan Double Ninth Day
Oct 23 Thailand Chulalongkorn Day
Oct 24 India Vijaya Dashami
Oct 26 Malaysia Hari Raya Haji- Hari raya Qurban
Oct 26 Philippines Eidul Adha
Oct 26 Indonesia Eid al-Adha
Oct 26 Singapore Hari Raya Haji
Oct 27 India Bakri Id (Idul Zuha)
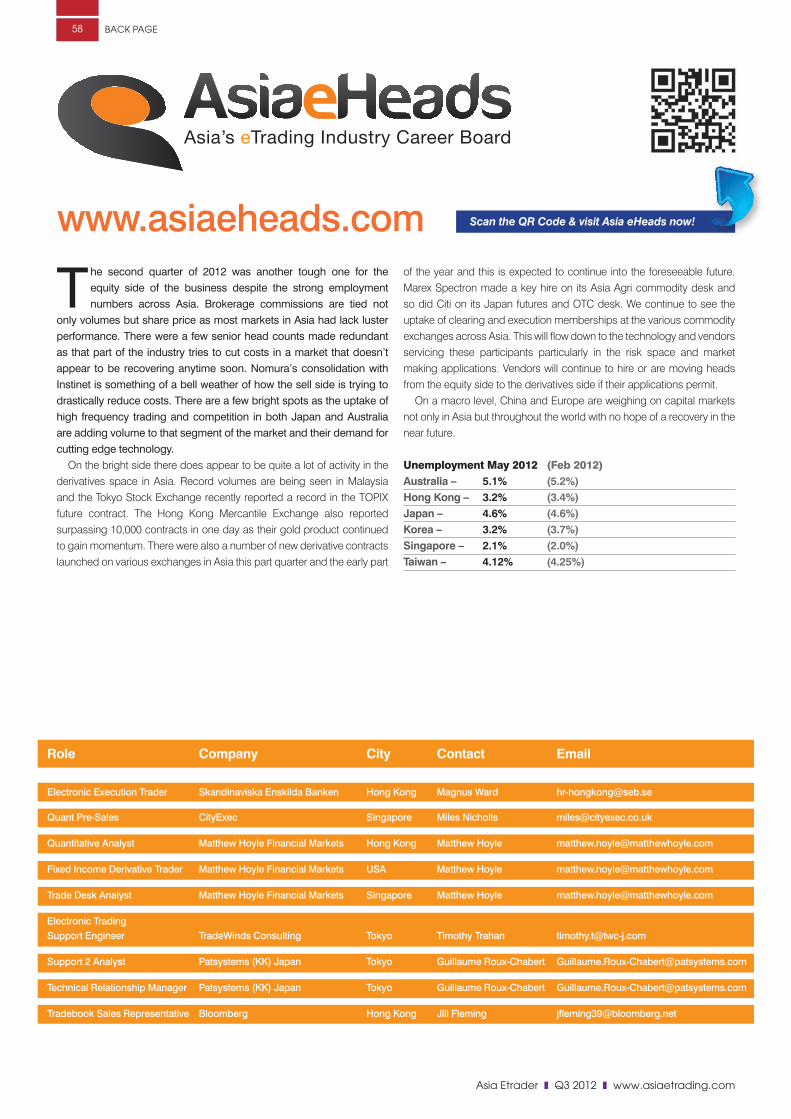
asia etrader z Q3 2012 z www.asiaetrading.com
BaCK Page5858
The second quarter of 2012 was another tough one for the equity side of the business despite the strong employment numbers across Asia. Brokerage commissions are tied not
only volumes but share price as most markets in Asia had lack luster performance. There were a few senior head counts made redundant as that part of the industry tries to cut costs in a market that doesn’t appear to be recovering anytime soon. Nomura’s consolidation with Instinet is something of a bell weather of how the sell side is trying to drastically reduce costs. There are a few bright spots as the uptake of high frequency trading and competition in both Japan and Australia are adding volume to that segment of the market and their demand for cutting edge technology.
On the bright side there does appear to be quite a lot of activity in the derivatives space in Asia. Record volumes are being seen in Malaysia and the Tokyo Stock Exchange recently reported a record in the TOPIX future contract. The Hong Kong Mercantile Exchange also reported surpassing 10,000 contracts in one day as their gold product continued to gain momentum. There were also a number of new derivative contracts launched on various exchanges in Asia this part quarter and the early part
of the year and this is expected to continue into the foreseeable future. Marex Spectron made a key hire on its Asia Agri commodity desk and so did Citi on its Japan futures and OTC desk. We continue to see the uptake of clearing and execution memberships at the various commodity exchanges across Asia. This will flow down to the technology and vendors servicing these participants particularly in the risk space and market making applications. Vendors will continue to hire or are moving heads from the equity side to the derivatives side if their applications permit.
On a macro level, China and Europe are weighing on capital markets not only in Asia but throughout the world with no hope of a recovery in the near future.
Unemployment May 2012 (Feb 2012)Australia – 5.1% (5.2%)Hong Kong – 3.2% (3.4%)Japan – 4.6% (4.6%)Korea – 3.2% (3.7%)Singapore – 2.1% (2.0%)Taiwan – 4.12% (4.25%)
Asia’s eTrading Industry Career Board
Role Company City Contact Email
Electronic Execution Trader Skandinaviska Enskilda Banken Hong Kong Magnus Ward [email protected]
Quant Pre-Sales CityExec Singapore Miles Nicholls [email protected]
Quantitative Analyst Matthew Hoyle Financial Markets Hong Kong Matthew Hoyle [email protected]
Fixed Income Derivative Trader Matthew Hoyle Financial Markets USA Matthew Hoyle [email protected]
Trade Desk Analyst Matthew Hoyle Financial Markets Singapore Matthew Hoyle [email protected]
Electronic Trading Support Engineer TradeWinds Consulting Tokyo Timothy Trahan [email protected]
Support 2 Analyst Patsystems (KK) Japan Tokyo Guillaume Roux-Chabert [email protected]
Technical Relationship Manager Patsystems (KK) Japan Tokyo Guillaume Roux-Chabert [email protected]
Tradebook Sales Representative Bloomberg Hong Kong Jill Fleming [email protected]
www.asiaeheads.com Scan the QR Code & visit Asia eHeads now!
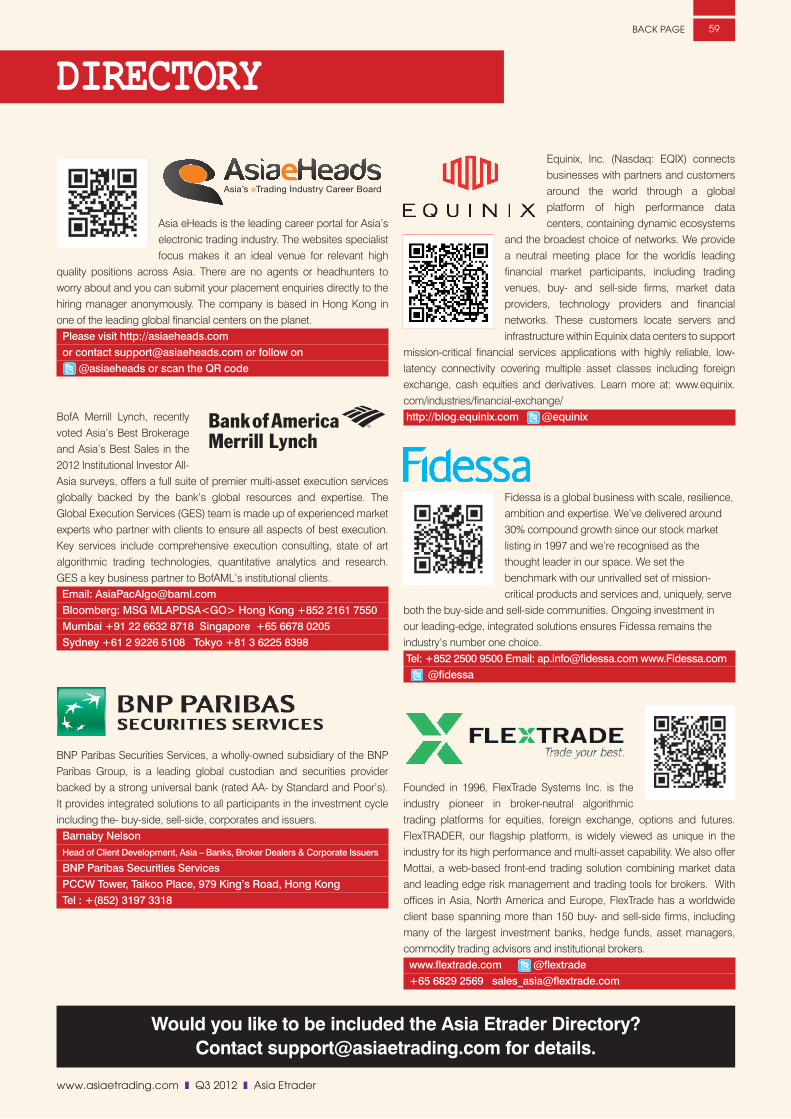
Directory
Asia eHeads is the leading career portal for Asia’s electronic trading industry. The websites specialist focus makes it an ideal venue for relevant high
quality positions across Asia. There are no agents or headhunters to worry about and you can submit your placement enquiries directly to the hiring manager anonymously. The company is based in Hong Kong in one of the leading global financial centers on the planet. Please visit http://asiaeheads.com or contact [email protected] or follow on @asiaeheads or scan the QR code
BofA Merrill Lynch, recently voted Asia’s Best Brokerage and Asia’s Best Sales in the 2012 Institutional Investor All-Asia surveys, offers a full suite of premier multi-asset execution services globally backed by the bank’s global resources and expertise. The Global Execution Services (GES) team is made up of experienced market experts who partner with clients to ensure all aspects of best execution. Key services include comprehensive execution consulting, state of art algorithmic trading technologies, quantitative analytics and research. GES a key business partner to BofAML’s institutional clients. Email: [email protected] Bloomberg: MSG MLAPDSA<GO> Hong Kong +852 2161 7550 Mumbai +91 22 6632 8718 Singapore +65 6678 0205 Sydney +61 2 9226 5108 Tokyo +81 3 6225 8398
BNP Paribas Securities Services, a wholly-owned subsidiary of the BNP Paribas Group, is a leading global custodian and securities provider backed by a strong universal bank (rated AA- by Standard and Poor’s). It provides integrated solutions to all participants in the investment cycle including the- buy-side, sell-side, corporates and issuers. Barnaby Nelson Head of Client Development, Asia – Banks, Broker Dealers & Corporate Issuers
BNP Paribas Securities Services PCCW Tower, Taikoo Place, 979 King’s Road, Hong Kong Tel : +(852) 3197 3318
Equinix, Inc. (Nasdaq: EQIX) connects businesses with partners and customers around the world through a global platform of high performance data centers, containing dynamic ecosystems
and the broadest choice of networks. We provide a neutral meeting place for the worldís leading financial market participants, including trading venues, buy- and sell-side firms, market data providers, technology providers and financial networks. These customers locate servers and infrastructure within Equinix data centers to support
mission-critical financial services applications with highly reliable, low-latency connectivity covering multiple asset classes including foreign exchange, cash equities and derivatives. Learn more at: www.equinix.com/industries/financial-exchange/ http://blog.equinix.com @equinix
Fidessa is a global business with scale, resilience, ambition and expertise. We’ve delivered around 30% compound growth since our stock market listing in 1997 and we’re recognised as the thought leader in our space. We set the benchmark with our unrivalled set of mission-critical products and services and, uniquely, serve
both the buy-side and sell-side communities. Ongoing investment in our leading-edge, integrated solutions ensures Fidessa remains the industry’s number one choice. Tel: +852 2500 9500 Email: [email protected] www.Fidessa.com @fidessa
Founded in 1996, FlexTrade Systems Inc. is the industry pioneer in broker-neutral algorithmic trading platforms for equities, foreign exchange, options and futures. FlexTRADER, our flagship platform, is widely viewed as unique in the industry for its high performance and multi-asset capability. We also offer Mottai, a web-based front-end trading solution combining market data and leading edge risk management and trading tools for brokers. With offices in Asia, North America and Europe, FlexTrade has a worldwide client base spanning more than 150 buy- and sell-side firms, including many of the largest investment banks, hedge funds, asset managers, commodity trading advisors and institutional brokers. www.flextrade.com @flextrade +65 6829 2569 [email protected]
Would you like to be included the Asia Etrader Directory? Contact [email protected] for details.
BaCK Page 59
www.asiaetrading.com z Q3 2012 z asia etrader
Asia’s eTrading Industry Career Board
DATA CENTERS FOR THE WELL-CONNECTED
or contact [email protected]
CHICAGO / TO
RO
NTO
/ NE
W Y
OR
K / B
OSTO
N / SAO
PAULO / LONDON / AMSTERDAM / PARIS / F
RANKFURT /
G
ENE
VA
/
Z
UR
ICH
/
S
HA
NG
HA
I /
H
ONG K
ONG / S
INGAPORE / TOKYO / SYDNEY /
Learn more
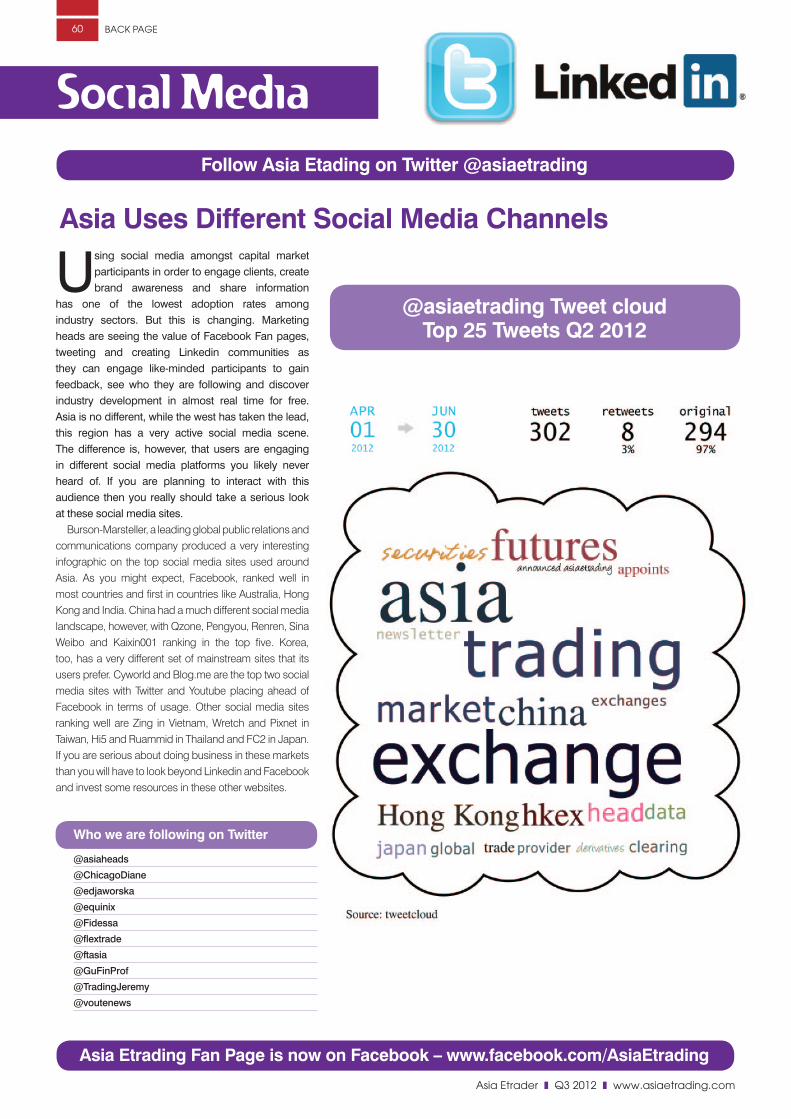
asia etrader z Q3 2012 z www.asiaetrading.com
Social Media
BaCK Page60
@asiaetrading Tweet cloud Top 25 Tweets Q2 2012
Follow Asia Etading on Twitter @asiaetrading
Asia Etrading Fan Page is now on Facebook – www.facebook.com/AsiaEtrading
Using social media amongst capital market participants in order to engage clients, create brand awareness and share information
has one of the lowest adoption rates among industry sectors. But this is changing. Marketing heads are seeing the value of Facebook Fan pages, tweeting and creating Linkedin communities as they can engage like-minded participants to gain feedback, see who they are following and discover industry development in almost real time for free. Asia is no different, while the west has taken the lead, this region has a very active social media scene. The difference is, however, that users are engaging in different social media platforms you likely never heard of. If you are planning to interact with this audience then you really should take a serious look at these social media sites.
Burson-Marsteller, a leading global public relations and communications company produced a very interesting infographic on the top social media sites used around Asia. As you might expect, Facebook, ranked well in most countries and first in countries like Australia, Hong Kong and India. China had a much different social media landscape, however, with Qzone, Pengyou, Renren, Sina Weibo and Kaixin001 ranking in the top five. Korea, too, has a very different set of mainstream sites that its users prefer. Cyworld and Blog.me are the top two social media sites with Twitter and Youtube placing ahead of Facebook in terms of usage. Other social media sites ranking well are Zing in Vietnam, Wretch and Pixnet in Taiwan, Hi5 and Ruammid in Thailand and FC2 in Japan. If you are serious about doing business in these markets than you will have to look beyond Linkedin and Facebook and invest some resources in these other websites.
Asia Uses Different Social Media Channels
Who we are following on Twitter
@asiaheads
@ChicagoDiane
@edjaworska
@equinix
@Fidessa
@flextrade
@ftasia
@GuFinProf
@TradingJeremy
@voutenews

Untitled-1 1 21/12/2011 09:55
DATA CENTERS FOR THE WELL-CONNECTED
or contact [email protected]
CHICAGO / TO
RO
NTO
/ NE
W Y
OR
K / B
OSTO
N / SAO
PAULO / LONDON / AMSTERDAM / PARIS / F
RANKFURT /
G
ENE
VA
/
Z
UR
ICH
/
S
HA
NG
HA
I /
H
ONG K
ONG / S
INGAPORE / TOKYO / SYDNEY /
Learn more


