The Asian / Pacific / American Institute at New York University The Steinhardt Institute for Higher Education Policy at New York University Asian Americans and Pacific Islanders FACTS, NOT FICTION: SETTING THE RECORD STRAIGHT
Transcript
The Asian / Pacific / American Institute at New York University
The Steinhardt Institute for Higher Education Policy at New York University
Asian Americans and Pacific Islanders
Facts, Not FictioN: settiNg th e R ecoR d stR aight
National Commission on Asian American and Pacific Islander Research in Education
The National Commission on Asian American and Pacific Islander Research in Education (CARE) was formed through a collaboration of the Asian/Pacific/American Institute at New York University, the Steinhardt Institute for Higher Education Policy at New York University, and the College Board. Through this research report, the Commission seeks to improve U.S. education for all students by expanding the way education leaders, federal and state policymakers, and the public understand the complexities, inequities, and strengths of the U.S. educational system. This report is intended to encourage realistic and actionable discussions about how societal distinctions of race, class, ethnicity, language, and other cultural factors are constituted in the day-to-day operations of American schools. We believe that more frank and inclusive dialogues will lead to more effective and equitable policies.
FaCT a: The increasing presence of AAPI students parallels similar increases that other student populations have experienced.
FaCT B: The AAPI student population is concentrated in a small percentage of institutions, giving the false impression of high enrollment in higher education overall.
FaCT C: AAPIs have a wide range of academic interests including the Social Sciences, Humanities, and Education as opposed to just Science, Technology, Engineering, and Math (STEM).
FaCT a: AAPI students are evenly distributed in two-year and four-year institutions, with the majority attending public institutions.
FaCT B: AAPIs have a wide range of scores on standardized tests, which afford different levels of eligibility and competitiveness in selective admissions.
FaCT C: AAPI enrollment in public two-year community colleges is increasing at a faster rate than their enrollment in four-year colleges.
FaCT D: AAPI community college enrollment is increasing fastest in the Midwest and the South.
Fiction 3: AAPIs Are a Homogenous Racial Group with Uniformity in Educational and Financial Attainment, Culture, Religion, and Histories. . . . . . . . . . . . . . . . . . . . . . . . . . . . . . . . . . . . . . . . . . . . . . 15
FaCT a: AAPIs are an ethnically diverse population.
FaCT B: AAPI students and their families encompass many different languages and dialects.
FaCT C: Immigration histories have an effect on the needs and assets of different AAPI communities.
FaCT D: Economic, social, and cultural capital varies greatly among AAPIs.
This report is founded on the simple premise that edu-cational policies and practices must be based on fact, not fiction, if they are to be of value to teachers, stu-dents, parents, and society as a whole. The report focuses on three pervasive and core fictions about the Asian American and Pacific Islander community, which are examined in the context of empirical data. In addition, three issues of emerging importance are pre-sented to highlight new conversations that are surfac-ing among educators on college campuses. Facts, Not Fiction: Setting the Record Straight serves as a source of consolidated information that will be valuable to anyone interested in advocating for fair and better edu-cational practices. In particular, through the frame of advocacy and social justice, the report provides educa-tors, policymakers, students and their families, and advocates with accurate and up-to-date information, enabling them to critically examine the extent to which their schools meet the demands of an increasingly
competitive and global environment and advance the principles of equality and justice.
In addition to the collaborative effort of our national commission, advisory board, and working group, there are other individuals who played integral roles in the production of this report. Our thanks to Frank Tang, New York University; Jamie Lew, Rutgers University- Newark; Vanessa Leung, Coalition for Asian American Children and Families; Tara Parker, University of Massachusetts, Boston; and Kamilah Briscoe, New York University.
The National Commission on Asian American and Pacific Islander
Research in Education (CARE), consisting of a national commission, an
advisory board, and a research team at New York University, aims to
engage realistic and actionable discussions about the mobility and educational opportunities for
AAPIs and how distinctions of race, ethnicity, language, and other cultural factors play out in the
day-to-day operations of American schools throughout the educational spectrum. In particular,
this project provides needed new data on key issues and trends for the access and participation of
Asian Americans and Pacific Islanders in U.S. higher education.
Preface
introduction • 1
Today, as we journey through a new century, Asian American and Pacific Islander students face a similar question that comes with a twist: “How does it feel to be a solution?”2 This question is a corollary to a fundamen-tal stereotype: the “model minority,” which is how Asian Americans and Pacific Islanders have come to be defined in contemporary America—the “good” minority that seeks advancement through quiet diligence in study and work and by not making waves; the minority that other American minorities should seek to emulate.
The term model minority was coined in 1966, at the height of the Civil Rights Movement.3 Before describ-ing this stereotype, it is important to place the term in a larger historical context. Records show that before the 1960s, many Asian Americans and Pacific Island-ers were treated as undesirable and “unassimilable” aliens, and were sometimes targeted by both vigilante lynch mobs and federal, state, and local laws. The fol-lowing are examples of this discrimination:
• The Chinese Exclusion Act of 1882 turned Chinese Americans into the first “illegal aliens,” barring them from ever becoming naturalized Americans,
and stripping citizenship from those who had already become American citizens.
• The 1924 Immigration Act forbade Asians from entering the United States and sharply limited entry for Eastern and Southern Europeans.
• A total of 120,000 Japanese Americans, 64 percent of whom were American-born citizens, were impris-oned for the duration of World War II as suspected “enemy aliens.”
Even after being acknowledged as the “model minor-ity,” Asian Americans and Pacific Islanders continued to face hardships in U.S. society: in the aftermath of the Cold War and conflicts in Vietnam and the Middle East, many Asian American and Pacific Islander ethnic groups have been castigated as enemies, aliens, spies, and terrorists, and subjected to special reporting requirements, incarceration, and deportation.
Arguably, the transition to seeing Asian Americans and Pacific Islanders as the “model minority” in 1966 worked not to celebrate Asian Americans and Pacific Islanders, but to reinforce how Black Americans were still “the problem” that Du Bois had so eloquently
In 1903, at the dawn of the twentieth century, W.E.B. Du Bois opened
his classic work, The Souls of Black Folk, by posing the question, “How
does it feel to be a problem?” He then argued, with impassioned and
incontrovertible reasoning, that African Americans are viewed as though they are the cause of
racial distress in their own lives and in the society at large. When Du Bois analyzed the
consequences of classifying an entire people as a problem, he identified core suppositions, which
he described as “dangerous half-truths,” including “that the prime cause of the Negro’s failure to
rise more quickly is his wrong education in the past; and… that his future rise depends primarily
on his own efforts.” 1 In other words, Black people could be defined and dismissed as a problem
because of their poor education, which could be improved only through their individual efforts—
as though discrimination, prejudice, poor or no educational opportunities, and other structural
factors had nothing to do with “the problem.”
Introduction
2 • introduction
argued against. As the December 1966 article in U.S. News & World Report put bluntly: “At a time when Americans are awash in worry over the plight of racial minorities, one such minority is winning wealth and respect by dint of its own hard work—not from a wel-fare check.”4
How Does It Feel to Be a Solution? For students and parents, educators, and policymakers who struggle with the widening disparities in K–12 preparation and higher education in a demanding global society, it is tempting to look for simplistic models of success. For many educators, as well as for the public at large, Asian American and Pacific Islander students have often become that simplistic model—the high-achieving minority, who proves that with hard work any student can accomplish anything, and those who don’t have only themselves to blame. For example, as recently as May 2006, a New York Times column entitled “The Model Students” declared that “stellar academic achievement has an Asian face” and that others would be “fools” not to learn from these “perfect” students.5 Using Asian Americans in this argument becomes a way of critiquing other groups without having to men-tion the “bad students” directly. Just as the responsibil-ity for inequality shifted to African Americans when they became “the problem,” the responsibility for edu-cational success shifts away from the schools and toward the individual student when Asian Americans and Pacific Islanders are called “the solution.” When the “problem” and “solution” fall entirely on the indi-
vidual student, systemic issues—such as what gets taught, how resources are allocated, and who gets left behind—become secondary.
Lumping All-Into-One. Such generalizations of the “problem” or “solution” defy reason. Under the “model minority solution,” Asian Americans and Pacific Islanders are all lumped together as if they have the same traits: that they are all high-performing achiev-ers. Indeed, there are exceptional Asian Americans and Pacific Islanders who are extremely accomplished, and they are a source of pride and inspiration. But it is simply not true that they are typical. Moreover, this report will show how there is no such thing as an Asian American and Pacific Islander composite, especially when there are more differences than similarities between the many peoples designated by the federally defined categories of “Asian American” and/or “Pacific Islander.” While there are varied and historical reasons for reporting this group under one umbrella in certain instances, it is critical for educators and policymakers to recognize that individuals who comprise this group occupy positions along the full range of the socioeco-nomic spectrum, from the poor and underprivileged to the affluent and highly skilled. There is no simple description that can characterize Asian American and Pacific Islander students or communities as a whole.
When the “problem” and “solution” fall
entirely on the individual student, systemic
issues—such as what gets taught, how
resources are allocated, and who gets left
behind—become secondary.
Even after being acknowledged as the
“model minority,” Asian Americans and
Pacific Islanders continued to face hardships
in U.S. society.
introduction • 3
The Problem with the “Model Minority.” Numerous reports have shown that teachers, counselors, and administrators in schools from kindergarten through higher education are so deeply convinced that their “model minority” students will excel on their own that they simply do not recognize how Asian American and Pacific Islander students contend with the same issues that other communities face.
• An Invisible Crisis: The Educational Needs of Asian Pacific American Youth points out how these students are often placed in the wrong grade level, placed in the wrong bilingual classroom, or misplaced in special education—and that their schools are failing them.6
• Diversity Among Asian American High School Students concludes that the focus on the model minority’s “success” has resulted in a lack of studies that address low achievement among Asian American students, has prevented counselors, teachers and policymakers from understanding the difficulties and problems of these students, and has, ultimately, “led to official neglect of programs and services for Asian American students.”7
• A Dream Denied: Educational Experiences of Southeast Asian American Youth documents how policies and statistics routinely lump Southeast Asian students in with all Asian Americans and Pacific Islanders, masking the high levels of poverty and academic barriers in these communities. Similarly, Pacific Islander students have very different educa-tional backgrounds and experiences than many Asian American students, yet studies on individual sub-populations and disaggregated data are almost nonexistent.8
• Left Behind: The Status of Hawai’ian Students in Hawai’i Public Schools is one of those rare studies, detailing how Hawai’ian students are the most under-privileged group in Hawai’ian schools, with the
lowest test scores, graduation rates, and disproportionately higher rates of grade retention, absenteeism, and overrepresentation in special education.9
In reality, there are significant numbers of Asian Amer-ican and Pacific Islander students who struggle with poverty, who are English-language learners increasingly likely to leave school with rudimentary language skills, who are at risk of dropping out, joining gangs, and remaining on the margins of society, and who are sub-jected to violence and discrimination on account of race, class, gender, ethnicity, or language. In other words, the facts tell a dramatically different story. In this report we identify three dominant fictions that perme-ate higher education, are critical for future research, and that contribute to misperceptions about Asian Ameri-cans and Pacific Islanders. Our conclusions call on edu-cators to implement policies and practices that are based on the realities of students’ lives—an approach that will surely serve in the advancement of all.
4 • Fiction #1
Fiction #1: AAPI students are “taking over” U.S. higher education.
American popular culture is full of claims that Asian American and Pacific Islander students are overrunning college campuses with high enrollment. Asian American and Pacific Islander students are perceived to be so ubiquitous in higher education that regrettable quips like “UCLA really stands for ‘United Caucasians Lost Among Asians’” and “MIT means ‘Made in Taiwan’” are all-too familiar in higher education circles, slighting both the institutions and the students that attend them. Others characterize Asian Americans and Pacific Islanders as the “alien student invaders,” as suggested by the title of an article in UC Berkeley’s alumni association magazine, California, “Facing the Asian Invasion.”10 Indeed, the “Too Many? Not Enough?” graphic was the feature of a 2007 New York Times “Education Life” supplement titled: “The Asian Campus: At 41 percent Asian, Berkeley could be the new face of merit-based admis-sions. The problem for everybody else: lots less room at elite colleges.”11
Such impressions exaggerate the presence of Asian American and Pacific Islander participation in U.S. higher educa-tion. It also focuses the perspective narrowly on one sector of higher education, not acknowledging the range of higher education in America. Moreover, it remains unclear whether statistics on AAPI participation in U.S. higher education include foreign students from Asia. By reporting these racial categories and including international students, we use inflated numbers that exaggerate the achievement of Asian Americans and Pacific Islanders. The circumstances of representation are critically examined in this section to gain a more accurate and broader understanding about the actual participation rates of Asian Americans and Pacific Islanders in U.S. higher education.
Fiction #1 • 5
FaCT a: The increasing presence of AAPI students parallels similar increases that other student populations have experienced.
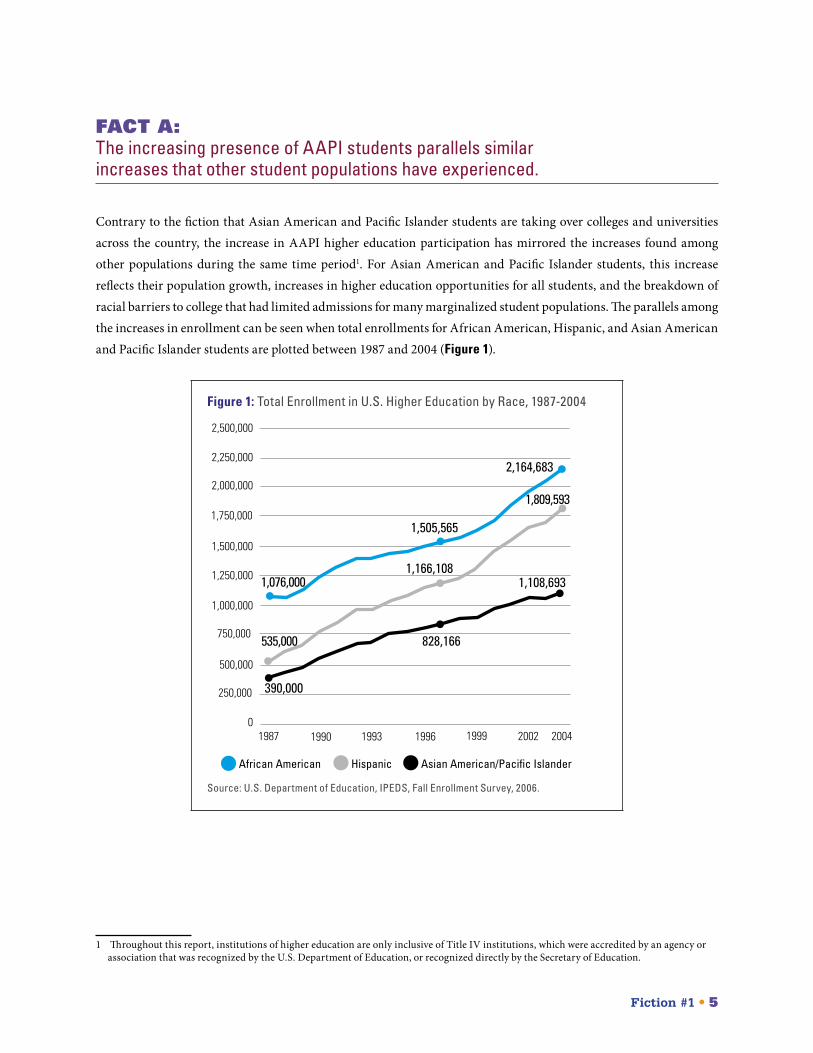
Contrary to the fiction that Asian American and Pacific Islander students are taking over colleges and universities across the country, the increase in AAPI higher education participation has mirrored the increases found among other populations during the same time period1. For Asian American and Pacific Islander students, this increase reflects their population growth, increases in higher education opportunities for all students, and the breakdown of racial barriers to college that had limited admissions for many marginalized student populations. The parallels among the increases in enrollment can be seen when total enrollments for African American, Hispanic, and Asian American and Pacific Islander students are plotted between 1987 and 2004 (Figure 1).
Figure 1: Total Enrollment in U.S. Higher Education by Race, 1987-2004
0
500,000
1,000,000
1,500,000
2,000,000
2,500,000
20021999199619931987 1990 2004
2,250,000
1,750,000
1,250,000
750,000
250,000
African American Hispanic Asian American/Pacific Islander
2,164,683
1,505,565
1,076,000
1,809,593
1,166,108
535,000 828,166
1,108,693
390,000
Source: U.S. Department of Education, IPEDS, Fall Enrollment Survey, 2006.
1 Throughout this report, institutions of higher education are only inclusive of Title IV institutions, which were accredited by an agency or association that was recognized by the U.S. Department of Education, or recognized directly by the Secretary of Education.
6 • Fiction #1
FaCT B: The AAPI student population is concentrated in a small percentage of institutions, giving the false impression of high enrollment in higher education overall.
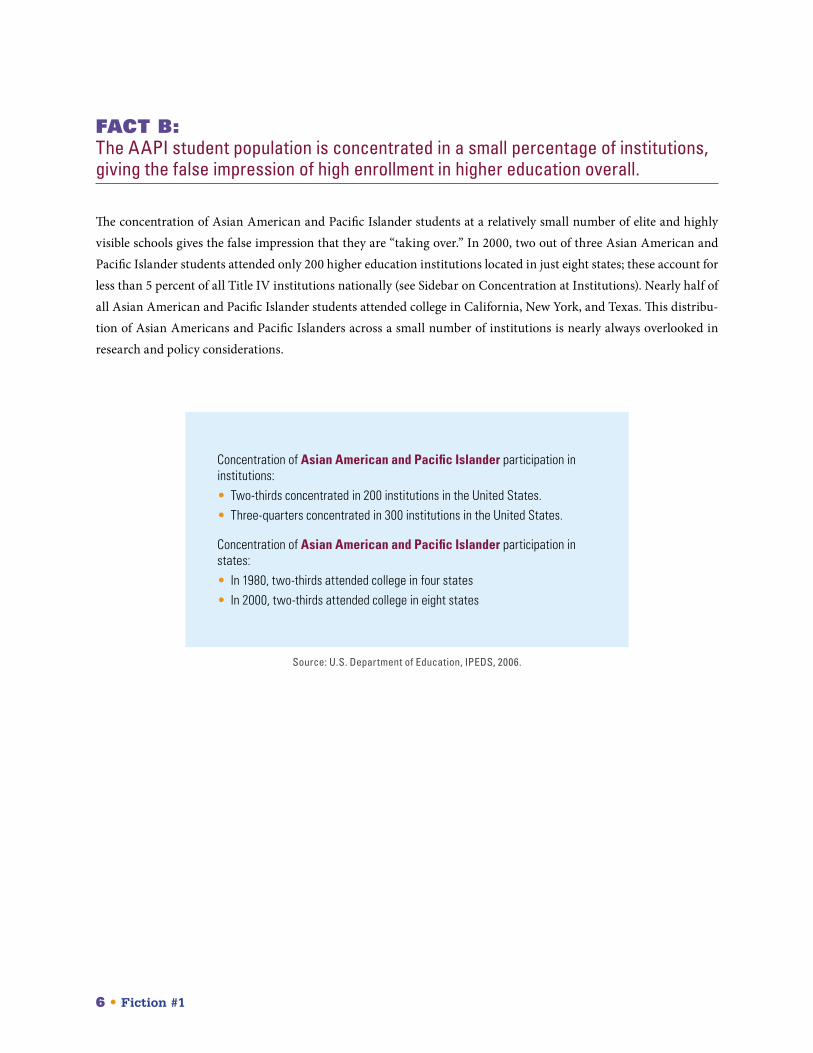
The concentration of Asian American and Pacific Islander students at a relatively small number of elite and highly visible schools gives the false impression that they are “taking over.” In 2000, two out of three Asian American and Pacific Islander students attended only 200 higher education institutions located in just eight states; these account for less than 5 percent of all Title IV institutions nationally (see Sidebar on Concentration at Institutions). Nearly half of all Asian American and Pacific Islander students attended college in California, New York, and Texas. This distribu-tion of Asian Americans and Pacific Islanders across a small number of institutions is nearly always overlooked in research and policy considerations.
Concentration of Asian American and Pacific Islander participation in institutions:• Two-thirds concentrated in 200 institutions in the United States.• Three-quarters concentrated in 300 institutions in the United States.
Concentration of Asian American and Pacific Islander participation in states:• In 1980, two-thirds attended college in four states• In 2000, two-thirds attended college in eight states
Source: U.S. Department of Education, IPEDS, 2006.
Fiction #1 • 7
FaCT C: AAPIs have a wide range of academic interests including the Social Sciences, Humanities, and Education as opposed to just Science, Technology, Engineering and Math (STEM).
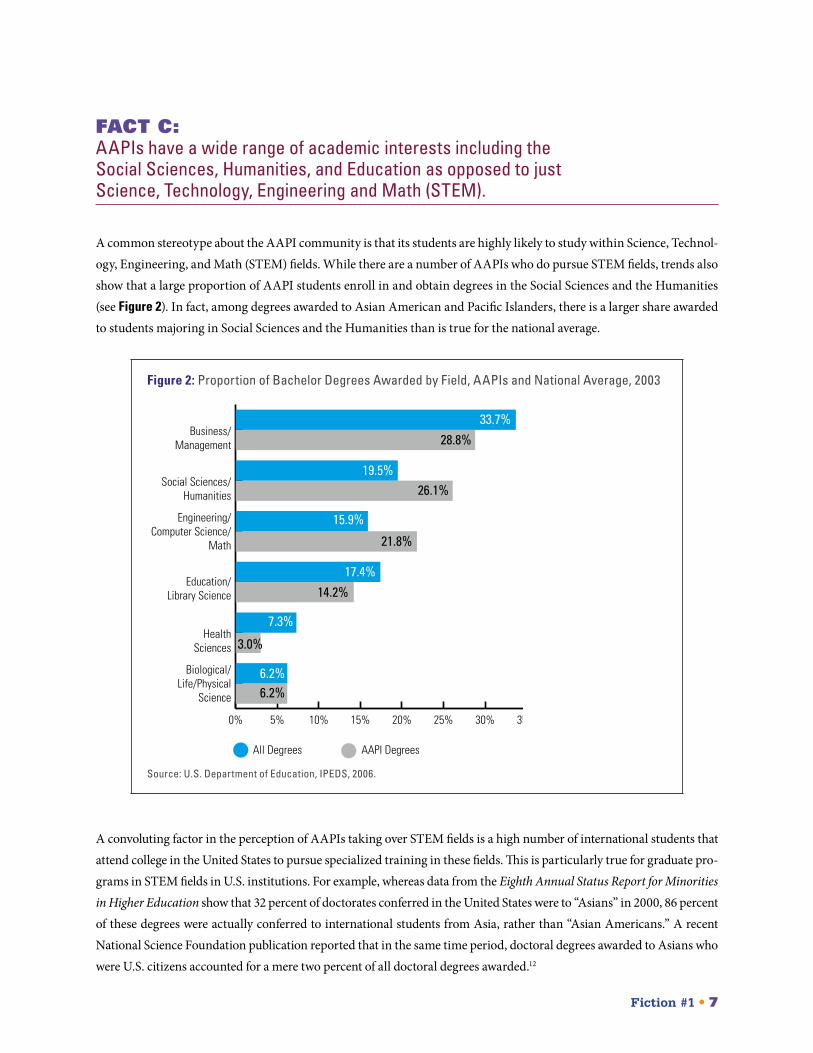
A common stereotype about the AAPI community is that its students are highly likely to study within Science, Technol-ogy, Engineering, and Math (STEM) fields. While there are a number of AAPIs who do pursue STEM fields, trends also show that a large proportion of AAPI students enroll in and obtain degrees in the Social Sciences and the Humanities (see Figure 2). In fact, among degrees awarded to Asian American and Pacific Islanders, there is a larger share awarded to students majoring in Social Sciences and the Humanities than is true for the national average.
Figure 2: Proportion of Bachelor Degrees Awarded by Field, AAPIs and National Average, 2003
0% 5% 10% 15% 20% 25% 30% 35%
A/PA Degrees
All Degrees
Biological/Life/Physical
Science
HealthSciences
Education/Library Science
Engineering/Computer Science/
Math
Social Sciences/Humanities
Business/Management
All Degrees AAPI Degrees
33.7%28.8%
19.5%26.1%
15.9%
21.8%
17.4%14.2%
7.3%
3.0%
6.2%6.2%
Source: U.S. Department of Education, IPEDS, 2006.
A convoluting factor in the perception of AAPIs taking over STEM fields is a high number of international students that attend college in the United States to pursue specialized training in these fields. This is particularly true for graduate pro-grams in STEM fields in U.S. institutions. For example, whereas data from the Eighth Annual Status Report for Minorities in Higher Education show that 32 percent of doctorates conferred in the United States were to “Asians” in 2000, 86 percent of these degrees were actually conferred to international students from Asia, rather than “Asian Americans.” A recent National Science Foundation publication reported that in the same time period, doctoral degrees awarded to Asians who were U.S. citizens accounted for a mere two percent of all doctoral degrees awarded.12
8 • Fiction #2
Fiction #2: AAPIs are concentrated only in selective four-year universities.
While Asian Americans and Pacific Islanders tend to be more concentrated in a smaller number of schools than other racial groups, they also face the assumption that this concentration is within a particular sector of higher education, namely four-year, selective institutions. The false notion that Asian American and Pacific Islander students are all headed to selective institutions reflects the preponderance of “success stories” that focus on the highest achieving stu-dents attending the most selective private universities in the United States while ignoring the vast majority of Asian American and Pacific Islander students who attend two- and four-year public institutions, the majority of which are nonselective or minimally selective. Indeed, while middle- and upper-income Asian American and Pacific Islander students often have families with the financial and cultural capital to attend selective private schools, the assumption that all Asian Americans and Pacific Islanders can do this is completely false. Many AAPI students come from lower-income families struggling with poverty, public assistance, survival in an underground economy, and limited English language ability. As such, they have neither the economic nor cultural capital to help them get into selective universities.
Fiction #2 • 9
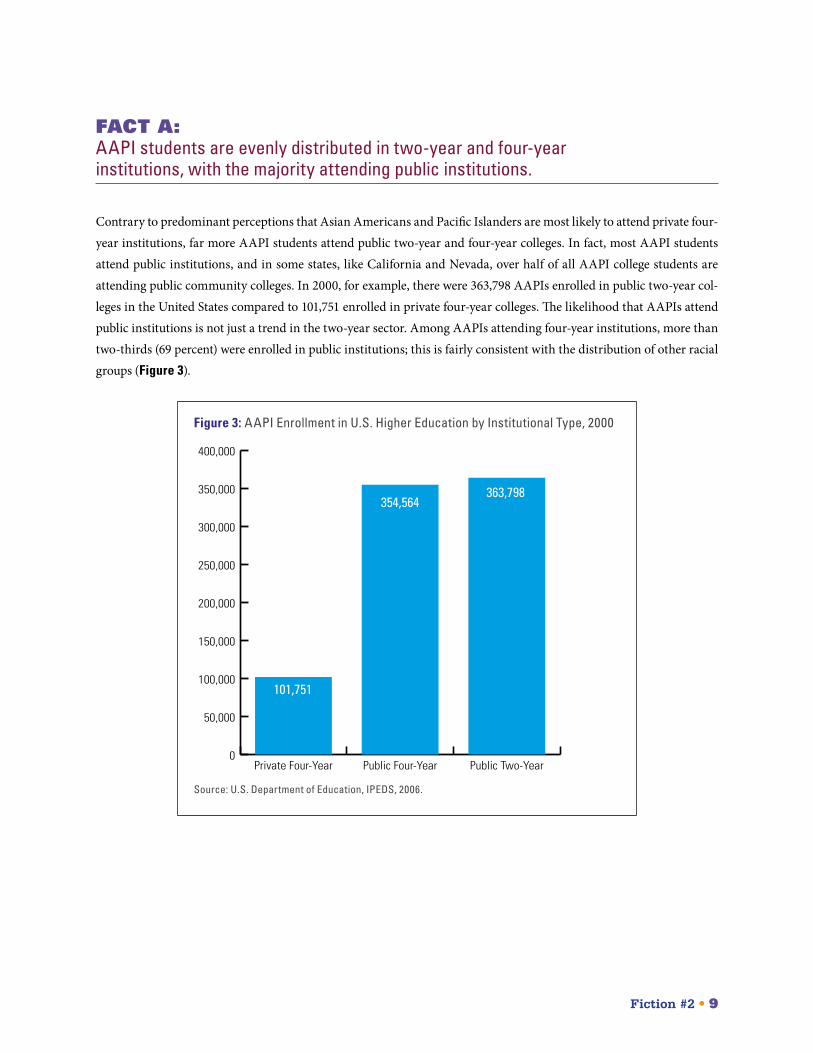
FaCT a: AAPI students are evenly distributed in two-year and four-year institutions, with the majority attending public institutions.
Contrary to predominant perceptions that Asian Americans and Pacific Islanders are most likely to attend private four-year institutions, far more AAPI students attend public two-year and four-year colleges. In fact, most AAPI students attend public institutions, and in some states, like California and Nevada, over half of all AAPI college students are attending public community colleges. In 2000, for example, there were 363,798 AAPIs enrolled in public two-year col-leges in the United States compared to 101,751 enrolled in private four-year colleges. The likelihood that AAPIs attend public institutions is not just a trend in the two-year sector. Among AAPIs attending four-year institutions, more than two-thirds (69 percent) were enrolled in public institutions; this is fairly consistent with the distribution of other racial groups (Figure 3).
Figure 3: AAPI Enrollment in U.S. Higher Education by Institutional Type, 2000
0
50,000
100,000
150,000
200,000
250,000
300,000
350,000
400,000
Public Two-YearPublic Four-YearPrivate Four-Year
363,798354,564
101,751
Source: U.S. Department of Education, IPEDS, 2006.
10 • Fiction #2
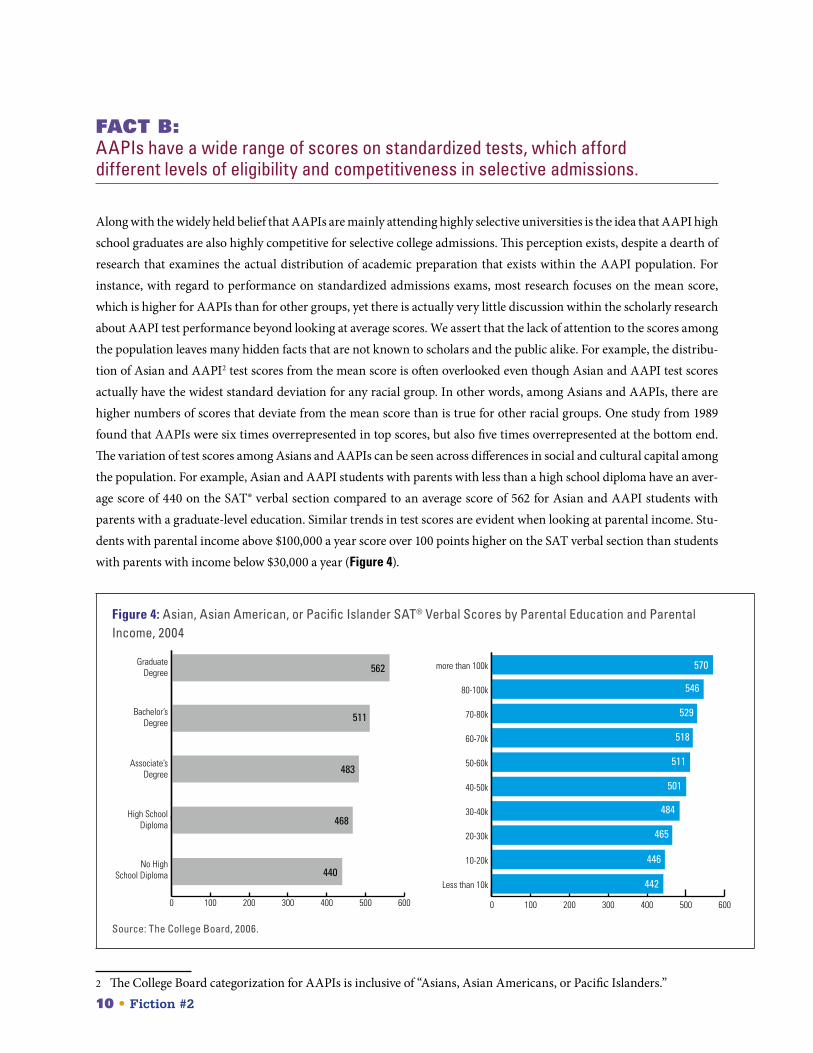
FaCT B: AAPIs have a wide range of scores on standardized tests, which afford different levels of eligibility and competitiveness in selective admissions.
Along with the widely held belief that AAPIs are mainly attending highly selective universities is the idea that AAPI high school graduates are also highly competitive for selective college admissions. This perception exists, despite a dearth of research that examines the actual distribution of academic preparation that exists within the AAPI population. For instance, with regard to performance on standardized admissions exams, most research focuses on the mean score, which is higher for AAPIs than for other groups, yet there is actually very little discussion within the scholarly research about AAPI test performance beyond looking at average scores. We assert that the lack of attention to the scores among the population leaves many hidden facts that are not known to scholars and the public alike. For example, the distribu-tion of Asian and AAPI2 test scores from the mean score is often overlooked even though Asian and AAPI test scores actually have the widest standard deviation for any racial group. In other words, among Asians and AAPIs, there are higher numbers of scores that deviate from the mean score than is true for other racial groups. One study from 1989 found that AAPIs were six times overrepresented in top scores, but also five times overrepresented at the bottom end. The variation of test scores among Asians and AAPIs can be seen across differences in social and cultural capital among the population. For example, Asian and AAPI students with parents with less than a high school diploma have an aver-age score of 440 on the SAT® verbal section compared to an average score of 562 for Asian and AAPI students with parents with a graduate-level education. Similar trends in test scores are evident when looking at parental income. Stu-dents with parental income above $100,000 a year score over 100 points higher on the SAT verbal section than students with parents with income below $30,000 a year (Figure 4).
Figure 4: Asian, Asian American, or Pacific Islander SAT® Verbal Scores by Parental Education and Parental Income, 2004
0 100 200 300 400 500 600
SAT I Verbal
No HighSchool Diploma
High SchoolDiploma
Associate’sDegree
Bachelor’sDegree
GraduateDegree 562
511
483
468
440
0 100 200 300 400 500 600
SAT I Verbal
Less than 10k
10-20k
20-30k
30-40k
40-50k
50-60k
60-70k
70-80k
80-100k
more than 100k 570
546
529
518
511
501
484
465
446
442
Source: The College Board, 2006.
2 The College Board categorization for AAPIs is inclusive of “Asians, Asian Americans, or Pacific Islanders.”
Fiction #2 • 11
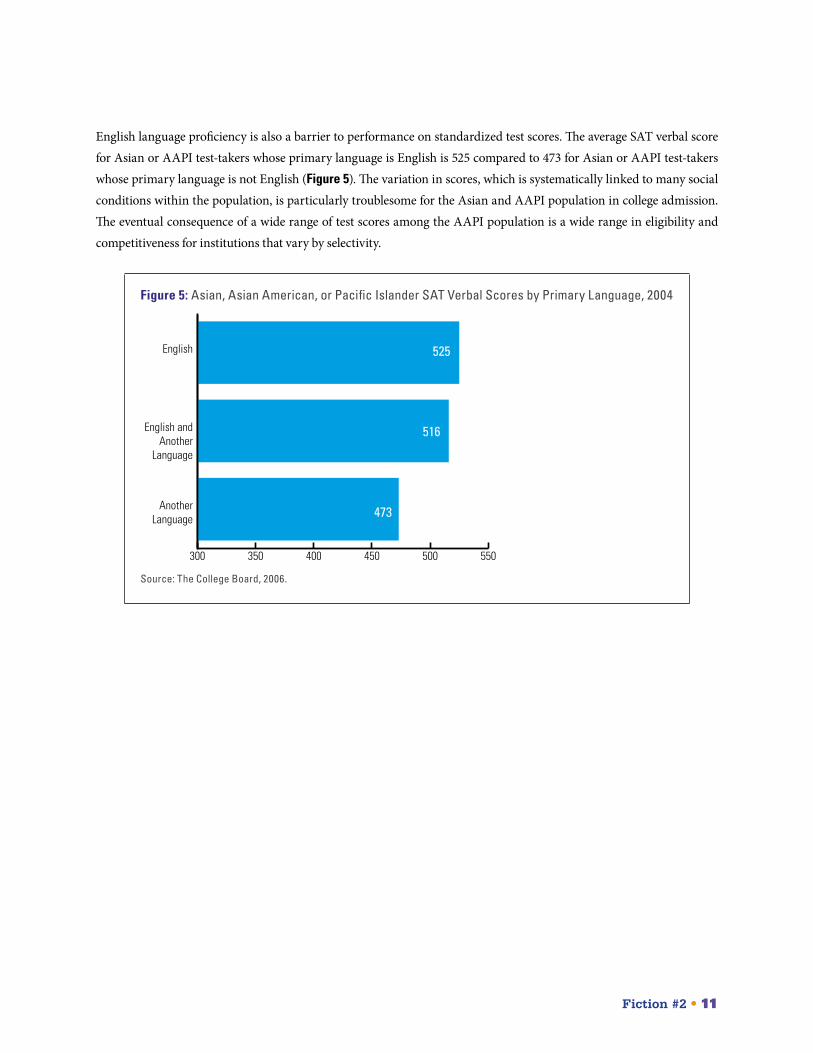
English language proficiency is also a barrier to performance on standardized test scores. The average SAT verbal score for Asian or AAPI test-takers whose primary language is English is 525 compared to 473 for Asian or AAPI test-takers whose primary language is not English (Figure 5). The variation in scores, which is systematically linked to many social conditions within the population, is particularly troublesome for the Asian and AAPI population in college admission. The eventual consequence of a wide range of test scores among the AAPI population is a wide range in eligibility and competitiveness for institutions that vary by selectivity.
Figure 5: Asian, Asian American, or Pacific Islander SAT Verbal Scores by Primary Language, 2004
300 350 400 450 500 550
SAT I Verbal
AnotherLanguage
English andAnother
Language
English 525
516
473
Source: The College Board, 2006.
12 • Fiction #2
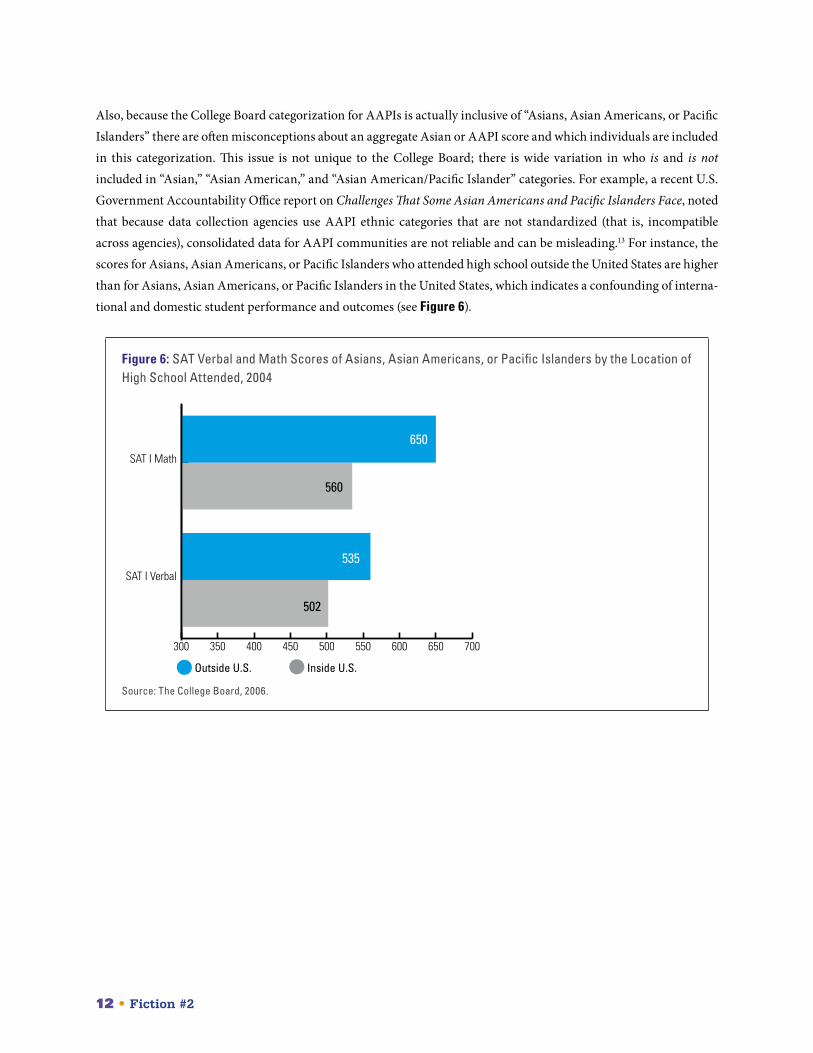
Also, because the College Board categorization for AAPIs is actually inclusive of “Asians, Asian Americans, or Pacific Islanders” there are often misconceptions about an aggregate Asian or AAPI score and which individuals are included in this categorization. This issue is not unique to the College Board; there is wide variation in who is and is not included in “Asian,” “Asian American,” and “Asian American/Pacific Islander” categories. For example, a recent U.S. Government Accountability Office report on Challenges That Some Asian Americans and Pacific Islanders Face, noted that because data collection agencies use AAPI ethnic categories that are not standardized (that is, incompatible across agencies), consolidated data for AAPI communities are not reliable and can be misleading.13 For instance, the scores for Asians, Asian Americans, or Pacific Islanders who attended high school outside the United States are higher than for Asians, Asian Americans, or Pacific Islanders in the United States, which indicates a confounding of interna-tional and domestic student performance and outcomes (see Figure 6).
Figure 6: SAT Verbal and Math Scores of Asians, Asian Americans, or Pacific Islanders by the Location of High School Attended, 2004
300 350 400 450 500 550 600 650 700
SAT I Verbal
SAT I Math
SAT I Verbal
SAT I Math
Outside U.S. Inside U.S.
650
560
535
502
Source: The College Board, 2006.
Fiction #2 • 13
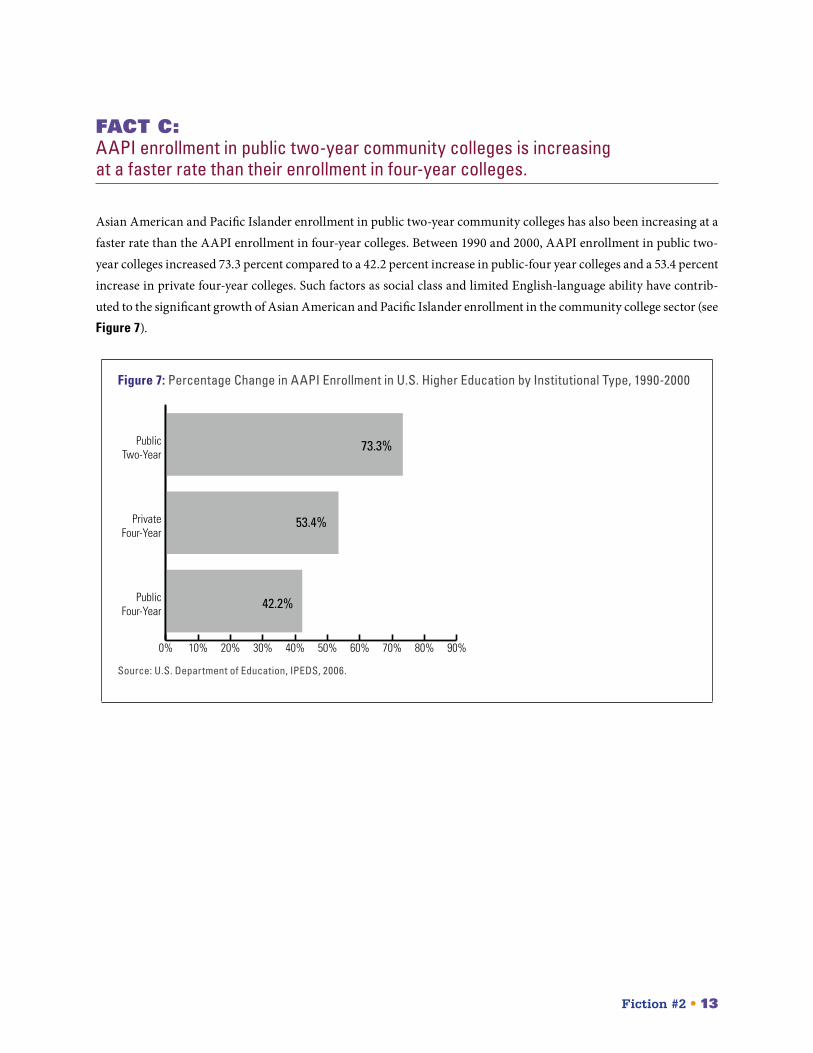
FaCT C: AAPI enrollment in public two-year community colleges is increasing at a faster rate than their enrollment in four-year colleges.
Asian American and Pacific Islander enrollment in public two-year community colleges has also been increasing at a faster rate than the AAPI enrollment in four-year colleges. Between 1990 and 2000, AAPI enrollment in public two-year colleges increased 73.3 percent compared to a 42.2 percent increase in public-four year colleges and a 53.4 percent increase in private four-year colleges. Such factors as social class and limited English-language ability have contrib-uted to the significant growth of Asian American and Pacific Islander enrollment in the community college sector (see Figure 7).
Figure 7: Percentage Change in AAPI Enrollment in U.S. Higher Education by Institutional Type, 1990-2000
0% 10% 20% 30% 40% 50% 60% 70% 80% 90%
PublicFour-Year
PrivateFour-Year
PublicTwo-Year
73.3%
53.4%
42.2%
Source: U.S. Department of Education, IPEDS, 2006.
14 • Fiction #2
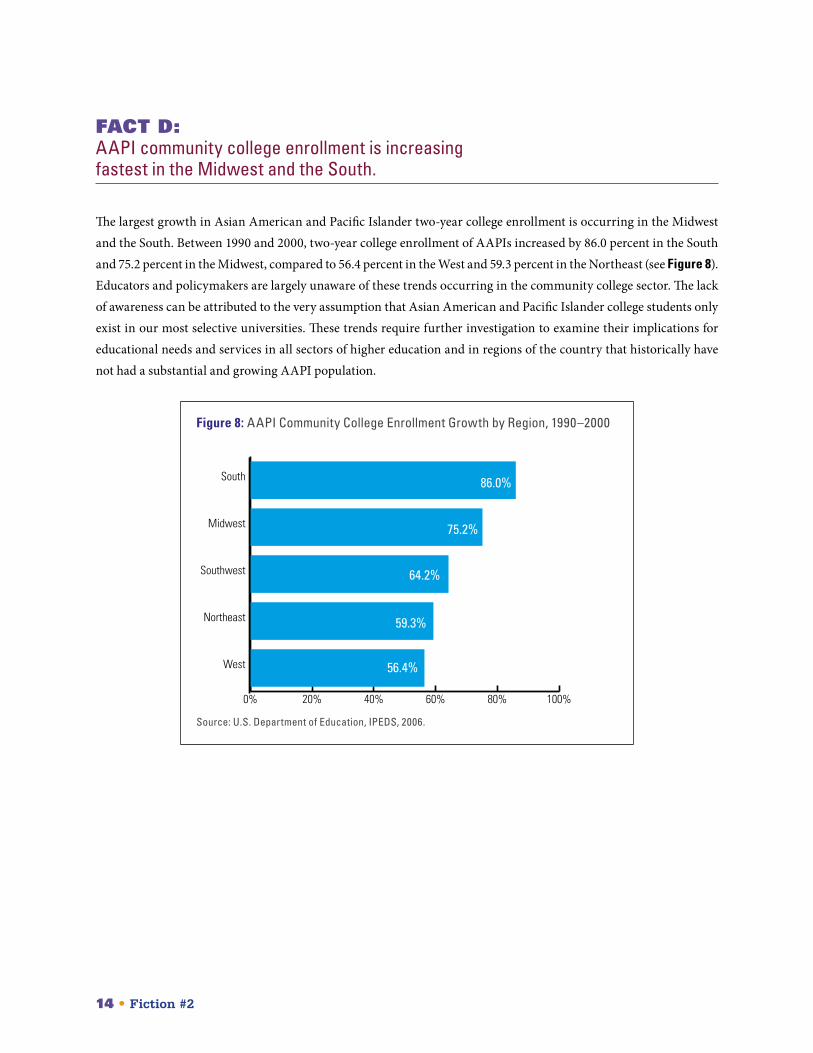
FaCT D: AAPI community college enrollment is increasing fastest in the Midwest and the South.
The largest growth in Asian American and Pacific Islander two-year college enrollment is occurring in the Midwest and the South. Between 1990 and 2000, two-year college enrollment of AAPIs increased by 86.0 percent in the South and 75.2 percent in the Midwest, compared to 56.4 percent in the West and 59.3 percent in the Northeast (see Figure 8). Educators and policymakers are largely unaware of these trends occurring in the community college sector. The lack of awareness can be attributed to the very assumption that Asian American and Pacific Islander college students only exist in our most selective universities. These trends require further investigation to examine their implications for educational needs and services in all sectors of higher education and in regions of the country that historically have not had a substantial and growing AAPI population.
Figure 8: AAPI Community College Enrollment Growth by Region, 1990–2000
0% 20% 40% 60% 80% 100%
West
Northeast
Southwest
Midwest
South 86.0%
75.2%
56.4%
64.2%
59.3%
Source: U.S. Department of Education, IPEDS, 2006.
Fiction #3 • 15
Fiction #3: AAPIs are a homogenous racial group with uniformity in educational and financial attainment, culture, religion, and histories.
Race matters in today’s American society, and yet its definition and categorizations are ambiguous, contradictory, and seemingly fluid depending upon social, political, and scientific shifts throughout U.S. history. In other words, race is a flawed, highly politicized classification system that is constantly shifting along with the American landscape. Because of this, sociologists suggest that “the effort must be made to understand race as an unstable and ‘decentered’ complex of social meanings constantly being transformed by political struggle… Thus, we should think of race as an element of social structure.”14
In reality, there is no such thing as one Asian American and Pacific Islander composite, especially when there are more differences than similarities between the many groups designated by the federally defined categories of “Asian Amer-ican” and/or “Pacific Islander.” Although there are varied and historical reasons for reporting these groups under one umbrella, it is critical for educators and policymakers to recognize that there are numerous Asian American and Pacific Islander ethnicities, many historical backgrounds, and a full range of socioeconomic spectra, from the poor and underprivileged to the affluent and highly educated. There is no simple description that can characterize Asian American and Pacific Islander students or communities as a whole.
16 • Fiction #3
FaCT a: AAPIs are an ethnically diverse population.
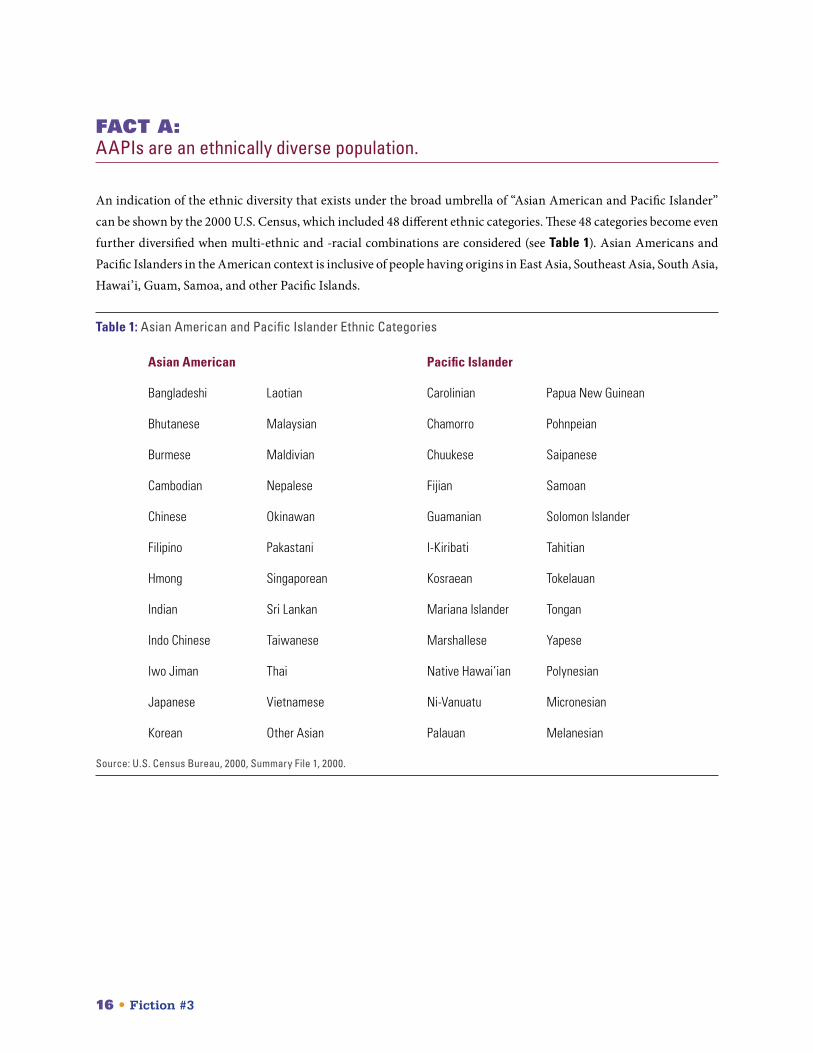
An indication of the ethnic diversity that exists under the broad umbrella of “Asian American and Pacific Islander” can be shown by the 2000 U.S. Census, which included 48 different ethnic categories. These 48 categories become even further diversified when multi-ethnic and -racial combinations are considered (see Table 1). Asian Americans and Pacific Islanders in the American context is inclusive of people having origins in East Asia, Southeast Asia, South Asia, Hawai’i, Guam, Samoa, and other Pacific Islands.
Table 1: Asian American and Pacific Islander Ethnic Categories
Asian American Pacific Islander
Bangladeshi Laotian Carolinian Papua New Guinean
Bhutanese Malaysian Chamorro Pohnpeian
Burmese Maldivian Chuukese Saipanese
Cambodian Nepalese Fijian Samoan
Chinese Okinawan Guamanian Solomon Islander
Filipino Pakastani I-Kiribati Tahitian
Hmong Singaporean Kosraean Tokelauan
Indian Sri Lankan Mariana Islander Tongan
Indo Chinese Taiwanese Marshallese Yapese
Iwo Jiman Thai Native Hawai’ian Polynesian
Japanese Vietnamese Ni-Vanuatu Micronesian
Korean Other Asian Palauan Melanesian
Source: U.S. Census Bureau, 2000, Summary File 1, 2000.
Fiction #3 • 17
FaCT B: AAPI students and their families encompass many different languages and dialects.
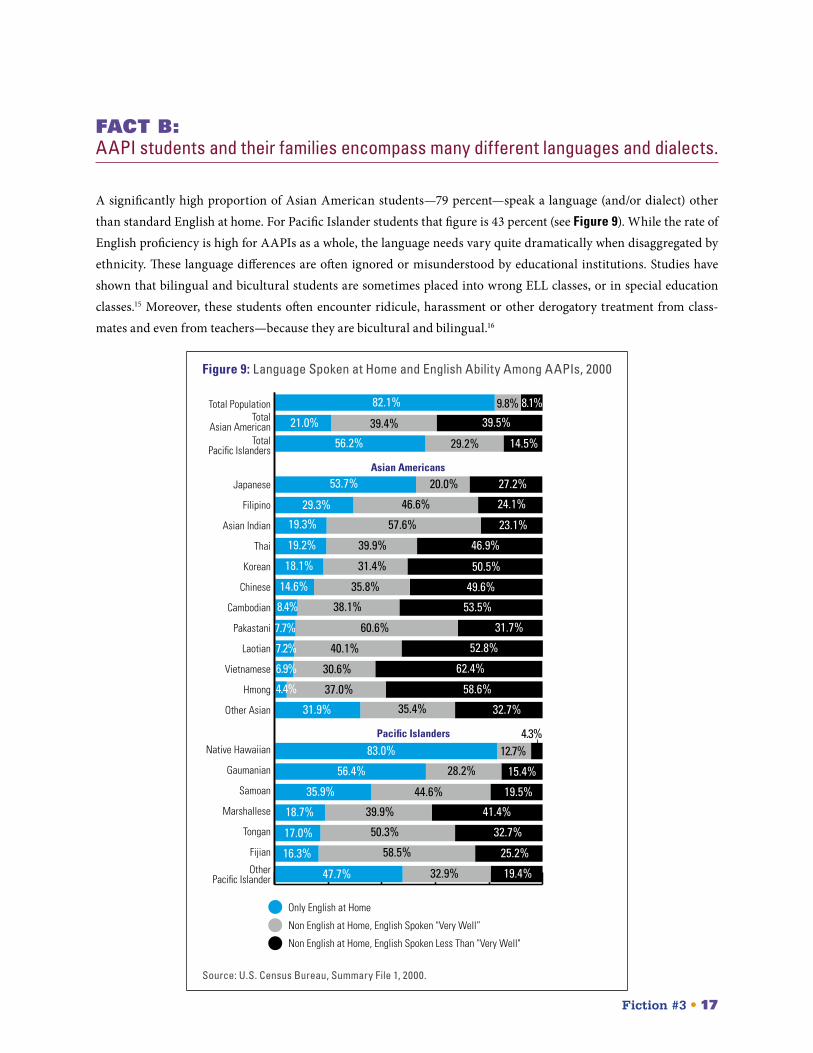
A significantly high proportion of Asian American students—79 percent—speak a language (and/or dialect) other than standard English at home. For Pacific Islander students that figure is 43 percent (see Figure 9). While the rate of English proficiency is high for AAPIs as a whole, the language needs vary quite dramatically when disaggregated by ethnicity. These language differences are often ignored or misunderstood by educational institutions. Studies have shown that bilingual and bicultural students are sometimes placed into wrong ELL classes, or in special education classes.15 Moreover, these students often encounter ridicule, harassment or other derogatory treatment from class-mates and even from teachers—because they are bicultural and bilingual.16
Figure 9: Language Spoken at Home and English Ability Among AAPIs, 2000
0% 20% 40% 60% 80% 100%
Non English at Home, English Spoken Less Than Very Well
Non English at Home, English Spoken Very Well
Only English at Home
OtherPacific Islander
Fijian
Tongan
Marshallese
Samoan
Gaumanian
Native Hawaiian
Other Asian
Hmong
Vietnamese
Laotian
Pakastani
Cambodian
Chinese
Korean
Thai
Asian Indian
Filipino
Japanese
TotalPacific Islanders
TotalAsian American
Total Population
Only English at Home
Non English at Home, English Spoken "Very Well”
Non English at Home, English Spoken Less Than "Very Well"
Asian Americans
Pacific Islanders
82.1%
29.3% 46.6% 24.1%
20.0%
9.8% 8.1%
40.1%
21.0% 39.4% 39.5%
14.5%56.2% 29.2%
53.7% 27.2%
19.3% 57.6% 23.1%
19.2% 39.9% 46.9%
18.1% 31.4% 50.5%
14.6% 35.8% 49.6%
8.4% 38.1% 53.5%
7.7% 60.6% 31.7%
6.9% 30.6% 62.4%
4.4% 37.0% 58.6%
31.9% 35.4% 32.7%
7.2% 52.8%
39.9%
83.0% 12.7%4.3%
56.4% 28.2% 15.4%
35.9% 44.6% 19.5%
17.0% 50.3% 32.7%
16.3% 58.5% 25.2%
47.7% 32.9% 19.4%
18.7% 41.4%
Source: U.S. Census Bureau, Summary File 1, 2000.
18 • Fiction #3
FaCT C: Immigration histories have an effect on the needs and assets of different AAPI communities.
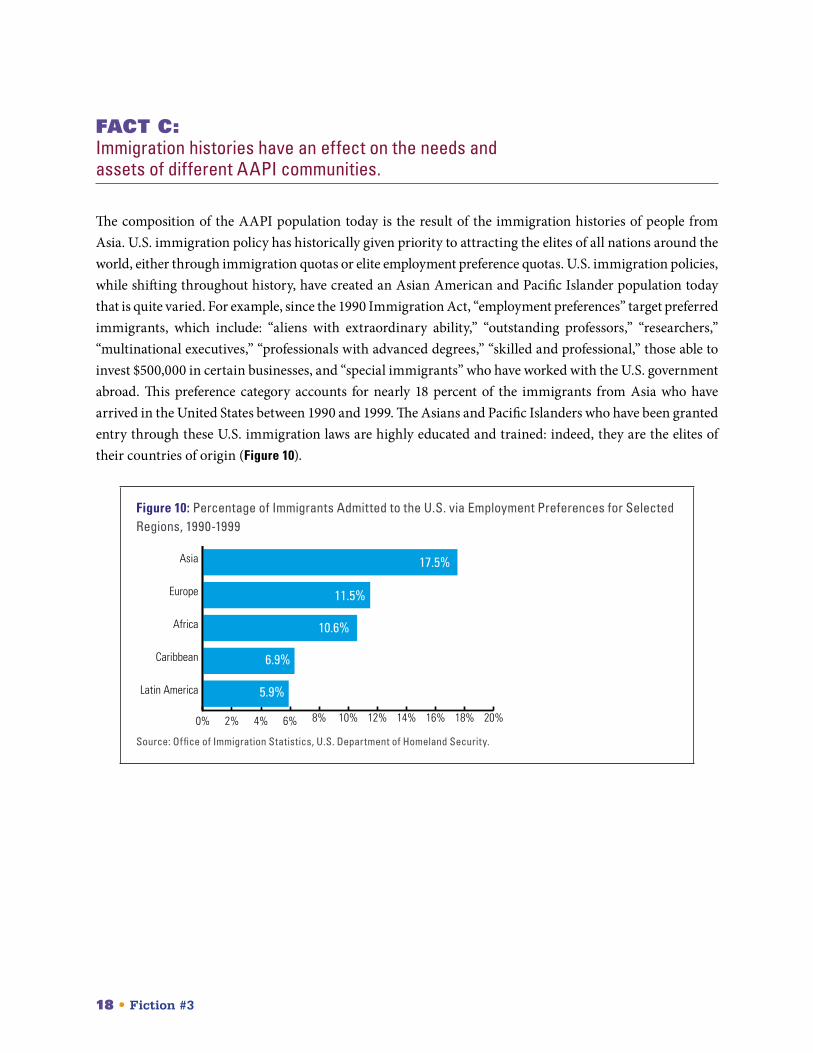
The composition of the AAPI population today is the result of the immigration histories of people from Asia. U.S. immigration policy has historically given priority to attracting the elites of all nations around the world, either through immigration quotas or elite employment preference quotas. U.S. immigration policies, while shifting throughout history, have created an Asian American and Pacific Islander population today that is quite varied. For example, since the 1990 Immigration Act, “employment preferences” target preferred immigrants, which include: “aliens with extraordinary ability,” “outstanding professors,” “researchers,” “multinational executives,” “professionals with advanced degrees,” “skilled and professional,” those able to invest $500,000 in certain businesses, and “special immigrants” who have worked with the U.S. government abroad. This preference category accounts for nearly 18 percent of the immigrants from Asia who have arrived in the United States between 1990 and 1999. The Asians and Pacific Islanders who have been granted entry through these U.S. immigration laws are highly educated and trained: indeed, they are the elites of their countries of origin (Figure 10).
Figure 10: Percentage of Immigrants Admitted to the U.S. via Employment Preferences for Selected Regions, 1990-1999
0% 2% 4% 6% 8% 10% 12% 14% 16% 18% 20%
Latin America
Caribbean
Africa
Europe
Asia 17.5%
11.5%
10.6%
5.9%
6.9%
Source: Office of Immigration Statistics, U.S. Department of Homeland Security.
Fiction #3 • 19
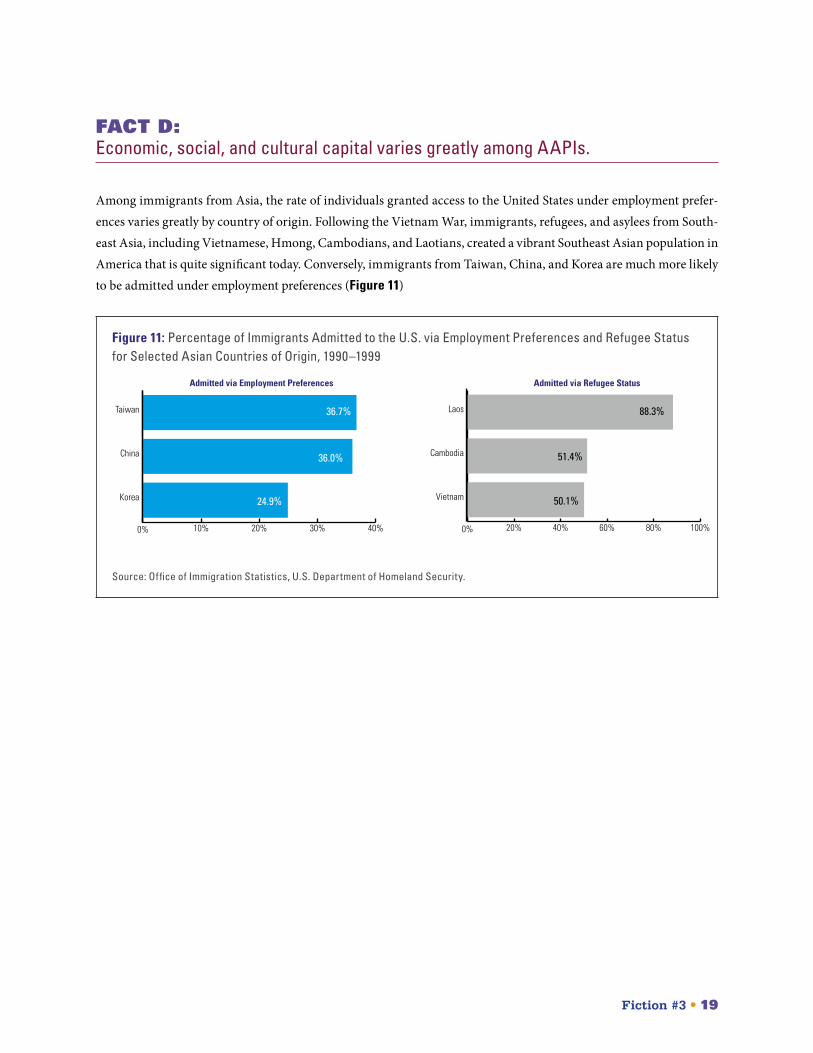
FaCT D: Economic, social, and cultural capital varies greatly among AAPIs.
Among immigrants from Asia, the rate of individuals granted access to the United States under employment prefer-ences varies greatly by country of origin. Following the Vietnam War, immigrants, refugees, and asylees from South-east Asia, including Vietnamese, Hmong, Cambodians, and Laotians, created a vibrant Southeast Asian population in America that is quite significant today. Conversely, immigrants from Taiwan, China, and Korea are much more likely to be admitted under employment preferences (Figure 11)
Figure 11: Percentage of Immigrants Admitted to the U.S. via Employment Preferences and Refugee Status for Selected Asian Countries of Origin, 1990–1999
0% 10% 20% 30% 40%
Korea
China
Taiwan
Admitted via Employment Preferences Admitted via Refugee Status
0% 20% 40% 60% 80% 100%
Vietnam
Cambodia
Laos
36.0%
24.9%
36.7%
51.4%
88.3%
50.1%
Source: Office of Immigration Statistics, U.S. Department of Homeland Security.
20 • Fiction #3
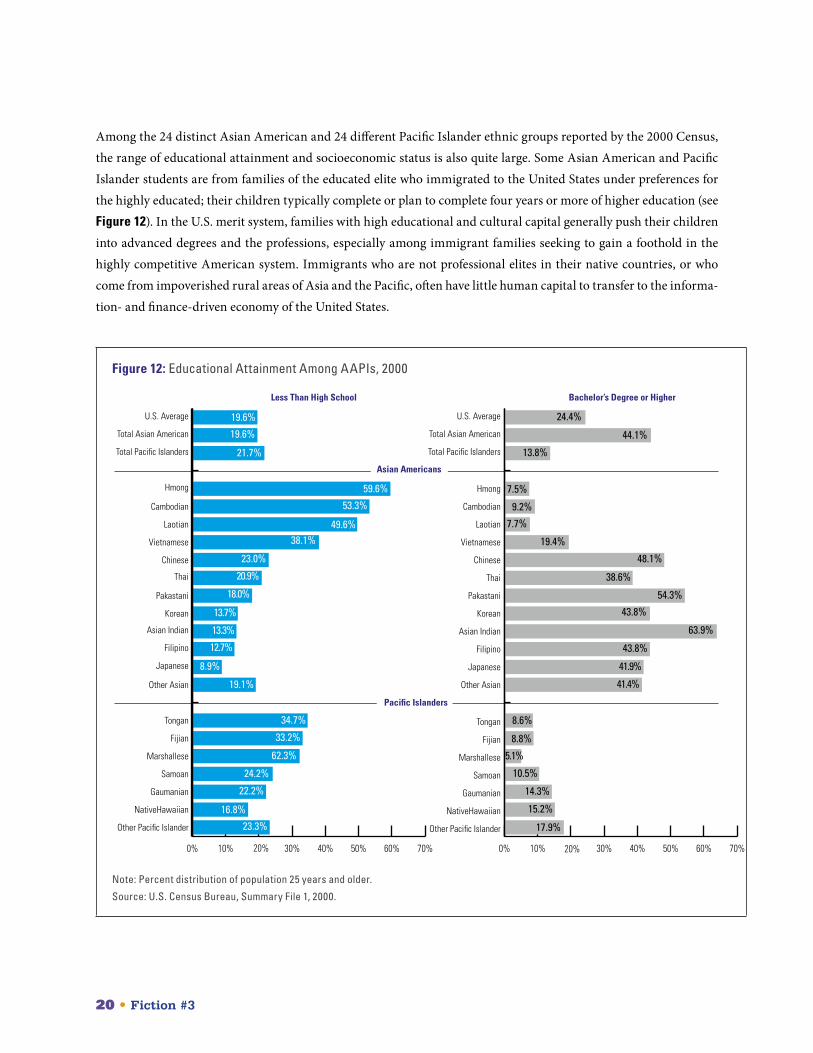
Among the 24 distinct Asian American and 24 different Pacific Islander ethnic groups reported by the 2000 Census, the range of educational attainment and socioeconomic status is also quite large. Some Asian American and Pacific Islander students are from families of the educated elite who immigrated to the United States under preferences for the highly educated; their children typically complete or plan to complete four years or more of higher education (see Figure 12). In the U.S. merit system, families with high educational and cultural capital generally push their children into advanced degrees and the professions, especially among immigrant families seeking to gain a foothold in the highly competitive American system. Immigrants who are not professional elites in their native countries, or who come from impoverished rural areas of Asia and the Pacific, often have little human capital to transfer to the informa-tion- and finance-driven economy of the United States.
Figure 12: Educational Attainment Among AAPIs, 2000
0% 10% 20% 30% 40% 50% 60% 70%
Less than High School
Other Pacific Islander
NativeHawaiian
Gaumanian
Samoan
Marshallese
Fijian
Tongan
Other Asian
Japanese
Filipino
Asian Indian
Korean
Pakastani
Thai
Chinese
Vietnamese
Laotian
Cambodian
Hmong
Total Pacific Islanders
Total Asian American
U.S. Average
Less Than High School Bachelor’s Degree or Higher
0% 10% 20% 30% 40% 50% 60% 70%
Bachelor's Degree or More
Other Pacific Islander
NativeHawaiian
Gaumanian
Samoan
Marshallese
Fijian
Tongan
Other Asian
Japanese
Filipino
Asian Indian
Korean
Pakastani
Thai
Chinese
Vietnamese
Laotian
Cambodian
Hmong
Total Pacific Islanders
Total Asian American
U.S. Average
Pacific Islanders
Asian Americans
24.4%
59.6%
9.2%
7.5%
19.1%
19.6%
13.8%
19.6% 44.1%
21.7%
53.3%
7.7%49.6%
19.4%38.1%
48.1%23.0%
38.6%20.9%
54.3%18.0%
62.3%
13.3%
33.2%
12.7%
34.7%
8.9%
43.8%13.7%
10.5%
63.9%
41.9%
41.4%
43.8%
8.6%
5.1%
8.8%
24.2%
14.3%22.2%
15.2%16.8%
17.9%23.3%
Note: Percent distribution of population 25 years and older.
Source: U.S. Census Bureau, Summary File 1, 2000.
Fiction #3 • 21
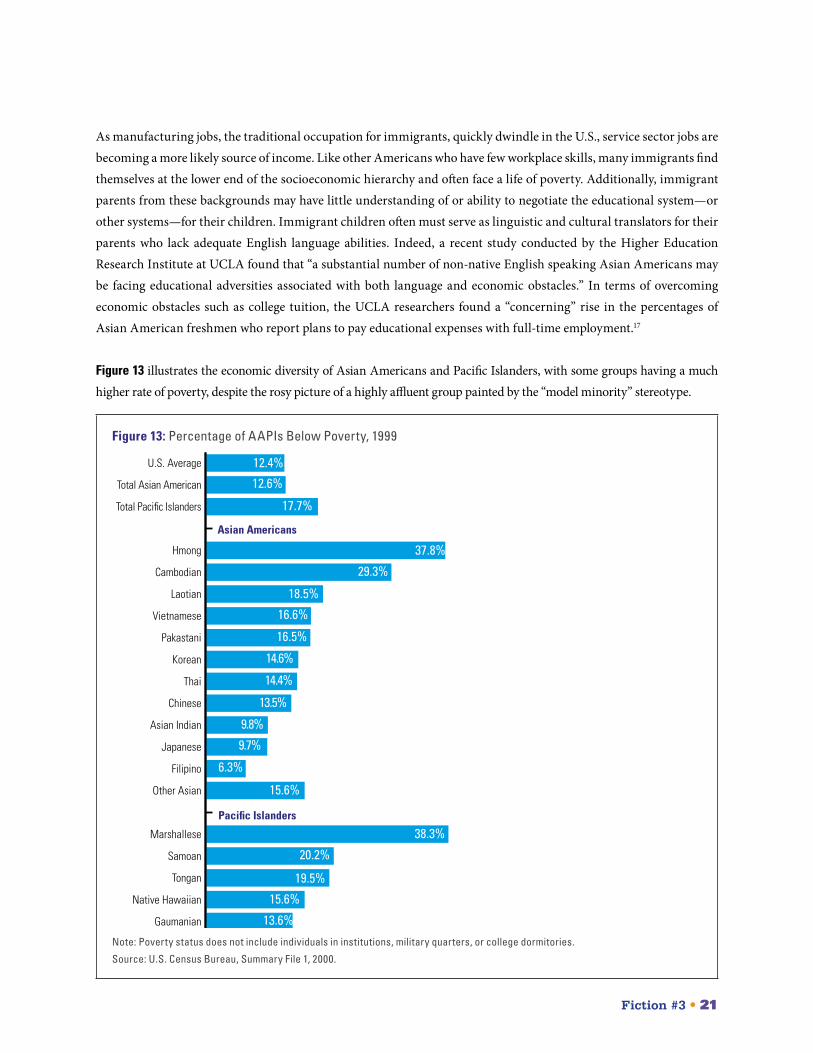
As manufacturing jobs, the traditional occupation for immigrants, quickly dwindle in the U.S., service sector jobs are becoming a more likely source of income. Like other Americans who have few workplace skills, many immigrants find themselves at the lower end of the socioeconomic hierarchy and often face a life of poverty. Additionally, immigrant parents from these backgrounds may have little understanding of or ability to negotiate the educational system—or other systems—for their children. Immigrant children often must serve as linguistic and cultural translators for their parents who lack adequate English language abilities. Indeed, a recent study conducted by the Higher Education Research Institute at UCLA found that “a substantial number of non-native English speaking Asian Americans may be facing educational adversities associated with both language and economic obstacles.” In terms of overcoming economic obstacles such as college tuition, the UCLA researchers found a “concerning” rise in the percentages of Asian American freshmen who report plans to pay educational expenses with full-time employment.17
Figure 13 illustrates the economic diversity of Asian Americans and Pacific Islanders, with some groups having a much higher rate of poverty, despite the rosy picture of a highly affluent group painted by the “model minority” stereotype.
Figure 13: Percentage of AAPIs Below Poverty, 1999
0% 5% 10% 15% 20% 25% 30% 35% 40% 45%
Poverty Rate
Other Pacific Islander
Fijian
Gaumanian
Native Hawaiian
Tongan
Samoan
Marshallese
Other Asian
Filipino
Japanese
Asian Indian
Chinese
Thai
Korean
Pakastani
Vietnamese
Laotian
Cambodian
Hmong
Total Pacific Islanders
Total Asian American
U.S. Average
Pacific Islanders
Asian Americans
37.8%
15.6%
12.4%
12.6%
17.7%
29.3%
18.5%
16.6%
16.5%
14.6%
14.4%
19.5%
9.8%
20.2%
9.7%
38.3%
6.3%
13.5%
15.6%
13.6%
10.5%
21.4%
Note: Poverty status does not include individuals in institutions, military quarters, or college dormitories.
Source: U.S. Census Bureau, Summary File 1, 2000.
22 • Fiction #3
Among the most economically disadvantaged are Cambodian, Hmong, and Laotian war refugees from the rural regions of Southeast Asia, many of whom struggle with long-term poverty, language and literacy issues, and post-traumatic stress disorders associated with their forced migration. In addition, Native Hawai’ians and Pacific Islanders of Hawai’i, Guam, American Samoa, and the Northern Mariana Islands have had to contend with issues of governance and self-determina-tion stemming from years of colonization. This history has created a complex situation that impacts their ability to access federal programs and services. For example, Pacific Islander students from the Federated States of Micronesia and the Republics of Palau and the Marshall Islands may not be eligible for some forms of federal educational assistance because of their governments’ intricate political relationships with the United States.
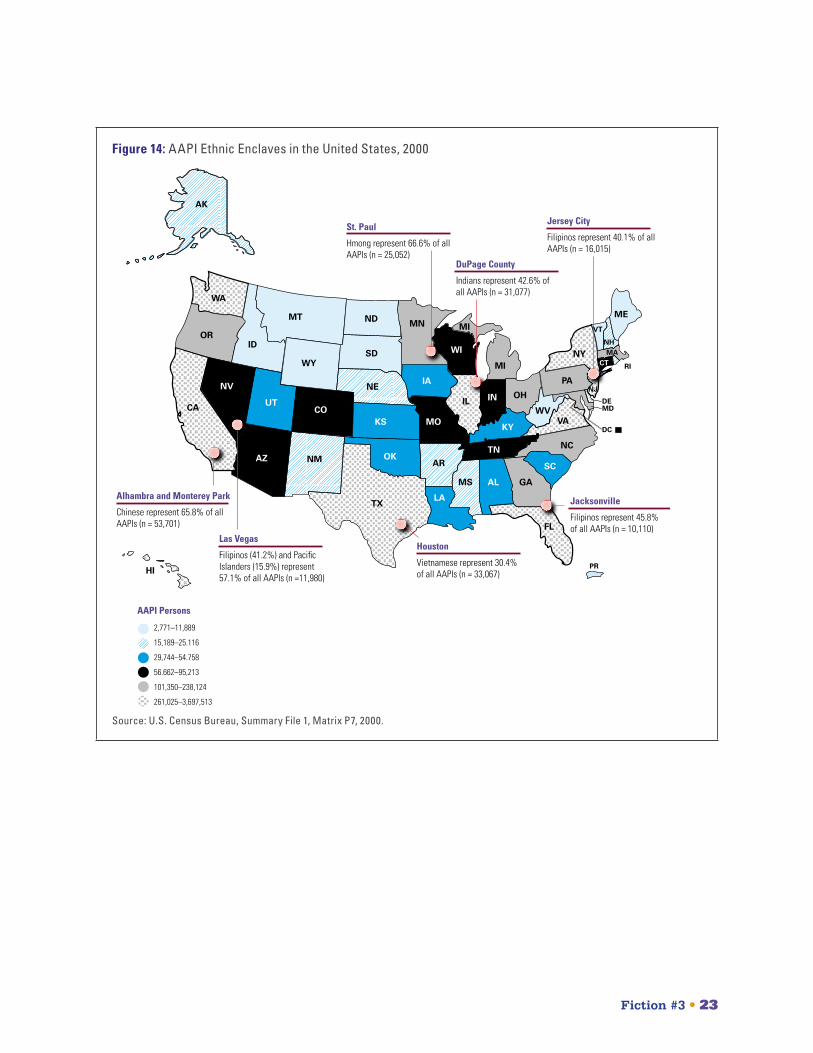
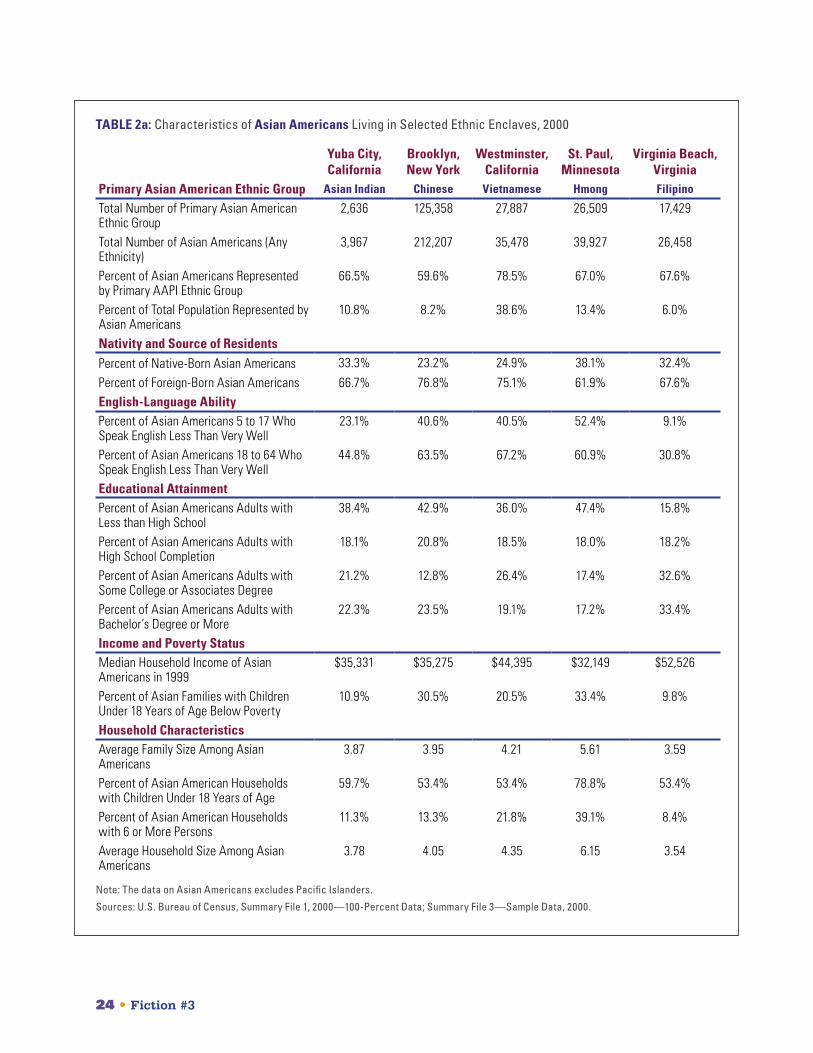
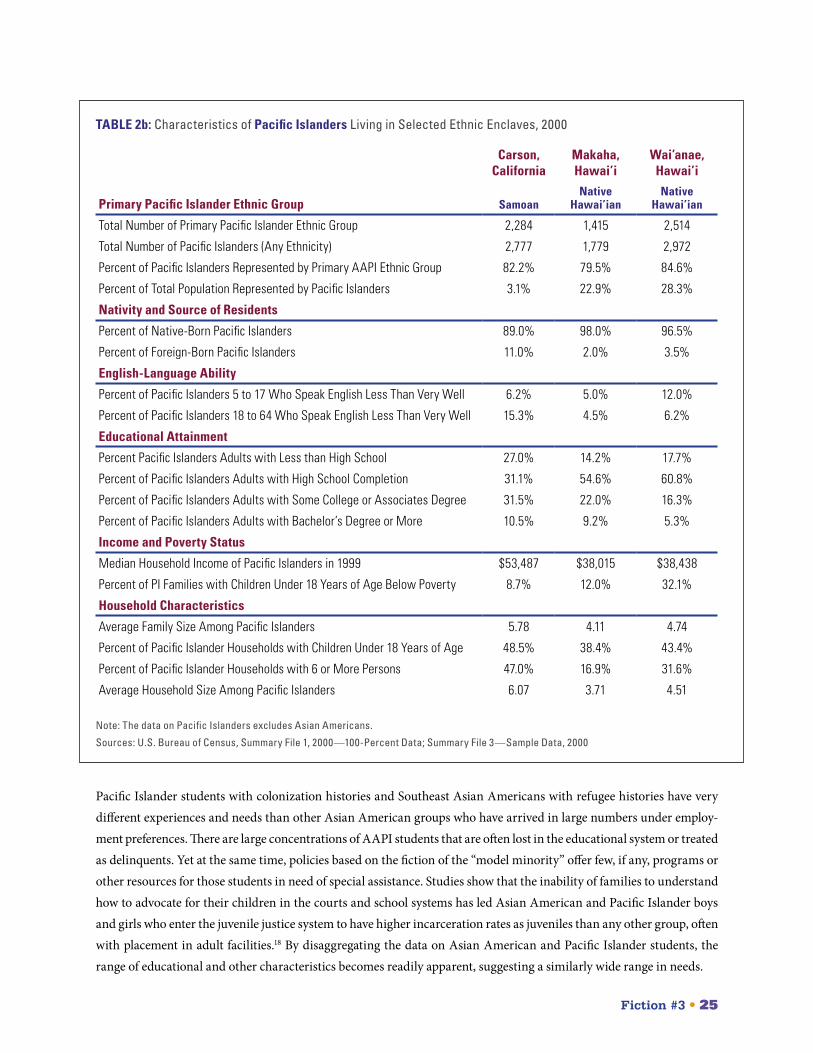
The bimodal distribution of socioeconomic status within the AAPI community is often further exaggerated by resi-dential patterns of different ethnic populations, particularly for ethnic groups that are residentially concentrated. In other words, while AAPIs generally are concentrated in a few states, with 65 percent of all AAPIs living in five states: California, New York, Hawai’i, Texas, and Illinois, different ethnic groups often cluster in ethnic enclaves throughout the U.S. in communities that may be urban, suburban or rural (see Figure 14). Data collected from such ethnic enclaves show wide variations in assets and needs (Table 2a and 2b). For example, over 60 percent of 18- to 64-year-old Chinese in Brooklyn, NY, Vietnamese in Westminster, CA, and Hmong in St. Paul, MN report speaking English “less than very well.” In terms of household income for Pacific Islanders in 1999, Samoans in Carson, CA earned, on average, over $15,000 more than Native Hawai’ians in Makaha, HI and Wai’anae, HI. Chinese in Brooklyn and Hmong in St. Paul have considerably higher rates of families with children under 18 below poverty at 30.5 and 33.4 percents, which is approximately three times the national average.
Fiction #3 • 23
Figure 14: AAPI Ethnic Enclaves in the United States, 2000
St. Paul
Hmong represent 66.6% of all AAPIs (n = 25,052)
DuPage County
Indians represent 42.6% of all AAPIs (n = 31,077)
Houston
Vietnamese represent 30.4% of all AAPIs (n = 33,067)
Jacksonville
Filipinos represent 45.8% of all AAPIs (n = 10,110)
Las Vegas
Filipinos (41.2%) and Pacific Islanders (15.9%) represent 57.1% of all AAPIs (n =11,980)
Alhambra and Monterey Park
Chinese represent 65.8% of all AAPIs (n = 53,701)
Jersey City
Filipinos represent 40.1% of all AAPIs (n = 16,015)
2,771–11,889
15,189–25.116
29,744–54.758
56.662–95,213
101,350–238,124
261,025–3,697,513
AAPI Persons
WY
WVVA
DC
SDRI
OK
ND
NY
NM
NE
MO
MA
MD
MS
LA
KYKS
IA
IN
HI
FL
DE
CT
WI
VT
UT
NC
NJ
NH
ME
GA
COCA
AR
WA
TN
SC
PA
OR
OHNV
MTMN
MI
MI
IL
ID
AZ
TX
AK
AL
PR
Source: U.S. Census Bureau, Summary File 1, Matrix P7, 2000.
24 • Fiction #3
TABLE 2a: Characteristics of Asian Americans Living in Selected Ethnic Enclaves, 2000
Yuba City, California
Brooklyn, New York
Westminster, California
St. Paul, Minnesota
Virginia Beach, Virginia
Primary Asian American Ethnic Group Asian Indian Chinese Vietnamese Hmong Filipino
Total Number of Primary Asian American Ethnic Group
2,636 125,358 27,887 26,509 17,429
Total Number of Asian Americans (Any Ethnicity)
3,967 212,207 35,478 39,927 26,458
Percent of Asian Americans Represented by Primary AAPI Ethnic Group
66.5% 59.6% 78.5% 67.0% 67.6%
Percent of Total Population Represented by Asian Americans
10.8% 8.2% 38.6% 13.4% 6.0%
Nativity and Source of Residents Percent of Native-Born Asian Americans 33.3% 23.2% 24.9% 38.1% 32.4%Percent of Foreign-Born Asian Americans 66.7% 76.8% 75.1% 61.9% 67.6%English-Language Ability Percent of Asian Americans 5 to 17 Who Speak English Less Than Very Well
23.1% 40.6% 40.5% 52.4% 9.1%
Percent of Asian Americans 18 to 64 Who Speak English Less Than Very Well
44.8% 63.5% 67.2% 60.9% 30.8%
Educational Attainment Percent of Asian Americans Adults with Less than High School
38.4% 42.9% 36.0% 47.4% 15.8%
Percent of Asian Americans Adults with High School Completion
18.1% 20.8% 18.5% 18.0% 18.2%
Percent of Asian Americans Adults with Some College or Associates Degree
21.2% 12.8% 26.4% 17.4% 32.6%
Percent of Asian Americans Adults with Bachelor’s Degree or More
22.3% 23.5% 19.1% 17.2% 33.4%
Income and Poverty Status Median Household Income of Asian Americans in 1999
$35,331 $35,275 $44,395 $32,149 $52,526
Percent of Asian Families with Children Under 18 Years of Age Below Poverty
10.9% 30.5% 20.5% 33.4% 9.8%
Household Characteristics Average Family Size Among Asian Americans
3.87 3.95 4.21 5.61 3.59
Percent of Asian American Households with Children Under 18 Years of Age
59.7% 53.4% 53.4% 78.8% 53.4%
Percent of Asian American Households with 6 or More Persons
11.3% 13.3% 21.8% 39.1% 8.4%
Average Household Size Among Asian Americans
3.78 4.05 4.35 6.15 3.54
Note: The data on Asian Americans excludes Pacific Islanders.
Sources: U.S. Bureau of Census, Summary File 1, 2000—100-Percent Data; Summary File 3—Sample Data, 2000.
Fiction #3 • 25
TABLE 2b: Characteristics of Pacific Islanders Living in Selected Ethnic Enclaves, 2000
Carson, California
Makaha, Hawai’i
Wai’anae, Hawai’i
Primary Pacific Islander Ethnic Group SamoanNative
Hawai’ianNative
Hawai’ian
Total Number of Primary Pacific Islander Ethnic Group 2,284 1,415 2,514
Total Number of Pacific Islanders (Any Ethnicity) 2,777 1,779 2,972
Percent of Pacific Islanders Represented by Primary AAPI Ethnic Group 82.2% 79.5% 84.6%
Percent of Total Population Represented by Pacific Islanders 3.1% 22.9% 28.3%
Nativity and Source of Residents
Percent of Native-Born Pacific Islanders 89.0% 98.0% 96.5%
Percent of Foreign-Born Pacific Islanders 11.0% 2.0% 3.5%
English-Language Ability
Percent of Pacific Islanders 5 to 17 Who Speak English Less Than Very Well 6.2% 5.0% 12.0%
Percent of Pacific Islanders 18 to 64 Who Speak English Less Than Very Well 15.3% 4.5% 6.2%
Educational Attainment
Percent Pacific Islanders Adults with Less than High School 27.0% 14.2% 17.7%
Percent of Pacific Islanders Adults with High School Completion 31.1% 54.6% 60.8%
Percent of Pacific Islanders Adults with Some College or Associates Degree 31.5% 22.0% 16.3%
Percent of Pacific Islanders Adults with Bachelor’s Degree or More 10.5% 9.2% 5.3%
Income and Poverty Status
Median Household Income of Pacific Islanders in 1999 $53,487 $38,015 $38,438
Percent of PI Families with Children Under 18 Years of Age Below Poverty 8.7% 12.0% 32.1%
Household Characteristics
Average Family Size Among Pacific Islanders 5.78 4.11 4.74
Percent of Pacific Islander Households with Children Under 18 Years of Age 48.5% 38.4% 43.4%
Percent of Pacific Islander Households with 6 or More Persons 47.0% 16.9% 31.6%
Average Household Size Among Pacific Islanders 6.07 3.71 4.51
Note: The data on Pacific Islanders excludes Asian Americans.
Sources: U.S. Bureau of Census, Summary File 1, 2000—100-Percent Data; Summary File 3—Sample Data, 2000
Pacific Islander students with colonization histories and Southeast Asian Americans with refugee histories have very different experiences and needs than other Asian American groups who have arrived in large numbers under employ-ment preferences. There are large concentrations of AAPI students that are often lost in the educational system or treated as delinquents. Yet at the same time, policies based on the fiction of the “model minority” offer few, if any, programs or other resources for those students in need of special assistance. Studies show that the inability of families to understand how to advocate for their children in the courts and school systems has led Asian American and Pacific Islander boys and girls who enter the juvenile justice system to have higher incarceration rates as juveniles than any other group, often with placement in adult facilities.18 By disaggregating the data on Asian American and Pacific Islander students, the range of educational and other characteristics becomes readily apparent, suggesting a similarly wide range in needs.
26 • on the horizon
Selective College Admissions and Affirmative Action. Asian Americans and Pacific Islanders have historically been excluded from discourse on affirmative action, equal opportunity, and college admissions. In recent years, how-ever, especially following the rise in anti-affirmative action legal pursuits such as the U.S. Supreme Court cases on affirmative action, we find an increase in rhetoric inclusive of Asian Americans and Pacific Islanders. For example, a recent study by scholars at an elite private university argues that AAPIs are the “biggest winners” without affirmative action. Specifically, they claim that without affirmative action at this university, AAPIs “would occupy four out of every five seats created by accepting fewer African Ameri-can and Hispanic students.”19 Conversely, others have argued that practicing affirmative action doesn’t just hurt White students, it hurts Asians the most. Ward Connerly, architect of the California Civil Rights Initiative, asserted that increasing Black enrollment at highly selective public institutions in the UC system would require “kicking out” Asian students.20
With the decline of Black and Latino students through-out selective colleges that do not use race as criteria for admissions decisions, AAPIs have also assumed the identity of conspicuous adversaries of diversity in higher education by creating homogenous Asian-majority schools. Thus, Asian Americans and Pacific
Islanders have now been positioned as buffers, middle-men in the cost-benefit analysis of wins and losses in an affirmative action debate. Legal scholars Frank Wu and William Kidder explain that AAPIs have become “racial mascots” to camouflage an agenda that, if pre-sented by Whites on their own behalf, would look too much like self-interest.21 Political analyst Claire Kim calls this “racial triangulation,” which in the case of AAPIs, shifts public debate from the real issue at hand to the false issue of whether affirmative action pro-grams designed to benefit Blacks and Latinos unfairly discriminate against AAPIs, as opposed to Whites.22 The idea that there are winners and losers in selective admissions is often oversimplified by popular media. For example, following the end of affirmative action in California, the media brought a lot of attention to the low representation of Blacks in the University of Cali-fornia system. Among the different perspectives of what has occurred in the past 10 years is the idea that AAPIs are enjoying access to the UC system at the expense of low Black enrollment.
Asian Americans and Pacific Islanders have
now been positioned as buffers, middlemen
in the cost-benefit analysis of wins and
losses in an affirmative action debate.
In addition to the aforementioned “Facts” that discuss
significant issues affecting AAPI participation in higher
education, there are also other important emerging issues
in the field that are noteworthy. In essence, these issues
are hidden indicators—issues that often lack sufficient data to warrant attention or resources—
that have considerable implications for policy, practice, and future research. We include a brief
discussion of these issues both to highlight preliminary evidence in the research community as
well as anecdotes surfacing among educators and administrators on college campuses to
encourage further conversations within the research, policy, and education communities.
On the Horizon: Emerging AAPI Issues in U.S. Education
on the horizon • 27
Others have gone further and suggested that Whites lose to AAPIs in the admissions game without the use of affirmative action. An article in the Seattle Times said, “The fact that the gains Asians have enjoyed seems to have come at the expense of Whites casts doubt on the theory that affirmative action hurts White applicants. It also suggests something that sounds counterintuitive—that, under affirmative action, when the competition was between Whites and Asians, it was the Asians who lost out and the Whites who ben-efited.”23 The assertion that AAPIs are “outwhiting the Whites” is not new. This was precisely the focus of a Newsweek article published in 1971.24 Legal scholar Jerry Kang, among others, argues that AAPIs are not enjoying the same advantages in selective admissions as Whites. In fact, he posits that AAPIs face “negative action,” which is the systematic process treating Asian Americans and Pacific Islanders differently in the admissions process than other applicants with similar qualifications.25 Specifically, Asian Americans and Pacific Islanders are held to a higher standard than Whites; the intended outcome of negative action being restrictive access of Asian Americans and Pacific Islanders and maximized access for Whites.
Kidder has tested negative action in the context of admissions decisions at five public law schools where racial preferences were banned.26 He found that with-out affirmative action, the share of Asian American and Pacific Islander enrollments dropped at two of the law schools and increased only marginally at three of the schools despite the popular belief that Asian Amer-icans and Pacific Islanders would significantly benefit from the end of affirmative action. These enrollment patterns were particularly surprising considering that during the time period studied, the percentage of Asian Americans and Pacific Islanders applying to law school increased 50 percent, so the pool, presumably, should have created the opportunity for major increases.27
In reality, there are no winners in a postsecondary system that is experiencing a rapid decline in the number of African American and Latinos since the end of affir-mative action in a number of states. Claiming Asian American and Pacific Islander students have no prob-lems, they are models for others to emulate, and they are “overrepresented,” works in the favor of educational and political elites who make decisions. Legal scholar Der-rick Bell calls this claim “interest convergence.”28 Focus-ing on AAPI students and their reputed success are excuses not to deal with the failure of our education system and the complex and interwoven nature of how race and racism operates in the United States.
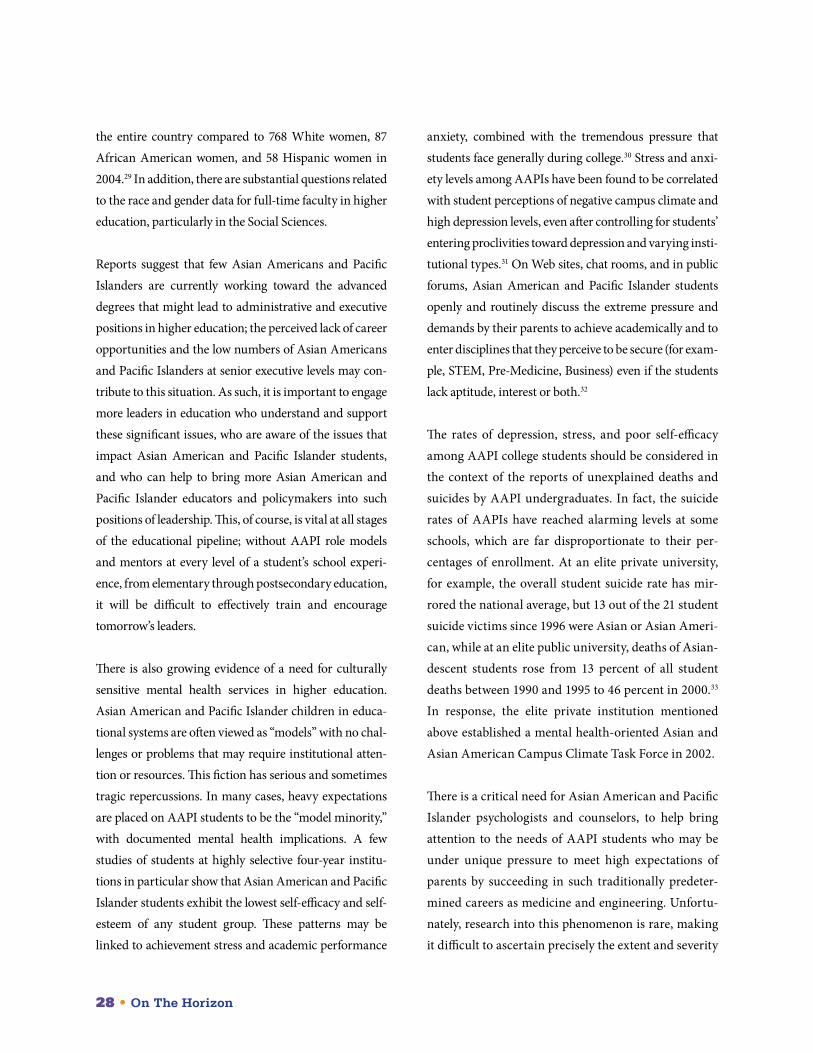
Cultural Competency and Mentorship. It is quite ironic that there can be so much focus on the high representa-tion of AAPI college students in higher education, with-out questioning AAPI presence in other parts of the aca-demic community. Specifically, there is a lack of attention to the issues related to Asian American and Pacific Islander faculty, staff, and administrators. A critical mass of AAPI faculty and institutional leaders is essential to advocate and provide leadership for and about AAPI stu-dents. Unfortunately, they are too few in number and not at the decision-making tables of most institutions. Sur-veys of all two- and four-year institutions reveal that the numbers of AAPI college presidents are at an extremely low level. AAPIs make up less than one percent of the col-lege presidency in the United States, with only 33 in the nation. Moreover, Asian American and Pacific Islander women are the most underrepresented group in the ranks of college presidents with only 13 women presidents in
A critical mass of AAPI faculty and
institutional leaders is essential to advocate
and provide leadership for and about AAPI
students. Unfortunately, they are too few
in number and not at the decision-making
tables of most institutions.
28 • on the horizon
the entire country compared to 768 White women, 87 African American women, and 58 Hispanic women in 2004.29 In addition, there are substantial questions related to the race and gender data for full-time faculty in higher education, particularly in the Social Sciences.
Reports suggest that few Asian Americans and Pacific Islanders are currently working toward the advanced degrees that might lead to administrative and executive positions in higher education; the perceived lack of career opportunities and the low numbers of Asian Americans and Pacific Islanders at senior executive levels may con-tribute to this situation. As such, it is important to engage more leaders in education who understand and support these significant issues, who are aware of the issues that impact Asian American and Pacific Islander students, and who can help to bring more Asian American and Pacific Islander educators and policymakers into such positions of leadership. This, of course, is vital at all stages of the educational pipeline; without AAPI role models and mentors at every level of a student’s school experi-ence, from elementary through postsecondary education, it will be difficult to effectively train and encourage tomorrow’s leaders.
There is also growing evidence of a need for culturally sensitive mental health services in higher education. Asian American and Pacific Islander children in educa-tional systems are often viewed as “models” with no chal-lenges or problems that may require institutional atten-tion or resources. This fiction has serious and sometimes tragic repercussions. In many cases, heavy expectations are placed on AAPI students to be the “model minority,” with documented mental health implications. A few studies of students at highly selective four-year institu-tions in particular show that Asian American and Pacific Islander students exhibit the lowest self-efficacy and self-esteem of any student group. These patterns may be linked to achievement stress and academic performance
anxiety, combined with the tremendous pressure that students face generally during college.30 Stress and anxi-ety levels among AAPIs have been found to be correlated with student perceptions of negative campus climate and high depression levels, even after controlling for students’ entering proclivities toward depression and varying insti-tutional types.31 On Web sites, chat rooms, and in public forums, Asian American and Pacific Islander students openly and routinely discuss the extreme pressure and demands by their parents to achieve academically and to enter disciplines that they perceive to be secure (for exam-ple, STEM, Pre-Medicine, Business) even if the students lack aptitude, interest or both.32
The rates of depression, stress, and poor self-efficacy among AAPI college students should be considered in the context of the reports of unexplained deaths and suicides by AAPI undergraduates. In fact, the suicide rates of AAPIs have reached alarming levels at some schools, which are far disproportionate to their per-centages of enrollment. At an elite private university, for example, the overall student suicide rate has mir-rored the national average, but 13 out of the 21 student suicide victims since 1996 were Asian or Asian Ameri-can, while at an elite public university, deaths of Asian-descent students rose from 13 percent of all student deaths between 1990 and 1995 to 46 percent in 2000.33 In response, the elite private institution mentioned above established a mental health-oriented Asian and Asian American Campus Climate Task Force in 2002.
There is a critical need for Asian American and Pacific Islander psychologists and counselors, to help bring attention to the needs of AAPI students who may be under unique pressure to meet high expectations of parents by succeeding in such traditionally predeter-mined careers as medicine and engineering. Unfortu-nately, research into this phenomenon is rare, making it difficult to ascertain precisely the extent and severity
on the horizon • 29
of this issue. As Eliza Noh observed, “There are really no actual research studies. No control, no observation, no research design. [Yet] across the board you see people feeling pressured and are consciously aware of the model minority myth which pushes them.”34
The World Is Shrinking. With national debates on immigration policies at an all-time high, there is a real need to reduce misunderstandings and tensions related to changing demographics in our educational system. Immigrants bring a wealth of linguistic, cultural, and historical abilities and insights. We must create learning communities that utilize these assets and foster cross-cultural communication, cultural literacy, and exchanges. Doing so will enrich all and can move us toward reducing divisions in our schools and our society.
The transformation of societies as a result of globaliza-tion and worldwide population changes calls for a con-current transformation of U.S. education. “How well this country will fare in the new urban and new global reality will no longer depend on American political influence, military might, or capacity to expand eco-nomic productivity” observes Professor Luis Martínez-Fernández, Director of Latin American, Caribbean, and Latino studies at the University of Central Florida. “Instead, leaders of American institutions and business organizations will need to acquire, develop, and master international cultural fluency.” Technical and profes-sional expertise of another language is not enough. The finance-oriented Committee for Economic Develop-ment has issued Education For Global Leadership, a study on “The Importance of International Studies and Foreign Language Education for U.S. Economic and National Security” clearly stating, “the educated Ameri-can of the twenty-first century will need to be conver-sant with at least one language in addition to his or her native language, and knowledgeable about other coun-
tries, other cultures, and the international dimensions of issues critical to the lives of all Americans.”35
Schools, colleges, and universities with a serious eye toward preparing our students for the globalized soci-ety of the future must understand the need to dramati-cally upgrade and refashion their curricula, faculty structures, and resources to include a diversified com-munity that can transfer on knowledge about the people, cultures, and histories of the Asia/Pacific, Afri-can, and Latin American regions, in addition to those of European origin. By breaking through the fictions that cloud our educational policies and visions, we can look forward together to the kind of educational sys-tems and educated society that we as Americans are capable of achieving.
30 • conclusion
A Renewed Public Vision
Unless educators and advocates dispel and replace the myths about Asian American and Pacific Islander stu-dents or other groups, both higher education and soci-ety as a whole will miss fully developing and engaging these students, who have much to contribute to our schools and our communities. In this report, we have examined both data and stories that encourage us to develop a renewed public vision for implementing poli-cies and practices based on facts about Asian American and Pacific Islander students.
First, we need to dispel the fictions and myths that Asian American and Pacific Islander students are:
• taking over institutions of higher education, espe-cially in Science, Technology, Engineering, and Math (STEM);
• concentrated in elite higher education and are outperforming all other groups;
• all high-achieving “model minorities”; and
• a homogenous mass that can be dealt with as a whole.
We then need to replace those fictions with the facts about Asian American and Pacific Islander students in higher education:
• Asian American and Pacific Islander students pursue a broad range of academic fields of study.
• the growth in college attendance by Asian American and Pacific Islander students parallels that of African American and Hispanic students; however, there are a small number of states and institutions with high concentrations of Asian American and Pacific Islander students.
• Asian American and Pacific Islander students enroll most heavily in their local public two-year and four-year institutions.
• Asian Americans and Pacific Islanders constitute a group characterized by a variety of ethnicities and cultural backgrounds.
Were these facts driving our educational practices, we would have:
• data collection and reporting mechanisms that tell us more about who comes to our campuses, includ-ing ethnicity, generational status, language spoken at home, and other diagnostic evidence;
• systems and mechanisms to improve the tracking and delivery of programs and services for AAPI students, such as academic advisement, mental health services, career placement, and to monitor outcomes informed by disaggregated data;
• faculty, administration, and academic support staff who are educated and skilled in teaching and supporting the specific cultural and ethnic back-grounds of their Asian American and Pacific Islander students; and
• a proportional representation of AAPI educational leaders, administrators, and faculty to serve as role models for Asian American and Pacific Islander students and to serve as subject matter experts for policy development.
These significant changes will not occur without pur-poseful action by educators and educational advocates. These are key elements that we offer to bring about the types of changes needed to better align educational policy and practice with today’s reality.
Conclusion and Recommendations
conclusion • 31
From Vision to Action
Actionable Research Is Key. Through relatively straightforward research, we can move beyond mis-leading and potentially harmful assumptions that have dominated American thought about Asian American and Pacific Islander participation in education. We must develop methods to critically and effectively study what is truly happening to our young people—both in formalized education and informally in the culture at large—rejecting what is fiction and embracing what is fact. This suggests a combination of both quantitative and qualitative evaluation research, which includes:
• collecting data in a way that allows for further deconstruction of the variation within the AAPI racial category (by ethnicity, nationality, etc.);
• changing data reporting and analysis approaches by disaggregating data by ethnicity and other impor-tant background factors; incorporating focus groups and other qualitative methods to develop our knowl-edge about ethnic differences within AAPI commu-nities; and
• changing from a narrow set of evaluative indicators (test scores, high school grades, etc.) to a broader set that includes such indicators as first language and immigrant generational status in predicting educa-tional outcome, not only for use in admissions prac-tices, but for student services, outreach, and devel-oping new institutional initiatives.
Acting Collectively Is Key. In order to address the realities of Asian Americans and Pacific Islanders—as well as other minority student groups—we need to build an inclusive coalition of educators, policymakers, philanthropists, advocates, and community leaders who will challenge institutional barriers and system-atic misrepresentation of Asian Americans and Pacific Islanders and other peoples, by:
• hiring Asian American and Pacific Islander staff, consultants, community leaders, and scholarly researchers to identify and guide work in education at every level, on behalf of all groups, including Asian Americans and Pacific Islanders;
• seeking out Asian American and Pacific Islander community leaders to enhance the cultural capacity of our institutions and improve student outcomes; and
• building relationships between federal, state and local institutions, community-based organizations, and affected communities.
Indeed, there is evidence to suggest that AAPI college stu-dents are becoming more aware of the importance of holding leadership positions. Using data from “the nation’s largest and oldest study of college students,” the 2007 UCLA report Beyond Myths: The Growth and Diver-sity of Asian American College Freshmen, 1971–2005, notes that the “percentage of Asian American freshmen reporting that becoming a community leader is ‘very important’ or ‘essential’” has more than doubled from 13 percent in 1971 to 32.3 percent in 2005.36
The results of effective collaborations will impact both K–12 and higher education in positive ways.
K–12 EDuCaTIOn
◆ School counselors will be aware of cultural back-grounds of the Asian American and Pacific Islander students for whom they are responsible, resulting in targeted support for at-risk students as well as mean-ingful involvement and participation by parents with little or no formal U.S. education.
◆ More school level teachers will be trained to educate English Language Learners, thus raising the quality of schools across the spectrum, and the potential for student success in college.
32 • conclusion
◆ Asian American and Pacific Islander students will be encouraged to pursue careers as educators and administrators at the K–12 level to increase the number of mentors and role models for AAPI youth.
◆ More schools will be able to provide curricula that reflects Asian American and Pacific Islander histo-ries, art, literature, and culture, which will benefit all students by increasing their ability to participate at the college level, where multicultural competence is expected.
HIgHEr EDuCaTIOn
• Colleges with better information about the chal-lenges faced by AAPI students will be able to attract this group of students through better information dissemination and more effective outreach.
• Colleges can more equitably support low-income Asian American and Pacific Islander students who have real financial need that may have been over-looked under old models.
• Retention of Asian American and Pacific Islander students will improve because increased role models—faculty, staff, and administrators—will be present to interact and develop relationships with them.
• Asian American and Pacific Islander student self-esteem and self-efficacy will improve over time because colleges will better understand and meet the needs of these, including effective communications with parents with little or no formal U.S. education.
• The participation of Asian Americans and Pacific Islanders in civic roles will increase because more role models will be visible in positions of leadership on campus.
additional resources
This report is just one aspect of the National Commission on Asian American and Pacific Islander Research in Education. We encourage educators, advocates, and scholars to go to the project Web site located at: http://www.nyu.edu/projects/care/ for additional resources, including an extensive annotated bibliography, a list of activities by the commission related to the project, and other papers that examine key issues and trends related to AAPIs in education.
endnotes • 33
Endnotes
1 Du Bois, W. E. B. (2003). The Souls of Black Folk. New York: Barnes & Noble Classics. (Original work published 1903), p. 46.
2 Prashad, V. (2000). The Karma of Brown Folk. Min-neapolis: University of Minnesota Press.
3 Zia, H. (2001). Asian American Dreams: The Emergence of an American People. New York: Farrar, Straus and Giroux.
4 Success Story of One Minority Group in the U.S. (1996, December 1966). U.S. News & World Report.
5 Kristof, N.D. (2006, May 14). The Model Students. The New York Times.
6 Olsen, L. (1997). An Invisible Crisis: The Educa-tional Needs of Asian Pacific American Youth. New York: Asian Americans/Pacific Islanders in Philanthropy.
7 Kim, H. (1997). Diversity Among Asian American High School Students. Princeton, NJ: Educational Testing Service.
8 Um, K. (2003). A Dream Denied: Educational Experiences of Southeast Asian American Youth: Issues and Recommendations. Washington, D.C.: Southeast Asia Resource Action Center.
9 Kanaiaupuni, S. M., & Ishibashi, K. (2003). Left Behind: The Status of Hawai’ian Students in Hawai’i Public Schools. Honolulu, HI: Kamehameha Schools.
10 Ling, M. (1998, December). Facing the Asian Invasion. California Monthly.
11 Egan, T. (2007, January 7). Little Asia on the Hill. The New York Times.
12 Thurgood, L., Golloday, M., & Hill, S. (2006). U.S. Doctorates in the 20th Century. Washington, D.C.: National Science Foundation.
13 U.S. Government Accountability Office. (2007). Information Sharing Could Help Institutions Identify and Address Challenges that Some Asian Americans and Pacific Islander Students Face. (GAO-07-925). Washington, DC.
14 Omi, M., & Winant, H. (1994). Racial formation in the United States: From the 1960s to the 1990s. New York: Routledge.
15 Olsen, Ibid.
16 Lee, S. J., & Kumashiro, K.K. (2005). A Report on the Status of Asian Americans and Pacific Islanders in Education: Beyond the “Model Minority” Stereo-type. Washington, DC: National Education Asso-ciation of the United States.
17 Chang, M.J., Park, J.J., Lin, M.H., Poon, O.A., & Nakanishi, D.T. (2007). Beyond Myths: The Growth and Diversity of Asian American College Freshmen, 1971-2005, p. 11.
18 The Services and Advocacy for Asian Youth (SAAY) Consortium. (2004). Moving Beyond Exclusion: Focusing on the Needs of Asian/Pacific Islander Youth in San Francisco. San Francisco.
19 Espenshade, T., & Chung, C.Y. (2005). The Oppor-tunity Cost of Admission Preferences at Elite Universities. Social Science Quarterly 86(2), 293-305.
20 Connerly, Ward. (2006, November 3). Ward Connerly: We’re Saying Race Should Not Be Used. The Oakland Tribune.
21 Wu, F.H., & Kidder, W. (2006, October 5). Asian Americans Aren’t White Folks’ “Racial Mascots.” Diverse Online. Retrieved from: www.diverseonline.com.
22 Kim, C. (1999). The Racial Triangulation of Asian Americans. Politics and Society 27(1), 105-40.
34 • endnotes
23 Naverrette, R.J. (2007, January 1). Ward Connerly: Standing on Principles, Not a Mission. The Seattle Times.
24 Outwhiting the Whites. (1971, June 21). Newsweek.
25 Kang, J. (1996). Negative Action Against Asian Americans: The Internal Instability of Dworkin’s Defense of Affirmative Action. Harvard Civil Rights-Civil Liberties Law Review (CR-CL) 31, 1-47.
26 Kidder, W.C. (2006). Negative Action Versus Affirmative Action: Asian Pacific Americans Are Still Caught in the Crossfire. Michigan Journal of Race and Law 605(11), 605-24.
27 Kidder, W.C. (2000). Situating Asian Pacific Americans in the Law School Affirmative Action Debate: Empirical Facts About Thernstrom’s Rhetorical Acts. Asian Law Journal 7, 29-68
28 Bell, D.A. (1980). Brown v. Board of Education and the Interest-Convergence Dilemma. Harvard Law Review, 93(3), 518-33.
29 Harvey, W.B., & Anderson, E.L. (2005). Minorities in Higher Education: Twenty-First Annual Status Report: 2003-2004. Washington, DC: American Council on Education.
30 Gloria, A. M., & Ho, T.A. (2003). Environmental, Social, and Psychological Experiences of Asian American Undergraduates: Examining Issues of Academic Persistence. Journal of Counseling and Development 81(1), 93-105.
31 Cress, C. M., & E.K. Ikeda. (2003). Distress Under Duress: The Relationship Between Campus Climate and Depression in Asian American College Students. NASPA Journal 40(2), 74-97.
32 Ibid.
33 Ramanujan, K. (2006, April 19). Health Expert Explains Asian and Asian American Students’ Unique Pressures to Succeed. Cornell Chronicle Online.
34 Noh, E.S. (2002). Suicide Among Asian American Women: Influences of Racism and Sexism on Suicide Subjectification. (Doctoral Dissertation, University of California: Berkeley, 2002).
35 Research and Policy Committee of the Committee for Economic Development. (2006). Education for Global Leadership: The Importance of International Studies and Foreign Language Education for U.S. Economic and National Security. Washington, DC: Committee for Economic Development, p. 2.
36 Chang, et al., Ibid.
appendix • 35
In order to examine U.S. demographic trends among the AAPI population, we examined data from the U.S. Bureau of Census 100 percent file. We mainly relied on the use of two particular data sets: Summary File 1 and Summary File 3 from 1990 and 2000. These data were used to examine demographic trends among AAPIs nationally, across states, and within local communi-ties. Summary File 1 contains information collected from all people and housing units for the United States, including the 50 states and the District of Columbia, and contains information on detailed race, ethnicity, and Hispanic categories. Summary File 3 was used to capture more in-depth population and housing infor-mation on a sample basis from the Census long form, including selected characteristics on populations that vary by race, ethnicity, and Hispanic origin.
To examine trends in higher education participation and completion, we utilized data from the U.S. Depart-ment of Education, National Center for Education Sta-tistics (NCES) Integrated Postsecondary Education Data System (IPEDS). Analyses of these data were con-ducted across different higher education sectors that varied by type (two-year versus four-year), control (public versus private), and locale (national, regional, and state). Trend analyses focused on year-over-year changes between 1980 and 2000. In some cases, data were available for up to 2003, which was the latest year available that was clean and reliable during the time of the data analyses according to the data sources. For all postsecondary data, we limited the analyses to postsec-
ondary institutions with Title IV status, which resulted in a total institutional sample of approximately 4,200 postsecondary institutions.
Two additional secondary data sources were utilized to a lesser extent. First, we examined data from the Amer-ican Council on Education (ACE), Corporate Data System for 2003, which contained descriptive informa-tion on postsecondary faculty and administrators by race, gender, and institutional type. Second, we exam-ined descriptive data from College-Bound Seniors: A Profile of SAT Program Test-Takers, which contained information about students that participated in the SAT Program in 2003.
The data analyses in this study relied on full-population
data from secondary data sources. Data for this study
were drawn from four sources to identify trends in
student participation, institutional enrollment, degree attainment, and to examine demographic