ASIAN CITY CLIMATE CHANGE RESILIENCE NETWORK: INDIA CHAPTER PHASE 2: CITY VULNERABILITY ANALYSIS REPORT INDORE & SURAT Submitted to Rockefeller Foundation TARU Leading Edge Gurgaon & Gandhinagar April 2010
Transcript
ASIAN CITY CLIMATE CHANGE RESILIENCE NETWORK: INDIA CHAPTER
PHASE 2: CITY VULNERABILITY ANALYSIS REPORT
INDORE & SURAT
Submitted to
Rockefeller Foundation
TARU Leading Edge Gurgaon & Gandhinagar
April 2010
ACCCRN – City Vulnerability Assessment Report I
CONTENTS 1 Background about ACCCRN (Phase II) – Indore and Surat........................................ 1 2 Indian urban context .................................................................................................. 2
2.1 Urban growth .................................................................................................... 2 2.2 Resource Context - Urban Metabolism & dependence on external resources ..... 3 2.3 Constraints on water supplies and natural resources .......................................... 3 2.4 Urban Infrastructure upgradation, finance autonomy issues ............................... 5 2.5 Administration and 3 Fs, Autonomy (74th amendment) etc. Actual situation..... 5 2.6 Urban Poverty ................................................................................................... 7 2.7 Climate change risks – Indian urban context ..................................................... 8 2.8 Upgrading slums and squatter settlements ....................................................... 10 2.9 Current plans and visions in Urban development ............................................. 12 2.10 JNNURM progress in Surat & Indore:.......................................................... 13 2.11 Major issues of CC risks in urban environment ............................................ 13
3 Vulnerability assessment.......................................................................................... 17 3.1 Objectives ....................................................................................................... 17 3.2 Components of vulnerability in urban context ................................................. 17 3.3 Methodology and tools.................................................................................... 18 3.4 Sample Coverage ............................................................................................ 19
4 INDORE – City Profile ............................................................................................ 25 4.1 Introduction .................................................................................................... 25 4.2 Location and Access ....................................................................................... 25 4.3 Geographical features ..................................................................................... 25 4.4 Demography ................................................................................................... 26 4.5 Economy ........................................................................................................ 27 4.6 City Governance and Institutional mechanism................................................. 28 4.7 Community-Resource-Government-Market linkages....................................... 32 4.8 Climate change Scenarios for Indore ............................................................... 34 4.9 Capacity and Vulnerability assessment............................................................ 44 4.9.1 Education capacity index.............................................................................. 46 4.9.2 Income Stability Index ................................................................................. 47 4.9.3 Social Capacity Index .................................................................................. 49 4.9.4 Drainage and Sewerage vulnerability index .................................................. 50 4.9.5 Water scarcity index..................................................................................... 53 4.10 Industry Profile Indore ................................................................................. 60 4.11 CRGM model .............................................................................................. 64 4.12 Conclusions ................................................................................................. 67 4.13 Adaptation requirements .............................................................................. 67
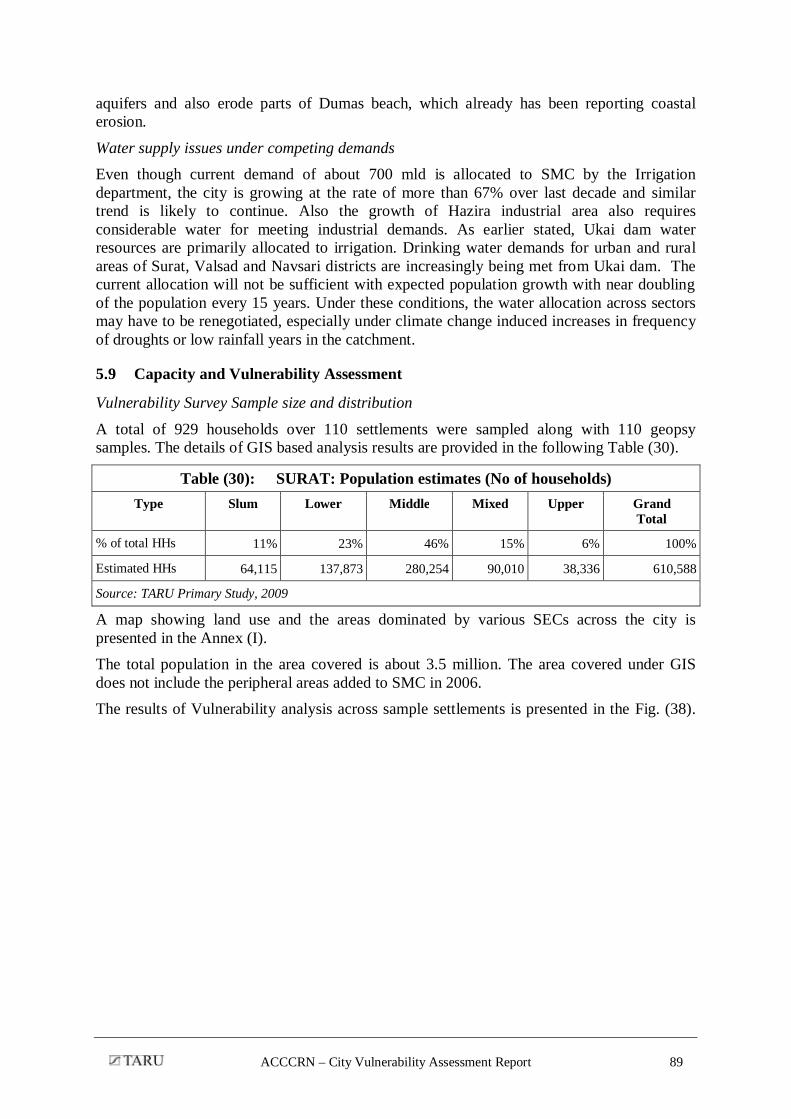
5 Surat – City Profile .................................................................................................. 69 5.1 Introduction .................................................................................................... 69 5.2 Location and Access ....................................................................................... 69 5.3 Demography, City Growth and trends, Economic base .................................... 70 5.4 Economic Base of Surat .................................................................................. 71 5.5 Administration, Governance Urban Management, Stakeholders ...................... 74 5.6 Community-Resource-Government-Market linkages....................................... 77 5.7 Hydro meteorological Risks ............................................................................ 78 5.8 Climate change Scenario for Surat .................................................................. 80 5.9 Capacity and Vulnerability Assessment .......................................................... 89
ACCCRN – City Vulnerability Assessment Report II
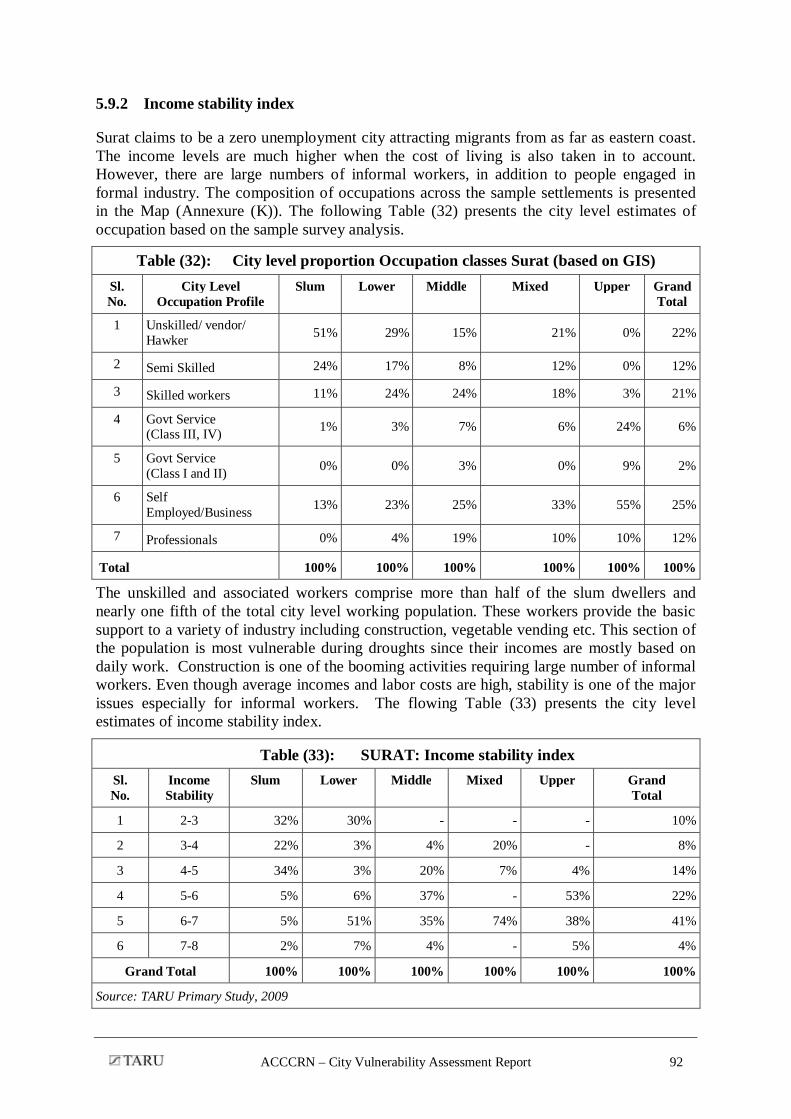
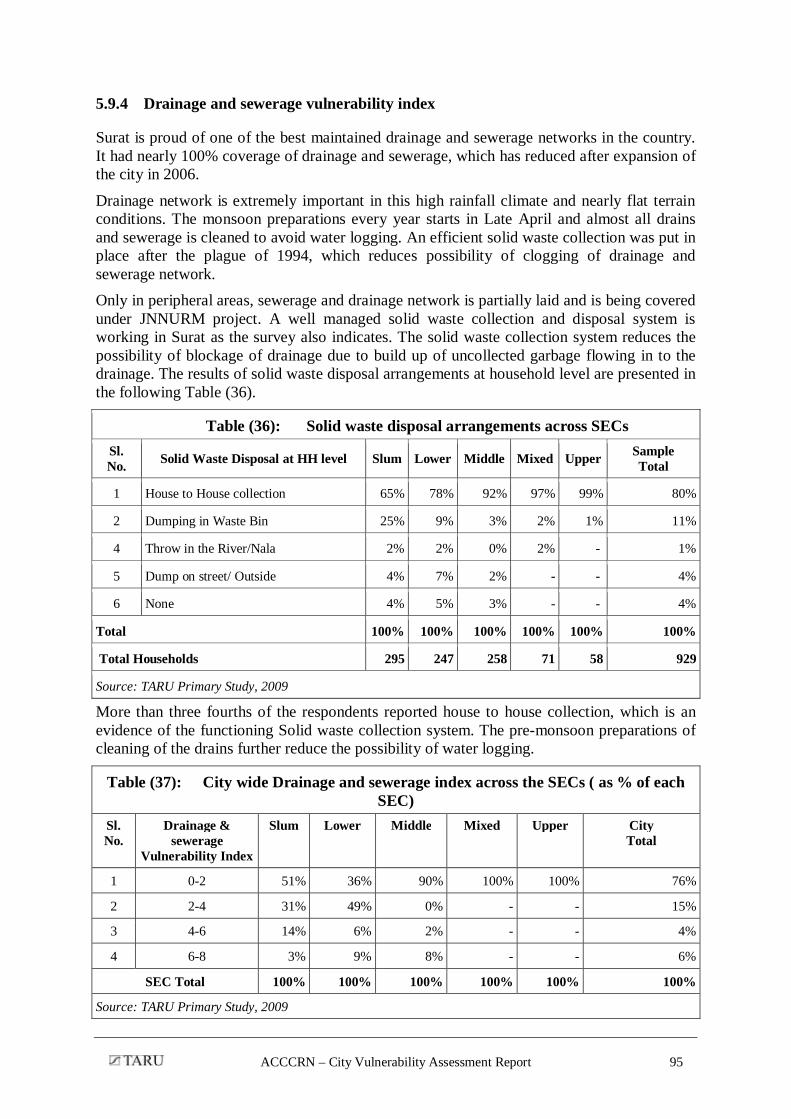
5.9.1 Education capacity index.............................................................................. 91 5.9.2 Income stability index .................................................................................. 92 5.9.3 Social capacity Index ................................................................................... 93 5.9.4 Drainage and sewerage vulnerability index .................................................. 95 5.9.5 Loan and insurance vulnerability index ........................................................ 97 5.9.6 Flood vulnerability index ............................................................................. 98 5.9.7 Hydrometeorological risk exposure .............................................................. 99 5.10 Advanced Warning Mechanisms and Coping Mechanisms ......................... 100 5.11 Industrial profile ........................................................................................ 103 5.12 CRGM model ............................................................................................ 109 5.13 Conclusions ............................................................................................... 112 5.14 Adaptation options ..................................................................................... 113
Box (1): Management Innovations for Municipal Resource Mobilization in Indore…….6 Box (2): Basic Services to the Urban Poor - Objectives and components……………....10 Box (3): Integrated Housing & Slum Development Programme - Objectives and coverage ………………………………………………………………………………….12 Box (4): Evolution of vulnerability assessment methods ………………………………..20 Box (5): Increasing Municipal Revenues: Case of Indore……………………………….31 Box (6): Story of the Ukai Dam…………………………………………………………80
LIST OF FIGURES
Fig. (1) : People and Environments: Zone of Intervention ................................................ 9 Fig. (2) : GIS based VulnErability anlaysis FRAMEwork .............................................. 19 Fig. (3) : The organization structure Wing of IMC ......................................................... 29 Fig. (4) : Linkages showing relationship between Resources, Market, Community and
Government .................................................................................................... 33 Fig. (5) : Indore-Total monthly precipitation anomaly (Futurea – Control)..................... 35 Fig. (6) : Indore-Total monthly precipitation anomaly (Futurea – Control)..................... 36 Fig. (7) : Indore-Monthly rainy days anomaly (Futurea –Control) .................................. 36 Fig. (8) : Indore: Monthly mean dry spell duration anomaly (Futurea –Control) ............ 36 Fig. (9) : Indore-Average minimum temperature anomaly (Futurea -Control) ................ 37 Fig. (10) : Indore-Average maximum temperature anomaly (Futurea -Control)................ 37 Fig. (11) : Average daily rainfall ..................................................................................... 38 Fig. (12) : Average daily rainfall anomaly ....................................................................... 39 Fig. (13) : Average daily minimum temperature .............................................................. 39 Fig. (14) : Average daily maximum temperature .............................................................. 40 Fig. (15) : Anomaly in average daily maximum temperature............................................ 40 Fig. (16) : INDORE: Water Logging 2009 ....................................................................... 41 Fig. (17) : INDORE: Capacity & VulnErability Index across Sample Settlements ........... 45 Fig. (18) : Sewerage System and STP .............................................................................. 52 Fig. (19) : Slum ............................................................................................................... 56
ACCCRN – City Vulnerability Assessment Report III
Fig. (20) : Lower class ..................................................................................................... 56 Fig. (21) : Middle class .................................................................................................... 57 Fig. (22) : Upper class ..................................................................................................... 57 Fig. (23) : Linkages showing relationship between Resources, Market, Community and
Government .................................................................................................... 66 Fig. (24) : Population and Decadal growth of Surat ......................................................... 70 Fig. (25) : Illustrating the average minimum temperature values that were used as the
inputs for the prediction (Control - January 1, 1961 to December 31, 2000) .... 81 Fig. (26) : Illustrating the average maximum temperature values that were used as the
inputs for the prediction (Control - January 1, 1961 to December 31, 2000) .... 81 Fig. (27) : Illustrating the total monthly precipitation of the input data used by the various
models (Control - January 1, 1961 to December 31, 2000) .............................. 82 Fig. (28) : Illustrating the total monthly precipitation anomaly (Futurea - January 1, 2046 to
December 31, 2065 with respect to Control - January 1, 1961 to December 31, 2000) .............................................................................................................. 83
Fig. (29) : Average minimum temperature anomaly (Futurea - January 1, 2046 to December 31, 2065 with respect to Control - January 1, 1961 to December 31, 2000) .............................................................................................................. 83
Fig. (30) : Average maximum temperature anomaly (Futurea -Control) ........................... 83 Fig. (31) : Surat- Monthly rainy day’s anomaly (Futurea –Control) ................................. 84 Fig. (32) : Surat-Monthly mean dry spell duration anomaly (Futurea -Control) ................ 84 Fig. (33) : Surat - Average minimum temperature anomaly (Futurea -Control) ................ 85 Fig. (34) : Surat-Average maximum temperature anomaly (Futurea -Control) ................. 86 Fig. (35) : CCCMA: Precipation Ranges.......................................................................... 86 Fig. (36) : CCCMA: Precipation ...................................................................................... 87 Fig. (37) : CCCMA: Maximum average temperature events across months(Yaxis) .......... 88 Fig. (38) : SURAT: Capacity & Vulnerability Index across Sample Settlements .............. 90 Fig. (39) : Slum ............................................................................................................... 96 Fig. (40) : Lower class ..................................................................................................... 96 Fig. (41) : Middle class .................................................................................................... 97 Fig. (42) : Upper Class .................................................................................................... 97 Fig. (43) : Linkages showing relationship between Resources, Market, Community and
Government .................................................................................................. 110
LIST OF TABLES Table (1): Set of Indicators .............................................................................................. 17 Table (2): Data sets used for deriving capacity and vulnerability indicators ..................... 17 Table (3): Population Trends ........................................................................................... 26 Table (4): Indore: Reported diseases during last one year across Sample settlements ....... 43 Table (5): Total number of households across different SECs in Indore (based on GIS)... 44 Table (6): Education Status Indore from Sample Survey ................................................. 46 Table (7): Estimates of Education Index across Socio Economic Classes in Indore.......... 46 Table (8): Occupational Profile of Indore ........................................................................ 47 Table (9): Indore occupational profile ............................................................................. 47 Table (10): Estimates of Income stability index range across Socio economic classes in
Indore city ...................................................................................................... 48 Table (11): Indore: Estimated population by state of Origin (GIS assisted analysis) .......... 49 Table (12): Estimates Social Capacity Index range across Socio economic classes in Indore
city ................................................................................................................. 50
ACCCRN – City Vulnerability Assessment Report IV
Table (13): Estimates of Drainage and sewerage services vulnerability index range across Socio economic classes in Indore city ............................................................. 51
Table (14): Solid waste collection arrangements across SECs............................................ 53 Table (15): Distribution of household level water storage capacity among the sample
households (1250 HHS) .................................................................................. 54 Table (16): Estimates of water scarcity vulnerability index range across Socio economic
classes in Indore city ....................................................................................... 55 Table (17): Estimates of Insurance and loan vulnerability index range across Socio
economic classes in Indore city ....................................................................... 58 Table (18): Flood Vulnerability Index ............................................................................... 59 Table (19): Estimates of Flood vulnerability index range across Socio economic classes
from the sample survey (75 settlements) ......................................................... 60 Table (20): Industrial Profile of Indore (2008) ................................................................... 60 Table (21): Class wise industries surveyed in Indore ......................................................... 62 Table (22): Water Supply Source for sample Industries ..................................................... 62 Table (23): Education institutions profile of Indore ........................................................... 63 Table (24): No. health institutions in Indore ...................................................................... 64 Table (25): No. hotels and restaurants in Indore ................................................................ 64 Table (26): Surat City Profile ............................................................................................ 69 Table (27): Surat Municipal Growth Statistics (Area and Population) ................................ 70 Table (28): Land use in SUDA Planning area over years ................................................... 73 Table (29): Reported Surat Floods ..................................................................................... 79 Table (30): SURAT: Population estimates (No of households) .......................................... 89 Table (31): SURAT: Education capacity index .................................................................. 91 Table (32): City level proportion Occupation classes Surat (based on GIS) ....................... 92 Table (33): SURAT: Income stability index ...................................................................... 92 Table (34): SURAT: Social capacity Index across the City ................................................ 93 Table (35): SURAT: Estimated composition of households by state of Origin across SECs94 Table (36): Solid waste disposal arrangements across SECs .............................................. 95 Table (37): City wide Drainage and sewerage index across the SECs ( as % of each SEC) 95 Table (38): Loan and insurance vulnerability index ........................................................... 98 Table (39): Flood Vulnerability Index ............................................................................... 98 Table (40): Households at risk from Khadi Floods across SECs based on GIS analysis ..... 99 Table (41): Households Across SECs potentially prone to 2006 Flood inundations (GIS
analysis).......................................................................................................... 99 Table (42): Early warning message received before the 2006 floods Across SECs (as % of
SEC) ............................................................................................................. 100 Table (43): Source of Flood Warning across the SECs .................................................... 101 Table (44): Mobile phone coverage across SECs among the sample households (as % of
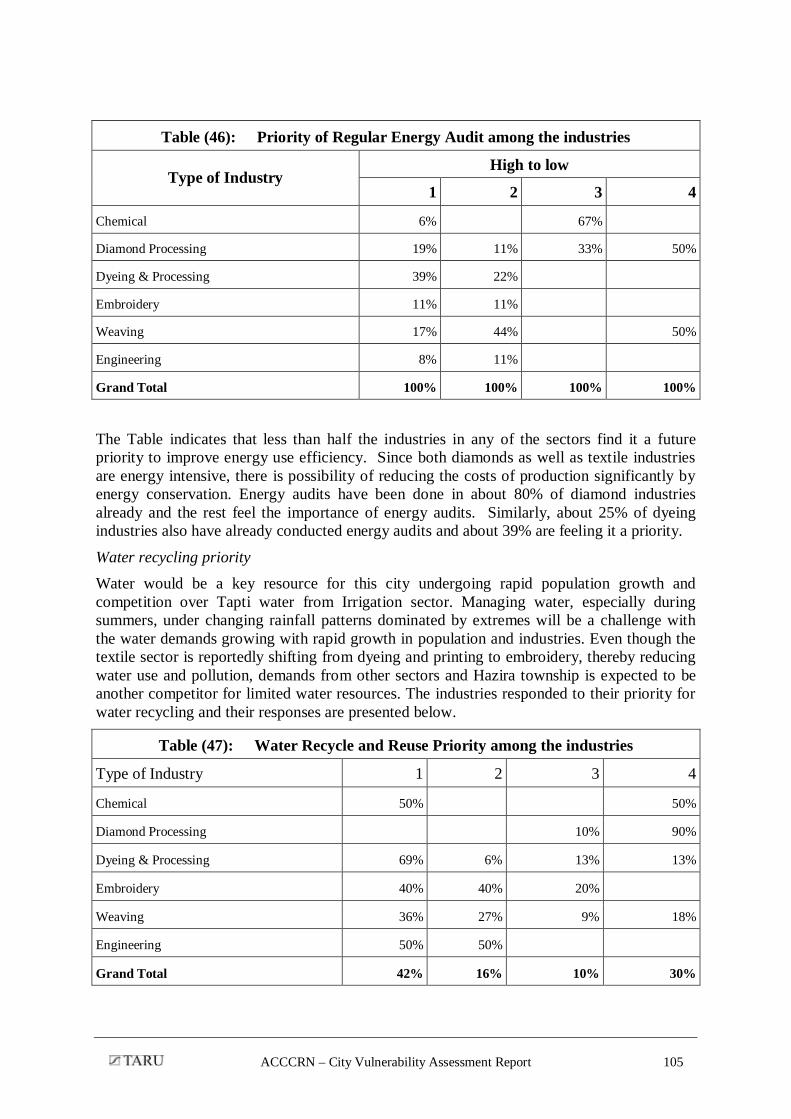
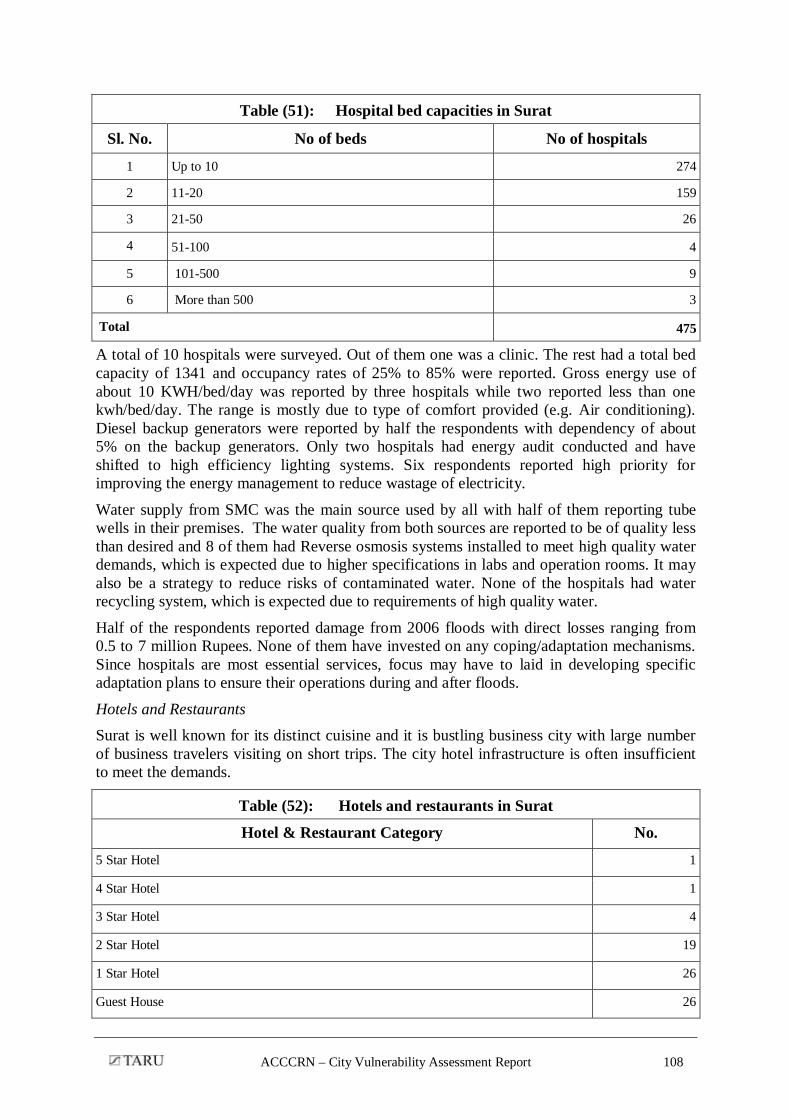
SEC) ............................................................................................................. 102 Table (45): No of coping measures reported by respondents across SECs ........................ 102 Table (46): Priority of Regular Energy Audit among the industries ................................. 105 Table (47): Water Recycle and Reuse Priority among the industries ................................ 105 Table (48): Capital and stock losses from Floods............................................................ 106 Table (49): Industry sector losses from 2006 Floods ( Rs. Billion) .................................. 106 Table (50): Higher education institutions in Surat............................................................ 107 Table (51): Hospital bed capacities in Surat..................................................................... 108 Table (52): Hotels and restaurants in Surat ...................................................................... 108
ACCCRN – City Vulnerability Assessment Report V
LIST OF ANNEXES
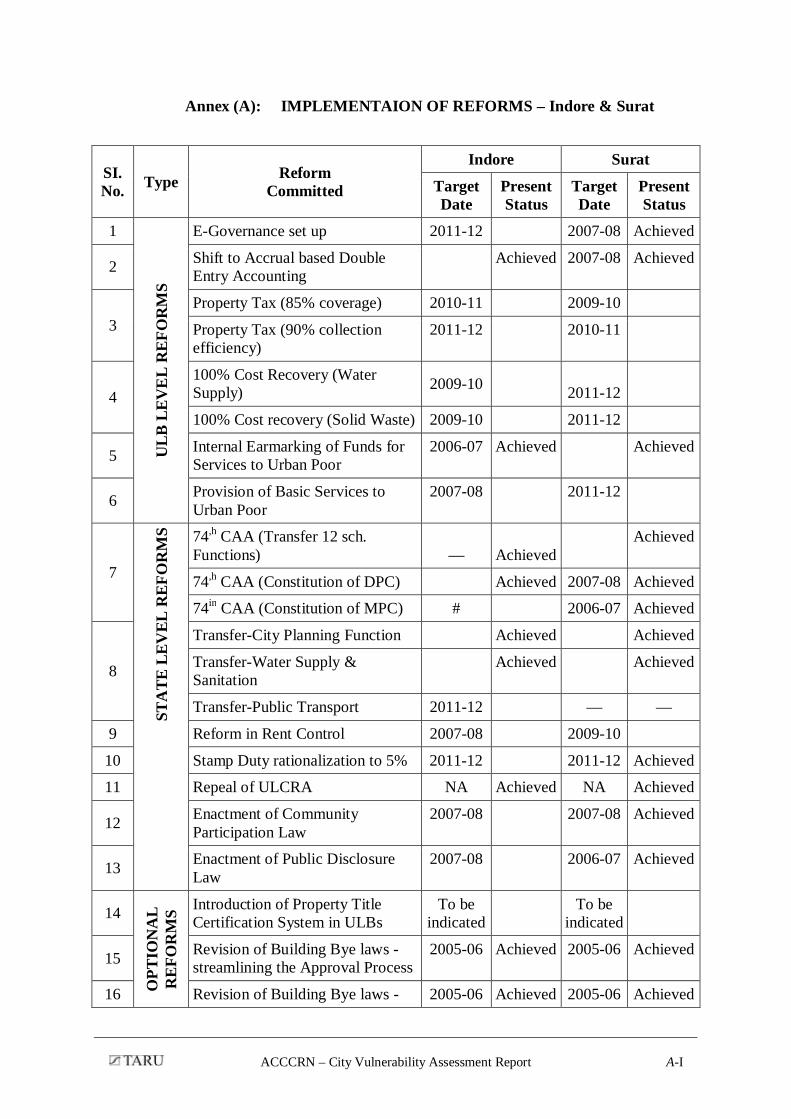
Annex (A): Implementaion of Reforms – Indore & Surat .................................................. A-I Annex (B): Major Indicators and sub indicators comprising the capacity and vulnerability
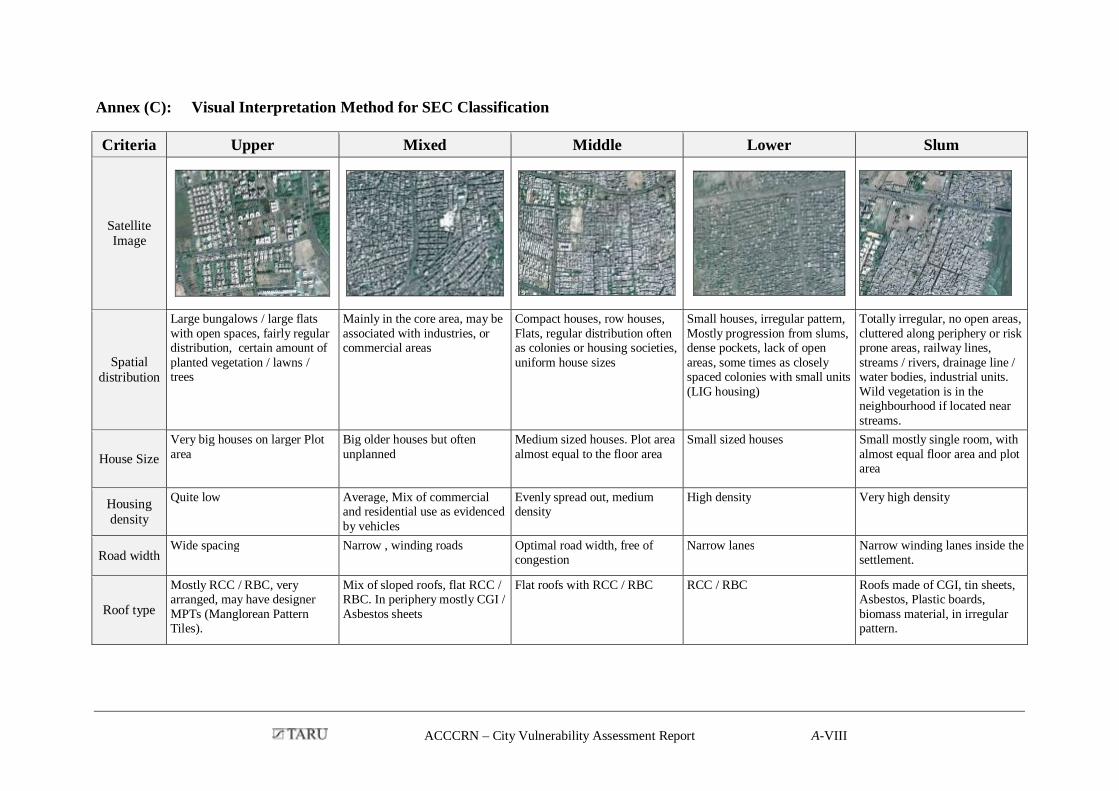
index for the cities of Indore and Surat……………………………………...A-III Annex (C): Visual Interpretation Method for SEC Classification ................................ A-VIII Annex (D): SWOT Analysis – INDORE......................................................................... A-X Annex (E): INDORE: Proportion of HH level Maximum Education across Sample
Settlements .............................................................................................. A-XIII Annex (F): INDORE: Livelihood profile across Sample Settlements…………………A-XIV Annex (G): INDORE: House Types across Sample Settlements....................................A-XV Annex (H): SWOT Analysis – SURAT ...................................................................... A-XVI Annex (I): SURAT: Classification of Land use and Settlements based on SECs (GIS
analysis)................................................................................................... A-XIX Annex (J): SURAT: Proportion of HH level Maximum Education across Sample
ACCCRN Asian Cities Climate Change Resilience Network AGCM Atmospheric Global Circulation Model
AKVN Audhyogik Kendra Vikas Nigam AOGCM Coupled Atmospheric Oceanic Global Circulation Model
BPMC Bombay Provincial Municipal Corporation Act BSUP Basic Services for Urban Poor
CAC City Advisory Committee CC Climate Change
CCCma Canadian Centre for Climate Modeling and Analysis CDP City Development Plan
CGCM3 Coupled Global Climate Model CNG Compressed Natural Gas
CRGM Community-Resources-Government-Markets DEFRA Department of Environment, Food and Rural Affairs
DIFD Department for International Development EEP Energy Efficiency Promotion
EWS Economically Weaker Sections FIRE D Financial Institutions Reform and Expansion
GCM Global Climate Models GDP Gross Domestic Product
GHG Green House Gases GIDC Gujarat Industrial Development Corporation
GIS Geographical Information System GISS Goddard Institute for Space Studies
GPCB Gujarat Pollution Control Board GPS Global Positioning System
GSDMA Gujarat State Disaster Management Authority GWSSB Gujarat Water Supply and Sewerage Board
HADA Hazira Development Authority HUDCO Housing and Urban Development Corporation
IDA Indore Development Authority IDP Indore Development Plan
IFRC International Federation of Red Cross
ACCCRN – City Vulnerability Assessment Report VII
IHSDP Integrated Housing and Slum Development Program IIED International Institute for Environment and Development
IITM Indian Institute of Tropical Meteorology IMC Indore Municipal Corporation
IMD Indian Meteorological Department IPCC Inter-Governmental Panel on Climate Change
IPSL Institute Pierre Simon Laplace ISDA Infrastructure Services Deficiency Analysis
JNNURM Jawaharlal Nehru National Urban Renewal Mission KWH Kilo Watt Hour
LECZ Low Coastal Elevation Zone LPCD Liters Per Capita per Day
LPG Liquefied Petroleum Gas MOA Ministry of Agriculture
MoEF Ministry of Environment and Forests MoF Ministry of Finance
NSSO National Sample Survey Organisation
ACCCRN – City Vulnerability Assessment Report 1
1 BACKGROUND ABOUT ACCCRN (PHASE II) – INDORE AND SURAT
The Rockefeller Foundation’s Asian Cities Climate Change Resilience Network initiative is a collective experiment with a range of activities that will together improve the ability of the cities to withstand, prepare for, and recover from the projected impacts of climate change. The interventions in the city of Indore and Surat spans across several interventions such as raising awareness of climate variability and climate change risks, developing city specific vision strategy and scenarios for informed decision making, screening programmes and plans for urban environment/planning/development/urban transport, sectoral studies on water security/energy security/public health among others, flood risk management and preparedness strategies, public health and policy initiatives.
Phase I of the programme focused towards city scoping and selection of partner cities for deeper engagement. TARU undertook city opportunity assessment studies in Gorakhpur, Hubli-Dharwad, Indore, Jodhpur, Kakinada and Surat. The study involved understanding vulnerabilities and possible impacts to climate change, broad analysis of risk and vulnerability, urbanization process and poverty profile, broad analysis of service deficiency in urban services, stakeholder analysis, investigating readiness of the cities to engage with the project on adaptation and building resilience. In India three partner cities namely Gorakhpur, Indore and Surat were selected in which ACCCRN Phase II initiative planned to pursue deeper engagement under PHASE II. Phase II (Jan2009 - Jun2010) of the initiative focuses on City-level engagement and capacity development. The core strategy for the cities of Indore and Surat is to develop implementation proposals that are owned by the diverse set of city stakeholders including the local government unit/urban development agencies, civil society organizations, and the private sector to ensure sustainability. TARU with support from ISET is involved in facilitating the implementation process through the following set of objectives:
Understand city level vulnerability and identification of potential climate variability and climate change impacts
Support the city advisory committee (CAC) in developing technically sound proposals involving prioritized climate resilience action plan through multi-stakeholder engagement;
Facilitating identification and assessment of climate risks in project cities;
Facilitating the development of replicable processes, methodologies and core insights on strategies for adapting to climate change in urban settings through development of a knowledge network involving cities and other project partners; and
Facilitate the cities to obtain major funding from diverse donors, including but not limited to the Rockefeller Foundation, for implementation in the context that is likely to exist following climate negotiations scheduled for December 2009 in Copenhagen.
Create city specific urban climate change adaptation/resilience action plan with particular focus on improving the resilience of poor and vulnerable populations to climate change impacts.
One of the key activities in PHASE II was to involve more players and develop partnerships with a wide spectrum of stakeholders including the local, state and national governments, community based organizations, colleges/universities and research institutions, professional bodies, physical and social infrastructure development professionals, health professionals,
ACCCRN – City Vulnerability Assessment Report 2
business leaders, private/industry sector, philanthropic organizations and the media. Climate scientists and development professionals are now sure that the physical effects of climate change and their consequences will be seen sooner than we anticipated few years ago. However the manifestations, nature and intensity remain uncertain. Pushing for action especially in an urban environment seeks establishing networks for learning and engagement. Actions and opportunities need to be taken at several levels and across sectors, much before the range of threats and impacts unfold leaving behind no option to figure out. Partnership development by engaging new and more stakeholders is the key to realize the perception of response period, address wide range of issues/concerns and take informed decisions. The city of Indore and Surat has been successful to broaden the conversation of climate change by engaging a broad range of representatives of the cities leading to formation of new alliances around the issues.
In order to develop adaptation strategy/plan for the city, the analysis framework for both the cities suggested detailed vulnerability assessment. This assessment along with sector studies shall guide the adaptation strategy framework for the City of Indore and Surat. The activities were scheduled in three phases over a time frame of one year (Nov 2008 – Nov 2009). The over arching framework for vulnerability studies was laid through a set of consultation meetings with communities/stakeholders followed by series of field visits. The assessment mainly identifies current vulnerabilities and capacities through a unique method of integration/combination of tool sets. The tool set and methods comprise a set of inter-related activities of literature review, collection of secondary data, primary surveys and semi-structured interviews of key informants, Infrastructure Services Deficiency Analysis (ISDA), Vulnerability and Capacity Index, Community-Resources-Government-Markets (CRGM) and series of set of Shared Learning Dialogues (SLD) / iterative meetings with different groups. This report is mainly divided into four sections: Introduction chapter covers the urban scenario of India, climate change risks in the Indian context, vulnerability issues in urban areas and introduction to the Vulnerability Assessment Methodology. Chapter 2 and Chapter 3 presents an insight to the city and its functions, hydro meteorological risks, capacity and vulnerability assessment results and adaptation leverage points. Chapter 4 draws in conclusion and way forward.
2 INDIAN URBAN CONTEXT
2.1 Urban growth
The level of urbanisation in India was 27.78 per cent in 2001(285 million), which was much lower than the average level of urbanisation in developing countries. Even though in percentage terms the urban growth in 1991-2001 decade has been somewhat subdued at only 31 percent, more than 70 million persons were added to urban population. Thirty five million plus cities accounted for nearly one third of the urban population. The growth during 1991-2001 has been mostly concentrated in million plus cities with growth rate more than the national urban growth average with cities like Surat growing at more than 60 % while Indore growing at more than 40% . Urban growth has been adding pressure on resources and infrastructure, which is mostly old and was designed for much lower population and resource and infrastructure shortages are causing major bottlenecks to growth. There is a lag, often running to decades, between the demand increase and infrastructure building to meet those demands. Anticipatory planning is severely constrained by shortfall in finance as well as constraints in planning process it self. With the result, even large programmes and funds like JNNURM can only meet part of the past demands.
ACCCRN – City Vulnerability Assessment Report 3
The existing infrastructure available in the cities unable to cope with the existing population pressure is stretched even more now with the expansion of the city limit areas. The growth of industries and of late the service sector in the country have put an immense pressure on the local bodies to expand the city limits. Surat is one of the best examples having expanded the city limits areas in 2006 from 112 Sq.km to 326 Sq.km. In case of the strategic metropolis, which are now potentially full to their capacity, are following up with the expansion of the city limits but under separate administrative units; more prominent examples being National Capital Region (NCR) in case of Delhi and Navi Mumbai in case of Mumbai. The expanded city limits too have to depend on the core of the city to meet the basic infrastructure demands. Moreover the human resource for these industries also comes from the core city area followed by the gradual shifting towards the periphery as the infrastructure needs are catered to (e.g. middle income population), and sometimes more abruptly (e.g. low income/migrant population). Analysis of the older metropolitan cities and the new metropolitan cities in the country reveals that the core population is actually decreasing in the older ones except Bangalore while in the newer ones it is the core which is growing in density (Bhagat, 2005)
Water is indispensable ‘stuff’ for maintaining the metabolism, not only of our human bodies, but also of the wider social fabric. The very sustainability of cities and the practices of everyday life that constitute ‘the urban’ are predicated upon and conditioned by the supply, circulation, and elimination of water.
Erik Swyngedouw
The concept of an urban metabolism provides a means of understanding the sustainable development of cities by drawing analogy with the metabolic processes of organisms. The parallels are strong: “Cities transform raw materials, fuel, and water into the built environment, human biomass and waste” (Decker et al. 2000). The metabolism of an urban area is an interconnection of space, urban infrastructure and material inflows which are dependent on external resources – mainly energy and water. Urban metabolism can be defined as “the sum total of the technical and socio-economic processes that occur in cities, resulting in growth, production of energy, and elimination of waste” (Kennedy et al. 2007). The metabolism of an ecosystem involving the production, via photosynthesis, and consumption, by respiration, of organic matter is often expressed by ecologists in terms of energy. A few studies of urban metabolism have focused on quantifying the embodied energy in cities, while others have more broadly included fluxes of nutrients and materials, and the urban hydrologic cycle (Kennedy, 2007)
2.3 Constraints on water supplies and natural resources
It is important for city managers and policy makers to understand the metabolic processes considering the extent of the near and far resources they depend on, understand the critical processes involved as well as their exhaustion rate, and when alarmed by shortage, develop suitable measures to reduce the dependency, augment the resource linkages and increase the efficiency of the systems. Cities in India primarily depend on water from external resources, often pumped from long distances. Several growth factors such as increasing population, changing land-use pattern, change in social attitude, and dependence on energy for daily activities including urban transportation severely influence the material inflow and outflow. The stock and flows through the cities if not monitored reach critical levels and leads to falling of ground water table, rising energy consumption, accumulation of waste, increase in urban heat island effect, degradation in public health among others. In absolute terms where
ACCCRN – City Vulnerability Assessment Report 4
the population of the cities is growing, there is a change in the metabolism of the cities and the per capita energy requirement is on the rise. Climate change exacerbates the material and energy flow in the cities. A simple example is the rising per capita electricity consumption for summer cooling during the period of extended summer months. In order to meet the material and energy demands a large number of secondary cities in India are undergoing massive transformation through investment in infrastructure (especially water supply, urban transportation, energy, recycling systems). Cities are on the trend of becoming more material intensive and have therefore strained the existing natural resources especially water resources, agricultural land and forests, pollution of streams and overall quality of life. Many cities and their catchments are likely to get less precipitation (and have more constrained freshwater resources) – which is particularly problematic for growing cities as well as large cities facing serious problems obtaining freshwater supplies (Danilo J, 1993). Although agriculture remains the largest user of freshwater resources within virtually all national economies, the water demands from urban enterprises and consumers have become increasingly important in most nations. In addition, many major cities have had to draw freshwater from increasingly distant sources, as local surface and groundwater sources are no longer able to meet the demand for water, or as they become depleted or polluted. In many coastal cities, local groundwater supplies have been depleted to the point where saline intrusion limits freshwater supplies (Hardoy et. al., 2001). In many cities the failure to manage the water resources as on date is independent of climate change. For instance the distribution losses are far more linked to inadequate governance than to water shortage. Further the rate of water consumption versus few or no options of reuse makes it unsustainable. The water crisis is related to the poor distribution of water and in many cases it is now observed as lack of water at source. The National Capital Region in India (Delhi and surrounding environs) faces a severe water shortfall and is competing with irrigated agriculture upstream. Drinking water is being transported to meet the demands of this city of 15 million, from over 300km, and yet unaccounted-for water losses are over 40 per cent in the city. Rising temperatures and therefore energy demand for cooling, increasing precipitation variability, a lower number of rainy days, an unsustainable mining of groundwater and a heavily polluted river system could make the Delhi mega-urban region, with its projected population of over 30 million, unsustainable, in spite of the rapid growth in its income and wealth (Revi, 2007). Most of the urban local bodies prefer to the respond to the rising deficit by augmenting existing water supply via tapping new distant and often costliest water resources, while not investing on tapping soft water paths (Gleick, 2003) through reducing distribution losses and recycling. Untargeted subsidies are a major disincentive for household level conservation practices. The energy bills incurred for tapping these external resources are significantly high.
The Inter-Governmental Panel on Climate Change (IPCC) noted the different ways in which climate variability and change are likely to affect urban water supply and sewage systems (ibid). Increased temperatures are likely to cause an increase in demand for water. Further, any reduction in the local water sources due to climate change is also likely to increase the demand on regional water supplies. IPCC reports have noted that the impacts on water supplies will arise as a result of extreme weather condition influenced largely by climate change. Droughts and floods will be on the rise, threatening the water resources of many cities. Flood waters are usually contaminated by the overflow from individual latrines, septic tanks, open drains and sewers. It has been observed in the case of Indore that slums located in the peripheral areas do not have basic drainage and sewerage infrastructure – or if they do, it serves a very small section of the population. For such infrastructure deficient locations,
ACCCRN – City Vulnerability Assessment Report 5
health is of a great concern throughout the year. Design of infrastructure to improve the services for the poor are often not informed by local context and maintenance issues are often neglected, resulting in partial or complete failure soon after commissioning.
As per 2001 population census 285.35 million people reside in urban areas. It constitutes 27.8% of the total population of the country. According to the Ministry of Urban Development, the urban population in India is expected to reach a staggering total of 575 million by 2030 from an estimated 325 million in 2005 (UN Population Database, 2010). The rising urban population has also given rise to increase in the number of urban poor. As per 2001 estimates, the slum population is estimated to be 61.8 million. The ever increasing number of slum dwellers causes tremendous pressure on urban basic services and infrastructure. Without major urban land reforms, cities in India will not be able to support the inevitable urbanization in a planned way. Raising finance for urban infrastructure has been a challenge (India Infrastructure Report, 2009). Liberalization policies adopted by the Government of India are expected to increase the share of the urban population and may increase to about 40 per cent of total population by the year 2021. It is estimated that by the year 2011, urban areas would contribute about 65 per cent of gross domestic product (GDP). However, this higher productivity is contingent upon the availability and quality of infrastructure services. Urban economic activities are dependent on infrastructure, such as power, telecom, roads, water supply and mass transportation, coupled with civic infrastructure, such as sanitation and solid waste management (JNNURM, 2004). Local government and other government agencies do not always have the necessary resources to cope up with the housing needs. Urban infrastructure development also needs to address large and continued inflow of population related demands and related issues. Addressing growth in peripheral areas due to inflow of people from rural areas builds pressure on the local government to provide civic services. It is estimated that over 7 years starting 2005-06, the Urban Local Bodies (ULBs) would require a total investments of 1,205.36 billion Rs. This includes investment in basic infrastructure and services, that is, annual funding requirement of 172.190 billion Rs.
Since cities and towns in India constitute the second largest urban system in the world, and contribute over 50 per cent of the country’s GDP, they are central to economic growth. For the cities to realize their full potential and become effective engines of growth, it is necessary that focused attention be given to the improvement of infrastructure. In order to fructify these investments, Jawaharlal Nehru National Urban Renewal Mission (JNNURM), a national level initiative was launched which brought together the State Governments and enabled ULB’s catalyse investment flows to the urban infrastructure sector. Sub-Mission for Urban Infrastructure and Governance is being administered by the Ministry of Urban Development. The main thrust of the Sub-Mission will be on infrastructure projects relating to water supply and sanitation, sewerage, solid waste management, road network, urban transport and redevelopment of old city areas with a view to upgrading infrastructure therein, shifting industrial and commercial establishments to conforming areas, etc.
2.5 Actual situation of urban administration and “3 Fs”, post 74th amendment.
Most functions related to the urban governance and management has traditionally been vested with the state governments. The ULBs are still constrained by lack of funds, overlapping and fragmented functions between ULBs and state government and lack of functionaries (staff often on deputation from state departments). The 74th constitutional amendment was
ACCCRN – City Vulnerability Assessment Report 6
enacted to devolve most of the urban administration functions to the urban local bodies, but their actual implementation is highly diverse across the states. .
The evolution and form of urban environmental and social service institutions varies across states as they have emerged in response to differing patterns of urbanization and the challenges faced in different parts of the country. Box (1) highlights the management innovations undertaken by the Indore Municipal Corporation during the late 1990’s.
Box (1): Management Innovations for Municipal Resource Mobilization in Indore Management innovations in Municipal Resource Mobilization were undertaken by Indore Municipal Corporation under the Indo-USAID Financial Institutions Reform and Expansion (FIRE) project. The project supported IMC municipal officials to increase the city’s revenues in various ways, including making optimal use of existing assets, and build their capacity to better govern the city through providing training and technical assistance. The various steps undertaken by IMC to improve resource mobilization are: Improved Tax Administration Tax grievance redressal camps Municipal Asset Management Reorganized Revenue Department Enforcement Drive Computerization and Management Information System Urban E-Governance Decentralization Source: (Vyas & Vaidya 2003)
The ULBs, till several years ago, had not been able to meet the growing infrastructure and service demands of the urban communities. The first thing that arises is inadequacy of finances. Finance alone is not the only factor accounting for unsatisfactory performance. It has been seen that even obligatory functions are being inadequately performed. Services and amenities are chronically short of basic requirements, leaving alone expansion and maintenance of existing facilities. Fiscal autonomy largely depends upon the extent of innovative mechanisms by which resources are raised by the local bodies. The reluctance of the ULBs to tax people and poor administrative capacity at the local level also account for poor financial position of the local bodies. Functional autonomy is reality only when it is accompanied by financial independence through positive measures/policy reforms by the State Government. This will ensure financial self-reliance of the ULBs. While most of the functions related to municipal functioning come under the purview of the State, the Government of India still exerts a huge influence over the planning process through resource transfers via the Centrally Sponsored Schemes. One of the main strategy of urban renewal is to ensure improvement in urban governance so that Urban Local Bodies (ULBs) and para-statal agencies become financially sound with enhanced credit rating and ability to access market capital for undertaking new programmes and expansion of services. In this improved environment, public-private participation models for provisioning of various services would also become feasible. To achieve this objective, State Governments, Urban Local Bodies and para-statal agencies are required to accept implementation of an agenda of reforms. The sanctioning of JNNURM related city projects is conditional on implementing certain reforms to be undertaken by states/ cities. The proposed reforms fall in two categories-
ACCCRN – City Vulnerability Assessment Report 7
Mandatory reforms and Optional reforms. City-wise Status of Implementation of JNNURM Reforms (as on 30th June, 2008) is highlighted in Annex (A).
2.6 Urban Poverty
The urban population of India is increasing but not as fast as other Asian countries. India has shared the growth pattern with some of the fastest growing regions in Asia. The country has witnessed around 8 percent growth in GDP in the last couple of years. India’s urban population is increasing at a faster rate than its total population. Urbanization has been recognized as an important component of economic growth. At 28 percent, the pace of urbanization, however, has been slow and lower than the average for Asia. The absolute number of people in urban cities and towns, however, has gone up substantially. The researchers expect rate of urbanization to also increase in the coming years. With over 575 million people, India will have 41 percent of its population living in cities and towns by 2030 from the present level of 286 million (India-Urban Poverty Report, 2009).
The slum population of India in cities and towns with a population of 50,000 and above was 42.6 million, which is 22.6 per cent of the urban population of the states/ Union Territories reporting slums (GOI, 2001). Although the slum population has increased, the number of slums is lower (NSSO, 2002), which makes them more dense. There is higher concentration of slum population in the large urban centers (GoI, 2001). Urban poverty in India remains high, at over 25 percent. Over 80 million poor people live in the cities and towns of India.. This has resulted in the “Urbanization of Poverty”. A large number of states report poverty figures in urban areas much above that in rural areas. At the national level, rural poverty is higher than poverty in urban areas but the gap between the two has decreased over the last couple of decades. The number of poor does not seem to have declined with acceleration in GDP growth. As the urban population in the country is growing, so is urban poverty. The nature of Urban Poverty poses different problems - housing and shelter, water, sanitation, health, education, social security and livelihoods along with special needs of vulnerable groups like women, children and aged people. Poor people live in slums which are overcrowded, often polluted and lack access to basic civic amenities/services like clean drinking water, sanitation and health facilities. Most of them are involved in informal sector activities where there is constant threat of eviction, removal, confiscation of goods and almost non-existent social security cover. A substantial portion of the benefits provided by public agencies are cornered by middle and upper income households. 54.71 percent of urban slums have no toilet facility. Most free community toilets built in the past by state government or local bodies are often rendered unusable because of the lack of maintenance Slum population is an integral component of the urban population. As per the census 2001, 640 cities/towns in 26 States/Union territories in 2001 reported slum population. The slum population in 2001 was 42.6 million constituting 15 per cent of the total urban population of the country and 22.6 per cent of the urban population of the states/union territories reporting slums. Cities with million plus population were 27 in 2001, accounting for 17.7 million slum population. Weaker sections (SC/ST) constitute 19.8 percent of the total slum population in the cities. With heavy pressure on the existing infrastructure in the cities, the slum population finds itself more neglected in terms of access to basic services, more so because of intricate land ownership issues, and lack of political will power. Also, the subsidies in water supply are not targeted with significant inclusion and exclusion errors, the poor are often not able to get the services or benefits of subsidies.
ACCCRN – City Vulnerability Assessment Report 8
Push and pull migration The growth of the cities throws ample opportunity for the work force (skilled/ unskilled) to get absorbed in the urban market. Here both the factors of push and pull migration have to be in play to fill in the demand of workforce at all levels. As per the Census 2001 figures, almost 309 million migrated in the country which accounts for almost 30 percent of the population of the country. The cities with high potential of churning out jobs (e.g. Delhi, Mumbai, Pune, Bangalore, Surat, Ahmedabad, Indore), continue to remain the favorite destination for years for inter as well intra state migrants. The result being sheer mismatch in the quantum of the possibility offered on account of pull migration and the resources available through push migration; the possibility of later outnumbering the former being more. Lack of potential of other cities to develop as mega centers is hindered due to many reasons like lack of matching fund, revenue deficit, lack of municipal sector reforms, lack of avenues for the industry and the service sector to find incessant supply of resources (esp. water, electricity, human resources). A gradual shift in the migration pattern from big cities to smaller towns due to high cost of living in the cities is also being noticed (Kundu, 1997). Most of the cities face migration mostly from the nearby areas falling within the state or even outside depending upon the availability of the jobs, skill set, geographical distance, acceptability, history of migration etc. The reasons are varied, ranging from the difficult topography of the native place, average land holding size (0.4 ha for marginal farmers and 1.41ha for small farmers (MOA, 2005), net sown area, and total irrigated land. Issue of less per capita land availability combined with untimely rainfalls, lack of access to irrigation facilities, water scarcity due to overexploitation of ground water, land degradation and decreasing productivity (marginal lands in particular), have taken a toll on the rural populace. All India average for the land holding by small and the marginal farmers accounts for almost 38.9 percent of the total land holding in the country, in case of Gujarat and Madhya Pradesh it is 25.4 percent and 25.8 percent respectively (ibid). Moreover, the growth in the population does not transcend into more or even constant amount of land availability for the next generation. Availability of work through National Rural Employment Guarantee Scheme (NREGS) has been able to curtail the migration to some extent, but still not rewarding to completely stop the trend of migration.
2.7 Climate change risks – Indian urban context
Large sections of the urban poor are exposed to a range of environmental health hazards in their homes and workplaces plus a set of stressors (e.g. urban heat-island effect and human-induced water scarcity) – and climate change is likely to bring a range of new risks or heightened risk levels for already existing hazards and stressors – for instance in many cities through more frequent or severe storms, more extreme rainfall episodes, heat waves, constraints on freshwater supplies and, for coastal cities, sea-level rise (de Sherbinin et al., 2007). There are also complex relationships between this mix of hazards and the many (inter-related) components of urban poverty which include not only the urban poor’s inadequate incomes and limited asset bases but also very poor-quality housing, lack of basic infrastructure for providing water, sanitation, drainage and garbage removal and lack of civil and political rights. This greatly increases the vulnerability of the urban poor to most environmental hazards, including most of those related to climate change (Satterthwaite et al., 2007). This complex interplay is well understood in Judith Rodin statement “…communities around the world need better weapons - new tools, techniques, and strategies - if they hope to tame the three-headed hydra of climate risk, poverty, and precipitous urbanization” (PND, 2009). Since it may be too late to stop the global warming that’s already occurred, we also must figure out how to survive it....there is far less attention paid to adaptation, what
ACCCRN – City Vulnerability Assessment Report 9
needs to be done to help people and environments cope with what’s already occurred and with what’s coming.” This is represented in the graphic below (Fig. (1)). The star in the centre determines the zone of intervention.
FIG. (1) : PEOPLE AND ENVIRONMENTS: ZONE OF INTERVENTION
Source: based on discussion with Jo da Silva (ACCCRN, Hue Meeting, Sept 2009)
The increased climate variability and change are likely to differentially impact the poorer and disadvantage groups. The increased level of risk can be due to increase in flooding events, scant availability of water supplies, increase in cost of food supplies or water, service deficiency of basic infrastructure, damage caused due to physical assets and livelihoods due to hydro-meteorological phenomena and poor adaptive capacity of individuals/families and the communities. In general, the people most at risk from climate change are those living in affected areas that are:
inability to avoid the direct or indirect impacts (e.g. by lack of good-quality houses and drainage systems that prevent flooding);
likely to be most affected (e.g. for instance infants and older groups who are less able to cope with heat waves);
least able to cope with the illness, injury, premature death or loss of income, livelihood or assets caused by the kinds of impacts (Satterthwaite et al., 2007) ( e.g. Households with uncertain incomes prone to disaster related losses).
Good governance bridges the disparities between income groups and risk-prone groups. For instance, by proving basic services such as piped water supply, sanitation, electricity, safe housing to socially disadvantage groups, the exposure to the hazard risks is considerably minimized. Socially progressive schemes either through the federal/state/ULB funds will reduce the vulnerability of the poor and enhance city wide planning. The quality of government at city and higher levels influences the levels of risk from climate change facing those with limited incomes or assets in several ways:
quality and provision for infrastructure for all areas (which should limit risks of flooding for the whole city area, not just for the wealthier areas);
ACCCRN – City Vulnerability Assessment Report 10
quality of provision for disaster-preparedness (including warnings, measures taken to limit damage and, if needed, good provision to help people move to safer areas quickly);
quality of planning for and coordinating disaster-response (for instance rescue services and appropriate emergency and health care services) and reconstruction (to help those who have lost their homes and livelihoods) which should aim to improve resilience, but seldom achieves this;
extent to which poorer groups can buy, build or rent “safe” housing in “safe” sites;
degree to which local government creates an enabling environment for local civil-society action to contribute towards addressing the practical aims identified above (Satterthwaite et al., 2007).
2.8 Upgrading slums and squatter settlements
Experiences worldwide has shown that a more inclusive approach of the poorer groups in the planning process reduces the exposure and enhances vulnerability reduction. Improving the housing conditions, urban infrastructure services and providing livelihood opportunities will make poor less vulnerable to climate change in urban areas. In India, a significant development took place in the year 2004 with the reappearance of a significant public policy agenda on urban development, urban renewal and governance. Considerable support has been extended by the national government programme supported by the State and the Local Government Unit.
In order to cope with massive problems that have emerged as a result of rapid urban growth, it has become imperative to draw up a coherent urbanization policy/strategy to implement projects in select cities on mission mode. The JNNURM Sub-Mission for Basic Services to the Urban Poor is being administered by the Ministry of Urban Employment and Poverty Alleviation through the Sub-Mission Directorate for Basic Services to the Urban Poor. The main thrust of the Sub-Mission will be on integrated development of slums through projects for providing shelter, basic services and other related civic amenities with a view to providing utilities to the urban poor. Box (2) and Box (3) highlight the objectives and components of the JNNURM Sub-mission.
Box (2): Basic Services to the Urban Poor - Objectives and components
The JNNURM seeks to ensure sustainable development of select cities. An evaluation of the experience of implementation of the Mission would be undertaken before the commencement of Eleventh Five Year Plan and if, necessary, the programme calibrated suitably. The main thrust of the sub-Mission on Basic Services to the Urban Poor will be on integrated development of slums through projects for providing shelter, basic services and other related civic amenities with a view to provide utilities to the urban poor. Key mission objectives are:
Focused attention to integrated development of Basic Services to the Urban Poor in the cities covered under the Mission.
Provision of Basic Services to Urban Poor including security of tenure at affordable prices, improved housing, water supply, sanitation and ensuring delivery through convergence of other already existing universal services of the Government for education, health and social security. Care will be taken to see that the urban poor are provided housing near their place of occupation.
Secure effective linkages between asset creation and asset management so that the Basic Services to the Urban Poor created in the cities are not only maintained efficiently but also become self-sustaining over time.
Ensure adequate investment of funds to fulfill deficiencies in the Basic Services to the Urban Poor. Scale up delivery of civic amenities and provision of utilities with emphasis on universal access to
urban poor.
ACCCRN – City Vulnerability Assessment Report 11
Box (2): Basic Services to the Urban Poor - Objectives and components
Admissible components include: 1. Integrated development of slums, i.e., housing and development of infrastructure projects in the slums
in the identified cities. 2. Projects involving development/improvement/maintenance of basic services to the urban poor. 3. Slum improvement and rehabilitation projects. 4. Projects on water supply/sewerage/drainage, community toilets/baths, etc. 5. Houses at affordable costs for slum dwellers/ urban poor/EWS/LIG categories. 6. Construction and improvements of drains/storm water drains. 7. Environmental improvement of slums and solid waste management. 8. Street lighting. 9. Civic amenities, like community halls, child care centers, etc. 10. Operation and maintenance of assets created under this component. 11. Convergence of health, education and social security schemes for the urban poor
Source:(Ministry of Housing and Urban Poverty Alleviation, 2004 )
It is hoped that more rational urban infrastructure development with a strong pro-poor focus would help address some of the structural vulnerabilities of many million plus-cities and state capitals. But, as yet, there is no independent sub-component that addresses either urban vulnerability or risk mitigation, and no sign of a climate-change-related response (Revi, 2007). The Local Government Unit in few mission cities is addressing the issues of local risk which are in addition to the regular practice of construction.
ACCCRN – City Vulnerability Assessment Report 12
Box (3): Integrated Housing & Slum Development Programme - Objectives and coverage
Integrated Housing & Slum Development Programme aims at combining the existing schemes of VAMBAY (Valmiki Ambedkar Awas Yojana) is a Center-State partnership scheme to provide homes and improve the living conditions of the slum households) and NSDP (National Slum Development Programme) under the new IHSDP Scheme for having an integrated approach in ameliorating the conditions of the urban slum dwellers who do not possess adequate shelter and reside in dilapidated conditions. The scheme is applicable to all cities and towns as per 2001 Census except cities/towns covered under Jawaharlal Nehru National Urban Renewal Mission (JNNURM) The scheme seeks to enhance public and private investments in housing and infrastructural development in urban areas. The basic objective of the Scheme is to strive for holistic slum development with a healthy and enabling urban environment by providing adequate shelter and basic infrastructure facilities to the slum dwellers of the identified urban areas. The scheme coverage includes:
1. The scheme will apply to all cities/towns, excepting cities/towns covered under JNNURM. The target group under the scheme is slum dwellers from all sections of the community through a cluster approach.
2. Allocation of funds among States will be on the basis of the States’ urban slum population to total urban slum population in the country.
3. States may allocate funds to towns/cities basing on similar formula. However, funds would be provided to only those towns and cities where elections to local bodies have been held and elected bodies are in position.
4. The State Governments may prioritize towns and cities on the basis of their felt-need. While prioritizing towns, States would take into account existing infrastructure, economically and socially disadvantaged sections of the slum population and difficult areas.
Source: MoHUPA, 2009.
2.9 Current plans and visions in Urban development
It is estimated that the share of urban population may increase to about 40 per cent of the total population by 2020-21 (MOF, 2008). Such projections of urban population surge in the coming decade and the inability of the existing infrastructure of the selected cities to support the influx of the migration in the cities necessitate allocation of more funds for the infrastructure development and capacity building of the smaller cities, small and medium towns. Traditionally, the urban infrastructure in India has been financed through mix of the following (Vaidya, et.al, 2008):
Budgetary allocations from Municipality’s own revenues
Grants from state government
Borrowing from insurance companies and specialised national level institutions like HUDCO and state level financial institutions
Limited borrowings from banks/FIs
Limited investments by the ULBs themselves through their internal resources. Since public funds for these services are inadequate, ULBs have to look for alternative sources for financing their infrastructure costs. Several ULBs and utility organizations have issued bonds and have so far mobilized over Rs.12,000 million through taxable bonds and the figure continues to grow (Vaidya et al., 2008). With an aim to encourage cities to initiate steps to bring about improvement in the existing civic services levels in a sustainable manner, Jawaharlal Nehru National Urban Renewal Mission (JNNURM) was launched in 2005-06 by the Ministry of Urban Development
ACCCRN – City Vulnerability Assessment Report 13
(MoUD). The scheme is categorized into two broad segments viz., the sub-mission on Urban Infrastructure Governance (UIG) and the sub-mission on Basic Services to the Urban Poor (BSUP), covering 63 cities comprising mega, metro, capital and cities of heritage and historical significance. A provision of Rs. 500 billion has been made as Central assistance for the entire JNNURM for a period of seven years beginning from 2005-06. While the Central Government has gone about allotting the functions and management of the schemes as envisaged in JNNURM, it has also set forth two sets of mandatory reforms. Core reforms at the ULB/parastatal level aim at process reengineering through use of appropriate technology to enable more efficient, reliable and timely services in a transparent way. The other set of reforms pertains to the State level.
The ULBs’ reform covers, among others, adoption of modern, accrual-based double entry system of accounting in urban local bodies/para-statals, introduction of system of e-governance using information technology, reform of property tax with GIS so that it becomes a key source of revenue for ULBs and arrangements for its efficacious implementation so that collection efficiency reaches 85 per cent within next seven years and levy of reasonable user charges by ULBs with the remit to cover full cost of operation and maintenance or recurring cost is collected in seven years.
2.10 JNNURM progress in Surat & Indore:
Surat and Indore have identified number of infrastructural projects to be funded under JNNURM. As per the available data (JNNURM, 2009) projects worth Rs. 18.4 billion has been approved for Surat while Rs. 6.35 billion has been approved for Indore for urban infrastructure development. The number of sanctioned projects is 25 for Surat while Indore has got approval for 9 major projects.
Slum up-gradation (housing projects) in Surat & Indore (BUSP, IHSDP): Apart from the EWS (Economically weaker section) housing scheme, provision for construction of new houses for the urban poor has been made under BUSP and IHSDP. While the total amount approved for Surat is Rs. 6.12 billion (only for BUSP), Indore has been approved a sum of Rs. 2.97 billion (including BUSP and IHDSP). The recurrent emergence of new slums especially in the vulnerable zones of the city continues to remain as one of the major challenge for the respective city administration. Surat Municipal Corporation (SMC) has incorporated this into its revenue generation plan which involves relocation of the slum population from the prime areas; followed by slum demolition and development of infrastructure. On the other hand, Indore Municipal Corporation (IMC) has received major support under MPUSP (DFID Funded Project), where the up-gradation of facilities in the notified slums is being done based on poverty matrix (the poorest of the slums being identified first).
2.11 Major issues of CC risks in urban environment
India is one of the vulnerable and multi-hazard risk prone countries in the world (IFRC, 2005, Parasuraman & Unnikrishnan, 2000). Rapid population growth, high densities, poverty and high differentials in access to housing, public services and infrastructure have led to an increase in vulnerability over the last few decades, especially in India’s urban centres (Revi, 2007). Climate-change risk is expected to increase the frequency and intensity of current hazards, an increased probability of extreme events, spur the emergence of new hazards (e.g. sea-level rise) and vulnerabilities with differential spatial and socio-economic impacts. This is expected to further degrade the resilience and coping capacities of poor and vulnerable
ACCCRN – City Vulnerability Assessment Report 14
communities, who make up from a quarter to half of the population of most Indian cities (Satterthwaite et al., 2007).
There is some degree of certainty about the global changes as a result of climate change, there is agreement that these changes will be far from uniform, and in all probability are likely to affect the tropical countries more (IPCC, 2007). Moreover, the developing countries are likely to be face bigger impacts as usually these countries have less capacity and resources to face the changes. The first-order impacts (change in temperature and precipitation) have been extrapolated using regional models (Kumar et al., 2006) and there have been other studies that have examined the likely changes in the available water resources by modeling of river basins.
India has medium risk exposure, but high vulnerability due to climate change. It is expected that climate change will both intensify the current risks India faces, and also lead to some new hazards like sea level rise (DEFRA, MoEF). Climate change in India represents an additional stress on ecological and socioeconomic systems that are already facing tremendous pressures due to rapid urbanization, industrialization, and economic development. With its large and growing population, and an economy that is closely tied to its natural resource base, India’s population is vulnerable to the impacts of climate change such as changes in forest and water resources and sea level rise (DEFRA, UK). Climate change is likely to increase vulnerability of the already weak groups. One of the areas which had emerged in the discussion forum in several cities is increasing water crisis. With the projected population growth statistics and increasing usage of water resource for daily consumption, there will be more pressure on the already strained centralized water supply systems of urban areas. With resources drying out in the city due to pollution/closing down of local surface water sources and over-exploitation of ground-water use, cities across the country are now dependent on regional water-sheds and distant source based supply schemes. The urban water supply and sanitation systems in several cities are suffering from increasing demand-supply gap, inadequate rainfall, and inadequate levels of service, poor sanitary conditions and worsening performance.
India has a climate-dependent economy. The preliminary assessment of the IPCC (IPCC, 2001; Third Assessment Report) had revealed that under the GHG scenario, the severity of droughts and intensity of floods in various parts of India are projected to increase. Also, a general reduction in the quantity of available run-off has been predicted in these studies. India predominantly has a tropical monsoon climate. Rainfall occurs for only a short spell during the rainy season with most other periods of the year being dry (Kumar et al., 2005). Therefore, in India, the water that is stored (from rivers and groundwater percolation, etc.) has to be used for the whole year till the next rainy season. Thus, the failure of the monsoon or any adverse effect on the monsoon, as well as high temperature significantly affects the daily and yearly demand of water (Sharma & Bharat, 2009). Also the developed water resources are already committed to a variety of sectors including irrigation industry and additional demands from urban sector results in competition and potential conflicts between existing users and new demands, even though drinking water has been given the highest priority. Climate change, increasing population and vulnerability of the urban population will pose a greater challenge to existing resources and for city managers and local government towards management of the water resource. Overall risk in Indian cities typically is associated more with vulnerability than hazard exposure. Some of the likely impacts specifically on Indian cities are likely to be (TARU 2008) as follows:
ACCCRN – City Vulnerability Assessment Report 15
Droughts: This is the single largest risk to India. Its direct impacts on cities are likely to be water crisis and rise in food and bio-mass prices. Possible second order impacts include reduced demand for urban produced goods and migration. (Revi, 2008) Flooding and Inundation: There is likelihood of increased frequency of urban flooding due to both fluvial (River induced) and pluvial (local rain induced) flooding due to increase in extreme rainfall events. Moreover, heavy rainfall in other places might cause a flooding downstream as a result of water release from water reservoirs upstream as experienced in Surat in 2006 and in parts of Delhi in August 2008. This flooding is exacerbated in almost all cities because of pattern of development: riverfront development projects that reclaim land and reduce the river channels (Ahmedabad), construction on small creeks and rivulets (Surat), severe loss of tree cover, and also increase in area of hard paving. While the Mumbai floods in 2005 hit the headlines across the globe, it is becoming increasingly common for parts or whole cities to come to a standstill after a heavy rainfall burst of two to three hours. Water Crisis: This is likely to be the biggest problems faced by the cities in the future both on account of the above factors as well as other factors like rising costs of energy. Water management is going to be critical in the future because more rainfall in short, intense spells means more run-off. Urban population growth without adequate provisions for water, increasing per capita water demands are already leading to ground water exploitation through individuals and communities. Water scarcity is also an issue as some cities like Bangalore, Hyderabad and Indore pump their water from distant sources (and from lower altitudes), and it remains to be seen whether the municipal corporations can contend with the steadily rising energy costs. Other than water scarcity, there is likely to be problems with water quality. Most cities do not have sufficient sewerage network and sewage treatment leading to increased pollution of groundwater. Some places like Pondicherry and Surat are already experiencing some degree of salt ingress. Sea Level Rise: India has an extensive low-lying densely populated coastal zone and hence any rise in sea level rise is likely to result in various problems like loss of land, ingress of salt water and ground water contamination. The coastal zone is densely populated and many large cities are located on the coast, especially in the western coast. Some cities are likely to get partially submerged if the sea level rises. According to a study led by International Institute for Environment and Development (IIED), India has the second largest (after China) population in the Low Coastal Elevation Zone1. It has nearly 6 percent of the world’s population in the LECZ zone. The stretches along the western Indian coast that are most vulnerable to SLR are Khambhat and Kachchh in Gujarat, Mumbai and parts of the Konkan coast, and South Kerala. Low lying parts of the deltas of the Ganga, Krishna, Godavari, Cauvery and Mahanadi on the east coast are expected to be lost, along with significant settlement areas and irrigated land and a number of urban settlements that are situated there (McGranahan, 2007).
Cyclones and Storm Surges: The east coast of India is more at risk as the frequency of cyclones is more in the Bay of Bengal than the Arabian Sea but it is West Coast that is dotted with some of India’s most populated and big coastal cities. The problem is compounded by huge amount of investment along coastlines in some coastal cities, without sufficient forethought about sea level rise and cyclone. Environmental Health Risk: It is projected that malaria is likely to persist or increase in Orissa, West Bengal and southern parts of Assam, bordering north of West Bengal. However, it may shift from the central Indian region to the south western coastal states of Maharashtra, Karnataka and Kerala. Also the northern states, including Himachal Pradesh may become malaria prone in the future climate change regime. The duration of the transmission windows
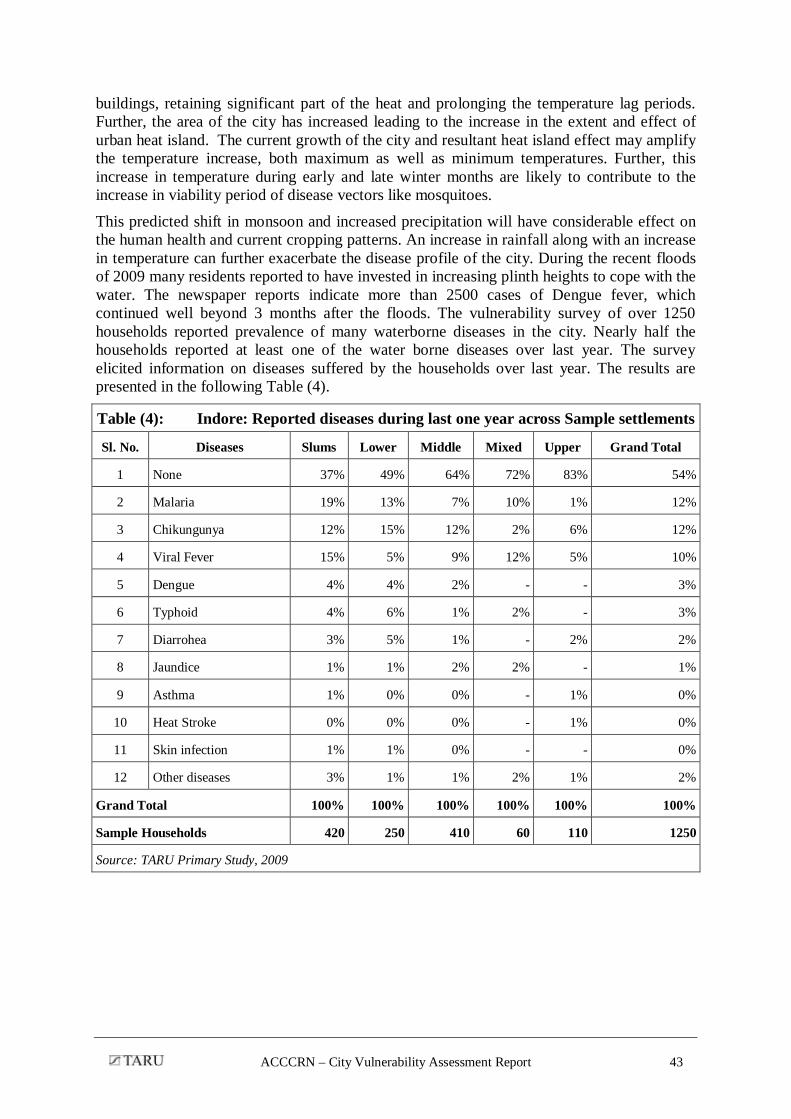
is likely to widen in northern and western states and shorten in the southern states (Bhattacharya, 2006). While the total number of population affected may not increase substantially, the shifting patterns are likely to increase the vulnerability of the populations at risk in new areas. Moreover, there is every possibility of water borne diseases increasing in the vulnerable populations due to prolonged water logging, especially in the cities with poor drainage and sewerage. More detailed studies on exploring these linkages are required.
Migration: Droughts, changing crop patterns, loss of livelihoods etc. are likely to result in huge migration from rural to urban areas. This might lead to further stress on urban infrastructure and services that are already spread thin. A bulk of this population is likely to be the poor who will migrate to cities in hope of getting absorbed into India’s large informal sector (Revi, 2008). The recent published India-Urban Poverty Report (2009) finds that the incidence of migration in India has shown an increase since 2001 as compared to consistent decline during 1961-1991. The economic motive remains the main reason for migration among male interstate migrants. Economically backward states keep losing people to developed states. Poverty incidence was found less among urban to urban migrants as compared to non-migrants, but it was higher among rural to urban migrants. Even though, middle and higher income groups show higher propensity to move, their numbers are larger than the poor migrants. The most successful group of migrants is urban to urban migrants in terms of type of occupation they have and their income levels due to better education and skills they possessed. Influx of migration towards metropolitan cities indicates that economic reforms have not been able to create much employment opportunities in small and medium towns and in rural areas.
In India, the critical populations and elements most at risk in a typical city are:
slum, squatter and migrant populations resident in traditional and informal settlements, which are often located in the most vulnerable locations;
industrial and informal service-sector workers, whose occupations place them at significant risk, which is then accentuated by additional stressors such as climate change;
buildings, especially traditional and informal housing stock, that are especially vulnerable to wind, water and geological hazards;
industrial units, their in-house infrastructure, plant, machinery and raw materials;
lifeline public and private infrastructure, which includes: roads, bridges, railways, ports, airports and other transportation systems; water, sewage and gas pipelines; drainage, flood and coastal defense systems; power and telecommunications infrastructure and critical social infrastructure such as hospitals, schools, fire-service, police-station and first responder’s infrastructure;
the natural environment, especially including wetlands, riparian, estuarine and coastal ecosystems, surface and groundwater systems (Revi, 2007).
ACCCRN – City Vulnerability Assessment Report 17
3 VULNERABILITY ASSESSMENT
3.1 Objectives
Main objective of the vulnerability assessment is to understand different facets of risks and quantify the components of vulnerability across the study cities to inform adaptation framework focused on poor and vulnerable urban residents.
3.2 Components of vulnerability in urban context
The Sustainable livelihood framework provides a sound basis for analysis of vulnerability. It defines five capitals which control the livelihoods of poor namely physical, human, financial, social and natural capitals. While SLF has been extensively for rural conditions, it can be adapted to urban context also, with few modifications.
In the current vulnerability analysis, the SLF has been modified with three most important capacities including income stability, education (proxy for human capital) and Social capacity. Similarly the major components were used for defining vulnerability namely: Physical infrastructure access, loans or lack of insurance and location based vulnerability to resources/risks as either flood/water logging (in case of Surat) or water scarcity (in case of Indore). The capacities were separated from vulnerabilities since the former provide the resilience while the latter increase the impacts during slow and fast onset disasters. The following Table (1) presents the set of indicators used in the study.
The main purpose of using capacity vulnerability indicators were to get a comparative situation across the samples and homogenous polygons using available information from the household and community level surveys. The following Table (2) presents the survey data sets used to calculate the capacity and vulnerability indices
Table (2): Data sets used for deriving capacity and vulnerability indicators Indicator Data used Weightage Comments
Education index
Maximum education in the household and aggregated as average community level
Low weightage up to 10th standard, then increase rapidly with 10 for postgraduate/professional level
Higher levels of education increases capacity to earn and also empowers next generation to benefit from education
Income Per capita income, ratio of Equal weightage to all three Income stability provides
Table (1): Set of Indicators Sl. No.
Livelihood capitals Proxy indicators used Comments
1 Human Education Capacity
2 Social Social networks and access Capacity
3 Financial Income stability (size of incomes, ratio of stable incomes to total, dependency ratio) Capacity
5 Natural Water scarcity (separate from infrastructure)/floods Vulnerability
Source: TARU analysis, 2009
ACCCRN – City Vulnerability Assessment Report 18
stability index stable and unstable incomes, dependency ratio.
factors resilience during disasters, and ability to invest in adaptation
Social capacity index
Existence of community groups in settlement, membership of households in these groups, access to political leadership, benefits derived
Equal weightage to all four factors
Capacity to acces the network critical in group level resilience
Loan and insurance vulnerability index
Loans taken, Lack of insurance Equal weightage Higher the loans, the households will not be able to invest in adaptations, Lack of insurance results in most of the damages borne by the household, which can put back the household finances for long period.
Physical infrastructure vulnerability
drainage, sewerage facilities within the settlement
Scores for different types of drainage and sewerage
Lack of drainage and sewerage increases risk of floods
Water scarcity (Indore only)
Number of water supply sources, Average lpcd collected, Max distance of source during scarce period, Water supply frequency, time required for water management during scarcity
Equal weightage Provides a snapshot of scarcity situation
Water logging/ flood vulnerability ( mainly for Surat)
Distance from flood prone river, depth of inundation during last floods, duration of inundation
Equal weightage Provides snapshot of flood/waterlogging events faced by the household as well as possible risk.
Source: TARU analysis, 2009
The details of Scoring is provided in the Annexure (B)
3.3 Methodology and tools
GIS enabled sampling and aggregation method was used to analyse the vulnerability. This method pioneered by TARU in Lucknow for infrastructure and services deficiency analysis was adapted for the Vulnerability analysis. This method involves delineation of the whole city in to homogeneous polygons based on roof types, density, road width and other visually distinct parameters. For example, in Indore 945 polygons were drawn with average polygon area of 10 ha. Latest satellite imagery of 1 m resolution was used to draw the polygons in a GIS platform. Attributes including, type of houses average number of stories, type of resident socioeconomic classes were collected through a GPS enabled reconnoiter across the whole city. The basis for visual interpretation method is presented in the Annexure (C). Samples were selected based on these attribute data.
Household and community level surveys were conducted to elicit information on various issues covering household size, member details, occupation, incomes, expenditure, water, sewerage, and electricity solid waste collection infrastructure, assets (vehicles, appliances), health, floods water scarcity and other common risks, coping strategies etc.
ACCCRN – City Vulnerability Assessment Report 19
FIG. (2) : GIS BASED VULNERABILITY ANLAYSIS FRAMEWORK
Source: TARU Analysis (2009)
Along with the household and community survey, a small area (Geopsy) was sampled to obtain density of households as well as basic infrastructure details. The outputs from the analysis were used to aggregate the household survey results to the polygons and to comparable polygons in the neighborhoods. This aggregated data can be done at various levels upwards, starting from polygon to administrative divisions or city levels.
3.4 Sample Coverage
In each of the two cities, about 1000 households and 100 settlements were covered under the survey. These samples were fairly distributed across socio economic classes over space. The GIS based aggregation provided universe estimates of households in the city area covered under the study. The original sample size of the survey was stratified with about 30% slums 30% lower class, 35% middle and mixed class and 5 percent upper class. This was done purposively to focus on slums and lower class. The aggregation of analysed data was done with GIS using homogeneous polygons, which matches well with reported total city population. The overlay of notified slum locations over the homogeneous polygons indicate that a significant proportion of the lower class are included under notified slums. An area once notified as slums, the official classification generally does not change despite some improvements in housing and services. Review of Urban Social Vulnerability assessment tools
Much research has gone into the assessment of urban vulnerability since the last decade. Vulnerability in urban area is defined by several parameters including livelihoods, key assets like houses and vehicles, literacy and skills and access to infrastructure and services. These parameters also define the resilience capacity of the households and communities. There is large diversity in these parameters among the households. In addition to this, changes in overall pattern of the city define the vulnerability, where the occupational or the business character of the city continually evolves. Distinct spatial trends can often be seen due to agglomeration of households based on their incomes and livelihoods, especially in rapidly evolving developing country context.
ACCCRN – City Vulnerability Assessment Report 20
The International Federations of Red Cross and Red Crescent Societies played a pivotal role by recognizing the importance of social vulnerability assessment and started a program called “The Vulnerability and Capacity Assessment”. After 1999, they realized the necessity of defining vulnerable people in their studies, and proved to be pioneering in taking it to the ground level. The urban vulnerability analysis framework is still evolving and need significant contextualization of parameters and indicators. The progress over last decade in the approach is presented in the following Box (4).
Box (4): Evolution of vulnerability assessment methods Cutter in his paper while doing the literature review of the vulnerability understanding and the impact assessment methods has mentioned the gradual evolution of the understanding of vulnerability. The political ecology perspective emphasizes the social, economic & political pressure faced by the individual which ultimately decides the coping ability towards different hazards. The pressure and release model suitable more for descriptive analysis rather than empirical testing insists on deep understanding of the vulnerability from root causes which further interacts with the natural events. The hazard of place approach is considered more suitable for empirical testing and the use of geo spatial techniques. This approach includes both exposure and the social vulnerability in its analysis and relationship change over time and across space. The vulnerability/ sustainability framework suggests and alterative measure of vulnerability, wherein the vulnerability to global change is assessed through local vulnerabilities. This approach has been considered to be suitable for qualitative assessments.
Source: Cutter et.al (2009)
The above mentioned models and approaches have played a pivotal role in shaping the vulnerability assessment methods in practice at present.
The IPCC Third Assessment Report (TAR) describes vulnerability as “The degree to which a system is susceptible to, or unable to cope with, adverse effects of climate change, including climate variability and extremes. Vulnerability is a function of the character, magnitude, and rate of climate variation to which a system is exposed, its sensitivity, and its adaptive capacity.” (IPCC, 2001). The second definition is in little conflict with the first definition suggested by IPCC which says, “degree to which a system is susceptible to injury, damage, or harm (one part - the problematic or detrimental part - of sensitivity)”. Collection of data especially relating to the vulnerability assessment does not fall within the scope of the National decadal Census survey or any other survey done by the government in India. Over a decade, the structure and composition of the city changes (e.g. 60% decadal growth as noticed in Surat) as well as the vulnerability of the population. The availability of the secondary data is a huge plus though, for the GIS part, but capturing the complete urban vulnerability needs quantitative and qualitative surveys to collect real status at the ground level through sample surveys. Moreover, social vulnerability is very difficult to be quantified in terms of absolute or real values. These issues can be addressed to a certain level by developing indices for different variables covering detailed aspect of the various factors affecting the household and community at large. City level urban vulnerability research was mostly limited to developed countries where formal mechanisms for collection of property and social data exist. The country and global level assessments were some of the first efforts done by various authors (Revi, 2008, Satterthwaite, 2008). Mostly the published literature about city level vulnerability assessment is descriptive and is not very useful for city level planners (Wilbanks et al., 2007). While research on urban vulnerability has made fundamental contributions to the exploration
ACCCRN – City Vulnerability Assessment Report 21
of different types of vulnerabilities and the causative factors that are embedded into broader structural and political conditions, understanding evolution of vulnerability across space and time requires more effective tools. It does not, for instance, address how exposure to changing hazards evolves over time (Lankao et al., 2009).
Review of the literature suggests that vulnerability is understood to have two sides. First side is the external side of risk, shock or stress to which an individual or household is subject to; and the other side is the internal side which is defenselessness, means lack of coping without damaging loss (Haki et al., 2004).
One of the most important considerations, which all the vulnerability assessment methods found difficulty in addressing, is to use the outcome of these vulnerability assessments and using them to develop adaptation/risk mitigation plans to match real ground level issues in the urban areas. Moreover, methods for aggregating vulnerability from neighborhood level up-wards (especially in developing country context) are only beginning to emerge. So the decision makers at city level have no ready-made analytical tools for understanding or designing adaptation measures focused on ground level and are left with only option of using their qualitative knowledge. So quantifying the costs and benefits become a major issue for the decision makers. The application of vulnerability analysis requires the integration of neighborhood level information on human, environmental and social parameters ranging from household to neighborhood levels and aggregation to city administrative subunits and city level. Also, ecological factors like terrain, distance from natural drainage that are embedded in the landscape contribute in different ways to the overall vulnerability pattern that modify risks as well as service levels (e.g. through water supply, drainage). These ecological factors reflect, in varying degrees, people’s resilience and ability to cope with and recover from losses. They also provide a means to understand differential vulnerability within and between urban places. These ecological factors are variable and modify the vulnerability, they do not hold a constant relationship among themselves, no two urban places are likely to be found that are identical in their vulnerabilities (Rashed et al., 2007). This makes the development of any single vulnerability assessment uniformly applicable to all the urban areas lying in a variety of ecological, social and economic contexts ineffective. Significant efforts are necessary for developing city specific indicators within a single generic framework. The five capitals defined under livelihoods framework provides such a platform. Since connection between urban livelihoods and natural resources is highly diverse, significant city level modifications are necessary for exploring natural capital related risks.
The present Vulnerability assessment by TARU has tried to amalgamate the issues from the field, and has tried to bring realistic methodology into analysis, starting from the household to community level to aggregate the results to the administrative zone and city levels. Starting from sum to parts (through RS and GIS methods) to select the representative samples followed by exploration of vulnerability from households upwards (from parts to sum) and validation of the key variables like population at city level are the key strengths of this method. Methodology Stakeholder Consultations to understand urban vulnerability patterns and validate methods
A series of one on one consultation were held with various city stakeholders in each of the cities. Regular city advisory committee meetings were also held at each of the cities meetings to exchange information regarding climate change risks, the key uncertainties and city level resource, infrastructure, services and vulnerability issues. These consultations provided
ACCCRN – City Vulnerability Assessment Report 22
opportunities for exchanging and updating information at various levels. Household and community level questionnaire were developed by the team and shared with the stakeholders and their comments were sought for improving the quality of questionnaires. The questionnaires are provided in the Annexure (M), (N) & (O).
The climate projections were discussed in the CAC meetings with description of uncertainties that can be expected due to the limitation of models and the level of knowledge about climate especially in areas without sufficient past data. The CAC also discussed their experience about the changes during last few decades. For example in Indore the CAC members mentioned about past pattern of rainfall dominated gentle showers for days, while now they face heavy downpours. They also reported about the pleasant evenings of Indore known as Shab’e’ Malwa, while now the summer nights are hot and unpleasant. Risk assessment
Risk assessment was done based on past event history from household surveys and validated by flood submergence maps of the city. Also potential areas prone to storm surges and high tides were derived from Shuttle Radar topographic mission elevation data of the undeveloped parts of Surat. The past temperature and precipitation data from IMD was used to understand the past trends. The IITM’s HADRM3 model data as well as CCMA and HADRM3 downscaled data was obtained from Climate change explorer (Wikiadapt 2009). Detailed description of the climatic models and findings are presented in a separate section. Vulnerability analysis and temporal issues
Remote sensing data is a good tool to derive information about the physical composition and spatial structure of the built environment in urban areas, especially in developing countries. This information reflects aspects of the socio economic categories. Land is the one of the scarce commodities in a city, which poor are not able to afford. The building density, pattern and road width are some of the indicators that can be used for distinguishing a poor settlement from the upper income settlements.
The built environment, represented by the homogeneous objects with fairly discernible boundaries, reflects the socio-economic environment producing a mosaic of the city. These categories are well reflected in high resolution imagery with resolutions better than 2 m (for discerning smallest house with of about 3m X 3m or larger), especially in the context of crowded housing patterns common in slums and low income groups. The classification of the urban environment on the basis of the classifying features (See ANNEXURE (C)) is an indication of the preliminary understanding of the risk especially looking at the income class, and distance from the hazard source in the urban environment. Classified land cover classes were apparently representative of the all the households residing in the settlement. In this exercise, Google Earth imagery (1m spatial resolution) was used for delineating homogeneous areas based on texture, pattern, building densities, roof types and road network distribution. Visual interpretation techniques were used and further refined by reconnoiter. These polygons indicate homogeneous settlement types. Similar method has been used by various authors for deriving urban poverty across the cities (Slluzas & Cooper 2008, Ebert& Kerle 2008). This object oriented analysis from 1 m resolution RS imagery is able to delineate areas/neighborhoods which are likely to be populated by fairly homogeneous socio economic groups. Reconnoiters were done to building use and, building heights and other key indicators. Based on the findings, the neighborhoods were reclassified by dominant type of usage and building heights.
ACCCRN – City Vulnerability Assessment Report 23
In each type of objects across the city, representative geopsy1 transects were selected and key indicators like population density, infrastructure and service levels were explored by community level survey instruments. A set of household questionnaires were also administered to understand the several indicators for analysing different facets of vulnerability based on livelihood framework. The household level questionnaire included expenditure pattern, asset ownership, quality of water supply, sewage and electricity infrastructure and services, losses from various disasters, disease pattern (water and vector borne), knowledge about advance warning, livelihood pattern etc. In case of diseases, water supply and electricity, exploration was done on temporal pattern of service availability. Capacity and vulnerability indicators
For the purpose of analyzing the vulnerability (3 indicators) and capacity (3 indictors), a total of six indicators were selected. These indicators depend on a set of key sub-indicators and mostly equal weights were given to each sub-indicator. This method reflects different facets of vulnerability as well as effective in comparing differential vulnerability across SECs and space. Detailed calculation methods are provided in the Annexure (B). Since each of the indicators is presented separately, the adaptation plans can be developed to address each facet of vulnerability separately to achieve desired minimum benchmarks. Infrastructure Deficiency analysis
Infrastructure deficiency analysis was done based on the Geopsy transects and aggregation. Water supply, sewerage and drainage were mainly covered. The data was aggregated to city level using the methods already explained earlier. The spatial distribution of infrastructure and service delivery is presented in set of indicators and maps. The infrastructure and service delivery analysis data was used to develop one set of vulnerability indicators. Spatial data aggregation and map generation
Data aggregation was done from household level to polygon levels. From the polygon level, population density and indicated data was transferred to nearest similar polygons by distance query using GIS. These polygon level population data was used to aggregate city level vulnerability indicator outputs.
Conclusion and remarks The vulnerability analysis through indices in a GIS platform opens up avenue for spatial analysis as well as place and SEC specific adaptation processes. Availability of high resolution RS imagery (better than 2 m) opens up potential to use both detailed as well as synoptic view of the city and to categorize areas based on building and infrastructure coverage. This methodology can be improved further by integration of additional context/city specific indicators. It is also possible to incorporate the people’s perception of the risk and risk culture of local population, as well as include participatory methods at neighborhood levels to improve analysis and at the same time improve targeting of interventions based on local contexts. Though there is scope for improvements, the proposed methodology has taken a leap forward in establishing vulnerability (especially in urban context). This method provides a combination of synoptic as well as location specific vulnerability with a combination of lab (GIS) and on the ground assessments, which is a significant improvement over current methods totally depending either on participatory techniques (providing only micro picture of a settlement without quantitative estimates at city level), or GIS based techniques (Synoptic picture without ground level livelihood and risk information). This 1 Geopsy is a small area covered by buildings on both sides a stretch of 50 to 100 m depending on building density. Geopsy is selected representing the average density of the polygon. About 25- 50 buildings are covered in each geopsy.
ACCCRN – City Vulnerability Assessment Report 24
provides a cost effective tool for exploring different aspects of vulnerability and evaluating the risk and possible losses.
ACCCRN – City Vulnerability Assessment Report 25
4 INDORE – CITY PROFILE
4.1 Introduction
4.2 Location and Access
Indore is the most prominent city of Madhya Pradesh State and the district headquarters of the district. It is situated on the western part of the Malwa (Deccan Plateau) on the banks of two small rivers, the Khan and the Saraswati. Indore is 17th among the 23 million plus cites of India enumerated in the 2001 Census. The city is situated on fertile Malwa Plateau located at 220 43’N latitude and 760 42’E longitude. The city is located at an average altitude of 550mts above MSL.
The city is linked by three modes of transportation. viz. road, rail and air. Regional road pattern fans out in all directions connecting nearby industrial areas and towns within the district.
4.3 Geographical features
The city has a municipal area of 134 sq.km and lies in Khan river basin. The river and its tributaries traverse through the densely populated areas of the city. The city occupies a relatively flat plateau having a gentle slope towards the north. The hinterland of the city is scattered with some hillocks. To the southeastern side is the Pipaliyapala tank and towards the southwest is the Sirpur tank. The highest and the lowest contour levels in the city are 590m and 540m respectively. The city has a black cotton soil varying in depth from place to place. The cross section at various places show an order of soft soil till 5ft, hard soil still 15ft, red soils till 30ft and after this the rocky terrain extends upto 100ft below. Climatic Conditions
Indore has a transitional climate between a tropical wet and dry and a humid sub-tropical climate. Three distinct seasons are observed, summer, monsoon and winter. Summers start in mid-March and can be extremely hot in April and May. The highest temperature recorded was 48 °C in 1994. Average summer temperature may go as high as 42-44°C but humidity is very low except during rainy seasons. Due to Indore's location on the southern edge of the Malwa Plateau, a cool breeze (also referred to as Shab-e-Malwa) in the evenings makes summer nights quite pleasant. The monsoon season starts in late June, with temperatures averaging around 26 °C (79 °F), with sustained, torrential rainfall and high humidity. The average rainfall is 900mm with high coefficient of variability. Winters start in mid-November and are dry, mild and sunny. Night temperatures average about 4-15 °C (40-59 °F), but can fall close to freezing on some nights. In summer, temperature can be sometimes as high as 45-48 °C and in winters it can be as low as 2° - 3°C. Off late it has been observed that the summer season is extended for couple of weeks and the pleasant cool breeze in the evenings has faded over. The city is also witnessing sudden downpours leading to floods and water logging in the city.
Natural resources and issues of access Water is among one of the main resource of the city. The first water supply system in Indore used natural water tanks (At Bilawali) until the Yashwant Sagar dam on river Gambhir was constructed in 1939. As per the City Development Plan of Indore, Yashwant Sagar dam now provides IMC with 27MLD of water in addition to 4MLD from the Bilawali Tank. Ground water supplies about 13 MLD through 1,550 motorized tube wells.
ACCCRN – City Vulnerability Assessment Report 26
The most important source of water for the city of Indore is the Narmada Water Supply Project which is pumped about 70 kms. The estimated water availability for the city is of the order of 199.5 MLD at maximum and 171 MLD at minimum to serve over 1.5 million population. The actual situation is much less with estimated per capita availability of around 84 lpcd at maximum and 72 lpcd at minimum. The water supply in the city is unsatisfactory on account of high losses and inefficiencies in the system (Dzikus, 2003).
The growth of urban population, estimated at 4% to 5% per annum, has significant influence on water demand and exerting pressures on the available water sources, leading to over exploitation of groundwater resources. Around 68 per cent of city’s population receives water between one or two hours every alternative day, while the other areas augment supplies by private water tankers and government and private borewells. The market forces have grown stronger replacing the usual mechanism of water provision by the municipality. Unaccounted for water (UFW) as per IMC is not less than 50%. This takes into account of leakages and wastage, losses in transmission, unauthorized connections etc. The Narmada Phase III is under implementation and the project is expected to increase Narmada Water Supply to a tune of 365MLD from current 180MLD. The project is planned ambitiously and the CDP report of Indore states that the project planned will fulfill the requirement of the population of 2039, whereas it is hard to believe the projections-given the current trends in water management by the stakeholders/citizens and the overriding climate change phenomena. If one observes the current issues, the water supply problem in the city of Indore is attributed more to the lack of infrastructure and current management practices rather than lack of water availability (Dzikus, 2003).
4.4 Demography
The population of the city increased from 57,235 in the year 1911 to 1.6 million in 2001 as shown in Table (3) below:
Table (3): Population Trends Year Population Area MC
(Sq.km) Decadal
Variation Population Density
(p/sq.km) 1901 99,880 - -
1911 57,235 - -42.7 -
1921 107,948 - 88.6 -
1931 147,100 - 36.27 -
1941 203,695 - 38.47 -
1951 310,859 - 52.61 -
1961 359,000 55.8 15.61 6,433.6
1971 572,622 - 59.60 -
1981 829,327 - 44.68 -
1991 1,104,000 130.1 29.86 8,481.2
2001 1,639,000 130.1 48.46 11,857.2 Source: Census of India 2001
On an average, the growth rate has been of the order of 40%. Thus the average population growth increase for Indore has been higher as compared to the national growth rate (@22%), which can be attributed directly to rapid urbanization of the city. It is observed that the
ACCCRN – City Vulnerability Assessment Report 27
increase in population of 1991-2001 has been phenomenal. This is attributed to the industrial and commercial development in the Indore planning area. The population projections for the Indore planning area for the year 2011 shall be 2.53million and 3.67million in 2021. In the next 15 years population of Indore will increase by about more than 1.5 times (Population projections referred from IDP 2011 draft). The city experts anticipate numbers beyond the projections mentioned for the year 2011.
Population density ranges from 100 persons/ha in the peripheral areas to as high as 1028 persons per ha in the core of the city. Migration is another dynamic factor which is catalysing the future population growth of the city. There are no direct figures which suggest the migration rate or its pattern. A large number of people from small and medium towns come to Indore in search of jobs and livelihoods. These trends have not been studied and therefore in many of the projections these numbers are not accounted. This increase of population growth in the city has tremendous impact on the housing needs and provision of basic services, especially to the poor.
Indore has a large floating population due its strategic location, educational and medical service sector, and being the only major city in the Western Madhya Pradesh. The hinterland includes some of the poorest, hilly areas with large proportion of tribal population. With low literacy rates and skill levels, these rural migrants are unable to command sufficient wages and are forced to stay in slums. As per the real estate planners, About 100,000 additional houses annually are required to meet the growing housing demands of the city. This amounts to nearly half a million population requiring housing, which may include people wanting to renew their houses along with new demand. If the city continues to grow at 48% or more per decade, water crisis will be perpetual over the next couple of decades, unless the whole water supply infrastructure is revamped and water recycling is done to meet part of the low end demands. Since Indore is also a major industrial hub in western India, the industrial demands’ are also likely to increase to create competing demand.
4.5 Economy
Indore's main trade is in cotton textiles, chemicals, machinery, iron and steel, food and edible oil, confectionery, paper and straw board, RCC pipes and poles, machine tools and accessories, electrical machinery and appliances, electronic goods, pharmaceuticals, snacks and educational services. IMC has estimated 47,956 registered establishments (2000). The maximum establishments were of food (28%) followed by commercial services (15%) and textile and cosmetics (12%) respectively. There are about 250 banking and insurance establishments, more than 7,000 hotels and restaurants, around 80 hospitals, 1670 educational establishments and nearly 80,000 registered shops.
There are two main industrial areas outside the city. Pithampur to the south and Dewas to the northeast. There are about 120 large and 480 small and medium units in this estate and this has a considerable impact on the city’s economy. These industries are capital intensive and high-tech. There are three main industrial areas within the city – Sanwer Road, Polo Grounds and Udyog Nagar with 1272, 137 and 67 small, medium and large units respectively. The dominant sectors are engineering, pharmaceuticals, fabrication and food processing. A large number of these units are dependent on water for their processes.
ACCCRN – City Vulnerability Assessment Report 28
4.6 City Governance and Institutional mechanism
The state government of Madhya Pradesh has been a pioneer in terms of progress on decentralization. Since the passing of the 74th amendment in 1992, the State passed the conformity legislation in 1993, conducted three rounds of elections to the local governments and has been the front runner to constitute and implement the recommendations of the State Finance Commissions. The 74th amendment gave the local bodies a constitutional status and assigned them a large number of functions, ensured more stability, provided a framework for function with greater freedom and also made institutional arrangements for devolution of financial resources. The agencies involved in urban management and development of Indore are: Indore Municipal Corporation
The city of Indore had the first municipality in 1870. Trade and commerce were given leverage to strengthen the city economy to ensure a positive growth. A series of efforts were taken up in terms of mapping, energy generation, master planning till it was declared as a municipality. In the year 1956, it was declared as a Municipal Corporation. The functioning of the IMC is governed by the Madhya Pradesh Municipal Corporation Act, 1956. The organization set up of IMC compromises of a Political Wing (deliberative) and Executive Wing. The Deliberative Wing is an elected body of Councilors from different wards in the city and is headed by the Mayor.
The Executive Wing is headed by the Municipal Commissioner and looks after the functioning of the Corporation and assists the Deliberative Wing in the decision making process. The Deliberative Wing of IMC is headed by the Mayor and overall functioning of the corporation is governed by Mayor-in-Council and the Departmental Advisory Committees constituted by the speaker from amongst the Councilors other than the members of the Mayor-in-Council. The organization structure of the Deliberative Wing of IMC is presented in Fig. (3) below.
ACCCRN – City Vulnerability Assessment Report 29
FIG. (3) : THE ORGANIZATION STRUCTURE WING OF IMC
Deliberative Wing
Executive Wing
Source: CDP Indore
ACCCRN – City Vulnerability Assessment Report 30
For the purpose of better administration and delivery of services to the public, the area within the IMC is divided into 14 Zones manned by a Zonal Officer. The Zone Office performs the following functions (Health and Sanitation, Water Supply, Property Tax assessments and collection of Taxes, Lighting and General Administration).
Indore Development Authority In order to assist the municipal body in its developmental activities, Indore Development Authority was formed in 1973 under the Town and Country Planning Act of the state (1973). Primarily IDA develops new residential areas and developing of basic infrastructure. Once a sizeable number of plots are sold, the area is formally handed over to IMC. IDA also takes up a number of development schemes like construction of major roads, traffic squares, public gardens, lake development etc. The Commissioner of IMC is the ex-officio member on the board of IDA.
Other key departments include:
Madhya Pradesh Public Works Department
Madhya Pradesh Pollution Control Board
Madhya Pradesh Housing Board
Public Health engineering Department
Indore Development Fund Ltd
District Urban Development Authority
Madhya Pradesh Town and Country Planning Department
Krishi Upaj Mandi Samiti, Indore
Indore City transport Services Ltd Issues of Autonomy and capacities
It is worthwhile to mention that IMC had embarked upon a modernization plan with extensive citizen participation, to increase revenues and improve urban services a decade ago. The increase in municipal services under the Financial Institutions Reform and Expansion – Debt (FIRE-D) is highlighted in the Box (5) below.
ACCCRN – City Vulnerability Assessment Report 31
Box (5): Increasing Municipal Revenues: Case of Indore
Indore, with a population of 1.6 million, is the largest city in the state of Madhya Pradesh. Six years ago the corporation embarked upon a modernization plan, developed with extensive citizen participation, to increase revenues and improve urban services.
The IMC entered into an agreement with the FIRE-D project in 2000 to help it mobilize resources needed to meet them. The measures described below increased revenue from its own sources from Rs 34 crore in 1999–00 to Rs 75 crore in 2003–4. Total revenue increased correspondingly from Rs 101 crore to Rs 184 crore, thus, reducing its dependence on state transfers to provide municipal services.
Increasing Revenues
The IMC’s own sources of revenue are primarily property taxes and water tariffs, with smaller amounts from business licenses, shop rents, and advertisement, taxes.
Property tax improvements: To reform its property taxes, which average almost 50 per cent of the city’s own source income, the IMC shifted to a simpler, mass assessment method and introduced self-assessment of properties by taxpayers in 1997. Taxpayers provide information about their property, such as its location, size, age, and use, into a formula-based program that calculates what they owe. The IMC contracted with a private firm in 2001–2 to conduct a physical survey of properties in all wards to identify unregistered properties and add them to the property database. The surveyors also helped owners fill out their self-assessment forms. The number of properties registered nearly doubled in four years, from 135,000 before the survey to 236,000 in 2003. Revenues increased due to simplified and more equitable assessments, better administration, increased coverage and billing, and more efficient collections and enforcement (described below). Complementary measures, such as verifying tax records at registration when properties were sold, and requiring that payments be made by 31 December helped. In addition, assessment rates, especially of commercial properties, were revised after a considerable period.
Water charges improvements: It was estimated that there were approximately 80,000 illegal water connections, compared to 120,000 legal connections. The IMC identified legal/illegal water connections during its physical survey of properties. It compared its water charges and property databases to identify residences that were not receiving or paying water bills. And it calculated arrears owed. The IMC improved collections and enforcement.
The following steps played important role in turning around the municipal finances.
Leadership: Strong and sustained commitment of political and executive leaders was the critical element of Indore’s success. The city’s first directly elected mayor, demonstrated leadership by starting the citywide visioning process that resulted in a modernization plan supported by the citizens. The municipal commissioner’s demonstrated leadership by initiating the reform process and working through the comprehensive administrative changes required to make the tax administration process efficient and transparent.
Computerizing and comparing databases: Making progress requires accurate baseline data and consistent tracking. The IMC contracted with a private data operator of Indore in 1998–9 to make the technology changes to improve tax administration quickly and effectively. The firm, under a type of build-own-operate-transfer agreement, set up new computer systems and created taxpayer and property databases. Databases were designed in compatible format so they could eventually be linked to each other. Cross-checking data from different sources helped strengthen billing and collection. The system was designed to facilitate collections; taxpayer information could be accessed in zonal offices.
Restructuring the Revenue Department: To strengthen its collection efforts, the IMC brought all billing and collection together in one department, removing them from the functional departments, in 2002. The city then reorganized the Revenue Department into two new departments: the Assessment Department and the Recovery Department. A Vigilance Team was constituted under the Recovery Department. Three smaller departments, Survey, Encroachment and Markets, were also created. At the same time, the IMC decentralized collections by introducing cash collection counters in the 11 zonal offices and strengthened collection by staff in the field. People-friendly collection systems helped motivate citizens to pay taxes.
Training staff and building capacity of local officials: The IMC, developed a training programme for elected representatives and all staff of the Assessment and Recovery Departments. The course covered the role and functions of the Revenue Department, duties and behaviour of staff, the property tax assessment system, an online computer exercise on tax assessment, legal issues in assessment, and control and coordination.
Source: India Infrastructure Report 2006
ACCCRN – City Vulnerability Assessment Report 32
Financial powers rest with various authorities of the Municipal Corporation. Conditions have been laid down for the authority to exercise the powers and this has been described through an official noting from the Government (year 2005). The CDP report highlights certain issues pertaining to the Deliberative Wing, Executive Wing and key financial autonomy issues. Key issues are summarized below:
1. Inadequate coordination between Mayor-in-Council, Advisory Committees/General Body and Wards Committee.
2. There have been occasions where there has been no consensus among the General Body and the Mayor-in-Council regarding city-wide development projects aimed at improving the delivery of civic services.
3. No adequate administrative and financial powers have been delegated to the Ward Committees. Besides there is inadequate deployment of the staff in zonal offices thus making it difficult for effective project identification, budget preparation and execution of the tasks.
4. Several key senior posts were lying vacant and they remain to be filled with appropriate qualified/experienced personnel.
5. Municipal Commissioner has a large span of control on the activities. All departments and section heads report to the Municipal Commissioner thereby hampering effective supervision and control.
6. Individuals working in various portfolio of the organization are loaded with functions of varied nature thereby hampering the regular tasks.
7. Decentralization has not been based on a reorganization plan. Piecemeal efforts have been undertaken without devolving the roles.
8. Inadequate coordination between various departments of the corporation.
9. No feedback and monitoring system in regard to capital expenditure proposal that are sanctioned by the competent authorities.
10. Inadequate manpower and infrastructure support to execute decentralized functions. 11. Officers at zonal level don’t possess adequate financial and execution powers.
12. Absence of effective system/plan for communication of transactions between zonal offices and central office. Officers at Zone level are dispenser of higher-level authority orders.
The CDP report points out key financial autonomy issues. The report highlights that the limitations of IMC is coming more and more to light against the background of inadequacy of finances for serving the needs of serving urban communities. With the level of revenue and expenditure, even obligatory functions are being inadequately performed. IMC is reluctant or unable to tax people for the services and poor administrative capacity at the local level account for poor financial situation.
4.7 Community-Resource-Government-Market linkages
Indore city presents a diverse picture of; high and growing dependency on external water resources, community faced with perpetual shortages of water, poorly performing sewerage, drainage and solid waste collection systems, and emerging market to fill the service gap not catered by the ULB. The systemic problem in each of the nodes is evident by continued nonperformance of the services and weak uncoordinated reaction from the communities and
ACCCRN – City Vulnerability Assessment Report 33
patronage system trying to manage the process. Some of the strengths and weaknesses of the three important stakeholders are presented in the Annexure (D).
The linkage between the community and government (ULB) is weak resulting in communities attempting to cope with the status quo and deteriorating situations. Despite annual water scarcity reaching the emergency levels, the investments towards leakage reduction, that can provide additional water to the taps, is not administered. The communities have been passive most of the time but resort to violent protests during peak crisis. They have accepted alternate day supply for granted. Under the prevailing institutional environment, the line department based formal grievance redressal system is giving way to informal systems. The government market linkages are also weak as evidenced by delay in PPP projects for solid waste collection and sewage treatment systems. These projects have failed to take off mainly due to controversies and negative media exposure.
The community has resorted to markets to satisfy their needs through bore well drillers, private tankers, informal solid waste collection systems and water purification systems. In spite of this linkage growing stronger, markets are unable to provide quality services due to growing scarcity of local resources.
The community to resource linkage was strong when the city was small, with extensive use of surface and shallow groundwater sources. The urban growth and resultant increase in demand has mostly severed this linkage except ground water resources, which are increasingly becoming scarce and costlier.
FIG. (4) : LINKAGES SHOWING RELATIONSHIP BETWEEN RESOURCES, MARKET, COMMUNITY AND GOVERNMENT
Source: TARU analysis, 2010
ACCCRN – City Vulnerability Assessment Report 34
4.8 Climate change Scenarios for Indore
In order to understand the results of the global climate models (GCM) results it is much necessary to understand the purpose, the method and the data used for such models. It is also necessary to understand the uncertainties which are present within these data and the methods as they are mostly reflected in the results of the predictions. The Inter-governmental panel on climate change (IPCC) has been responsible for collating the research carried out by various scientific organizations and presents them through their assessment reports titled First, Second, Third and Fourth. Within these reports there has been a strong suggestion based on scientific evidence that human activities may already be influencing the climate. In order to understand the influence of various elements on climate it is necessary to understand the system that determines the climate of the Earth and of the processes that lead to climate change. According to the IPCC working group I, the terms climate and weather are most often used interchangeably, but within the science of climate variability and change both these terms have different definitions. “Weather” can be defined as the fluctuating state of atmosphere as we experience it on an everyday basis. This recorded over few years and evident variability in pattern is usually termed as climate variability. There could be several reasons for such phenomenon driven by long and short term processes and possible anthropogenic changes. Weather as such as been under constant change and even in spite of the advancement in the field of technology it is not possible to accurately predict the weather for more than 10 to 14 days. Whereas climate refers to weather over space and time i.e. it refers to the average weather in terms of the mean and its variability over a certain time-span and a certain area. Classical climatology provides a classification and description of the various climate regimes found on Earth, for example the tropics are hotter than the poles, indicates that a particular region on the face of the earth experiencing a certain type of climate which has remained constant over the years. This constant phenomenon has also lead to classifying the regions based on their locations and further classifying the climate of the regions into seasons. In the recent years, the anthropogenic effects are believed to influence the climate causing variability such as hotter summers, shift in monsoons, unprecedented snowfall, etc. Even though these have been witnessed to vary and are indicative of change, one can ascertain that the climate of a region has changed only after witnessing similar patterns within the climate cycles. This means for precipitation and temperature which are one of the several parameters indicative of the climate change can only be ascertained after recording and monitoring the variables for a minimum period of 30 years or more. Along with the recent global awareness of climate change, there has been a parallel effort undertaken by IPCC and other allied bodies to generalize the climate models both at the regional and the global level. Due to the complex nature of the climate and the variation in the data collection systems followed by different institutions and countries, this task has lead to the development of series of climate models. It should be noted that all these models are representation of the climate systems at large and each of these models have their own advantages and drawbacks based on the data used and modeling approach undertaken. These global circulation models (GCM) can be broadly classified into simple general circulation model (SGCM), Atmospheric GCMs (AGCMs), Oceanic GCMs (OGCMs) and Coupled atmosphere-ocean GCMs (AOGCMs). SGCM consists of a dynamical core that relates material properties such as temperature to dynamical properties such as pressure and velocity. AGCMs model the atmosphere (and typically contain a land-surface model as well) and impose sea surface temperatures (SSTs). AGCM contains a number of prognostic equations that are stepped forward in time (typically
winds, temperature, moisture, and surface pressure) together with a number of diagnostic equations that are evaluated from the simultaneous values of the variables. OGCMs model the ocean (with fluxes from the atmosphere imposed) and may or may not contain a sea ice model. AOGCMs combine the two models AGCM and OGCM. They thus have the advantage of removing the need to specify fluxes across the interface of the ocean surface. These models are the basis for sophisticated model predictions of future climate, such as are discussed by the IPCC. In our study to understand the climate change in the cities of Surat and Indore the AOGCM’s recommended by IPCC were used. Even though AOGCM is a general term due to the complexity of the data and the phenomenon there exists several sub models developed by various scientific institutions. As mentioned earlier, each of these sub models have their advantages and uncertainties. The series of model results that were analyzed within this study are: Canadian Centre for Climate Modelling and Analysis (CCCma), Coupled Global Climate Model (CGCM3), CNM CM3 the third version of the ocean-atmosphere model initially developed at CERFACS (Toulouse, France) and regularly updated at Center National Weather Research (CNRM, METEO-FRANCE, Toulouse), CSIRO, Australia’s Mark 3 also known as MK3, GISS Model E-R developed by Goddard Institute for Space Studies (GISS), NASA, USA, climate model 3 developed by Institute Pierre Simon Laplace (IPSL) also known as CM3, ECHAM5 developed by Max-plank institute of Meteorology. The selection of the model from these series of models was carried out by the process of gradual elimination. The predictions from these series of models were compared with respect to the global base data as observed/collected for the years 1949 to 2000 by the National Center of Environmental Prediction (NCEP). The results from these models and their variations for the city of Indore is presented and discussed in the following section.
Fig. (5) Indicates a possible variation in the current and future precipitation for the city of Indore. Two out of the three models predict likely decrease in precipitation of the order of 20 to 40 mm/month whereas the remaining three models predict an increase in precipitation of around 20 to 100 mm/month.
This variation among the models adds to the uncertainty and prevents from drawing any strong conclusions. Nevertheless, any decrease in the precipitation including a modest 20 mm to 40 mm/ month is likely to add to the already existing water problems within the city. This in relation with the future possible migration of population towards the urban areas is likely to unfold a scenario of water crisis within the city.
On the other hand, any increase including a variation of 20 to 100 mm/month will be seen as a welcome, provided this additional rain water is managed properly. This could be achieved by bringing about positive changes within the existing water management systems and awareness about how to conserve and efficiently use the water resources.
Fig.(7) and (8) illustrate the monthly rainy days and dry spell anomalies predicted by the four models for the city of Indore. The results from all the models except CM2 by GFDL are in similar to each other indicating an overall increase in the rainy days during the months of May to July. Figure (8) also indicates a possible decrease in the dry spell around that period. From this broad study one can infer that there is likely to be less variation in the distribution of the precipitation in the future scenarios.
Fig. (9) and (10) illustrate the minimum and maximum temperature anomalies. The results of the temperature variation according to the model predicted future scenario for the city of Indore are very similar to that of Surat. There exists uniformity within the results from the selected models with minimal variation. There is expected to be an increase in both the minimum and maximum temperature across all seasons with the maximum increase being around the winter and minimum increase during the monsoons. This may likely lead to a similar effect, as in the case of Surat, with the increased rate of survivability among the disease causing pathogens, for example malaria, well into the winters leading to possible increase in the health issues among the people. The increases in temperature are also likely to affect the winter cropping pattern (only those crops that are sensitive to the temperature). The increases in temperature during the summers are also likely to lead to the increased consumption of energy and increased stress among animals. This possible scenario may lead to an increase in production cost or decrease in yield. Nevertheless, these effects could be avoided through awareness and proper preparedness.
FIG. (9) : INDORE-AVERAGE MINIMUM TEMPERATURE ANOMALY (FUTUREA -CONTROL)
Source: Climate Change Explorer
FIG. (10) : INDORE-AVERAGE MAXIMUM TEMPERATURE ANOMALY
(FUTUREA -CONTROL)
Source: Climate Change Explorer
ACCCRN – City Vulnerability Assessment Report 38
In this study, a detailed analysis of CCCMA model results were used to compare the current climate (1969-2000) with the future predictions(2046-2065).
Precipitation Scenario The monthly precipitation of Indore with respect to the future estimated variation as modeled by CCCMA (global climate change model) is presented in the Fig. (11). The anomaly of variation is presented in the Fig. (12). From the results it is evident that the future precipitation is expected to increase on an average of 2 mm daily. This May likely lead to an overall annual increase in precipitation of around 300 mm as per CCCMA projections. The future estimation also suggests a shift in the rainy season. In Indore the rainy season is expected to commence early in May and would extend till late November.
FIG. (11) : AVERAGE DAILY RAINFALL
Note : CCCMA model results of the average daily rainfall. Control points (average observed values from 1961-2000 are represented in green and future predicted rainfall for 2046 to 2065 are represented in yellow. Source: Climate Change Explorer
ACCCRN – City Vulnerability Assessment Report 39
FIG. (12) : AVERAGE DAILY RAINFALL ANOMALY
Note : CCCMA model results of average daily rainfall anomaly (difference between the future predictions and observed rainfall). Source: Climate Change Explorer
Temperature
Increase of temperature of up to 5 degrees centigrade is expected under CCCMA model’s future scenario. This means increase in minimum (Fig. (13)) as well as maximum temperatures (Fig.(14)). With the increase in daily minimum temperature the winters may no longer be as they are today.
FIG. (13) : AVERAGE DAILY MINIMUM TEMPERATURE
Note : CCCMA model results of the average daily minimum temperature. Control points (average observed values from 1961-2000 are represented in green and future predicted temperature for 2046 to 2065 are represented in yellow. Source: Climate Change Explorer
ACCCRN – City Vulnerability Assessment Report 40
Daily maximum temperature is expected to be higher by 3 to 6 degrees during 2046 to 2065 period. This would mean higher neergy needs for space cooling due to higher temperatures and longer proportion of days requiring space cooling.
FIG. (14) : AVERAGE DAILY MAXIMUM TEMPERATURE
Note : CCCMA model results of the average daily maximum temperature. Control points (average observed values from 1961-2000 are represented in green and future predicted temperature for 2046 to 2065 are represented in yellow. Source: Climate Change Explorer
Even the daily minimum temparatures are expected to rise. It will result in addtional number of nights requiring space cooling as well as indirect impacts on increased viability periods for disease vectors like mosquitoes.
FIG. (15) : ANOMALY IN AVERAGE DAILY MAXIMUM TEMPERATURE
Note : CCCMA model results of anomaly in average daily maximum temperature. Source: Climate Change Explorer
The anomaly in maximum temperature (Fig.(15)) is expected to be as high as 6 degrees C in late February, which may not be high, given end of winter period. The April to July temperature anomaly will be most uncomfortable due to the possible combination of high
ACCCRN – City Vulnerability Assessment Report 41
humidity and temperature increase. The fall in the anomaly during this period may be due to the early start of rainy period.
Climate Change impacts on Indore Water resources and Floods
Indore is located near the watershed boundary between Narmada and Chambal. It is covered by black cotton soils with low permeability. The Indore Township was established at the confluence of Khan and Saraswati rivers, which are minor tributaries of Chambal River. Their catchment area of these rivers extend few kilometers south of the city with combined area of only about 248 sqkm including the city area. Two small reservoirs Yashwant Sagar and Bilavali tank are located upstream of the city.
Average annual rainfall of the city and surroundings is about 900 mm, but being located in the semiarid region, the coefficient of variability across years is quite high. Extreme rainfall events lasting few days are reportedly become common in the last two decades. During the last decade, three events of floods (2002, 2005, and 2009) with increasing intensities have taken place. For example, during the 2009 floods, water logging continued for three days in many places and several weeks in some areas even after the cessation of rains. This happened largely due to new roads and blockage of drainage channels. Many residents reported having invested in increasing plinth heights and other coping mechanisms. A bout of dengue fever was reported across the city for several weeks after the rains. (340 reported cases and 30 deaths). The areas reporting damage from 2009 is shown in the following Fig. (16).
FIG. (16) : INDORE: WATER LOGGING 2009
Source: TARU Primary Study, 2009
Prediction of climate change induced addition/reduction to flood frequency and intensities in fast growing cities like Indore is difficult since much of the current flood hazards are due to
ACCCRN – City Vulnerability Assessment Report 42
poor storm water drainage, construction of roads and other manmade changes in hydrological system. Further it is too premature to account these increased scale of water logging either to changes in precipitation pattern or to climate change. Nevertheless, anecdotal evidence indicates increase in water logging frequency during last decade and this situation is expected to worsen in coming years, especially if the current and past trend of city expansion continues.
With the projected increases in precipitation as well as reduction in rainy days and dominance of heavy ra infall events, the pluvial flooding and water logging is likely to increase, unless a CC hardened storm drainage network is laid and maintained. Solid waste collection system is poorly managed in Indore resulting in clogging of storm water drainage from uncollected garbage, which worsens the waterlogging further. Water scarcity
The study of the downscaled data indicates Indore will face larger variability in rainfall conditions. That would include recurrent droughts, with local sources like Yashwant Sagar and Bilawali tank able to provide lesser water during droughts. Since the Indore city is already dependant on the external sources, any population growth would indicate the need for additional water resources that has to be tapped from Narmada river- located about 70 km from the city and pumped to a height of more than 500 m. The existing water distribution system is outdated and is more than 40% of the water supplied remains unaccounted for.
City growth and migration impacts on water scarcity Indore grew at a decadal growth rate of more than 48% during 1991-2001 (CDP-Indore 2006), while it was only 24.26% for Madhya Pradesh state. The additional growth is largely accounted by immigration including push migration from underdeveloped rural hinterland. The impact of push migration into Indore is also due to steadily decreasing land holdings ( by partition within families over generations), deepening of water tables due to overexploitation, possible increasing water demands for irrigation in the future due to rise in temperatures. Also shift of monsoon towards from June to July may further erode the agricultural productivity. Since Indore is the only major city in the western Madhya Pradesh, it is likely to be preferred destination for significant proportion of rural out migrants from neighboring regions. With the large immigration, water scarcity is likely to continue despite investments on Narmada Phase III. Considering the experience of Narmada Phase I and II, improved water availability is likely to catalyze higher population growth that may lead to another round of water scarcity during the Phase III design period. Poor distribution systems, lack of recycling can make the water scarcity conditions worse, even if the supply up to main city reservoir is ensured. Secondary impacts-Comfort, health risks, livelihoods
The elderly citizens of the city recall the Shab-e-Malwa meaning pleasant evening even during peak summers in Malwa plateau. During last two decades, this phenomenon has changed to high temperatures reaching up to 45oCentigrade with warmer evenings. It is not clear, if the current scenario is due to urban heat island effect or climate change. The increases in summer maximum temperatures as predicted by the CCCMA model are likely to reduce the comfort index, and result in increased energy consumption for cooling. The city was earlier dominated by single or two stored buildings with low heat retention capacity (thermal mass), these structures have now given way to multi-storied concrete roofed
ACCCRN – City Vulnerability Assessment Report 43
buildings, retaining significant part of the heat and prolonging the temperature lag periods. Further, the area of the city has increased leading to the increase in the extent and effect of urban heat island. The current growth of the city and resultant heat island effect may amplify the temperature increase, both maximum as well as minimum temperatures. Further, this increase in temperature during early and late winter months are likely to contribute to the increase in viability period of disease vectors like mosquitoes.
This predicted shift in monsoon and increased precipitation will have considerable effect on the human health and current cropping patterns. An increase in rainfall along with an increase in temperature can further exacerbate the disease profile of the city. During the recent floods of 2009 many residents reported to have invested in increasing plinth heights to cope with the water. The newspaper reports indicate more than 2500 cases of Dengue fever, which continued well beyond 3 months after the floods. The vulnerability survey of over 1250 households reported prevalence of many waterborne diseases in the city. Nearly half the households reported at least one of the water borne diseases over last year. The survey elicited information on diseases suffered by the households over last year. The results are presented in the following Table (4).
Table (4): Indore: Reported diseases during last one year across Sample settlements
Sl. No. Diseases Slums Lower Middle Mixed Upper Grand Total
1 None 37% 49% 64% 72% 83% 54%
2 Malaria 19% 13% 7% 10% 1% 12%
3 Chikungunya 12% 15% 12% 2% 6% 12%
4 Viral Fever 15% 5% 9% 12% 5% 10%
5 Dengue 4% 4% 2% - - 3%
6 Typhoid 4% 6% 1% 2% - 3%
7 Diarrohea 3% 5% 1% - 2% 2%
8 Jaundice 1% 1% 2% 2% - 1%
9 Asthma 1% 0% 0% - 1% 0%
10 Heat Stroke 0% 0% 0% - 1% 0%
11 Skin infection 1% 1% 0% - - 0%
12 Other diseases 3% 1% 1% 2% 1% 2%
Grand Total 100% 100% 100% 100% 100% 100%
Sample Households 420 250 410 60 110 1250
Source: TARU Primary Study, 2009
ACCCRN – City Vulnerability Assessment Report 44
Loss of livelihoods The survey respondents reported monetary impact of floods on poor households included loss of assets and money ranging from Rs. 200 to 10,000 Rs. reported by 47 households with a total of Rs. 176,000. Most of these households are from peripheral areas located in new developed areas with limited storm water drainage. Further, floods case severe disruption to urban livelihoods resulting from lost man days and loss of work.
Out of the 500 households covered under the third phase of the vulnerability survey post-2009 floods, 42 households (3 middle class and rest from lower income households) reported a combined loss of 169 man days of work. While flood risk is an issue affecting people for a few days once in two to three years, increase in droughts may result in push migration from complex diverse risk-prone rural hinterlands, which are already strained by unviable land holdings.
In Madhya Pradesh, about 25% of the farmers are small and marginal landholders with only part of the livelihoods met from agriculture and rest from doing part-time jobs in the neighboring cities.
4.9 Capacity and Vulnerability assessment
Sample size
A total of 1250 households were interviewed from 125 settlements and 125 geopsy samples. The samples were distributed well over space and across the socio economic groups. GIS based analysis was initiated as per the procedure explained earlier. The aggregated results of the GIS analysis indicate the following number of households across various SECs in the area covered under the GIS (Table (5)).
Table (5): Total number of households across different SECs in Indore (based on GIS)
Numbers Slum Lower Mixed Middle Upper Grand Total
34807 76,914 64,777 232,442 21,461 430,401
% of Total 8% 18% 15% 54% 5% 100%
Source: TARU Primary Study, 2009
Three separate indicators of capacities and vulnerabilities were used to assess the capacities of the sample households across the city and aggregated to city level. The analyses of the findings are presented in the following sections. The results of Vulnerability analysis across sample settlements is presented in the Fig. (17).
ACCCRN – City Vulnerability Assessment Report 45
FIG. (17) : INDORE: CAPACITY & VULNERABILITY INDEX ACROSS SAMPLE SETTLEMENTS
Source: TARU Primary Study, 2009
ACCCRN – City Vulnerability Assessment Report 46
4.9.1 Education capacity index
The reported urban literacy levels during 2001 in Indore are about 82.1% (Census of India 2001), but literacy often does not imply that the literate population is able to benefit in terms of improved incomes from education. The raw data obtained from the survey is presented in the following Table (6).
Table (6): Education Status of sample: Indore Sl. No. Education Level Numbers Percentage
1 Illiterate 383 15%
2 Primary 551 21%
3 High school 500 19%
4 SSC 395 15%
5 HSC 264 10%
6 Graduate 351 13%
7 PG 160 6%
Total 2604 100%
Source: TARU Primary Study, 2009
The raw data matches fairly well with the official literacy statistics of 82% literacy in Indore. The spatial distribution of education status across the sample settlements is presented in the Map (Annexure (E)). The education index with weightage given to different levels of education provides a basis for comparing different socio economic groups across the city. The results of the analysis are provided in the following Table (7).
Table (7): Estimates of Education Index across Socio Economic Classes in Indore Sl. No. Education
Index Slum Lower Middle Mixed Upper City total
1 1-2 18% - - - - 1%
2 2-3 40% 4% - - - 4%
3 3-4 33% 35% - - - 9%
4 4-5 3% 35% 40% 27% - 32%
5 5-6 6% 16% 20% - 2% 14%
6 6-7 - 1% 21% 26% 38% 18%
7 7-8 - 7% 16% 34% 16% 16%
8 8-9 - - 4% 13% 22% 5%
9 9-10 - - - - 22% 1%
Grand Total 100% 100% 100% 100% 100% 100%
Source: TARU Primary Study, 2009
Out of the total estimated households of about 0.432 million households estimated by GIS based analysis, 8% are slum dwellers (living in informal houses), followed by 18% low income families (include many notified slums also). The maximum education index among
ACCCRN – City Vulnerability Assessment Report 47
slum and low income households is in the range of 3-5, indicating less than 10th class education, which hardly provides any benefit in terms of earning capacity.
Even the middle class shows a high proportion of persons with low education indices signifying that the high urban literacy rates do not benefit significantly towards earning capacity. With the city hoping to transform in to knowledge city, would require immigration of large number of educated persons to meet growing needs.
Education has remained a major constraint until last decade, where the state has invested heavily on improving literacy, but it has not enabled the neo-literates with higher education to meet the growing challenges of shift from primary and secondary occupations to service based livelihoods. Indore was a trade and commerce town in the past.
With the setting up of Industrial estates in the neighborhood, hi-tech manufacturing sector has been attracting highly educated/skilled human resources. The second transformation to service sector based economy will require major improvements in education and skill levels, failing which the income vulnerability is likely to increase.
Under the urban transformation and climate change scenario, the city would require major investments in education to empower the households to shift away from resource intensive (manufacturing industry) to less water demanding livelihoods.
4.9.2 Income Stability Index
Indore city emerged from being a trading centre to textile manufacturing city to a hub for automotives, light engineering, food and pharmaceuticals industries. While most of the large industries are located outside the city limits, Indore provides a variety of services to support these industries, in addition to large hinterland. The occupation profile over three decades is presented in the following table (8), which highlights the transformation.
Table (8): Occupational Profile of Indore Sl. No. Sectors 1961 1971 1991
A major shift from manufacturing to trade over 1971-91 decade is observed. The estimates of occupational profile derived from GIS enabled vulnerability survey analysis are presented in the flowing Table (9).
Table (9): Indore occupational profile
Sl. No. Type Slums Lower Middle Mixed Upper City Total
1 Unskilled/ vendor/ Hawker 30% 17% 7% 0% 0% 7%
2 Semi Skilled 46% 30% 12% 5% 1% 14%
3 Skilled workers 6% 13% 15% 6% 16% 9%
4 Govt Service (Class III, IV) 4% 8% 10% 5% 9% 6%
5 Govt Service (Class I and II) 0% 2% 7% 12% 10% 9%
6 Self Employed/Business 6% 19% 33% 40% 47% 33%
ACCCRN – City Vulnerability Assessment Report 48
Table (9): Indore occupational profile
Sl. No. Type Slums Lower Middle Mixed Upper City Total
7 Professionals 0% 3% 12% 28% 14% 18%
8 Pension & others 7% 8% 4% 4% 4% 5%
Total 100% 100% 100% 100% 100% 100%
Source: TARU Primary Study, 2009
Self employed/business includes a variety of scales ranging from petty shops to large businesses. Indore has disproportionately high proportion of households engaged in this activity. Even the lower and slum SECs report significant proportion of this occupational class. Livelihood profile of sample settlements is presented in the Map (Annexure (F)). The income stability of households depends on size of monthly incomes, dependency ratio and also on ratio of stable to unstable income sources. With stable incomes the households can venture into long term investments like housing, education and managing fiscal emergencies. Income Stability index was used to compare different socio economic groups across the city. The distribution of income stability index across the SECs is presented in the following Table (10)
Table (10): Estimates of Income stability index range across Socio economic classes in Indore city
Sl. No.
Income-Stability-Index
Slum Lower Middle Mixed Upper Grand Total
1 2-3 - 1% - - - 0%
2 3-4 22% 18% 21% - 5% 17%
3 4-5 43% 34% 8% 26% 18% 19%
4 5-6 23% 20% 43% 61% 22% 39%
5 6-7 10% 22% 13% - 14% 12%
6 7-8 1% 4% 12% 13% 36% 11%
7 8-9 - - 3% - 5% 2%
Grand-Total 100% 100% 100% 100% 100% 100%
Source: TARU Primary Study, 2009
The income stability across different socio economic groups does not show significant differences across SECs indicating that even though the income levels may be low among the slums and lower SECs, they have fairly satisfactory stability due to stability in incomes. This indicates that demand for lower skilled jobs is high enough to meet the market demands or the dependency ratio is low in case of lower income groups. It is quite common that most of the working age population among the lower SECs is engaged in economic activities. This however hides the fact that many of the lower SECs may be spending significant part of their incomes to remit to the dependents living in their native villages/towns. At the same time, the higher SECs have larger dependency ratios with some of the households engaged in unsteady incomes, but have the capacity to shift their activities more easily. Also they are likely to understate their incomes for various reasons. The analysis indicates that nearly one sixth of the city’s households have less than four in terms income stability index, most of them from the slum, lower and middle income
ACCCRN – City Vulnerability Assessment Report 49
categories. Improving livelihoods for these socioeconomic categories will be critical under climate change scenarios that can potentially increase the supply of cheaper labor through immigration from hinterlands, which will reduce the bargaining power of the poor with limited skill sets. The current high demands for skills like domestic work and construction labor due to reduced migration caused by rural employment guarantee schemes may be temporary. It also raises the issue of higher skills and education needs identified under education index reported earlier.
4.9.3 Social Capacity Index
Social capacity index includes the presence of social groups, involvement in those groups and benefits derived from these groups. The social capacity depends on access to social networks and benefits derived from these networks. The social networks include caste/state based networks as well as access to local political systems. Since there is significant migration from various states, the access to social networks also depend on the state of origin the respondents. The following Table (11) provides the estimates of proportion of persons from various states in the city
Table (11): Indore: Estimated population by state of Origin (GIS assisted analysis)
Sl. No. State Slums Lower Middle Mixed Upper City total
1 MP 76% 79% 69% 88% 76% 74%
2 UP 6% 4% 7% 5%
3 Maharashtra 5% 2% 5% 8% 4%
4 Punjab 1% 5% 3%
5 Rajasthan 1% 2% 3% 1% 2%
6 Bihar 2% 3% 1% 1%
7 Gujarat 0% 1% 5% 4% 1%
8 Others 8% 10% 11% 7% 12% 10%
Total 100% 100% 100% 100% 100% 100%
Source: TARU Primary Study, 2009
Maharashtra and UP are the main states of origin reported by the respondents. The city level estimates were worked out using GIS.
The social capacity index provides a basis for comparing the social network access across the SEC at city level. The analysis results are presented in the following Table (12).
ACCCRN – City Vulnerability Assessment Report 50
Table (12): Estimates Social Capacity Index range across Socio economic classes in Indore city
Sl.-No.
Social Capacity Index
Slum Lower Middle Mixed Upper City Total
1 0-2 - - - 4% 0%
2 2-4 19% 29% 22% 26% 15% 23%
3 4-6 57% 31% 45% 47% 41% 43%
4 6-8 6% 9% 19% - 24% 13%
5 8-10 17% 32% 15% 27% 16% 20%
Grand-Total 100% 100% 100% 100% 100% 100%
Source: TARU Primary Study, 2009
The social capacity among the poor is comparable to that of other SECs in Indore. There has been a continuous building up of social capacity mainly due to number of poor focused development programmes launched by the State and NGOs during last decade along with strong patronage culture developed by political parties. It is common to find even the poor able to access the political leaders for getting better urban services as well as to express the grievances. Water supply is one such sector, where it is easier to get the needs/grievances addressed through political patronage rather than formal grievance redressal system of the utility. Water scarcity has reportedly created strong sense of cohesiveness among communities, born out of need for collective bargaining.
Due to this, many communities have been able to get community bore wells, water storage tanks and other facilities. It has also resulted in the political stakeholders using water as a tool to garner support. Unfortunately this tendency sidelined the main issue of accountability and governance in water service delivery system. So despite fairly high social capacity, the communities are unable to derive long term benefits from their social capacity. Fragmented communities with low educational levels and knowledge are unable to raise the debate beyond the urgent issues that can be addressed by local leaders. This inability rises out of history of patronage and backwardness of this region.
4.9.4 Drainage and Sewerage vulnerability index
The condition of sewerage and drainage is poor in most areas due to limited investments in the past along with poor maintenance. Some of the poorer sections of the city face year round waterlogging due to lack of drainage or sewerage. Large sections of the new areas included in to the municipality still rely on septic tanks. The low permeability of black cotton soils2 as well as poor solid waste collection system further aggravate this situation. During and after rainy seasons, outbreaks of mosquito borne diseases like malaria and dengue are quite common as reported earlier. In addition to water logging, waterborne diseases like jaundice are reported in summers, indicating poor sanitary conditions. The estimates of drainage and sewerage index across SECs are presented in the following Table (13).
2 Black cotton soils have very low permeability as well as expand on wetting. The percolation is low and the stagnant pools of water can be seen in areas with poor drainage.
ACCCRN – City Vulnerability Assessment Report 51
Table (13): Estimates of Drainage and sewerage services vulnerability index range across Socio economic classes in Indore city
Sl. No.
Drainage and sewerage
vulnerability index
Slum Lower Middle Mixed Upper Grand Total
1 0-1 3% 19% 26% - 9% 18%
2 1-2 - 3% - - - 1%
3 2-3 35% 52% 20% 53% 19% 32%
4 3-4 - 14% 1% - 11% 4%
5 4-5 1% 4% 24% 34% 21% 20%
6 5-6 48% 7% 20% 13% 28% 20%
7 6-7 - - 8% - 5% 5%
8 7-8 13% - - - 7% 1%
Grand Total 100% 100% 100% 100% 100% 100%
Source: TARU Primary Study, 2009
The analysis indicates that there are two types of slums, with the first group having minimal drainage and sewerage while the latter has fairly good facilities. This is due to focused investments under many pro-poor programmes including Madhya Pradesh Urban Services for Poor (MPUSP).
The results also indicate that significant proportion of middle class and upper SECs also have problems of sewerage (septic tanks, soak pits etc) and drainage is inadequate. As per NIPFP, only 55% population has access to sewerage network and 80% of sewers are underutilized for want of maintenance and only 20% of roads have storm water drainage (NIPFP 2006).
The 2009 floods affected many such areas across the city, reinforce the results. Most of such locations are in peripheral areas, where these services were not installed. The two Sewage treatment plants, set up during last five years, face shortage of sewage water for effective running of these plants, while most of the sewage flows through the natural drainage. Most of the houses connect their sewerage pipes directly in to the Nala as shown in the following Fig. (18).
ACCCRN – City Vulnerability Assessment Report 52
FIG. (18) : SEWERAGE SYSTEM AND STP
Source: Urban environment workbook 2006
The IMC had laid trunk sewers earlier, but they are mostly nonfunctional and the sewage overflows in to the natural drainage lines in many places and they have become de-facto sewage channels in most places. The yellow lines in the Figure above indicating small diameter sewer lines are often directly connected to the nala and no longer drain in to the trunk sewers. The city is installing new sewerage system across the city under JNNURM progamme. The effectiveness of this system will largely depend on the maintenance, which is a major issue as the past projects. Under MPUSP project supported by DFID, drainage and sewerage facilities are being provided some of the slums on priority basis. However, unless the solid waste collection system is improved, major maintenance issues are likely to crop up.
ACCCRN – City Vulnerability Assessment Report 53
The drainage system is choked at many places by solid wastes that are left to accumulate in many parts of the city. Indore’s solid waste collection system is very poor and efforts to improve it through PPP projects have failed to take off due to a variety of conflicts. The current solid waste collection arrangements at the household level are presented in the following Table (14).
Table (14): Solid waste collection arrangements across SECs
Sl. No. HH level arrangements Slums Lower Middle Mixed Upper Sample Total
1 House to house collection 19% 31% 64% 57% 63% 42%
2 Dumping in waste bin 19% 10% 10% 15% 13% 13%
3 Dump on street/outside 41% 40% 23% 27% 23% 33%
4 In the river/nallah 16% 14% 3% 2% 1% 9%
5 Burn 5% 4% 1% 1% 3%
Grand Total 100% 100% 100% 100% 100% 100%
Total Households 420 250 410 60 110 1250
Source: TARU Primary Study, 2009
With more than half the households dumping the solid wastes in to open or nalas, the collection system is unable to collect and transport, resulting in clogging of the drainage system which further deteriorates the environment and increases waterlogging. Also some of the garbage is collected through informal arrangements like maids and sweepers, which are dumped at the vacant sites and not transported. Burning is done when the solid waste builds up, which increases the air pollution problems especially due to presence of significant proportion of plastics in the solid wastes.
With the increased frequency of heavy rainfall, solid waste problem is likely to amplify water logging problems as the 2009 floods demonstrated. Institutional stakeholders have focused on further investments in sewerage and drainage systems without addressing the issue of maintenance of the existing systems. The failure of sewage infrastructure developed under the Indore Habitat development project demonstrates the need for continued focus on maintenance and operational changes in responsible utility departments.
4.9.5 Water scarcity index
Indore receives about 170-199.5 mld of water including all surface and ground water sources. This is 52-67 liters per capita per day3 and very low in view of CPHEO recommendation of 135 LPCD (Draft water sector Study 2009). Only 54% of population is covered by piped water supply, rest is served by ground water and tankers. Due to water scarcity, only alternate day water supply is provided with low pressure for about an hour. The water supply coverage is limited mostly to IMC area and the IDA area still do not have piped water supply. Most residents have reported to coping mechanisms including installing pumps to draw water directly from the municipal pipelines, dug pits in the ground to collect water from lower levels of pipes, built sumps-pump-overhead tanks systems. Household level storage systems have been augmented, with poor opting for drums and smaller storage vessels. It is also reported that some of the households even share water from neighbors or relatives and shift some of the activities like bathing to relatives houses, which have access to groundwater. The 3 After accounting for losses in the distribution system
ACCCRN – City Vulnerability Assessment Report 54
city municipality has declared power cuts during water supply hour to discourage direct pumping. Water conflicts, organized protest and road blockages by residents during summers are common and results in extensive media coverage during summers. The municipal ward members are flooded with complaints and the people would rather use the informal routes than opt for formal complaints through water supply department. Household level storage has become a necessity and most of the families have storages within the houses. Household level water storage capacity provides a snapshot of water crisis faced by the households and their coping strategies. The distribution of household level storage among the sample households highlight the water scarcity issues as presented in the following Table (15).
Table (15): Distribution of household level water storage capacity among the sample households (1250 HHS)
Sl. No.
Water Storage Capacity Lits.
Slum Lower Middle Upper Grand Total
1 < 200 19% 4% 2% 1% 6%
2 200-500 43% 31% 10% 7% 23%
3 500-1000 21% 23% 12% 12% 17%
4 1000-2500 16% 28% 28% 27% 25%
5 2500-5000 - 10% 30% 26% 17%
6 5000-10,000 1%* 3% 13% 22% 9%
7 10,000-25,000 - - 5% 7% 3%
Grand Total 100% 100% 100% 100% 100%
Source: TARU Primary Study, 2009
The slum dwellers are constrained by space limitations and often keep the storage vessels on the alleys adjacent to their houses. Some of the storage drums are even locked to prevent others from stealing water. Water storage absorbs the shock of unscheduled water supply disruptions. Given the alternate day supply, most households have to keep at least one day water demand in storage. Those families having the access to ground water can live without much storage, but electricity and pump breakdowns have to be managed.
Water crisis has resulted in extensive use of ground water and emergence of strong water market through tanker supplies. Also, the household water purification system market is growing. The IMC has dug more than 4,000 bore wells to augment the municipal water supply and gets about 13 mld from ground water out of a total supply of 199.5 mld. Also about 13,000 private borewells are registered while estimated number of private borewells is about 50,000. The water table has receded from less than 10 m in 1960’s when the open wells were a common source of water to about 135 m now. The water crisis has resulted in large household level investments. Due to receding water table, many households have invested in deepening of bore wells or digging new ones. Water scarcity index is worked out based on number of water source used, per capita water collected, and distance of water source during scarcity and average time used for water collection. The findings of city wide estimation are presented in the following Table (16).
ACCCRN – City Vulnerability Assessment Report 55
Table (16): Estimates of water scarcity vulnerability index range across Socio economic classes in Indore city
Sl. No.
Water scarcity vulnerability index
Slum Lower Middle Mixed Upper Grand Total
1 0-2 6% 4% 6% - 10% 5%
2 2-4 50% 56% 51% 74% 57% 55%
3 4-6 19% 25% 44% 26% 33% 35%
4 6-8 24% 15% - - - 5%
Grand-Total 100% 100% 100% 100% 100% 100%
Source: TARU Primary Study, 2009
The analysis indicates that all the SECs suffer from water scarcity with a central tendency of 2-4 index levels. Slum and lower classes are the worst hit with about one fourth of the population facing acute water scarcity. Most of the households interviewed hope that water scarcity will disappear with commissioning of Narmada Phase III project which will augment the supply by 360 mld, Total net requirement including Dewas, Mhow and Industries of Pithampur is estimated to be of the order of 564 MLD for the year 2024 and 864 MLD for the year 2039 (Draft water sector study, 2009). However, commissioning of the Narmada Phase III is delayed over legal cases regarding environment impacts and displacement of people from Maheshwar dam construction.
The households interviewed are not aware of possible problems of supplying more than 500 MLD of water in to the city, without adequate drainage and sewerage. The past experiences of non maintenance of sewerage system, if continued, can result in increased water logging problems in areas supplied with additional water. Unless integrated planning of water supply, sewerage and drainage system is commissioned and maintained efficiently, water logging, diseases and other related issues are likely to intensify. Major paradigm shifts in ULB and utility departments is necessary to evolve a sustainable solution to water scarcity, sewerage and drainage problems facing the city.
Under the climate change and urban growth scenarios, water supply will be one of the major issues that would require attention as highlighted in the Draft water sector study. During the drought years, the water scarcity is expected to crop up by 2040’s, due to competing demands upstream from Jabalpur and Bhopal.
Also the energy costs, cost recovery and targeting subsidies are some of the important issues that need to be addressed to ensure the financial health of the water supply system. If sufficient funds are not available to the utility, the maintenance may deteriorate resulting in further periods of scarcity. Integrated water resource management including conservation, recycling and rainwater harvesting may have to be explored for continued availability of sufficient supply.
ACCCRN – City Vulnerability Assessment Report 56
Sankey diagram for Indore City Figures 19, 20, 21 & 22 illustrate the Sankey diagram for different SECs based on average consumption.
FIG. (19) : SLUM HOUSEHOLD
Source: TARU analysis, 2010
FIG. (20) : LOWER CLASS HOUSEHOLD
Source: TARU analysis, 2010
ACCCRN – City Vulnerability Assessment Report 57
FIG. (21) : MIDDLE CLASS HOUSEHOLD
Source: TARU analysis, 2010
FIG. (22) : UPPER CLASS HOUSEHOLD
Source: TARU analysis, 2010
Loan and insurance vulnerability Index
One of the most common issues of vulnerability facing the poor is the loans taken by the households and lack of insurance to protect the households against loss of assets or medical emergencies to family members. The resilience of the households after facing disasters/ contingencies is compromised due to lack of protective umbrella of insurance or capacity to raise loans. In many cases, especially among poor, costs of ceremonies, medical emergencies are met by informal loans, which take years to pay back, often by reducing other essential expenses. The loan and insurance vulnerability index is used to understand this facet of vulnerability.
ACCCRN – City Vulnerability Assessment Report 58
Proportion of households without insurance as well as proportion of households with pending loans is given equal weightage for comparing the settlements with this index. The results of city wide distribution of this index are presented in the flowing Table (17).
Table (17): Estimates of Insurance and loan vulnerability index range across Socio economic classes in Indore city
Sl. No.
Insurance-and-loan-vulnerability-index
Slum Lower Middle Mixed Upper Grand Total
1 1 - - 2% 13% 36% 5%
2 2 - - 6% - 5% 3%
3 3 - 1% 14% - 10% 8%
4 4 20% 26% 20% 60% 26%
5 5 55% 44% 49% 27% 49% 45%
6 6 21% 15% 8% - - 9%
7 7 5% 13% - - - 3%
8 8 - 1% - - - 0%
Grand-Total 100% 100% 100% 100% 100% 100%
Source: TARU Primary Study, 2009
The penetration of insurance is poor (less than 25%) as well as incidence of loans is higher in case of lower and slum SECs. This causes higher financial vulnerability to these households. These results have to be seen in conjunction with income stability index also since loans can be repaid if the household is able to pay back even in case of contingencies or disasters. Formal Long term housing loans/ loans for productive activities (factory, office etc) are examples, which can be accessed only if the households have steady incomes or linked with collaterals (factory/house). More detailed analysis will be required to understand the vulnerability arising out of loans, which is rather difficult due to problems of over and under reporting. SLDs can be effective in obtaining in-depth understanding about loans and insurance.
From the climate change adaptation perspective, extending coverage of insurance services will be critical, since it will help households take shocks of damages due to hydrometeorological disasters and indirect impacts like health. While access to loan will also be critical, existing debts is an additional burden on the families affected by hydrometeorological disasters. While in the past, poor had no access to formal loans, the situation has improved with the establishment of Microfinance sector serving mainly the poor, but the interest rates are still higher than what the middle and upper class pays to banks and other formal institutions. Reducing the loan interests as well as channelizing the savings of the poor will greatly improve the resilience of the poor. Flood vulnerability index
Indore lies in the upper catchment of Khan River and faces both pluvial and fluvial floods. Flood vulnerability in urban areas depends on a variety of factors including human modifications to drainage, especially in nearly flat terrains in addition to natural factors like distance from streams and also on the intensity and duration of rainfall. This index is based on distance to streams, reported floods/water logging and depth of inundation reported by the households. The third phase of the survey was conducted after the 2009 floods, which affected more areas than any one of the past floods despite lower intensity of rainfall. Major road development activities, expansion of the city in to flatter terrains without sufficient
ACCCRN – City Vulnerability Assessment Report 59
drainage as well as clogging of existing drainage were reportedly the main reasons for larger areas affected by 2009 floods. The flood events reported in Indore are presented in the flowing Table (18).
Table (18): Flood Vulnerability Index Sl. No.
Year Date Rainfall (mm)
1 1990 23-August 128
24-August 96
2 1991 11-Jun 113.5
3 1993 29-Jul 124.4
29-Sep 70
4 1994 10-June 70
30-Jun 86.7
5 1995 25-July 86.5
26-July 183.9
29-Sep 89.7
6 1996 27-July 81.6
28-July 186
29-July 168.5
7 1999 16-June 107
14-Sep 98.4
25-Sep 84.6
8 2000 12-Jul 64
9 2001 15-Jun 94
10 2004 23-Aug 99
11 2006 08-Aug 84.2
10-Aug 77.6
12 2007 09-Jul 110.8
13 2008 26-Aug 82
14 2009 3-July 91.8
22-July 78.8
23-July 108.8
4-Sep 98.2
The above data indicates that Indore has seen periods of extreme precipitation events resulting in floods and water logging. Also 2-3 day heavy rainy spells are common and these events can potentially cause water logging. The 2009 flood was not a major event compared to earlier events, but in terms of damage, it was one of the worst, indicating the role of human interventions in drainage in flooding. The studies indicate that even 25mm of rainfall in 1-2 hours can cause water logging on most of the roads which serve as surface storm drains during monsoon in absence of poor coverage of city by storm drains. Most of slums and poor areas are situated along water courses and use them as drainage for waste water.
ACCCRN – City Vulnerability Assessment Report 60
Only 20% of roads have storm water drainage. Indore has 1700 km. of roads of which 350 km. major roads have storm water drains. Recently, the local authorities have made nearly all roads of city of cement concrete and thereby natural drainage has been critically affected. Due to this the problem of water logging has increased The maximum flows the river Khan can carry at and after confluence Saraswati, is about 200 cumec and it has a catchment area of 132 Sq.km. Time of concentration of the catchment is 2 to 3 hours and if rainfall of 37 mm occurs for more than two hours then the flooding of nearby areas along Khan and its nallah occurs. It is estimated that about 30% of the city population is affected by floods (Draft water sector study 2009). Flood risk index compares different settlements. The Survey results from 75 settlements from post 2009 floods across SEC are presented in the following Table (19).
Table (19): Estimates of Flood vulnerability index range across Socio economic classes from the sample survey (75 settlements)
Sl. No.
Flood vulnerability index
Slums Lower Middle Upper Grand Total
1 0-2.5 18% 29% 43% 100% 36%
2 5-7.5 12% - 29% - 12%
3 7.5-10 71% 71% 29% - 52%
Grand Total 100% 100% 100% 100% 100%
Source: TARU Primary Study, 2009
The analysis indicates that almost all the SECs are exposed to flood hazards. While the upper SECs are mostly located in the low risk zones, the slum dwellers as well as low income SECs are differentially more vulnerable to flood hazards, mainly due to most of the settlements located near the streams or in waterlogging prone zones. Nearly three fourths of the lower and Slum SEC households are located in very high flood risk zones. The damage from floods and water logging include damage to houses, loss/damage of movable assets and loss of incomes due to loss of working days. The damage to houses is dependent on the type of construction and exposure. The composition of housing stock across the sample settlements is provided in the Map (Annexure (G)). A significant number of houses in slums and lower SEC are either informal house made of materials prone to flood damage. Under the climate change scenarios, the frequency of flood events are likely to increase, with Poor potentially taking the brunt of the floods and waterlogging due to the locational vulnerability. Even though most of the floods are of short duration due to the location of Indore in upper part of the catchment, adaptation measures will be required to save life and assets of the poor.
4.10 Industry Profile Indore
Indore Industrial zone provides the industries with complete civic and industrial infrastructure. The industrial growth of this region has been phenomenal, multinational and national companies have chosen to set up their industries here, solely because of the availability of infrastructure at Indore.
Following table (20) shows the industrial profile of Indore City.
Table (20): Industrial Profile of Indore (2008)
ACCCRN – City Vulnerability Assessment Report 61
SI. No. Type Nos. In % 1 General 148 23.09
2 Mechanical 131 20.44
3 Plastic 86 13.42
4 Electrical 51 7.96
5 Metal works 50 7.80
6 Pharmaceutical 43 6.71
7 Chemical 33 5.15
8 Food 32 4.99
9 Clothes 15 2.34
10 Service 9 1.40
11 Others 8 1.25
12 Packaging 8 1.25
13 Automobile 5 0.78
14 Furniture 5 0.78
15 Paints 4 0.62
16 Herbal 3 0.47
17 Refinery 3 0.47
18 Fertilizers 2 0.31
19 Paper 2 0.31
20 Electronic 1 0.16
21 Glass 1 0.16
22 Khandsari Sugar 1 0.16
Grand Total 641 100.00
Source: Industry Association Indore, 2008
Industry vulnerability survey
This survey was carried out to understand the vulnerability from hydro meteorological disasters, mainly water scarcity as well as understand resource dependency. Less emphasis was laid on economic aspects to avoid poor responses and suspicion. A total of 50 industries were covered under this study from different industries classes, which are mentioned below in Table (21).
ACCCRN – City Vulnerability Assessment Report 62
Table (21): Class wise industries surveyed in Indore
Sl. No. Class Nos. 1. Medium 7
2. Small (SSI) 32
3. Tiny & Cottage 11
Grand Total 50 Source: TARU Primary Survey, 2009
These industries were selected from different production categories, such as electrical equipment manufacturing, agricultural equipments manufacturing, steel pipes and sheets, fertilizers, automobile parts, plastic and rubber related industries etc.
Water use Indore Municipal Corporation (IMC) is the main water supply service provider for industries in Indore. Water supply tankers, private bore wells and Audhyogik Kendra Vikas Nigam (AKVN) are among the secondary sources other than IMC. It is reported that 31 out of 50 industries have 100 % dependency on municipal water supply. The reliability of municipal water supply is low to moderate with high dependency. Following Table (22) shows the different source of industrial water supply by number of surveyed industries.
Table (22): Water Supply Source for sample Industries
Sl. No. Water Supply Source Nos. 1. IMC 31
2. Water Tanker 11
3. Private Bore Well 6
4. AKVN 2
Grand Total 50
Source: TARU Primary Survey, 2009
The water consumption is highest by steel casting and fabrication industry in surveyed industries.
Energy issues It is reported that all industries have 100% dependency on electricity to various degrees supplied through Madhya Pradesh Electricity Board (MPEB). The energy consumption is highly variable across the industries according to size of industries and type of production. Other than electricity, industries have dependency on supplementary sources such as Liquid Petroleum Gas (LPG), Diesel and Coal. Electricity supply cut is totally unscheduled in Indore which ranges from 1 to 15 hours per month in summers month. This power cut is comparatively less in other months ranging from 1 to 10 hours per month. It is reported in 6 out of 50 surveyed industries about coping alternate options for electricity shortage, diesel generators are used.
Institutions Indore city is well known for its educational institutes such as Indian Institute of Management
ACCCRN – City Vulnerability Assessment Report 63
(IIM) Following Table (23)is showing the educational institutional profile of Indore city ranging from primary schools to higher education institutions.
Table (23): Education institutions profile of Indore
Sl. No. Institutions Total Nos.
1 Graduate Colleges 38
2 Post Graduate Colleges 22
3 MBA 24
4 Law Colleges 4
5 Medical Colleges 16
6 Nursing Colleges 9
7 Technical Colleges 48
8 Coaching Institute 80
9 Primary &Middle School 1839
10 High & Higher Secondary School 547
Grand Total 2627
Source: DAVV, Indore, SGSITS, Indore, District Education Office, Indore
Five education institutions were surveyed including schools and colleges to find out the resource dependency and vulnerability issues. All of them are dependent on their own water source which are bore wells. The water from these bore wells is reported to be clean and good quality water. Dependency on tanker water supply is reported in few institutions especially during summer months.
The tanker water is supplied through private vendors and none of them reported any problems of quality. Water supply through hand pumps is rather rare in surveyed institutions as ground water table is very low in City of Indore. Water supply through municipal sources was reported in 2 out of 5 surveyed institutions.
In spite of Indore falling in water scarce region of the country, none of the surveyed institutions have reported to have installed any rain water harvesting system or any future plan for installations. Water scarcity has been reported as a disaster by almost all surveyed institutions with moderate impacts. None of them reported the direct losses because of water scarcity and investment on coping mechanism. All the surveyed institutions reported 100% dependency on electricity supplied through Madhya Pradesh Electricity Board (MPEB). None of them reported as making use of renewable energy source, such as solar panels. All institutions reported 2 hours electricity cut especially during summer season. To overcome long power cut situation, institutions are using different methods to get electricity such as invertors or diesel generators.
All institutions are aware about best practices in Energy Efficiency Promotion (EEP) where they have accorded high priority to install energy efficient lighting.
Hospitals Indore is an important centre for medical and health services for neighboring industrial region
ACCCRN – City Vulnerability Assessment Report 64
in addition to meeting local needs. A total of 289 hospitals and pathological labs were reported in the city as per the statistics presented in the following Table (24).
Table (24): No. of health institutions in Indore
SI. No. Type Nos.
1 Hospitals 180
2 Pathological Labs 109
Grand Total 289
Source: IMC, Indore
Hotels and Restaurants
Indore which is well known for its history has different distinct cuisine and it is bustling business city with large number of business men visiting on short trips. The city hotel infrastructure is often insufficient to meet the demands.
Table (25): No. of hotels and restaurants in Indore
SI. No. Type Nos.
1 Hotels & Restaurant 79
Grand Total 79
Source: IMC, Indore
A total of 4 hotels were surveyed. The total capacity was 148 rooms indicating an average of 37 rooms per hotel. The occupancy rate is near by 50 %. Disaster impacts are reported minimal except for water shortage in summer months. The major source of water supply for the hotels and restaurant is the Indore Municipal Corporation. Other than that MC water supply, private takers and bore wells are supplementary sources of water supply in hotel industries in Indore. It is reported that none of the surveyed hotels and restaurant are aware about rain water harvesting and energy efficiency measures.
4.11 CRGM model
Indore is a major city located in the Malwa plateau and is the one of the major commercial center of a rich agricultural region in which wheat, millet, corn, cotton, opium, and oilseed are produced. It is emerging from being a center of cotton textiles, hosiery to a metal, automobile and chemical industries. The city is also emerging as a medical institution and education hub. Founded in 1715, Indore rose to prominence under the Maratha dynasty of Holkars. In 1818 it was made a British protectorate and capital of the princely state of Indore, which merged with Madhya Bharat in 1948.
Resources It is located in near the Watershed boundary in a drought prone, rain shadow zone, water scarcity has remained a major issue in the city. The Indore municipal corporation manages the water supply, sewerage, roads and streetlights. Situated in Madhya Pradesh, which is one of the less developed states of India, Indore city has been facing planning/strategizing and investment constraints in infrastructure development. Water resources are scarce and cannot support high growth rates, which is largely induced by lack of large cities in the region to
ACCCRN – City Vulnerability Assessment Report 65
absorb push (from water and land constraints) and pull (opportunities) migrants from the hinterlands.
Government While water resources are scarce, the city municipality has not been able to tap the soft options of leak reduction, water reuse etc and instead has been building water supply projects based on long distance high head pumping from Narmada. Each round of crisis has been leveraged to install another phase of Narmada based water supply projects and currently Narmada Phase III is being implemented. The city loses about half of the water it generates at the water treatment plants and has mostly non functional sewerage system and a single Sewage treatment plant whose outputs are discharged back in to the River without reuse. While the city has been able to attract donor funds, it is unable to used it effectively to reduce poverty, nor able to improve the infrastructure. Water theft is significant in addition to leakage losses. It provides an example of vicious cycle of scarcity, poor strategy and ineffective water resource management. The water department has not been effective in bringing change and the elected body, by and large manages the water system through tanker supplies during the crisis periods. With the result, transient measures like alternate day supply, power cuts during water supply periods to discourage direct pumping from mains is resorted to and have become a normal practice throughout the year.
The city government has taken several initiatives and donor funded projects, but most of them are unable to yield long term benefits to the citizens. A significant paradigm shift is necessary to drive changes in this context. The electricity supply also shows similar trend with tariff not matching the production costs and untargeted subsidies. The utility cross subsidises the electricity through higher tariff to industry and trade sector and has little incentives to promote energy efficiency in industries and trade sector. Communities
These tactics have led to a variety of coping measures by the communities including individual bore wells, deep pits to draw water from the pipelines, large household storage systems, private tankers etc. Some of the measures cannot be afforded by poor resulting high differential access to water between poor and the rest. The poor sewerage and drainage has resulted in water logging and floods. Water fights between communities and organized protests against municipality during summers has become common news in Indore, which often turns violent during peak summers. Community cohesion beyond the neighborhoods is weak and the tendency to take organized action at neighborhood level upwards or to express demand is rather weak in Indore. The communities still depend to a great extent on municipal water, but well off communities have developed a series of backup systems as reported earlier. Markets
In the perpetual scarcity conditions, market has been able to provide coping solutions through semi-organised tanker supplies, bore well drilling services, overhead tanks and pumps as well as small to large capacity water purifiers addressing needs of households upwards. The market also plays an important role in municipal tanker supplies, since the municipality has only limited number of tankers. Tanker and water equipment market is flourishing in Indore largely due to inability of the IMC to provide sufficient quantity of water at household level.
Linkages The community to resource linkage is weakening due to over extraction of aquifers, which has exhausted option of direct linkage between user and resource. Other possible linkages
ACCCRN – City Vulnerability Assessment Report 66
like rainwater harvesting, reuse of grey water etc have not been effective since the communities have not been able to take collective action at the neighborhood levels largely due to disputes over capital and maintenance cost sharing. The community government linkage exists, but is unable to meet the needs of the communities. Reliability and quality of services provided is insufficient to inspire confidence among communities to increased willingness to pay for better services. Since the communities are not able to unite beyond the immediate crisis situations, they are unable to influence the municipality to improve the services constructively. Most of the well intended plans by the municipality also get mired by controversies and the administration loses interest. While negative criticism is so common, organized efforts to mediate and negotiate for better services are rare.
FIG. (23) : LINKAGES SHOWING RELATIONSHIP BETWEEN RESOURCES, MARKET, COMMUNITY AND GOVERNMENT
Source: TARU analysis, 2010
Community-market linkages fill the gap left by the municipal water supply. Unfortunately the communities’ incapacity to unite results in individual bargaining instead of collective bargaining leading to lower scales of operation and failed to achieve economy of scales. This has resulted in domination of tanker markets by several small operators, who collect water through individual contracts with bore well owners. Also since there is no agency involved in educating and organizing groups around common clause, the status quo prevails. Building consensus through continued social engineering is one of the options to pilot and to demonstrate to other communities and to engage the citizens in a larger platform over higher level of debate. A few small- scale efforts have been tried and some of them are working at neighborhood levels, but neither these good practices are disseminated to other communities nor these examples are highlighted in press and other media.
ACCCRN – City Vulnerability Assessment Report 67
4.12 Conclusions
Water scarcity has emerged as the most important issue which has direct bearing with respect to climate change. Even with the current rainfall pattern, the augmentation of water supply through Narmada Phase III is likely to alleviate the water scarcity only up to 2040 or so. The water scarcity will raise issues of competing demands especially during the drought years. Water scarcity combined with lack of sewerage is reportedly the reason for jaundice outbreaks in summer. Anecdotal evidences indicate that jaundice is not uncommon even in upper and middle income groups, even though it is difficult to directly associate these outbreaks only on water quality alone since contamination of food sold by informal restaurants also may be a contributing factor. Eating out in food stalls is a common practice in Indore.
Floods, even though short lived, directly impact about 30% of the population. The frequency of floods has not changed significantly, but a combination of manmade changes including blockage of drainage, road construction and expansion of the city have increased their incidence. Anecdotal evidence indicates increased impacts from floods and water logging. The 2009 flood is an example of extensive impacts of flooding, which is largely related to man induced causes. Also the number of people affected will continue to increase due to expansion of the city. The climate models indicate possibility of less rainy days and more intense precipitation events. If the rainfall increases along with dominance of extreme events, the frequency of flood and water logging is likely to increase. Hardening the drainage and sewerage infrastructure to address such events is essential, especially during implementation of large urban renewal programmes like JNNURM. Indirect impacts of floods include health risks, especially vector borne diseases like Malaria, Dengue and Chikungunia. The viability of vectors is likely to be extended due to water logging as well as increase in temperature. No direct evidences for this phenomenon is available, but the water logging will increase breeding areas for the vectors, while temperature increase is likely to extend the viability period in to winters, which otherwise is not conducive for mosquito breeding. About one third of the city’s households have income stability index of less than 5, majority of which are belonging to lower and mixed SECs. These households will remain vulnerable to disasters and their resilience is likely to be low due to unsteady sources of income.
The issues facing the city including water scarcity, poor drainage and sewerage as well as flooding are symptoms of a deeper issue of management of institutions and their responsiveness to people’s needs. While Indore city has been able to attract donor interest and funds for over two decades, it is still unable to maintain existing infrastructure and services. Also it is unable to leverage the lessons learnt from donor funded projects. Even with early start of reform focused projects like FIRE-D funded by USAID, reforms urban local body is in early stage of evolution. The water, sewerage and solid waste problems facing the city are expected to grow unless the focus shifts from new infrastructure building to an integrated approach of planning, implementing and maintaining the essential infrastructure. With the resources like water costing high in financial and energy terms, conservation focused planning and management is necessary. The solutions need to be sought through paradigm shift in management of urban institutions.
4.13 Adaptation requirements
Of all the predicted change in urban environment, water scarcity is currently on top of the Indore’s priorities. The government has invested on Narmada Phase III which is planned for expected 2025 population to address part of this problem. However, the population growth
ACCCRN – City Vulnerability Assessment Report 68
estimates may be quite conservative and can drastically increase with improved urban services, which is in stark contrast to very low level of services and livelihood options in the demographic catchment of Indore. Hardening water supply system and conservation of costly water through reducing leakages, recycling and tapping the local sources efficiently will be necessary to face the urban growth and climate change related impacts. Creating demand for equitable supply of water and transparent tracking of water supply will be necessary to reduce ambiguities and prevent collapse of formal grievance redress systems. The city also needs to devise methods and techniques to tap additional rainfall, expected under climate change scenarios, through improved drainage and reduction of solid waste pollution4.
Indore’s aquifer are highly overexploited, but is an important source of water for a significant proportion of population, especially poor through public hand pumps and energised bore wells. Aquifer recharge will be necessary as well as prevention/monitoring of ground water quality will be essential to conserve this valuable resource, which can be an important standby source in case of shutdown of Narmada Water supply projects due to energy related issues.
Sewerage improvement is another major area requiring attention, since the current system is nonfunctional and the existing Sewage treatment plants are working below their capacity. Reuse of water is only possible if the city is able to improve sewerage and treat it to standards acceptable by industrial and other users requiring lower quality of water. With increasing costs of Narmada water and energy dependency, water recycling will be only option to reduce water demands.
The increase in flood frequency and waterlogging along with temperature increase is expected to increase transmission of vector borne diseases. The current health system is poor and accessibility by poor is an issue. Improving disease tracking and preventive measures are necessary which needs to include reducing water logging periods, tracking the diseases and improving health care access to poor. Push migration is an issue in this city due to large demographic catchment with low levels of literacy, ever reducing farm sizes and some areas with poor quality of land ( hilly and denuded) and increased frequencies of droughts and floods/water logging The catchment comprise of high proportion of marginal farmers and tribals with little skills relevant for the urban areas. While the city is planning to emerge as knowledge city, the demands for manpower with higher education and technical skills is bound to increase. Building the human resources based on demand from the emerging industries is going to be a big challenge, especially push migrants from Indore’s demographic catchment.
4 Currently the there is no separate storm water runoff system and sewage also gets diverted in to the natural drainage.
ACCCRN – City Vulnerability Assessment Report 69
5 SURAT – CITY PROFILE
5.1 Introduction
5.2 Location and Access
Surat is an important commercial city in south Gujarat, and is approximately 250 km North of Bombay. The city is located 21°10 N 72°50 E with an altitude of about 13m above mean sea level (amsl). Surat was a gateway to the Deccan plateau. Being located at the mouth of Gulf of Khambhat, Surat experiences a tidal range of about 5-6 m. The monthly high tide reaches the western parts of the city. The Surat district is surrounded by Bharuch, Narmada (North), Navsari and Dang (South) districts. To the west of the city is the Gulf of Khambhat. Surat is a port city, the nearest port now is the Hazira located at the mouth of Tapi. Surat has a Tropical Monsoon Climate. Summer temperatures in Surat range from 37 to 44 degrees Celsius with winter temperatures dropping to 22 degrees Celsius. Monsoon begins in June and last till end of September, with the average temperature being around 28 degrees Celsius during those months. Average annual rainfall is approximately 1143 mm. Surat being located in between Ahmedabad and Mumbai has a very good connectivity in terms of road and railways. The Golden Quadrilateral, a highway network connecting Delhi, Mumbai, Kolkata and Chennai, passes through Surat. The city is connected to the National Highway 8 through a 16 km connector highway. National highway 6, National highway 228, pass through Surat city connecting various major towns and cities of India. New Airport at Surat is functional since 2008 connecting Surat with Delhi, Jaipur, Kandla, Mumbai and other cities.
Table (26): Surat City Profile Sr. No. Category Figures
1 Area (sq.kms) 326.515
2 Population 2009 (SMC projections with expanded City limits) 4,523,022
3 Zones 7
4 Avg. Rainfall (mm) 1,894 mm
5 Major Rivers Tapi
6 Major Dams Ukai, Kakrapar Weir
7 Main Industries Textile industries and machinery, Diamond units, Petroleum, Heavy industries
Source: GoG 2006; SMC, 2009
Like the major business centres of early times which used to develop on the bank of the rivers, Surat too is situated on the banks of the Tapi River, which flows into the Arabian sea, just 16 km away from the Surat city. The Tapi River dictates the topology of the city as the landscape slopes gradually from Northeast to Southwest. The city faces the risks of both sea level rise and flooding. The old city had set up flood protection systems including flood walls and gates, which are no longer visible at present. The Ukai multipurpose dam built upstream, 94 km from Surat, was meant for flood control management and for irrigation, power generation. During the last two decades the city of Surat and the surrounding metropolitan region has witnessed major floods.
5.3 Demography, City Growth and trends, Economic base
The City of Surat has rapidly grown since 1960’s and has seen growth in the terms of population as well as industry and the pressure on resources. The city area has also expanded with time (major expansion happening in 2006) and presently covers around 326.515 sq km while, the projected population of the city in 2009 is 4,523,022 (SMC, 2009). The actual population may exceed these figures, especially because of the rapid development in the Surat Metropolitan Region. Like any other urban city in India Surat too has its own share of slums which have developed with the city.
FIG. (24) : POPULATION AND DECADAL GROWTH OF SURAT
Source: SMC, 2009
The decadal growth of the city population as evident in Fig (24) was maximum in the period of 1931-41. For two decades after that city show a decrease in the decadal growth, and starting at 1961, the positive trend continued till 1991 before ending lower during the period of 1991-2001. Surat city has seen an unprecedented growth in last four decades recording one of the highest growth rates in the country and a 10-fold population rise. The City now ranks as the 9th largest city in the country. Coupled with this the spillover of population into periphery has also been observed. From time to time jurisdictional limits of SMC have also been extended to include the outgrowth. At present SMC area is about 112 Sq. Kms. There are about 6.50 Lakh people (2001) residing in the immediate periphery of the city.
Table (27): Surat Municipal Growth Statistics (Area and Population) Sr. No Description 1951 1961 1971 1981 1991 2001
1 Area (sq.km) 8.18 8.18 33.85 55.56 111.16 112.27
2 Population 223182 288026 471656 776583 1498817 2433785
3 Growth Rate - 29.05 63.75 64.65 93 62.38
4 Density 27,284 35,211 13,934 13,977 13,489 21,677
Source: CDP Surat
The fact that the growth rate of slum population was always higher than the city population growth indicates that low income immigrants were a dominant factor in city growth. It also indicates that housing demand was higher than supply. This trend seems to have been
ACCCRN – City Vulnerability Assessment Report 71
reversed since 1990s with large investments in weaker section housing and also relocation of slums along with slum growth of peripheral areas beyond the city limits.
The early development of slums in Surat was not mainly from the pull factor as is the story with many of the urban cities and Class-I and Class-II towns but it is more to do with the “push” factor from the villages, where the size of land holdings and the need for alternate employment pushed the population from the villages to look for employment in Surat (Das, 1998). The major slum population in the city consists of people from Semiarid and arid regions of Kachchh and Saurasthra (Gujarat), Khandesh region of Maharashtra, Orissa and parts of Uttar Pradesh and Bihar. Rests of the states have very little proportion in the total population of the slums. As is apparent from Table (27), the increase in the growth rate of the population of the slums (1973 onwards) has always been higher than the population of the city as a whole (the period from 1992-2001 being an exception) and this has continued to grow over time. The extending of the city limits to 326.5 sq km in 2,006 has changed the population profile of the city and this will need further analysis.
City growth: Surat city area before 1961 was only 8.12 sqkm, while in 2009 it had expanded to 326.5 sqkm. The oldest part of the city developed in the area between the train station and the area known as Athwa lines. Since the 1990s, most of the new development including the most desirable location for the city's burgeoning middle and upper class is the area between the Athwa lines and Arabian Sea.
Since the inception of Surat Urban Development Authority (SUDA) in late 70s, the City is growing at a rapid pace; though the development in the peripheral areas was not that rapid until 2001. Population growth rate between 1991 and 2001 did not result in the horizontal urban sprawl; on the contrary, it densified the core city areas, which were part of the Municipal Corporation. Surat, like other industrial towns with labor intensive employment opportunities, has grown very fast over the last five decades especially with the textile sector and the diamond sector providing ample opportunities for the migrant population coming to the city. The diamond sector started picking up in 70s when the low wage rate and other problems shifted the trade from Mumbai to Surat.
The city claims to be zero unemployment city, which is to true to a great extent due to demand for labour across the various sector of industry.
5.4 Economic Base of Surat
The evolution of the power loom and handloom sectors led to gradual growth of textile industries gradually. Another important addition since the 1950's is the diamond cutting and polishing industry. In the last two decades, especially during the eighties large-scale industries have come up in Surat and its peripheries. The economic base of Surat consists of textile manufacturing, trade, diamond cutting and polishing industries, intricate Zari works, chemical industries and the petrochemical and natural gas based industries at Hazira established by leading industry houses such as ONGC, Reliance, ESSAR, and Shell. The City accounts for:
42 % of the world’s total rough diamond cutting and polishing,
70 % of the nation’s total rough diamond cutting and polishing,
40 % of the nation’s total diamond exports,
40 % of the nation’s total man made fabric production,
ACCCRN – City Vulnerability Assessment Report 72
28 % of the nation’s total man made fiber production
18 % of the nation’s total man made fiber export, and
12 % of the nation’s total fabric production. As estimated (1997-98) the industrial sector in the city contributed a gross amount of Rs.14667 million to SMC as taxes, Rs.27512 million as Excise Duty, Rs.6050 million as Income Tax and Rs.6976 million as Sales Tax. The region is one of the leading city-regions in the country that has attracted massive investments of which substantial proportion is under implementation. According to CMIE 2002, the Surat City region has a proposed investment of about Rs. 11,817 Crores. In addition projects worth Rs. 2,022 Crores are under implementation in Hazira SEZ.
Resources Base Water
The city exploits both surface and ground water sources, though 90 percent of the gross daily water supply is from Tapi River through several pumping stations. Tapi River also provides the drinking and industrial water for the Hazira Industrial area. To prevent the sea water ingress, a weir was constructed during the last decade. Another weir at Kakrapar upstream in 1954 and the Ukai dam at the Madhya Pradesh border was constructed in the year 1972 respectively to harness the river basin for irrigation, flood control, and power generation.
Surat gets about 373 million liters of water daily (Figure for 1999), supplied through various surface water sources (NIUA, 2009). The current supply is about 120 liters per capita per day (lpcd). At present, SMC is serving about 97 percent of its total populated area and 95 percent of its population. For the areas outside the municipal corporation (SUDA area), there is no centralised water supply system. The drinking water is fetched from open wells or from various water supply scheme implemented by GWSSB (Gujarat Water Supply and Sewerage Board). SMC is at present augmenting the existing water supply scheme. Increased water supply is expected to result in a corresponding increase in wastewater generation. For this purpose, SMC had a master plan prepared for the augmentation of the wastewater disposal system in 1997. Of the total 112.274 sq. km of area, 92.19 percent of the habitable area has a comprehensive sewerage system. This was 29.45 percent in 1997. The augmented sewerage system under seven drainage zones has also resulted in the increase of population coverage from 56 percent to 97.10 percent at present within a span of eight years. The numbers of sewage pumping stations have also been increased from 18 in 1996 to 28 in 2005 with another two proposed at Pisad, and Bhesan-Jahangirabad. There are six sewerage treatment plants serving each of the six zones of the city. At present, the peripheral areas outside Municipal Corporation do not have any sewerage system implemented. SUDA has proposed water supply and sewerage projects in Pal and Vesu areas. Despite facing number of problems including low number of sewerage connections, ingress of storm water drain and solid waste in the sewers, old and dilapidated systems in some parts of the city, they are some of the best run sewage treatment plants in the country. The city today boasts of setting up three captive generation STPs which generates its own electricity for functioning of the STP. In addition SMC has applied for carbon credits for all these units.
Energy The energy needs of the Surat are very high especially because of the textile, diamond and the industrial units in the city. Technological up-gradation of Diamond industry by laser machine technology has led to a sharp increase in electricity consumption. In the textile
ACCCRN – City Vulnerability Assessment Report 73
segment also, rapid modernization through concerted efforts, introduction and increased usage of Two-For-One Twisting (TFO) machines by the major players has contributed to higher electricity consumption. The Surat Electricity Company Limited (SEC), established in 1920, supplies 2.6 billion units of power to more than 0.4 million customers spread across the 52 sq km of Surat city. The Company is known for having one of the lowest levels of transmission and distribution losses in the country. It sources its entire bulk power requirement from the Gujarat Electricity Board (GEB). GEB feeds power to SEC at 66 kV voltage levels at its various receiving stations, strategically located all over the city. SEC’s consumers are supplied power either at 11 kV (to its HT Consumers) or at 400/230 volts (to its LT Consumers). Still there are attempts being made to minimize the losses as the electricity needs of the city continue to grow. Rest of Surat is served by Gujarat Electricity Board.
Land With the establishment of the Surat Urban Development Authority (SUDA) the development plan for its entire area (including SMC’s area) was prepared, as provided under the Gujarat Town Planning and Urban Development Act, 1976. The planning area includes SMC and 148 villages of Choryasi, Kamrej, Palsana and Olpad Talukas. The urban sprawl has already been started outside of Surat city limits, along the radial roads and different corridors such as Udhana corridor, Dindoli corridor, Rander – Adajan – Olpad corridor, Nana – Varachha – Kamrej corridor etc (CDP 2006). The land use changes since the formation of SUDA is presented in the following Table (28).
Table (28): Land use in SUDA Planning area over years SI. No
Type of Zone Area in 1978
(Sq km)
% Area in 1995
(Sq km)
% Area in 2004
(Sq km)
%
1 Residential 26.96 39.96 61.89 46.77 98.06 57.54
2 Commercial 1.41 2.09 2.56 1.93 4.16 2.44
3 Industrial 10.06 14.92 27.84 21.04 30.23 17.74
4 Educational Public Purpose 5.40 8.00 7.35 5.55 5.80 3.40
5 Recreation Garden & Public Space
0.22 0.33 0.58 0.44 1.07 0.63
6 Transport & communication 7.91 11.72 16.61 12.55 15.61 9.16
7 Agriculture 15.50 22.98 15.50 11.71 15.50 9.09
Urbanised Area 67.46 100.00 132.33 100.00 170.43 100.00
Non Urbanised 654.54 589.67 551.57
Total 722.00 722.00 722.00
Source: Surat CDP 2006.
As shown the above table, the urbanized area nearly tripled from only 67 sq km in 1978 to 170 sq km in 2004. The decadal growth of more than 80% over this period is largely responsible for this growth. After the addition of peripheral areas in 2006, SMC area has expanded to 326.515 sq km. After the expansion of the limits of the Surat Municipal Corporation, the green area is bound to increase.
In Surat, there are three main Governing bodies namely, Surat Municipal Corporation (SMC), Surat Urban Development Authority (SUDA) and Hazira Development Authority (HADA) governing the industrial hub of Hazira. Approximately 334 square kilometres of the city comes under the jurisdiction of SMC with an estimated population of four million. SUDA covers the SMC and an additional 722 square kilometre area of 148 villages. The functioning of SMC is governed by the Gujarat Municipalities Act of 1963 and the Bombay Provincial Municipal Corporations Act, 1949. SMC performs obligatory and discretionary functions, as incorporated in the said Acts. The hydraulics Department under SMC is responsible for water supply and sewerage schemes in the city. The Gujarat Municipal Finance Board, incorporated under the Gujarat Municipal Finance Act, routes the loan and grant money and central aid provided by the State and Central Government to the ULBs. The 74th Constitution Amendment Act, 1992 has its essence in reforms and building new systems in the structural, functional and planning areas of municipal management and capacity building. The Gujarat Government appropriately adopted the notification and amended the Gujarat Municipalities Act, 1963 and the Bombay Provincial Municipal Corporations Act, 1949.
The governing structure of SMC consists of both political and administrative wings. The political wing is an elected body of councillors headed by a Mayor. The Commissioner, from the Administrative Services cadre, heads the administrative wing and is responsible for the strategic and operational planning and management of the Corporation. The Commissioner takes the decisions on behalf of the Board or the Standing Committee formed from the elected Councillors, while performing the duties of the Corporation. Surat Municipal Corporations consist of an elected wing and an administrative Wing. The Elected wing comprises of a general body of elected councilors headed by a Mayor, the Standing Committees and other statutory committees which look after the specialized functions of the SMC. The Standing Committee is the most powerful, with power to authorise works costing over Rs. 500,000. The head of the Administrative Wing is responsible for the strategic and operational planning and management of the corporation. The Municipal Commissioner is the head of the administrative wing and other Divisional Heads function under him. SUDA is responsible for preparing the SUDA Area Development Plan which includes the area governed by the SMC. Under the development plan the SMC is responsible for Town Planning schemes within the area under its jurisdiction. SUDA also has the responsibility to control unauthorised developments. The SMC also relies on outsourcing a considerable amount of infrastructure development.
Other institutions which have an important stake in the overall development of the city are Gujarat Pollution Control Board (GPCB), Surat Electricity Corporation, Public Works Department (PWD), State Highways Department and State Irrigation Department. The South Gujarat Chamber of Commerce and Industry (SGCCI) is among one of the important organizations with a history of almost 67 years. It plays an active role in providing feedback to the state and central governments on policy issues related to trade and industry. It is a parent association with 4,000 direct members, and around 67 affiliated associations accounting for 65-70,000 members. It has also taken lead in several city development efforts and has shown its capacity in flood relief and other social initiatives and works closely with several local NGOs. It is conscious of the Surat’s image in international arena and after each disaster; it has taken lead to provide relief in partnership with SMC and Civil society organisations.
ACCCRN – City Vulnerability Assessment Report 75
Autonomy and capacity Surat Municipal Corporation came into being under the Bombay Provincial Municipal Corporation Act (BPMC), 1949 and carries out all the obligatory and discretionary functions entrusted to it by the same. After the plague of 1994 the structure of the SMC was amended from a rigid vertical hierarchy to a more interactive horizontal structure. This has increased the extent of decentralisation of municipal governance. City has 38 election wards under seven administrative zones. Each of the seven zones across the city is vested with the authority to address local issues.
In general terms city corporations have powers to generate both tax and non tax revenues from their own sources. They also received grants, a share of taxes and loans from external sources. In recent years the SMC has performed well in financial terms which revenue and total income showing a sharp increase. Expenditure has also increased revealing a reasonable operating ratio. Between 2002 and 2008, the SMC’s funding came from Gujarat State grants (6.87 per cent), the Corporation’s own contributions (13.65 per cent) and loans (79.47 per cent). The SMC has been regarded as one of the models of excellence in urban management. SMC has average annual gross income of around Rs.3000 million and is known for highest revenue collections in Gujarat (NIUA, 2009). SMC has taken long strides in municipal self sufficiency and have financed their urban infrastructure projects by obtaining commercial bank loans. SMC obtained several commercial bank loans to finance water supply and sewerage projects. In 1999–2000, the Surat Municipal Corporation generated Rs 182 million by selling a 34,000 sq m site to a private developer (IIR, 2004). Surat also had floated municipal bonds in 1999 just after Ahmedabad Municipal Corporation. Between 1998 and 2004 SMC had and average of Rs. 25.77 billion of revenue receipt and expenditure of Rs. 18.18 billion and a resource surplus of Rs 7.59 billion, which was highest in 35 major cities of India (RBI, 2006).
Recently with new property registration drive, SMC could earn an additional income of Rs.20 Crore from the area based property tax by registering 32,000 new building, which includes residential and commercial premises (TNN, 2009). The city of Surat is identified as the second cleanest city in India at present. Surat Municipal Corporation was awarded The Dubai international award for 'Best Practice" by UNCHS (1999-2000).
The Gujarat State Disaster Management Authority (GSDMA), constituted by the Government of Gujarat in 2001 formulated the Gujarat State Disaster Management (GSDM) Policy. This policy enhances the authority to Municipal Corporation in dealing with disaster related measures in the city. The city of Surat has put in place a City Disaster Management Plan which broadly addresses the response functions for events of floods/tidal surge. Urban reforms are the main focus of good governance and service delivery to the inhabitants of the urban area. Several initiatives have been taken up at national level like 74th constitutional Amendment Act and Model municipal law. Further at State level Govt. of Gujarat has taken up several initiatives like creating investor friendly environment, repeal of Urban Land (Ceiling & Regulation) Act -1976 (ULCRA) etc. At ULB Level Surat Municipal Corporation had taken up several reforms and many of these are first of kind in country. Followings are the reforms done by SMC for better urban management and development.
Administrative and Technological Reforms
Vision – 2020 Plan and City Corporate Plan Micro and Macro Action plans
ACCCRN – City Vulnerability Assessment Report 76
Standardization, ISO certification, SCADA and induction of modern gadgets DCR Revision Transparency in administration Training to employees e-Governance & GIS Biometrics attendance system
Financial and Taxation Reforms
Accrual Based Double Entry Book Keeping Accounting System Outsourcing of Services & PPP Total Computerization Of Accounts With Balance Sheet Approaching Debt Free Financial Administration User Charges Efficient Tax Collection Life time vehicle tax
Energy Reforms
Energy Audit (Internal) Economical channel in Water Supply Grid, Demand Rationalization, Energy Bill
Monitoring, etc. Saving realised: Rs. 27.52 million / annum Energy Audit (External) Saving Identified: Rs. 22.1 million / annum; Saving
Realised: Rs. 7.56 million / annum Use of electronic ballast & hilumen fluorescent lamps. Saving realised: Rs. 7.6
million / annum Alternate street lighting during low traffic period Energy generation from Biogas produced at STP- 4 Biogas power plants at Anjana,
Bhatar, Karanj & Singanpore, with a total capacity of 3.5 MWe are in operation. Few more are in project planning process (Expected saving in Anjana Plant: Rs. 6 million / annum)
Energy conservation in water supply system LED based retrofits for traffic signaling system (Saving realised: Rs. 0.9 million /
annum) LED based retrofits for traffic signaling system
Disaster Management
Disaster Preparedness and Municipal Response Plan Strengthened relief & rescue system
Continuous Monitoring System
Monitoring within SMC is done at four levels, namely, corporation level, zone level, ward level and on the field. The standing committee meets once in a week every afternoon between 3 to 4 p.m. (headed by the standing committee chairman) Municipal Commissioner, wherein all the heads to discuss their problems issues and mitigation measures if possible, is done on daily basis.
Enhanced Powers The divisional head has been given the authority to sanction works up to a value of Rs 2 lakhs, with the permission of the Municipal Commissioner.
ACCCRN – City Vulnerability Assessment Report 77
Complaint Monitoring System At the ward level, all complaints are lodged in a register and a complaint lodger is given a white card for sanitation purposes and red card for engineering and public works. These complaints can be made between 7 a.m. to 6 p.m. either in person or on the phone. Complaint mitigation is carried out within a specific time period, a minimum of 24 hours with the upper limit as a week.
Collective Responsibility There is no distinction between departments in the SMC. Any official who observes something on the field is free to make suggestions or complaints since there is no water tight compartmentalization. All the officials are in a way responsible for all activities of the zone, in addition to their regular duties. There is perfect teamwork and all employees of SMC right from the Municipal Commissioner to the karamchari are treated equal partners in administration. Further, the senior SMC officials who comprise the Standing Committee take decisions with respect to transfers, etc. within SMC.
Improved Supportive Infrastructure Communication has become far more efficient. Officials are provided with vehicles fitted with wireless sets and are expected to pass information to the zonal commissioner, if they find any thing wrong, and are expected to visit the nearest ward officer or instruct the SSI / SI to attend to a particular job. Public Participation
The present drive in Surat is to upgrade its status from the second cleanest city to the cleanest city of India. Each locality has a member chosen on a voluntary basis, and he/ she in turn interact with the SMC and try to mitigate the problems at the earliest. It is an attempt to take management to the masses.
Computerization SMC is the first municipal corporation in India to develop an IT policy. SMC introduced computerisation in all its departments’ way back in 1998. Statistics are computerised on a daily basis and efforts are on to computerize the past records too. The town maps are digitized and details of each department are laid over. For this purpose SMC has imparted training to its staff through professional IT institutes. The Information Systems Department dutifully carries out the necessary functions to achieve the following objectives:
providing better services to the citizen at his doorstep, reducing overall administrative response time for various tasks, reducing the total cost of operations for the SMC, providing centrally organized information dissemination, having speedy and effective
communication system, establishing a knowledge repository for various processes and having an effective
management information system and decision support system with utmost effectiveness and efficiency.
5.6 Community-Resource-Government-Market linkages
Surat presents strong and efficient stakeholders with government, market and communities being able to understand the importance of efficient urban services and respond to the risk efficiently with limited resources. A quick SWOT analysis of three major stakeholders is presented in the Annexure (H). The SMC has been one of the most proactive ULBs in the
ACCCRN – City Vulnerability Assessment Report 78
country providing high quality of urban services including water supply, sewerage and solid waste disposal. It is also leading the efforts in energy conservation. The private sector stakeholders are well aware of need for business continuity in spite of facing high natural disaster risks. In addition to individual initiatives in social work and philanthropy, under the umbrella of SGCCI, private sector has taken several initiatives including support in relief activities, ensuring rapid return of industries and trade to normal after each disaster. The communities have always demanded for better services and have shown willingness to pay for the services, without raising issues. It has also responded to the initiatives of SMC and private sector in disaster relief activities.
Despite these, there are many issues that need to be addressed to strengthen the linkages for concerted action on adaptation. They are:
Most of the stakeholders are unaware of the future risks rising out of rapid urbanisation and climate change and associated vulnerability issues. For example, the city expanded in to the coastal zone, but land use rules to prevent the urban growth (especially high value real estate) in current and future high risk zones is still not in place. The coastal area may soon become one of the most sought after real estate.
One of the major constraints within the government departments is inability unable to manage Ukai dam sufficiently rising out of competing demands and lack of coordination. The warning time can be increased by better real time weather and river level monitoring, controlled releases to increase time for the SMC to respond.
The private sector, especially the real-estate development sector has not responded sufficiently to risks and uncontrolled growth may be increasing risks. Since the communities have little options, the housing without sufficient flood protection is observed.
Currently, Surat has sufficient water resources allocated to meet the urban demands. The industry meets part of its requirements from ground water also. The water conservation has not been thought seriously either by SMC or by communities. With growing demand, the community may have to learn about water and energy conservation and this can only be done by active coordination between government and communities, which will be a challenge in the currently water surplus city.
Surat has relied on labor oriented growth catalysed by migrant labor. Human resources base is still weak with significant proportion of low end/extremely specialized skill sets, which would require major retraining in case of shift in economy. The educational system is not geared to address these issues at the scale Surat may require in the future. While some efforts have been initiated by local Technical institutions the scale of demand may rise in case of major changes in industry sector. Even though the city economy is strong now, its vulnerability is also high. Disasters can be a potential tipping point.
5.7 Hydro meteorological Risks
The city of Surat, located on the western part of India in the state of Gujarat on the River Tapti, is an important historical trade centre and trade link between India and many other countries. The city has one of the highest proposed investments and almost zero percent unemployment. It is one of the fastest growing cities in India. Surat is located on the banks of Tapti river near it’s confluence with Arabian Sea. Tapti basin is about 587 km long from east to West and about 201 km wide (N to S) and is elongated in shape passing through Madhya Pradesh and Maharashtra. The basin has two well-defined physical regions, viz. the hilly
ACCCRN – City Vulnerability Assessment Report 79
region and the plains. The hilly region covers the Satpuras, the Satmalas, the Ajanta and the Gawilgarh hills with good forests. The Khandesh and the Gujarat plains are broad and fertile areas suitable for cultivation. The Tapti basin consists mainly of black cotton soils. The coastal plains in Gujarat are composed of alluvial clays with a layer of black soil on the surface. Flood History
Tapti is one of the large perennial rivers in western India. It is 724 km long originating from Multai in Betul district of Madhya Pradesh. It meets Arabian Sea near Surat. Total catchment area of the Tapti river basin is 65,145 km2 including about 79%, 15%, and 6% in Maharastra, MP, and Gujarat respectively. In the catchment area of Tapti River, the monsoon generally starts during the third week of June and there are occasional heavy rainstorms from the beginning of August to the end of September. The mean annual rainfall in the basin is estimated to be about 758 mm. and the average monsoon rainfall from 1988 to 1998 was 897 mm. The maximum annual rainfall (1168 mm) and the minimum of (257 mm) were recorded in 1944 and 1899. Most of the floods in Tapti occurred during August. Throughout the history of more than seven centuries, the city of Surat has experienced floods, fires and plague epidemics. The city earlier had a flood protection ring wall built with bricks and several gates, which were closed during floods. Westerly moving depressions arising out of Bay of Bengal moving from upper Tapti catchment to the Arabian sea cause heavy rainy spells lasting 3-5 days. The runoff often gets concentrated due to this process, causing heavy river discharges by the time the flood water reaches Surat. During the period 1876 to 2009, the Tapti crossed the danger level at Hope Bridge in Surat 27 times, i.e., on an average every five years. While the river within embankments can safely discharge about 0.3 million cusecs, the inflows of up to 1.3 million cusec for 3 to 5 days has to be managed to control floods, often at the end of the rainy season. Due to these conflicting objectives, the dam cannot provide complete flood control safety to Surat. Since the city is located near the mouth of the river, the high tides also reach the western part of the city. The Tapti flood during the high tide also prevents smooth outflow of flood discharges resulting in higher flood levels and consequent damages.
However, the floods were not regular as seen from the Table (29) presented below.
Table (29): Reported Surat Floods
Sl. No. Year Total
1 1870-1879 1
2 1880-1889 3
3 1890-1899 1
4 1910-1919 1
5 1930-1939 3
6 1940-1949 4
7 1950-1959 3
8 1960-1969 2
9 1970-1979 3
ACCCRN – City Vulnerability Assessment Report 80
Table (29): Reported Surat Floods
Sl. No. Year Total
10 1990-1999 3
11 2000-2009 3
Grand Total 27
Source: SMDP
The 1968 flood was the biggest flood with peak flow of about 15 lakh cubic feet of water per second (Cusecs). The flood in 1970 too was quite big with a peak flow of 13.14 lakh cusec. (IIMA 2007).
Box (6): Story of the Ukai Dam Ukai multipurpose Dam was constructed to irrigate the coastal plains of Gujarat with three objectives of irrigation, electricity generation and partial flood control. According to the introductory booklet published by the State Government on the Ukai Project: “This project would provide effective protection against floods to Surat city and other downstream areas. It would be possible to release water from reservoir in advance in a regulated manner, as soon as warning of the approaching flood is received from the upstream areas. This would create adequate space in the reservoir to store floodwaters.” Ukai has a gross cultural command of 0.38 million ha. It also provides drinking water for most of the towns in Surat, Valsad and Navasari districts. Located in the semi arid zone, the Ukai catchment has high diversity in rainfall pattern and managing summer irrigation and drinking water at the same time as a reservoir for flood control which is challanging. Source: Climate Change Explorer In addition to Tapti floods, Surat also faces the local floods from two small streams passing through southern part of the city. These streams flood only during heavy local rains and can cause damage to the settlements located near the banks. These floods are called Khadi floods (khadi, means small stream). The losses due to flood damages are very high. The 2006 floods has reported to have caused property damage worth Rs.21,000 Crores (Source: South Asia Network on Dams, Rivers & People) Around Surat, large areas that were previously agricultural fields and thus were open, has been brought under the city limits and developed. As a result, many high-rise apartments and other buildings have come up in those areas. Besides these, many factors like construction in flood plain areas, flood embankment, filling of riverbed by 3 meters at Hazira in hundreds of square km area, silting of riverbed due to tides, construction of Singanpore weir, construction of new bridges, etc., has reduced the carrying capacity of the River and open space for spread of floodwaters.
5.8 Climate change Scenario for Surat
Precipitation
Total annual rainfall is expected to increase in Gujarat and adjoining western Indian plateau by 250 to 500 mm as per most of the climate models under A2 and B2 Scenarios. This has significant bearing on Khadi floods. The HADCM3 and CCCMA model also indicated higher precipitation over Tapti basin, the climate analysis of the last Century also indicates the increasing frequency of heavy rainfall events separated by long dry spells. The number of days accounting for more than 200 mm of rainfall is expected to increase in the predicted future climate scenarios (CCCMA). The events in which the precipitation will be more than 350 mm also are likely.
ACCCRN – City Vulnerability Assessment Report 81
FIG. (25) : ILLUSTRATING THE AVERAGE MINIMUM TEMPERATURE VALUES THAT WERE USED AS THE INPUTS FOR THE PREDICTION (CONTROL -
JANUARY 1, 1961 TO DECEMBER 31, 2000)
Source: Climate Change Explorer Tool
FIG. (26) : ILLUSTRATING THE AVERAGE MAXIMUM TEMPERATURE VALUES THAT WERE USED AS THE INPUTS FOR THE PREDICTION (CONTROL -
JANUARY 1, 1961 TO DECEMBER 31, 2000)
Source: Climate Change Explorer Tool
Fig. (25) and (26) illustrate the average minimum and average maximum temperature values that were used as the base data. Even though the average minimum temperature values remain constant for the series of the models, there exists a minor variation in the average maximum values used by two models i.e. GISS E-R and IPSL CM4. From the Figure 24, it is also evident that the base line data used by these two models were not same with the rest of the models. They do not represent the decrease in maximum temperature with the onset of monsoon, which is not consistent with existing pattern. This has been the existing condition in the case of Surat. Since the base line data represents the observed values or the collected information, these need to be constant irrespective of the model used. Much variation within such data would add to the uncertainty within the modeling results. Therefore these two models were eliminated from the analysis.
ACCCRN – City Vulnerability Assessment Report 82
FIG. (27) : ILLUSTRATING THE TOTAL MONTHLY PRECIPITATION OF THE INPUT DATA USED BY THE VARIOUS MODELS (CONTROL - JANUARY 1, 1961 TO
DECEMBER 31, 2000)
Source: Climate Change Explorer Tool
Fig. (27) illustrates the difference between the predicted values and the historic observed data. From the figure it is evident that the MK3 model depicts an extreme condition for the same scenario i.e. Futurea (January 1, 2046 to December 31, 2065). From the results it is evident that there could be a likely decrease in the average precipitation of around 250 mm. This extent of decrease is relatively deviant from the predictions of the other models. Such deviation is also evident within the depicting the minimum average temperature anomaly and the average maximum temperature anomaly respectively. Based on the analysis of deviations the MK3 model’s prediction results were restrained from further analysis.
Fig. (28), (29) and (30) depict the total monthly anomalies (Futurea: January 1, 2046 to December 31, 2065 – Control - January 1, 1961 to December 31, 2000) of precipitation, minimum temperature and maximum temperature respectively. From the it is evident that the CSIRO’s modeled precipitation is lower than the rest i.e. prediction of decrease in precipitation, whereas, the remaining models predict an increase in monthly precipitation ranging to 240 mm during the months of June to July.
On the other hand, all the models predict a likely increase in the minimum temperature. Even though there is a variation in the prediction results there is consensus among the models that there would be an increase in the minimum temperature with a variation of 1 to 5 degree centigrade. This may aid the disease causing pathogens to survive well into the winter giving rise to the possibility of increase in the health related issues. The model predicted results indicate a likely increase in the maximum temperature similar to the minimum temperature ranges.
ACCCRN – City Vulnerability Assessment Report 83
FIG. (28) : ILLUSTRATING THE TOTAL MONTHLY PRECIPITATION ANOMALY (FUTUREA - JANUARY 1, 2046 TO DECEMBER 31, 2065 WITH RESPECT TO
CONTROL - JANUARY 1, 1961 TO DECEMBER 31, 2000)
Source: Climate Change Explorer Tool
FIG. (29) : AVERAGE MINIMUM TEMPERATURE ANOMALY (FUTUREA - JANUARY 1, 2046 TO DECEMBER 31, 2065 WITH RESPECT TO CONTROL - JANUARY 1, 1961 TO
DECEMBER 31, 2000)
Source: Climate Change Explorer Tool
FIG. (30) : AVERAGE MAXIMUM TEMPERATURE ANOMALY (FUTUREA -CONTROL)
Source: Climate Change Explorer Tool
ACCCRN – City Vulnerability Assessment Report 84
Below Fig. (31) illustrates the future predicted anomaly of the number of rainy days5. From the figure, based on the results from all models except ECHAM5, it is likely that the numbers of rainy days may increase. The future projections indicate the possibility of rainfall decreasing during the onset of monsoon and increase during the monsoon extending till the month of November. In Surat, the monsoon period is currently from June to September. The likely increase in rainy days during the months of May, October and November may lead to a minor shift in the rainy season. This effect is likely to have both positive and negative impacts. The positive impacts include the increase in water availability if managed effectively. The negative impact of any such shift in monsoon may compel certain farmers in either shifting their cropping type or pattern.
Any such shift will depend on the location, current crops grown in that region and their dependency on the rainfall. In either case, if proper adaptation measures including mitigation efforts are taken well in advance, may lead to less impact on the small scale and subsistence farming community.
5 The rainy days are classified as periods in which the average rainfall per day is over 10 mm
ACCCRN – City Vulnerability Assessment Report 85
Fig. (32) Indicates likely dry spell duration anomaly for the city of Surat. Similar to the rainy day anomaly, the negative dry spell6 anomaly is evident within the prediction results of all the models. These results if analyzed in relation with the prediction results of the number of rainy days may lead to a future where the rainfall during the monsoon may be evenly distributed. This effect may benefit Surat and its stakeholders in better planning and managing the water resources.
FIG. (33) : SURAT - AVERAGE MINIMUM TEMPERATURE ANOMALY (FUTUREA -CONTROL)
Source: Climate Change Explorer Tool
Fig. (33) Illustrates the model predicted estimates of the future minimum temperature anomalies. From the results it is evident that there is not much variation within the models. The model predicted results indicate an increase of around 5 degrees in the winter and around 3 to 4 degrees during the monsoon and summer season. There is a strong correlation between the minimum temperature range and the survival rate of pathogens. Any increase in the temperature during the winter is likely to increase the survivability of pathogens (especially disease causing). This could likely lead to increase in the number of health related issues. The increase in the minimum temperature as projected within the results of all four selected models may likely have an effect on the health of the inhabitants within the city. The impact of increase in minimum temperature has to be studied in detail with respect to the Surat city to estimate the possibility and the probability of such events from happening.
Below Fig.(34) illustrates the model predicted maximum temperature anomalies. Similar to the minimum temperature increase the estimations of the maximum temperature are uniform across the models with minor variation during the pre monsoon and monsoon months. The models predict a possible increase of around 4 to 5 degrees during the winter months.
This infers that there is a possibility that in the future there could be shorter winters with the average temperature being well above the normal. If such scenario unfolds then it is also likely that there may be an increase in the energy consumption by the people. Further if such change takes place, it may also have an impact on selected crops and energy intensive low margin industries.
6 There also exists less variation in these results as in comparison with the rainy days anomaly. The dry spell indicates an extended period of less or no rainfall. This effect is less severe than the drought.
ACCCRN – City Vulnerability Assessment Report 86
FIG. (34) : SURAT-AVERAGE MAXIMUM TEMPERATURE ANOMALY (FUTUREA -CONTROL)
Source: Climate Change Explorer Tool
FIG. (35) : CCCMA: PRECIPATION RANGES
Source: Climate Change Explorer
ACCCRN – City Vulnerability Assessment Report 87
FIG. (36) : CCCMA: PRECIPATION
Source: TARU analysis, 2009
ACCCRN – City Vulnerability Assessment Report 88
Temperature increase Most of the climate models predict a May monthly average of temperature change of 2.5 to 5 degrees in Gujarat over next 90 years under B2 and A2 Scenarios respectively. The Maximum average temperature events (temp above 30 degrees C) are projected to increase according during next 40 years as per the CCCMA model as shown in the Fig. (37).
FIG. (37) : CCCMA: MAXIMUM AVERAGE TEMPERATURE EVENTS ACROSS MONTHS(YAXIS)
Source: Climate Change Explorer
Potential CC impacts on Surat
The CC risk profile of Surat includes floods, sea level rise, water scarcity and temperature rise. Flood risk is among the key risk since it occurs almost once in four to five years, since 1990, six flood events have affected Surat.
Floods The future precipitation trends as explained above can potentially increase flood frequency and peak discharges in to Ukai dam, which is a matter of concern since Surat’s population has been growing at a rate of more than 60% and the population at risk is going to grow proportionally. With the flood plains getting narrowed by human interventions and sea level rise, the inundation levels are likely to increase. Modeling these events is likely to be a challenge since the Surat’s flood plain is being modified with embankments, land filling and raising the ground level of Hazira industrial area, which will modify flood routing significantly. The observed relationship between discharges and inundation is expected to be amplified significantly due to loss of flood plain area as well as sea level rise.
Cyclones and Sea level Rise risk Surat lies at an altitude of about 10 m above mean sea level with a tidal range of about 4 m. Cyclones are not common and only two events of cyclones passing through Gulf of Khambhat is reported from last 140 years, the recent being 1976. Surat has been reporting rising highest high tide levels during July, with some of the Khadi areas are evacuated during July high tide days as a precaution. The highest tide of 2007 inundated some of the coastal areas never before submerged during tides. The sea level rise is also likely to impact coastal
ACCCRN – City Vulnerability Assessment Report 89
aquifers and also erode parts of Dumas beach, which already has been reporting coastal erosion.
Water supply issues under competing demands Even though current demand of about 700 mld is allocated to SMC by the Irrigation department, the city is growing at the rate of more than 67% over last decade and similar trend is likely to continue. Also the growth of Hazira industrial area also requires considerable water for meeting industrial demands. As earlier stated, Ukai dam water resources are primarily allocated to irrigation. Drinking water demands for urban and rural areas of Surat, Valsad and Navsari districts are increasingly being met from Ukai dam. The current allocation will not be sufficient with expected population growth with near doubling of the population every 15 years. Under these conditions, the water allocation across sectors may have to be renegotiated, especially under climate change induced increases in frequency of droughts or low rainfall years in the catchment.
5.9 Capacity and Vulnerability Assessment
Vulnerability Survey Sample size and distribution
A total of 929 households over 110 settlements were sampled along with 110 geopsy samples. The details of GIS based analysis results are provided in the following Table (30).
Table (30): SURAT: Population estimates (No of households) Type Slum Lower Middle Mixed Upper Grand
A map showing land use and the areas dominated by various SECs across the city is presented in the Annex (I). The total population in the area covered is about 3.5 million. The area covered under GIS does not include the peripheral areas added to SMC in 2006. The results of Vulnerability analysis across sample settlements is presented in the Fig. (38).
ACCCRN – City Vulnerability Assessment Report 90
FIG. (38) : SURAT: CAPACITY & VULNERABILITY INDEX ACROSS SAMPLE SETTLEMENTS
Source: TARU Primary Study, 2009
ACCCRN – City Vulnerability Assessment Report 91
5.9.1 Education capacity index
Surat city has been attracting workers for a variety of industries ranging from textiles and diamond demanding less of education but more of special skills. The new industrial area of Hazira is dominated by heavy engineering, petrochemicals steel and fertilizers, which require engineering and related educational qualifications and also management and other professionals. Unlike many other growing cities, Information technology related industries have not taken firm root in Surat, but such transformations can occur in near future demanding changes in structure of manpower demand. A brief profile of the maximum household level education across the samples is presented in the Map (Annexure (J)). The city level estimation of Education Capacity Index across SECs is presented in the following Table (31).
Table (31): SURAT: Education capacity index Sl. No.
Education Index
Slum Lower Middle Mixed Upper Grand Total
1 1-2 4% 3% - - - 1%
2 2-3 70% 13% 1% - - 11%
3 3-4 18% 46% 36% 50% - 36%
4 4-5 8% 8% 11% - - 7%
5 5-6 - 7% 19% 38% 29% 18%
6 6-7 - 24% 11% 12% 16% 13%
7 7-8 - - 20% - 55% 13%
8 8-9 - - 2% - - 1%
Grand Total 100% 100% 100% 100% 100% 100%
Source: TARU Primary Study, 2009
The lower income groups and slum dwellers show very low education index. A large number of lower and slum dwellers are migrants coming from distant sources with manpower demand for low educated/skilled work including manual labor, textile works, and other informal sector activities. The manpower market is well paying especially in diamond and related industry and a significant proportion of the middle class belong to these industries, with only requirements of skills to polish diamonds. The social support in these industries is very good and demand for well trained workers is high. Surat city is capable of major shifts in economy as has evidenced in case of diamond industry. Diamond industry is only about 3 decades old and has taken firm roots, but the industry leaders are also worried about shortage of raw diamonds and growing competition. Major changes may be in the offing over next couple of decades and retraining the large man power with low educational levels may be a challenge. During the last economic downturn, many diamond workers had to shift to textile industry for nearly a year, but building skills and capacities of existing manpower to match future changes in industry will be a challenge.
Since the climate change is likely to increase the risk of floods, adaptation measures including awareness generation activities have to be able to target people with diverse background and skill sets, especially those with low education and skills.
ACCCRN – City Vulnerability Assessment Report 92
5.9.2 Income stability index
Surat claims to be a zero unemployment city attracting migrants from as far as eastern coast. The income levels are much higher when the cost of living is also taken in to account. However, there are large numbers of informal workers, in addition to people engaged in formal industry. The composition of occupations across the sample settlements is presented in the Map (Annexure (K)). The following Table (32) presents the city level estimates of occupation based on the sample survey analysis.
Table (32): City level proportion Occupation classes Surat (based on GIS) Sl. No.
The unskilled and associated workers comprise more than half of the slum dwellers and nearly one fifth of the total city level working population. These workers provide the basic support to a variety of industry including construction, vegetable vending etc. This section of the population is most vulnerable during droughts since their incomes are mostly based on daily work. Construction is one of the booming activities requiring large number of informal workers. Even though average incomes and labor costs are high, stability is one of the major issues especially for informal workers. The flowing Table (33) presents the city level estimates of income stability index.
Table (33): SURAT: Income stability index Sl. No.
Income Stability
Slum Lower Middle Mixed Upper Grand Total
1 2-3 32% 30% - - - 10%
2 3-4 22% 3% 4% 20% - 8%
3 4-5 34% 3% 20% 7% 4% 14%
4 5-6 5% 6% 37% - 53% 22%
5 6-7 5% 51% 35% 74% 38% 41%
6 7-8 2% 7% 4% - 5% 4%
Grand Total 100% 100% 100% 100% 100% 100%
Source: TARU Primary Study, 2009
ACCCRN – City Vulnerability Assessment Report 93
The income stability index across SECs shows highest diversity, ranging from lowest to highest even among the slum dwellers. Risk taking is common since opportunities are high. The occupational shifts are also common, but the lower SECs and new migrants face stability problems. At the city level, about one third of the households have income stability index less than 5 indicating need for expansion of skills. Under the climate change related impacts like increased flood frequency, the households should be able to have higher income stabilities to develop resilience. The floods can wipe out the savings and productive assets, which can significantly impact the incomes and stability of informal sector and delay economic recovery. Most of the migrants have strong affinities with their native communities but these many not help economically, and their resilience mainly depends largely on how soon the industry is able to restart after the disasters.
5.9.3 Social capacity Index
Surat is a city of industry and trade and reflects some of the fast life style pattern of Mumbai. Even with the fast lifestyle, the social networking and mutual support is quite high among the Gujarati community and even higher in case of Surtis, as evidenced by some of the first successful co-operative institutions in the state, even though it is highly business oriented environment.
The social networks are strong among most communities from Gujarat, with the history of tough living conditions especially communities from arid and semi arid zones. The following Table (34) presents the social capacity index across SECs in the city
Table (34): SURAT: Social capacity Index across the City Sl. No.
Social Capacity Index
Slum Lower Middle Mixed Upper Grand Total
1 0-2 87% 33% 13% 7% - 23%
2 2-4 12% 32% 50% 64% 7% 41%
3 4-6 1% 11% 37% 18% 31% 24%
4 6-8 - 23% 1% 12% 61% 11%
5 8-10 - 1% - - - 0%
Grand Total 100% 100% 100% 100% 100% 100%
Source: TARU Primary Study, 2009
The higher social capacity indices are observed in Middle upper SECs compared to lower and Slum dwellers. The lower SECs have dominantly migrants coming from distant states and such a pattern can be expected in highly diverse communities.
The lower SECs show a distinct bimodal distribution showing peaks high as well as very low indices. This may be due to dominance of Gujarati communities (mainly from Saurashtra), in some of the trades like diamond industries accounting for higher index compared to textile workers who are mainly migrants from other states as far as Orissa and UP. The estimates of households migrating from other states are presented in the flowing Table (35).
ACCCRN – City Vulnerability Assessment Report 94
Table (35): SURAT: Estimated composition of households by state of Origin across SECs
Sl. No.
State Slum Lower Middle Mixed Upper Grand Total
1 Gujarat 48% 56% 79% 85% 87% 64%
2 Maharashtra 25% 22% 9% 7% 1% 17%
3 Rajasthan 1% 1% 3% 0% 2% 2%
4 Uttar Pradesh 10% 8% 5% 4% 1% 7%
5 Orissa 11% 4% 1% 1% 1% 5%
6 Bihar 2% 1% 0% 0% 0% 1%
8 Punjab 0% 0% 2% 0% 0% 0%
9 Others 3% 8% 1% 4% 8% 4%
Total 100% 100% 100% 100% 100% 100%
Source: TARU Primary Study, 2009
Immigrants comprise more than half of the total population among Slum dwellers. The proportion of households from other states reduces in the higher SECs. This reflects well with the social capacity index shown in the earlier Table (35).
The fairly high social capacity index, especially in the middle and upper SECs are evident by the higher resilience of the city. Unlike in other cities, the social networking is best used to help each other especially during the crisis and afterwards. The city could mobilize whole society for quick recovery from the disasters like plague and recurrent floods. The city was back to normal within nearly month after 2006 floods where more than 75% of the city was submerged with a total loss of more than Rs. 20,000 Crores. Also the city could take hard decisions after the plague of 1994, where the municipality demolished many buildings in the core city to open the roads. The city is able to take harsh decisions due to high cohesion for public causes. Under the continued risks of floods and other hydrometeorological events strong social capital itself is an asset. Therefore strengthening the social capacties especially among migrants will be necessary so that the poor are able to build resilience through better coordination and mutual support. Unfortunately the NGO and microfinance coverage is limited in Surat compared to many other cities and other avenues to build social capital have to be explored. The informal networks may have to be strengthened, which are present but not strong among the migrant population.
Also existing social networks among the middle and upper SECs can be facilitated to take focused action to build resilience for the poor. Many such efforts have been taken by SGCCI and philanthropic individuals after every disaster or danger. For example, SGCCI has taken initiatives to ensure business continuity after disasters by providing food and transport facilities to workers to ensure continued earning soon after the disasters. The city has always contributed to relief efforts after major disasters outside the city including Bhuj earthquake and Kosi floods. Tapping these resources and networks can significantly improve the adaptive capacity of the city.
ACCCRN – City Vulnerability Assessment Report 95
5.9.4 Drainage and sewerage vulnerability index
Surat is proud of one of the best maintained drainage and sewerage networks in the country. It had nearly 100% coverage of drainage and sewerage, which has reduced after expansion of the city in 2006.
Drainage network is extremely important in this high rainfall climate and nearly flat terrain conditions. The monsoon preparations every year starts in Late April and almost all drains and sewerage is cleaned to avoid water logging. An efficient solid waste collection was put in place after the plague of 1994, which reduces possibility of clogging of drainage and sewerage network. Only in peripheral areas, sewerage and drainage network is partially laid and is being covered under JNNURM project. A well managed solid waste collection and disposal system is working in Surat as the survey also indicates. The solid waste collection system reduces the possibility of blockage of drainage due to build up of uncollected garbage flowing in to the drainage. The results of solid waste disposal arrangements at household level are presented in the following Table (36).
Table (36): Solid waste disposal arrangements across SECs Sl. No. Solid Waste Disposal at HH level Slum Lower Middle Mixed Upper Sample
Total
1 House to House collection 65% 78% 92% 97% 99% 80%
2 Dumping in Waste Bin 25% 9% 3% 2% 1% 11%
4 Throw in the River/Nala 2% 2% 0% 2% - 1%
5 Dump on street/ Outside 4% 7% 2% - - 4%
6 None 4% 5% 3% - - 4%
Total 100% 100% 100% 100% 100% 100%
Total Households 295 247 258 71 58 929
Source: TARU Primary Study, 2009
More than three fourths of the respondents reported house to house collection, which is an evidence of the functioning Solid waste collection system. The pre-monsoon preparations of cleaning of the drains further reduce the possibility of water logging.
Table (37): City wide Drainage and sewerage index across the SECs ( as % of each SEC)
Sl. No.
Drainage & sewerage
Vulnerability Index
Slum Lower Middle Mixed Upper City Total
1 0-2 51% 36% 90% 100% 100% 76%
2 2-4 31% 49% 0% - - 15%
3 4-6 14% 6% 2% - - 4%
4 6-8 3% 9% 8% - - 6%
SEC Total 100% 100% 100% 100% 100% 100%
Source: TARU Primary Study, 2009
ACCCRN – City Vulnerability Assessment Report 96
The vulnerability due to sewerage and drainage network is presented in the above Table (37). The core city has excellent drainage and sewerage despite being located in the flood plain with high rainfall environment and the densest pockets with multistoried buildings, and ensuring good service is a challenge in such high load situation. The analysis indicates that 85% of the core and 74% of the periphery has a vulnerability index less than 2 indicating very good quality of infrastructure and services.
The SMC is able to provide efficient service in case of any problems. The grievance redressal is quick and professionally managed. Its sewage treatment plants are adjudged as one of the best maintained in the country with modern technologies including sewage gas based energy system which saves significant proportion of energy costs of sewage treatment.
Sankey diagram for Surat Figures 39, 40, 41 & 42 illustrate the Sankey diagram for different SECs based on average consumption among each category.
FIG. (39) : SLUM HOUSEHOLD
Source: TARU analysis, 2010
FIG. (40) : LOWER CLASS HOUSEHOLD
Source: TARU analysis, 2010
ACCCRN – City Vulnerability Assessment Report 97
FIG. (41) : MIDDLE CLASS HOUSEHOLD
Source: TARU analysis, 2010
FIG. (42) : UPPER CLASS HOUSEHOLD
Source: TARU analysis, 2010
The water usage pattern in Surat is slightly lower than that of Indore. This may be due to different water usage habits, wastage of water due to intermittent supply and use of different types of equipment. In Surat controllable flush taps are common, While in Indore flush tanks are more common leading to wastage. It may be noted that Gujarat has a tradition of conservation of water in every activity due to semi arid climate.
5.9.5 Loan and insurance vulnerability index
Since Surat is an industrial city dominated by small and medium industries, incidence of loans is expected to be high. The ownership of household and movable assets is quite comparable to the metros and penetration of formal credit is quite high compared to other cities. Also, in this high natural disaster risk prone area, insurance penetration especially in
ACCCRN – City Vulnerability Assessment Report 98
the business sector is expected to be high. The analysis is presented in the following Table (38).
Table (38): Loan and insurance vulnerability index Sl. No.
Loan & Insurance Index
Slum Lower Middle Mixed Upper Grand Total
1 0 - - 4% 12% 4% 4%
2 1 - - 11% 7% 24% 8%
3 2 1% 1% 4% 20% 16% 6%
4 3 3% 2% 37% 11% 5% 20%
5 4 45% 51% 18% 19% 44% 30%
6 5 48% 46% 19% 31% 7% 29%
7 6 3% - 5% - - 3%
Grand Total 100% 100% 100% 100% 100% 100%
Source: TARU Primary Study, 2009
The analysis indicates that 68% of the households have loan and insurance vulnerability less than 5 while only 32 percent lying between 5 and 6. High per capita incomes and good understanding of risks may be the main reasons for such low vulnerability. Even among the poorer SECs, incidence of loan is low and also the insurance coverage seems to be high.
5.9.6 Flood vulnerability index
Floods are the most common disasters facing the city, affecting up to 75% of the households as evidenced by 2006 floods. The flood vulnerability index captures the responses from different households across the city. The indicator includes reports of flood damage, depth of inundation and duration of inundation. The results are presented in the flowing Table (39).
Table (39): Flood Vulnerability Index Sl. No.
Flood Vulnerability
Index
Slum Lower Middle Mixed Upper Sample Total
1 0-2 15% 3% 37% - 5% 20%
2 2-4 8% 5% 8% - - 6%
3 4-6 0% 6% 3% - 7% 3%
4 6-8 33% 10% 21% 39% 64% 25%
5 8-10 43% 77% 30% 61% 24% 46%
Grand Total 100% 100% 100% 100% 100% 100%
Source: TARU Primary Study, 2009
Since most of the slums and low income settlements are located near or inside the flood risk zones, the these two SECS are differentially more vulnerable than the other SECs. Similarly, the Mixed SECs which are found in the core city (which is more flood prone) and near the Khadis in the peripheries also are more prone compared to Middle and upper SECs. Also these categories mostly live in single or two storied houses and therefore more directly impacted by floods than the middle and upper SECs who have higher proportion of
ACCCRN – City Vulnerability Assessment Report 99
households living in high rise buildings. The results are in conformity with the information that about 75% of the population was affected by the floods of 2006.
Flood damages reported by the respondents include mainly damage to houses, movable assets. The composition of house types across the sample settlements is presented in the Map (Annexure (L)).
5.9.7 Hydrometeorological risk exposure
Risk from Khadi floods were assessed based on the distance from the stream (Khadi). Under the climate change scenarios, the local floods are likely to increase and the population at risk is presented in the following Table (40).
Table (40): Households at risk from Khadi Floods across SECs based on GIS analysis Sl. No. Risk type Slum Lower Middle Mixed Grand Total
1 Khadi Medium 40% 54% 57% 54% 51%
2 Khadi High 60% 46% 43% 46% 49%
Percentage total 100% 100% 100% 100% 100%
Total households 18,800 20,959 22,716 8,771 71,246
Source: TARU Primary Study, 2009
About 71,000 households are at risk based on the analysis out of which nearly half are located in the floodplain within 50 m from the stream. The slum and lower SEC groups comprise 50% of the risk prone households. The actual numbers may be different due to terrain conditions and manmade obstructions to flood discharge. The 2006 Tapti flood inundation map was used to analyse the households at risk at city level. The results are presented in the following Table (41).
Table (41): Households Across SECs potentially prone to 2006 Flood inundations (GIS analysis)
Sl. No. Flood Risk Slum Lower Middle Mixed Upper Grand Total
1 < 3 feet 19% 24% 28% 37% 10% 26%
2 3-5 feet 27% 23% 21% 37% 32% 25%
3 5-10 feet 21% 8% 28% 17% 30% 22%
4 >10 feet 33% 46% 24% 8% 28% 26%
Percentage 100% 100% 100% 100% 100% 100%
Total Households 45,786 82,412 218,471 73,571 37,574 457,814
Source: TARU Field Study, 2009
The middle class is the most affected SEC as per the analysis, even though most of the poor are located along the drainage lines. However, the people living in multistoried apartments are less likely to be impacts as much as lower and Slum SECs predominantly living in single storied houses. About 75percent of the city population is affected by floods. The direct risk from sea level rise is only about 5,000 households located along the tidal creeks. The SLR risk prone areas are not populated yet, except for few thousand houses near Dumas. With the expansion, the SLR risk prone areas, especially along the tidal creeks are expected to grow. A strategy for controlling these risk prone areas from real estate
ACCCRN – City Vulnerability Assessment Report 100
development is necessary to avoid future damage from sea level rise related risks. The measures may include use of these lands for recreation and other uses with minimal investments on development. Even though structural measures like seawalls may prevent coastal erosion but long term costs and benefits have to be against possible catastrophic damages from cyclones etc should also be evaluated. Major modifications in hydrological regime have taken place in Surat and Hazira. Embankments in the city area have constrained the flow within the normal river banks. Overall Raising of the ground level by more than 3 m in Hazira and closure of tidal creeks that could potentially drain the water further reduced the flood plain. Sea level rise is likely to further aggravate the free flow of flood waters. The climate change scenarios indicate increase in rainfall by about 100-200 mm of annual rainfall. Also the monsoon rainfall is expected to be dominated by heavy rain spells separated by longer dry spells. All the above changes can potentially increase the frequency of floods. While near real time weather and hydrological information based management of Ukai can overcome minor Tapti floods, the competing objectives of the dam (irrigation, drinking water, power and partial flood control) cannot avoid the late monsoon floods. With the population increase in the Ukai command area, water demands are only expected to grow. One of the most important adaptation needs would be to learn to live with the floods, with anticipative planning to reduce the damages. Surat has already taken steps like uninterrupted water supply even during floods, and aims to harden power supply, communication and other essential services; integrated planning to live with floods will be topmost adaptation agenda for the city.
5.10 Advanced Warning Mechanisms and Coping Mechanisms
The Surat Municipality has implemented elaborate monsoon preparation process to mitigate risks. The activities include gearing up the administrative system, cleaning up the drainage and sewerage systems and preparedness for emergency evacuation and regular evacuation drills etc. The full set of activities is beyond the scope of this document. Ukai water levels are monitored regularly and there are many LED hoardings displaying the Ukai reservoir levels to warn the people. Also advance warnings are provided by megaphones and short messaging system (sms) through mobile phones. These advance warning systems have helped in greatly reducing the loss of life. The surveys covered some of these aspects and the findings relevant in current context as well as possible integration of early warning system design are described. Responses were sought to understand the respite time the different households got from the early warnings received. The results are presented in the following Table (42).
Table (42): Early warning message received before the 2006 floods Across SECs (as % of SEC)
Sl. No.
Early warning time(hours)
Slum Lower Middle Mixed Upper Grand Total
1 No warning 46% 47% 41% 28% 37% 43%
2 <3 hours 17% 22% 22% 14% 25% 20%
3 3-6 hours 18% 15% 15% 12% 13% 16%
4 6-9 hours 5% 5% 5% 5% 5% 5%
5 9-12 hours 5% 5% 10% 14% 5% 7%
ACCCRN – City Vulnerability Assessment Report 101
6 12-24hours 9% 6% 5% 28% 16% 9%
7 >24hours - - 1% - - 0%
Grand Total 100% 100% 100% 100% 100% 100%
Sample size 295 255 258 58 63 929
Source: TARU Field Study, 2009
About 43% of the sample households could not recollect receiving the early warning. Some of them could not recollect since the event is 3 year old. More than half the households reported having received the warning. There is a small difference across SECs who recollected the early warning messages. Increasing the respite time will be critical in preventing losses and also to move their valuable assets to safe places. Improving respite time with location specific warnings can help in greatly reducing losses to movable assets, in addition to life. The analysis results of source of warning are presented in the following Table (43).
Table (43): Source of Flood Warning across the SECs Sl. No.
Source of warning
Slum Lower Middle Mixed Upper Grand Total
1 Not received 46% 48% 41% 28% 37% 43%
2 Television 18% 26% 34% 53% 38% 28%
3 Loud Speaker 22% 15% 8% 5% 10% 14%
4 Neighbor 9% 5% 10% 10% 6% 8%
5 Community 2% 0% - - 2% 1%
6 Radio 2% 4% 3% 3% 3% 3%
7 Others 1% 1% 2% - 5% 2%
Grand Total 100% 100% 100% 100% 100% 100%
Source: TARU Field Study, 2009
TV is the main source of warning recollected by the respondents followed by the messages over the loudspeakers. Other options like mobile voice messages (especially to illiterate or semiliterate) and sms can potentially give early warning along with these media. Unfortunately, TVs and other movable household assets take the heaviest damage during floods, especially among poor households living in single storied buildings in more flood prone areas.
Advanced Warning Mechanisms (Communication systems) Mobile sms was also tried to transmit the early warning to people during the 2006 floods. The mobile phone penetration has increased greatly since then and data on ownership of the mobile phone across SECS was collected to explore possible use of these devices for early warning as well as potential for two way information transfer during the event and to get on ground performance on relief activities. The results are presented in the flowing Table (44).
ACCCRN – City Vulnerability Assessment Report 102
Table (44): Mobile phone coverage across SECs among the sample households (as % of SEC)
Sl. No.
No. of Cell phones
Slum Lower Middle Mixed Upper Grand Total
1 Nil 40% 35% 21% 21% 30%
2 1 43% 42% 35% 43% 25% 39%
3 2 11% 15% 26% 25% 43% 19%
4 3 4% 7% 11% 8% 20% 8%
5 4 1% 1% 5% 2% 10% 3%
6 5 2% 2% 2% 1%
Total 100% 100% 100% 100% 100% 100%
Sample size 295 247 248 61 60 911
Source: TARU Field Study, 2009
The Surat Municipal Corporation is planning to set up a GIS assisted two way information system which includes geotagging of all the residential buildings, pre-monsoon update of people requiring special medical care during emergencies (elderly, infirm, babies, pregnant women etc) and also volunteer and mobile sms based two way information system to track essential information. Mobile telephony can play a very important role in this disaster management system. Coping mechanisms
The households have developed several coping mechanisms depending on the economic affordability and site specific requirements. They include raising the plinth, raised shelves, attics, new first floor in their houses. The prevalence of one or more such interventions across the respondents is presented in the flowing Table (45).
Table (45): No of coping measures reported by respondents across SECs Sl. No. No. of coping measures reported Slum Lower Middle Mixed Upper Grand Total
1 Nil 47% 64% 67% 72% 67% 60%
2 1 46% 30% 27% 28% 29% 34%
3 2 7% 5% 6% - 3% 5%
4 3 1% 0% 0% - 2% 1%
Grand Total 100% 100% 100% 100% 100% 100%
Note: Sample Size 929
Source: TARU Field Study, 2009
The coping measures are predominantly adopted by the slum dwellers living mostly in single storied houses in most flood prone areas, where they are also exposed to occasional water logging during heavy rains. Some of the coping measures are not relevant to middle and upper class households, who stay in less water logging prone areas and/or multistoried buildings. Slum dwellers have developed a system of storing all their valuable documents in a plastic pouch which is carried by the members shifting to temporary shelters, while the able
ACCCRN – City Vulnerability Assessment Report 103
bodied members stay as watch and ward to their valuable assets like TV, furniture etc. This behavior can potentially increase the risk of drowning of the persons who stay behind, if the flood waters are too fast or inundation is higher than the roof tops. The city stakeholders have been studying feasibility of setting up of asset banks across the city on the lines of railway cloak rooms, where high risk prone households among the poor SECs can store their assets like TVs, Bicycles, motorbikes and productive assets like sewing machines before the floods and can collect them after the floods. This can potentially reduce the recovery period.
5.11 Industrial profile
Diamonds
Surat has about 4500 diamond factories of various size, but about a dozen major factories employ more than 250 persons. This industry employs more than 0.6 million persons in Surat. Processing part of Diamond Industry is dependent on skilled labor. The skill is developed through exposure to the work and experience. Most of the skill development involves mutual trust and sincerity. These skills are often transferred and passed to the close relations of the skill person. Even though the people get orientation from training institute, the actual skill is based on the good eye sight, touch. Some of the workers either graduate to higher levels of the work or move out of the industry when they get old. Almost 90% of the workers in the Surat diamond industry are migrant workers from from Surat, Bhavnagar, Amreli, Rajkot, Banaskantha and Ahmedabad districts. Very few persons from other states are engaged in diamond processing industry of Surat. Quality of skills and trust relationships between owners and workers are some of the major reasons for this trend.
Textiles Surat is known as the textile city of Gujarat. The textile industry in Surat is mainly engaged in the activities of yarn production, weaving, processing as well as embroidery. The textile industry is one of the oldest and the most widespread industries in Surat. Surat is well known for its synthetic products market. It is mainly engaged in the production and trading of synthetic textile products. About 0.5 million power looms are reported to be working in Surat, with additional upstream and downstream industries. On an average, nearly 30 million meters of raw fabric and 25 million metres of processed fabric are produced in Surat daily. It is reported that there are about 0.5 million power looms in the city. The city has several textile markets dating back to Centuries. Zampa Bazaar, Bombay Market, JJ Textile Market and Jash Market are among them. Katar Gam, Magdalla and Udhana are the areas of Surat where manufacturing is mainly concentrated. People from other states like Rajasthan, Orissa and West Bengal are settled in Surat to carry out their textile business. Currently Orissa tops the number of in-migrants engaged in Textile industry.
The main market for Surat’s textile products are India and other Asian countries. Around 90% of polyester used in India comes from Surat. However, international demand for its products is not very significant. The Middle East is the major export market for Surat’s textile products. According to experts, more improvisation in the quality is required to cater to the demands of the international market. About 0.15 million persons are engaged in textile industry in Surat. Surat’s textile industry consists of many small and medium units and associated downstream and upstream activities including texturising, dyeing and zari and embroidery works. The city is known for computerized embroidery works.
Industry vulnerability survey. This survey was carried out to understand the vulnerability from hydro meteorological disasters as well as understand resource dependency. Less emphasis was laid on economic
ACCCRN – City Vulnerability Assessment Report 104
aspects to avoid poor responses and suspicion. A total of 50 industries were covered under this study. They mainly included diamond and textile and allied industries
Water use: Water is critical for dyeing and related industries. Due to concerns related to chemical pollution from dyeing industry, Surat textile industry is shifting toward embroidery based textiles. In other industries, water is not so much critical compared to other resources like electricity. Water use for dyeing was reported to be about 9-10 litres/m and in the printing industry it is about 12 to 15 litres/m of cloth produced. The water consumption for chemical industry is highly variable. Most of the other remaining industries use water mostly for drinking and other personal hygiene uses. Out of 16 dyeing units only three of the dying industries reported using water softening plants. All the four chemical industries reported that the water quality available from SMC and GIDC is not of the quality desired by them. All the diamond industries have Reverse osmosis plants for drinking water. Due to fairly stringent water quality requirements for dyeing and chemical industries, they would prefer to use the municipal water, but some of them are using ground water due to unavailability of municipal water. Out of the 16 dyeing industries interviewed, 10 industries reported using ground water in addition to municipal/GIDC water supplies. The water shortage was reported in none of the units. About 8 percent of the respondents across 50 interviewed reported emerging hardness problems in water quality. This indicates possibility of saline water intrusion.
Energy issues All the industries are dependent on electricity to various degrees. The energy consumption is highly variable across the industries. It is reported that about 40% of the cost of production of textiles is accounted by electricity. Surat industries are generally well off in terms of electricity supply during normal months, with virtually no scheduled power cuts and few unscheduled cuts reported. During summer months once in a week 12 hour cuts were reported by 72% of industries surveyed. These industries are mostly located in the outskirts of the city.
About one fourth of the surveyed industries reported having undertaken the energy audits. They include 80% the diamond industries and 25% of the dyeing industries surveyed. This indicates that there are significant opportunities in reducing energy consumption in textile industries including weaving and dyeing industries.
Priorities All the surveyed industries were asked about their priorities in resource management issues. The results for different interventions to improve resource use efficiency is reported below:
ACCCRN – City Vulnerability Assessment Report 105
Table (46): Priority of Regular Energy Audit among the industries
Type of Industry High to low
1 2 3 4
Chemical 6% 67%
Diamond Processing 19% 11% 33% 50%
Dyeing & Processing 39% 22%
Embroidery 11% 11%
Weaving 17% 44% 50%
Engineering 8% 11%
Grand Total 100% 100% 100% 100%
The Table indicates that less than half the industries in any of the sectors find it a future priority to improve energy use efficiency. Since both diamonds as well as textile industries are energy intensive, there is possibility of reducing the costs of production significantly by energy conservation. Energy audits have been done in about 80% of diamond industries already and the rest feel the importance of energy audits. Similarly, about 25% of dyeing industries also have already conducted energy audits and about 39% are feeling it a priority.
Water recycling priority Water would be a key resource for this city undergoing rapid population growth and competition over Tapti water from Irrigation sector. Managing water, especially during summers, under changing rainfall patterns dominated by extremes will be a challenge with the water demands growing with rapid growth in population and industries. Even though the textile sector is reportedly shifting from dyeing and printing to embroidery, thereby reducing water use and pollution, demands from other sectors and Hazira township is expected to be another competitor for limited water resources. The industries responded to their priority for water recycling and their responses are presented below.
Table (47): Water Recycle and Reuse Priority among the industries
Type of Industry 1 2 3 4
Chemical 50% 50%
Diamond Processing 10% 90%
Dyeing & Processing 69% 6% 13% 13%
Embroidery 40% 40% 20%
Weaving 36% 27% 9% 18%
Engineering 50% 50%
Grand Total 42% 16% 10% 30%
ACCCRN – City Vulnerability Assessment Report 106
As mentioned earlier, the chemical and dyeing industries are water intensive and both of them reported high interest in water recycling and reuse options. Higher interest among them can potentially lead to significant reduction in water use and pollution problems in the city and neighborhood. It may be noted that the SMC has already planned to install additional sewage treatment plants and resale of water to industries. There can be synergy between industry and the SMC in this direction.
Disaster impacts Floods caused havoc during 2006 and industry took nearly a month to get back to production. Some of the industries located in the eastern edge of the city did not get inundated and their impacts were absence of labor reporting to work. The surveyed industries were asked to provide the losses suffered from the 2006 floods. The following Table (48) presents the findings:
Table (48): Capital and stock losses from Floods(in Rs. Million)
Year Type of Industry
Diamond Processing
Dyeing & Processing Embroidery Engineering Weaving Grand
Total
1998 0.1 0.1
2006 2.4 4 0.65 0.015 7.5 14.565
The other studies of city wide losses to industry was estimated earlier is presented in the flowing Table (49).
Table (49): Industry sector losses from 2006 Floods ( Rs. Billion)
Industrial loss (direct and indirect) 160 (Direct 95, Loss of production 65)
Loss to public infrastructure including dam, flood embankments, electricity, and telephone lines etc.
25
Diamond processing industries 26
Textile processing industries 20
Small and big shops (around 70, 000) 10
Other Losses
Loss of work (around 77% working population) 15-30 days
Source: People’s Committee on Gujarat Floods 2006: A Report, page no 46-48
Based on this study Surat is currently well endowed in terms of water and energy, but can potentially face water and energy crisis under climate change scenarios or energy costs escalations. The survival of the textile industry with lower profit margins will depend on a combination of cheap labor, energy and water costs. It may be necessary to improve efficiency in resource use so that the industry can remain competitive with other textile production centers of the country and as well as internationally.
ACCCRN – City Vulnerability Assessment Report 107
Institutions Surat serves as an educational centre for areas of South Gujarat. It has 363 primary schools 355 high schools and 263 higher secondary schools. The higher education institution details are provided in the following Table (50).
Table (50): Higher education institutions in Surat
Colleges Numbers Arts 7
Commerce 15
Science 6
Technical 4
B.Ed 6
Law 2
Physical Education 1
Computer 5
Management 2
Medical 2
BBA 2
University 1
Total 53
A total of 10 colleges were surveyed to find out the resource dependency and vulnerability issues. All of them reported no shortage of water or electricity. Even though all of them had SMC water supply, 6 of them also have their own tube wells. None of them reported any problems of neither quality nor dependency on tankers for water. No change in quality was observed from both SMC supply as well as tube wells.
All the colleges reported satisfactory electricity supply and only four of them, have backup generators, which are sparingly used. Out of 10 colleges, six felt that energy audit is a priority along with focus on energy efficient lighting. Nine out of ten colleges reported having suffered damages from 2006 floods. Two of them reported moderate impacts, five of them reported high impacts and one reported extreme impact. The direct losses suffered ranged from 23,000 Rs to 10 million. Out of them two of them reported more than 0.5 million Rs. as direct losses. The water electricity supply is currently not a major issue for the institutions. This situation can change over coming decades, but over all impacts on education sector is not going to be major, since their requirements are not high. Disaster impacts are moderate compared to other sectors. Hospitals
Surat is an important centre for medical services for neighboring region in addition to meeting local needs. A total of 475 hospitals were reported from the city and the detailed statistics are presented in the following Table (51).
ACCCRN – City Vulnerability Assessment Report 108
Table (51): Hospital bed capacities in Surat
Sl. No. No of beds No of hospitals
1 Up to 10 274
2 11-20 159
3 21-50 26
4 51-100 4
5 101-500 9
6 More than 500 3
Total 475
A total of 10 hospitals were surveyed. Out of them one was a clinic. The rest had a total bed capacity of 1341 and occupancy rates of 25% to 85% were reported. Gross energy use of about 10 KWH/bed/day was reported by three hospitals while two reported less than one kwh/bed/day. The range is mostly due to type of comfort provided (e.g. Air conditioning). Diesel backup generators were reported by half the respondents with dependency of about 5% on the backup generators. Only two hospitals had energy audit conducted and have shifted to high efficiency lighting systems. Six respondents reported high priority for improving the energy management to reduce wastage of electricity.
Water supply from SMC was the main source used by all with half of them reporting tube wells in their premises. The water quality from both sources are reported to be of quality less than desired and 8 of them had Reverse osmosis systems installed to meet high quality water demands, which is expected due to higher specifications in labs and operation rooms. It may also be a strategy to reduce risks of contaminated water. None of the hospitals had water recycling system, which is expected due to requirements of high quality water.
Half of the respondents reported damage from 2006 floods with direct losses ranging from 0.5 to 7 million Rupees. None of them have invested on any coping/adaptation mechanisms. Since hospitals are most essential services, focus may have to laid in developing specific adaptation plans to ensure their operations during and after floods.
Hotels and Restaurants Surat is well known for its distinct cuisine and it is bustling business city with large number of business travelers visiting on short trips. The city hotel infrastructure is often insufficient to meet the demands.
Table (52): Hotels and restaurants in Surat
Hotel & Restaurant Category No.
5 Star Hotel 1
4 Star Hotel 1
3 Star Hotel 4
2 Star Hotel 19
1 Star Hotel 26
Guest House 26
ACCCRN – City Vulnerability Assessment Report 109
Guj Thali & Multi cuisine Restaurant 14
South Indian & Multi cuisine Restaurant 25
Punjabi & Multi cuisine Restaurant 63
Chinese Speciality Restaurant 2
Pizzeria & Fast Food Restaurant 26
Continental & Multi Cuisine restaurant 3
Veg& Non Veg Multi Cuisine Restaurant 10
Total 220
There are only 77 hotels with majority of them catering the needs of budget clients. The above list does not include unorganized restaurants and road side fast food caterers. A total of 9 hotels/restaurants and 10 restaurant owners were interviewed. The total capacity was 476 rooms indicating an average of 50 rooms per hotel. The occupancy rates were all above 90% except one which reported 67%. Average gross electricity consumption per room ranged from 1 KWH/room/day to 21 KWH/room/day. Three hotels reported electricity consumption more than 10 kwh/room/day. In three out of 10 respondents reported using more than 50% of total electricity consumed for space cooling during summer months. This indicates that there is significant saving of electricity is possible especially in space cooling. Four out of nine reported using diesel backup generators, but its use was found to be very small. None of them reported using solar power sources. Scheduled power cuts were not reported by any of the respondents. None of the hotels reported conducting energy audit. Only five hotel owners reported using SMC water as well as tube wells, rest were solely depending on SMC water. Gross water consumption per room is highly variable since some of the hotels also have restaurants. The minimum ranged from about 60 l/room/day with as high as 3,900 l/room/day which have restaurants. Ground water dependence ranged from 0% to about 30% with one reporting 50%. None of the respondents reported water recycling. A total of five hotels reported to have suffered from 2006 floods. The direct losses ranged from 5000Rs (single case) to as high a 1.2 million Rs. Only the restaurant reported coping mechanism of installing a movable stove. Disaster impacts seems to be minimal despite most of them being located in the submergence area of the 2006 floods. This may be an understatement or they are able to shift most of the valuables to higher stories. One of the hotel is located in 10th and 12th storey and it reported minimal damage.
5.12 CRGM model
Community Resource Government Market (CRGM) Model is depicting basically the relationships between these four actors. This model also depicts the interplay of actors and their interdependence. This is illustrated in the self explanatory Fig. (43) which shows the relationship between the Community and Government is high as compared to Community and Market.
ACCCRN – City Vulnerability Assessment Report 110
FIG. (43) : LINKAGES SHOWING RELATIONSHIP BETWEEN RESOURCES, MARKET, COMMUNITY AND GOVERNMENT
Source: TARU analysis, 2010
Nodes:
Surat is a major industrial and trade city of Gujarat. It has a history of over several centuries as a textile trading centre and port. Due to its long history, it has a well developed urban local body supported by the citizens. It has responded to rising needs in terms of service delivery as well as managing disasters. It has a well developed health services including the health surveillance system, strengthened after the Plague of 1994. It has leveraged most of the opportunities rising from adversities like epidemics, and disasters. For example post 1994 plague, the city was cleaned up and many narrow roads in the inner city area were widened by demolishing existing buildings. Similarly, after the 2006 floods, the water supply and sewerage system was modified to address flood related breakdowns. Also, the SMC internalized the process of monsoon preparation to reduce losses from floods. These examples show the capacity of the city administration to respond to adversities while internalizing the processes to prevent/mitigate losses. The city administration has dedicated staff with high motivation levels and takes pride in their capabilities and achievements.
Market The city’s economy revolves around textiles ,diamonds, petroleum and industrial hub of Hazira. The market is well connected with national and international clients, which necessitates emphasis on business continuity and image of the city as the reliable source of goods and services. The long history of trade with other countries has provided considerable experience in dealing with the client needs. Even though it is dominated by small and medium scale industries run by close knit groups, it has achieved synergy through the networks. High reliance on in-migrant labor has been the issue, but industries and trade sector provides much needed support to the in-migrants coming from diverse backgrounds through a variety of support systems, which is especially quite efficient in diamond industry. It is claiming to achieve the status of zero unemployment city in India. The market players, due to
ACCCRN – City Vulnerability Assessment Report 111
their needs and attitudes have supported long term positive but short term unpleasant decisions as exemplified by road widening, water tariff increases etc. Demand for better services is the main motive of the industry and trade sector, due to concerns regarding business continuity. The industry has been actively pursuing energy efficiency measures, which may be driven by costs of services and need for competing with lower production costs. Some of the industries have invested on captive windmills so that the costs of production can be reduced as well as get tax benefits. Community
The formal civil society organizations are rather less prominent in the city level decision making, advocacy and related efforts. However, there are large numbers of formal as well as religious/worker unions/community groups which are active. Close community affinities among in-migrants based on location of their origin is also fairly strong. The rapid growth of the population indicates that the recent in-migrants now form significant population group within the city. However, these groups are not very active in the development work Industry and city administration has been working with individuals and small groups especially during and after the disasters in the city.
Resources Surat is located in a humid and water sufficient region with Tapi River providing more than 95% of the city water requirements. It also has good alluvial aquifers, but saline water intrusion is becoming an issue especially in near coastal parts of the city. The city is able to provide 140 lpcd water to the citizens. With rapid growth of the city and competing demands of water from irrigation sector can create potential issues over water from Ukai dam in the coming decades. Its energy requirements are met by local power generating stations and from Gujrat state grid. It is supplied through both Torrent power (a private company) as well as from Dakshin Gujarat Vij Company Limited. Power cuts are uncommon and the city has sufficient source of power. Other major sources of energy include petrol, diesel and CNG, which is currently not a major issue. The land resources are scarce and the city may need to expand its limits in the coming decades mainly due to shortage of land.
Linkages The linkage between the community and resources, especially water, are largely mediated through the SMC. The market has very limited role in water management and distribution. The customer satisfaction is high as evidenced by very limited use of ground water, especially by domestic and industrial sector in the city. The industries in the outskirts of the city depend significantly on ground water, whose quality is reportedly deteriorating due to saline water intrusion. The quality sensitive industries, (e.g. dyeing and printing) use municipal water for processes and use ground water for other activities like washing etc. The land market is dominated by private players with limited role of regulation in the hands of SMC. SMC wants changes in land regulations to reduce settling of population in risk prone areas. It has been successful to some extent in relocating poor from high risk zones, but land issues still remain.
Electricity, another major essential resource is fully mediated through the market and government run distribution company. The quality of power supply is quite satisfactory as indicated by minimal use of captive generating sets in the city. The government market linkages are quite strong and synergy is quite high. This is illustrated by several combined efforts of the industry and trade (mainly through SGCCI) including disaster management, environmental protection and regular consultations between the SMC and SGCCI.
ACCCRN – City Vulnerability Assessment Report 112
The linkages between markets and community in access and management of resources are minimal; since the SMC is a major player in service delivery. However, the SMC has been developing several private public partnerships in solid waste handling and this trend may include sewerage treatment and other sectors. However, the linkage is likely to be managed through contracts with SMC and not direct link between community and markets.
5.13 Conclusions
Surat represents a high risk urban environment with a long history of floods, plague, fires and droughts. The city has seen expansion and decay cycles repeatedly and has developed high resilience to natural disasters like floods. The state of resilience is demonstrated by quick recovery from the repeated floods, especially 2006 floods. The climate change scenarios indicate increase in precipitation by 200-500 mm, but Surat’s flood risks are associated mostly with the rainfall patterns in Tapti basin. Even in the catchment in the Deccan plateau, rainfall increase is expected. The actual increase in flood frequency will depend on variety of factors including Ukai dam management under competing demands of water vs flood control, manmade changes in hydrology( including city expansion in to flood plains, land filling of Hazira for reducing flood/sea level rise risk to high value industries) and sea level rise. The flood data and anecdotal evidence indicates that man made changes are causing higher levels of floods and Ukai dam cannot provide full flood control with competing demands on water during summers.
Temperature increase is likely to cause increase in space cooling periods both in workspaces as well as in houses. Since Surat is a high humidity environment, comfort index may shift to discomfort levels most parts of the year due to rise in temperature. Resultant energy demands are likely to be quite significant.
Surat is a city growing at about 60+ percent over last two decades and expected to keep the same pace of growth in this decade also. Its economy is dominated by industries requiring low and medium skill workers and less by high education levels. This is one of the major issues that would face the city if the structure of economy changes. It has not been able to shift to IT or other sunrise industries as is seen in the other million plus cities. The lower SECs are low skill workers migrating from other states due to pull migration.
The city infrastructure and essential services are well developed and managed. The SMC has been able to take proactive action with long term planning aimed at serving all sections of the society. After the Plague of 1994, the SMC has continuously invested in infrastructure and services to increase the coverage, improve efficiency and to harden the essential services against floods. The results are evident by the sample study findings, especially in water supply, drainage, solid waste collection and Sewerage.
It is also observed that due to the existence of several large and medium scale enterprises the incidence of loans is on the higher side. Also, the penetration of insurance is expected to be high due to the area being risk prone. Surat Municipal Corporation has internalized the Monsoon preparations and improved preparedness against the floods. The performance of early warning system is good but there is scope for quantum shift in early warning systems using IT, satellite based weather monitoring reinforced with telemetered ground weather stations and advanced real time flood models. Even with all these, the city may well have to prepare for a paradigm shift to “living with floods” rather than flood-proofing the city. Surat does not face major issues of essential resources, except for land and associated flood risks. SMC is likely to remain a major player in providing essential services like water
ACCCRN – City Vulnerability Assessment Report 113
supply, sewerage and transport. The role of market and civil society is strong, mainly through semi formal/informal organisations. This trend is likely to continue in near future. The markets are well aware of issues like disaster related risks and have been able to manage most of them, but losses have remained high as evidenced by last floods. The sea level rise and possible increase in cyclone and storm surge frequencies is another major concern. Even though the city is not currently affected much by high tides, the city expansion in 2006 has made Surat a coastal city with Dumas costal area included in the city. Any expansion of the city in this area is likely to increase the sea level rise risk to the city.
The city is capable of positive paradigm shifts since the communities have proved to take decisions that are disadvantageous on short term but beneficial on long term, like expansion of roads in the central city.
5.14 Adaptation options
Surat is one of the fastest growing cities in India with per capita incomes better than most million plus cities. At the same time it faces multiple issues including rapid urban growth and economy mostly dependant on low skilled labor, without major transformation in structure of economy since last decade. While the growth has increased the income levels, it has also created new challenges on city infrastructure. Even with this growth rate, the SMC has been able to perform better than most cities in terms of infrastructure and services. Any adaptation measure planned should address the issues of rapid growth.
Surat is facing major flood, sea level rise and temperature increase risks, with more than 75% population is at risk. The city has to learn to live with floods with possible increase in frequency. This would mean understanding future risks under increasing urbanization, man made changes and responding to risks by hardening the infrastructure, early warning systems and minimal discontinuity in business activities. Land use planning and enforcement of development rules based in risk categorization, upgrading housing and other private infrastructure top withstand floods should be the area of focus. This information may be made available in public domain so that growth in high risk zones like tidal creeks, beaches etc is discouraged. Insurance sector should be supported with information on risk zoning and incentivized to expand into lower SEC households. Group insurance system, especially for the lower SECs, may be explored. City level insurance financed by surcharges on house tax may be another option that can be explored. Early warning system needs to be improved to increase respite time, while the communities have to be trained to best use the respite time to minimize damages. Community level response contingency plans would be necessary to minimize damages and losses. Asset bank systems, community level pooling of resources etc will need to be built or existing systems needs to be improved. Existing informal arrangements need to be strengthened and formalized. To live with floods, the city dwellers may be trained to take effective individual and collective action to manage life with minimal disruptions, through best use of resources at building/neighborhood levels. During the floods, the SMC and relief agencies should be able to manage with better use of information technologies and databases. The monsoon preparations need to include updating database of old, infirm and persons requiring special care and provisions for cost effective two way communication with them, to provide support.
ACCCRN – City Vulnerability Assessment Report 114
A well managed Emergency Operations Centre with access to real-time weather and hydrology information on one hand and ground level situation data is necessary on the other hand. This will help in increasing the effectiveness of disaster management. The lower SECs and slum dwellers may be trained to understand risks and to respond effectively during the floods. The growth of slums in high risk areas may be controlled by delineating risk zones on ground and regular removal/shifting of new slums to safer areas. It would require innovative approaches to prevent such encroachments from taking place. The slum rehabilitation programmes should incorporate features to live with the floods. Detailed flood risk assessment followed by designing suitable structures incorporating flood protecting features may be incorporated during the planning stage onwards. SMC has already initiated a competition on these lines, which may be incorporated in the slum rehabilitation programmes. The Urban community development department of SMC should have a strong role in enabling the slum communities to adapt to floods.
ACCCRN – City Vulnerability Assessment Report 115
6 REFERENCES
Anton, Danilo J. (1993), Thirsty Cities: Urban Environments and Water Supply in Latin America, IDRC, Ottawa, 197 pages; UN Habitat (2006), Meeting Development Goals in Small Urban Centres; Water and Sanitation in the World's Cities 2006, Earthscan, London.
Aromar Revi (2007), “Climate Change Risk: An adaptation and mitigation agenda for Indian Cities” - Background paper prepared for the Global Urban Summit, 8-13th July 2007, Bellagio, Italy Davis Satterthwaite, Saleemul Huq, Mark Pelling, Hanniag Reid and Patrica Romero Lankao (2007), “Adapting to Climate Change in Urban Areas”, Working paper produced byteh Human Settlements Group and the Climate Change Group at the International Institute for Environment and Development (IIED). de Sherbinin, Alex, Andrew Schiller and Alex Pulsipher (2007), "The vulnerability of global cities to climate hazards", Environment and Urbanization, Vol. 19, No. 1, pages 39-64; Rosenzweig, C. and W.C. Solecki (2001).
Divya Sharma and Alka Bharat 2009, “Conceptualizing risk assessment framework for impacts of climate change on water resources”, Current Science Vol. 96, N0. 8, 25 April 2009 Dzikus, A 2003, “Water Demand Management Strategy and Implementation Plan for INDOREIndore” Habitat Debate Vol. 9 No. 3 UN-HABITAT, 2003 http://ww2.unhabitat.org/hd/hdv9n3/15.asp
Gleick,P 2003, "Global Freshwater Resources: Soft-Path Solutions for the 21st Century," State of the Planet, Science 302: 1524-28. doi:10.1126/science.1089967
India-Urban Poverty Report 2009. The Ministry of Housing and Urban Poverty Alleviation, Government of India, with the support of the United Nations Development Programme (UNDP). IPCCa 2001, The Scientific Basis, Third Assessment Report of the IPCC, 2001.
Kennedy, C.A., J. Cuddihy, and J. Engel Yan (2007). The changing metabolism of cities, Journal of Industrial Ecology. May. [doi:10.1162/jiec.0.1107][www.mitpressjournals.org/doi/abs/10.1162/jiec.0.1107]. Kumar, R. et al 2005, Water resources of India. Current Science. 2005, 89, 794–811.
Kundu, A. (1997). “Trends and Structure of Employment in the 1990s: Implication forUrban Growth “, Economic and Political Weekly, 32 (4): 1399-1405.
Ministry of Finance, (MoF) 2008. Economic Survey, 2007-08. New Delhi, India Ministry of Housing and Urban Poverty Alleviation 2004. https://jnnurmmis.nic.in/jnnurm_hupa/index.html http://www.foundationcenter.org/pnd/news/story.jhtml?id=242600022
MoA, 2005. Analysis of trends in operational holdings, Ministry of Agriculture and Cooperation, Government of India
MoHUPA 2009. Modified Guidelines for Integrated housing and slum Development programme. Ministry of Housing and Urban Poverty alleviation Government of India
UN20010: World Population Prospects: The 2008 Revision. Population Division of the Department of Economic and Social Affairs of the United Nations Secretariat, , http://esa.un.org/unpp , accessed on 20 Jan 2010 . TARU 2008, PHASE 1: City Opportunity Assessment (Asian City Climate Change Resilience Network: India Chapter”. A Report submitted to Rockefeller Foundation GoI 2001: Census of India 2001.
NSSO 2002: Housing Condition in India, 2002: Housing Stock and Constructions National Sample Survey Organisation 58th Round. Ministry of Statistics and Programme Implementation. Government of India. http://www.mospi.gov.in/mospi_nsso_rept_pubn.htm
TNN 2009, http://timesofindia.indiatimes.com/city/surat/SMC-to-earn-additional-income-from-registration-of-new-buildings/articleshow/5204273.cms Acessed on 25th January 2010.
Vaidya et.al. (2008). Creative Financing of Urban Infrastructure in India through Market-based Financing and Public-Private Partnership Options. Paper presented at 9th Metropolitan Congress, Sydney. Vyas, N. & Vaidya C. 2003: Management Innovations for Municipal Resource Mobilization in Indore (Urban Finance: Quarterly News Letter of the NIUA, Vol 6 No.1, March 2003)
Annex (A): IMPLEMENTAION OF REFORMS – Indore & Surat
SI. No. Type Reform
Committed
Indore Surat
Target Date
Present Status
Target Date
Present Status
1
ULB
LEV
EL
REF
OR
MS
E-Governance set up 2011-12 2007-08 Achieved
2 Shift to Accrual based Double Entry Accounting
Achieved 2007-08 Achieved
3 Property Tax (85% coverage) 2010-11 2009-10
Property Tax (90% collection efficiency)
2011-12 2010-11
4 100% Cost Recovery (Water Supply) 2009-10
2011-12
100% Cost recovery (Solid Waste) 2009-10 2011-12
5 Internal Earmarking of Funds for Services to Urban Poor
2006-07 Achieved Achieved
6 Provision of Basic Services to Urban Poor
2007-08 2011-12
7
STA
TE L
EVEL
REF
OR
MS 74,h CAA (Transfer 12 sch.
Functions) — Achieved Achieved
74,h CAA (Constitution of DPC) Achieved 2007-08 Achieved
74in CAA (Constitution of MPC) # 2006-07 Achieved
8
Transfer-City Planning Function Achieved Achieved
Transfer-Water Supply & Sanitation
Achieved Achieved
Transfer-Public Transport 2011-12 — —
9 Reform in Rent Control 2007-08 2009-10
10 Stamp Duty rationalization to 5% 2011-12 2011-12 Achieved
11 Repeal of ULCRA NA Achieved NA Achieved
12 Enactment of Community Participation Law
2007-08 2007-08 Achieved
13 Enactment of Public Disclosure Law
2007-08 2006-07 Achieved
14
OPT
ION
AL
RE
FOR
MS Introduction of Property Title
Certification System in ULBs To be
indicated To be
indicated
15 Revision of Building Bye laws - streamlining the Approval Process
2005-06 Achieved 2005-06 Achieved
16 Revision of Building Bye laws - 2005-06 Achieved 2005-06 Achieved
ACCCRN – City Vulnerability Assessment Report A-II
To make rain water harvesting mandatory
17 Earmarking 25% developed land in all housing projects for EWS/LIG
To be indicated
2005-06 Achieved
18
Simplification of Legal and Procedural framework for conversion of agricultural land for non-agricultural purposes
To be indicated
Achieved To be indicated
Achieved
19 Introduction of computerized process of Registration of land and Property
To be indicated
To be indicated
Achieved
20 Byelaws on Reuse of Recycled Water
To be indicated
2005-06
21 Administrative Reforms To be indicated
2008-09 Achieved
22 Structural Reforms To be indicated
2006-07
23 Encouraging Public Private Participation
Achieved 2005-06 Achieved
#-No Metropolitan area declared; * Leave and License agreement exists; S-Progress to oe reviewed after six months;@-l00% recovered not committed; UN-Under Negotiation; NA-Not applicable
ACCCRN – City Vulnerability Assessment Report A-III
Annex (B): Major Indicators and sub indicators comprising the capacity and vulnerability index for the cities of Indore and Surat
SI. No.
Major Indicators
Sub indicators and corresponding points
Explanation of sub indicators
Calculation process
Vulnerability 1 Flood risk Flood Inundation level (in ft) Points Flood inundation levels experienced by the households
during recent reported floods were aggregated at the settlement level.
Maximum flood inundation level and average number of inundation days were assigned points ranging from 0 to 10. In order to calculate the flood risk at the settlement level; 75 percent and 25 percent weightage were assigned to maximum flood inundation levels and average number of inundation days respectively.
0 1 1 2 3 5 5 7
10 10 Flood Duration (in days) Points The inundation/deluge period experienced by the
households during the last reported floods was aggregated at the settlement level.
0 0 1 3 2 5 3 10
2 Insurance / loan Insurance availed (% ) Points The percentage of households currently availing insurance for health, life, assets, etc. was aggregated at the settlement level.
Percentage of households reported of having availed loan or insurance facilities were allotted points ranging from 0 to 10. The average of both the sub indicators was used to derive the insurance/loan vulnerability of the settlement.
0 10 0.1 8 0.4 6 0.6 4 0.8 0
Loan availed (% ) Points The percentage of households currently availing loan facility for purposes such as house, business, health, marriage, education etc. was aggregated at the settlement level.
0 0 0.1 2 0.4 4 0.6 6 0.8 10
ACCCRN – City Vulnerability Assessment Report A-IV
SI. No.
Major Indicators
Sub indicators and corresponding points
Explanation of sub indicators
Calculation process
3 Water Scarcity
No. of water supply sources Points Number of water supply sources availed in normal months was collected using the household information.
The sub indicators were assigned points ranging from 0 to 10 on the basis of their respective classification. The water scarcity vulnerability index at the settlement level was derived from the sub indicators.
1 1 1.5 10
Maximum distance of water source during scarcity (in mts)
Points Maximum distance commuted by the household to avail water from available sources during water scarcity months was collected and analyzed. 0 0
50 2 100 6 500 8 1000 10
Water available quantity (lpcd) Points Liter per capita daily (lpcd) availability of water per household was derived using the household and water availability information.
0 10 20 8 40 5 70 3 120 1
Frequency of water collection (in days)
Points The frequency of water availability to the households from water supply sources was collected through survey.
0 2 1.5 3 2.5 5 3.5 7 4.5 10
Time spent on water management ( in hrs)
Points The total time spent on water management (collection and storage) by the household was collected through survey. 0 2
0.75 4 1.5 5
ACCCRN – City Vulnerability Assessment Report A-V
SI. No.
Major Indicators
Sub indicators and corresponding points
Explanation of sub indicators
Calculation process
2.5 8 3.5 10
4 Physical infrastructure
Drainage type Points Households were awarded points on the basis of the type of drainage disposal facility available.
Average of the drainage facility indicator and the sewerage facility indicator was used to calculate the physical vulnerability.
Released in the Open 0.00 Open drain/nala 5.00 Pucca drain 10.00
Sewerage type Points Households were awarded points on the basis of the type of sewerage disposal facility available. Open defecation 0.00
Released in open nala 4.00 Septic Tank 8.00 Sewerage 10.00
Drainage facility indicator Points The points assigned to the households on the basis of drainage type were analyzed at the settlement level to derive the drainage facility indicators.
0 10 2 8 4 7 5 5 7 2 8 1
10 0 Sewerage facility indicator Points The points assigned to the households on the basis of
sewerage type were analyzed at the settlement level to derive the sewerage facility indicators
0 10 2 7 3 5 5 4 7 2 8 1
10 0
ACCCRN – City Vulnerability Assessment Report A-VI
SI. No.
Major Indicators
Sub indicators and corresponding points
Explanation of sub indicators
Calculation process
Capacity 5 Education Education Level Points Maximum educational level information within the
households was surveyed. Using this information the maximum educational level of the settlements was calculated.
Education index for the settlement = Sum of educational level points / Total number of sample households in the settlement.
Illiterate 0 Primary 1 High school 2 SSC 3 HSC 4 Graduate 6 Post Graduate 10
6 Social Instances of Social Group presence
Points Respondent’s awareness about the presence of social/ community based groups was surveyed and aggregated at the settlement level.
The sub indicators were assigned points ranging from 0 to 10. The average of all these sub indicator points was used to calculate the social capacity index at the settlement level.
0 0 1 10
Instances of membership to Social Group (%)
Points Household level involvement (membership) within the social/community based groups were aggregated at the settlement level and expressed as the percentage of total. 0 0
10% 2 40% 4 60% 6 80% 10
Access to Political leadership Points Access to political leadership/groups by the settlements were gathered through survey and included within this analysis.
0 0 1 10
Benefit from Political leadership Points Instances of benefit derived from the political leadership (infrastructural development, addressing local issues, etc.) were gathered through survey and analysed.
0 0 1 10
ACCCRN – City Vulnerability Assessment Report A-VII
SI. No.
Major Indicators
Sub indicators and corresponding points
Explanation of sub indicators
Calculation process
7 Income Stability Dependency Ratio (HH level)
Points Dependency ratio was derived and is expressed as percentage using the total number of non-working members ratio to working members in the household.
The sub indicators were assigned points ranging from 0 to 10. The income capacity index at settlement level was calculated from the average of all the mentioned sub indicator points.
0 10 100 7.5 200 5 300 2.5 500 0
(Stable/Unstable) jobs (HH Level)
Points Employment types were classified as stable/ unstable on the basis of the criterions like skill level, regularity of income, job security, skill demand in the market and the remuneration which the skill fetches in the market.
If, No Unstable Jobs 10 If, Number of Stable Jobs/ Unstable Jobs > 1
10
If, Number of Stable Jobs (S)/ Unstable Jobs (U) < 1
(S/U)*10
Per capita annual income (in Rs) Points Household level per capita income was calculated based on the survey results. 0 0
12000 4 24000 8 36000 10
Total Working members Points Total working members per household was derived from the survey results. 1 5
2 7 3 10
ACCCRN – City Vulnerability Assessment Report A-VIII
Annex (C): Visual Interpretation Method for SEC Classification
Criteria Upper Mixed Middle Lower Slum
Satellite Image
Spatial distribution
Large bungalows / large flats with open spaces, fairly regular distribution, certain amount of planted vegetation / lawns / trees
Mainly in the core area, may be associated with industries, or commercial areas
Compact houses, row houses, Flats, regular distribution often as colonies or housing societies, uniform house sizes
Small houses, irregular pattern, Mostly progression from slums, dense pockets, lack of open areas, some times as closely spaced colonies with small units (LIG housing)
Totally irregular, no open areas, cluttered along periphery or risk prone areas, railway lines, streams / rivers, drainage line / water bodies, industrial units. Wild vegetation is in the neighbourhood if located near streams.
House Size Very big houses on larger Plot area
Big older houses but often unplanned
Medium sized houses. Plot area almost equal to the floor area
Small sized houses Small mostly single room, with almost equal floor area and plot area
Housing density
Quite low Average, Mix of commercial and residential use as evidenced by vehicles
congestion Narrow lanes Narrow winding lanes inside the
settlement.
Roof type
Mostly RCC / RBC, very arranged, may have designer MPTs (Manglorean Pattern Tiles).
Mix of sloped roofs, flat RCC / RBC. In periphery mostly CGI / Asbestos sheets
Flat roofs with RCC / RBC RCC / RBC Roofs made of CGI, tin sheets, Asbestos, Plastic boards, biomass material, in irregular pattern.
ACCCRN – City Vulnerability Assessment Report A-IX
Approximate number of
stories
Mostly 2 stories in case of bungalows, wide shadow in case of flats
Mostly 2-3 stories Varies from Double stories to ten or more stories
Mostly 1-2 stories (Maximum 4-5 stories in case of LIG housing project)
Single floor, in some cases few houses with first floor
ACCCRN – City Vulnerability Assessment Report A-X
Annex (D): SWOT Analysis – INDORE
Node Strengths Weakness Opportunities Threats
Government IMC has shown an increase in the trend of tax collection efficiency Sufficient manpower – technical and non-technical with several years of experience Adequate land resources – no physical constraints Has pioneered in e-governance through application of GIS and MIS IMC has undertaken reforms relating to public private participation.
Absence of political will, leadership and city’s vision / sector vision Infrastructure deficiency observed in the areas of water supply, sewerage and drainage. Fragmented groups and diverse interests Limited exposure of key decision makers on technical matters Limited human resource capacity and skills A large fraction of the city’s poor live in slums. This has to be addressed and strategy should be adopted to minimize it rather than keeping constant or growing it higher. Low tariff and high subsidy on several services. IMC is not able to recover the cost of services rendered by it. Poor personal management and lack of willingness The departmental staff are busy in day to day work engagements, and sufficient time is not devoted for future developments
Central and State Government focus on urban renewal Multilateral and Bilateral agencies focus towards betterment of basic services – water supply, sewerage and drainage. The local government unit has been benefitted from the support of technical and financial assistance of several national/state schemes and donor interventions to take forward a well planned reform agenda and establish institutional mechanisms for climate change inclusive development in the city. Private Sector Participation in the delivery of basic services Capital Market available to undertake urban infrastructure schemes
The city government is facing likelihood of dwindling water resources (low rainfall, rapid withdrawal of available ground water through >60,000 tube-wells). This has tremendous impact on the society and has affected the quality of life. If adequate and innovative measures are not taken towards conservation , it will impact the growth potential of the city Future availability of scare resources such as water and energy leading to additional outflow of financial resources. There has been considerable encroachment along the river. The negative externalities arising form the encroachments need to be addressed by shifting the poor people hutments to a safe place. The city has to take robust steps to keep the river banks free from encroachments. No public support and cooperation on several development issues Media not supportive: poor messages threaten the function of the individuals
ACCCRN – City Vulnerability Assessment Report A-XI
Node Strengths Weakness Opportunities Threats
Market Established itself as a seat of education and learning on account of a large number of reputed institutions. Well networked by train, road and air network. The city has prospective industrial and commercial activities. A significant player in the heritage and religious tourism circuit in the state (this needs to be further explored)
Lack of vision & common goals Not addressing needs of vulnerable groups by value of business ethics Lack of linkages with training agencies to create skilled work force
People are educated, diverse and young – their skills can be tapped New partnerships/ approaches for private sector engagement in the development of the city A number of high quality educational establishments are in the city. There is a strong opportunity towards partnering with the private sector in meeting the education sector demands. Increased partnership activity: create role of existing educational facilities, build stronger links with business community The private companies have not ventured any initiative on reuse and recycling of wastes of any kind in the city.
Industrial development within the city and immediate periphery
Community Community recognize the opportunity in pursuing new Ideas which can improve the city image The citizens have talents and energies to achieve a common vision for the city development.
Working in silos and individual agenda rather than a common agenda Limited awareness in general public of citizens responsibilities and concerns No public support and cooperation on several issues with the Government Knowledge of citizens about the city functions is poor (there is a need for better communication to
There are several active NGOs / CBO’s. If channelized well there can be participation from the public in addressing development issues (say, Public awareness in water conservation) The citizens can Strengthen Government -Community interface by greater community participation
Too much focus on day to day issues and weaknesses Community to find it difficult to cope with unorganized and unsustained growth Complete dependency on Narmada Water Supply for future water leading to not taking adequate conservation measures
ACCCRN – City Vulnerability Assessment Report A-XII
Node Strengths Weakness Opportunities Threats
public by IMC/Stakeholders) Lack of vibrant community associations to deal with issues such as water scarcity, water logging and poor quality development regime. Growing gap in resource sharing between risk abd the poor (in case of water)
Source: TARU analysis, 2009
ACCCRN – City Vulnerability Assessment Report A-XIII
Annex (E): INDORE: Proportion of HH level Maximum Education across Sample Settlements
ACCCRN – City Vulnerability Assessment Report A-XIV
Annex (F): INDORE: Livelihood profile across Sample Settlements
ACCCRN – City Vulnerability Assessment Report A-XV
Annex (G): INDORE: House Types across Sample Settlements
ACCCRN – City Vulnerability Assessment Report A-XVI
Annex (H): SWOT Analysis – SURAT
Node Strengths Weakness Opportunities Threats
Government SMC is today known for its strength to convert adversities into advantage. SMC governance has come to be recognized as an example of a good governance system in India and abroad. SMC has capacity to meet challenges of rapid urbanization and improve the quality of life of all residents Sufficient manpower – technical and non-technical, enough expertise and technical know how amonst the staff / considerable years of experience / staff with high level of commitment and perseverance SMC has undertaken reforms relating to public private participation. Adequate land resources – no physical constraints except flooding/sea-level rise which need to addressed SMC has pioneered in e-governance through application of GIS and MIS SMC has always shown a lead in terms of innovation which are directly aimed towards better delivery of services and filling up gaps in all broad functions. A strong political will, leadership and
A large proportion of the population/city poor lives in slums in Surat as cost of living is quite high. This is one of the reasons for the growth in informal settlements. This also means additional responsibility on the part of the City Government to provide for services at affordable cost. Low tariff and high subsidy on several services. SMC is not able to recover the cost of services rendered by it. Unregulated peri-urban growth and weak institutional structures
Potential for demand in terms of trade and transit services should be tapped for sustainable urban growth. Central/ State and Local Government focus on urban renewal Multilateral and Bilateral agencies focus towards betterment of basic services – water supply, sewerage and drainage. The local government unit has been benefitted from the support of technical and financial assistance of several national/state schemes and donor interventions to take forward a well planned reform agenda and establish institutional mechanisms for climate change inclusive development in the city. Private Sector Participation in the delivery of basic services Capital Market available to undertake urban infrastructure schemes Competitive businesses and industries are going to result in employment and increased
Surat city has seen an unprecedented growth in last four decades recording one of the highest growth rates in the country and a 10-fold population rise. Consistently high rate of growth in population has posed new demands. From time to time jurisdictional limits of SMC has been extended to include the growth. This adds on a lot of pressure on the local government institutions. The periphery population is devoid of urban services even at basic level. This throws a new challenge ahead. The industrial sector as estimated in (1997-98) contributed a gross amount of Rs.14667 million to SMC as taxes, Rs.27512 million as Excise Duty, Rs.6050 million as Income Tax and Rs.6976 million as Sales Tax. Octroi has been abolished since 2007 and is now reimbursed by the state. SMC still looses a substantial amount as octroi collection had an annual growth rate of 20%. The city government is facing likelihood of severe floods and sea level rise and availability of fresh water. Increase in number of flood events has tremendous impact on the society and will severely affect the quality of life. If adequate and innovative measures are not taken, the hydro meteorological hazard phenomena may stub
ACCCRN – City Vulnerability Assessment Report A-XVII
Node Strengths Weakness Opportunities Threats
city’s vision / sector vision Improved governance and financial management have resulted in enhanced municipal financial capacity to invest in services and improved O&M.
revenues to the local government.
the growth of the city and surrounding region. Future availability of scare resources such as water and energy leading to additional outflow of financial resources. There has been considerable encroachment along the river. The negative externalities arising form the encroachments need to be addressed by shifting the poor people hutments to a safe place. The city has taken robust steps to keep the river banks free from encroachments.
Market Its distinct economic character is its major strength. Ingenious entrepreneurship skills The region is one of the leading city-regions in the country that has attracted massive investments
Absence of education facilities to respond to local industrial demand Non-diversified economic base - dependence is on textile manufacturing, trade, diamond cutting and polishing industries, intricate Zari works (Hazira - chemical industries and the petrochemical and natural gas based industries). Weak connectivity with major centers/ world cities from a competitive perspective. Located in between two major metro's (Mumbai and Ahmedabad) Multi tiered protocols for industrial clearances Lack of premier institutions
The local administration provides an opportunity to enhance quality of life of the residents, makes the city enterprising by creating conditions for a safe living and business friendly environment. The recent development and growth of petrochemicals and gas-based industries in the city region should be considered as an opportunity for further growth. Being located in between Ahmedabad and Mumbai the city can explore the economic base in new services – IT & Communication, Education services etc Potential for demand in terms
The economic base is threatened by increase in frequency of hydro-meteorological events and future impacts of Climate Change risks. The current economic base can be threatened by changing economies. Policy risks such as incentives in neighboring states, trade and tariff regimes on raw materials
ACCCRN – City Vulnerability Assessment Report A-XVIII
Node Strengths Weakness Opportunities Threats
of trade and transit services, and social sectors such as health, education, leisure and tourism
Community Distinct social character is its major strength Community recognize the opportunity in pursuing new Ideas which can improve the city image The citizens have talents and energies to achieve a common vision for the city development. Good public support and cooperation on city development issues. Surat is an exemplary case study of citizen support for reforms. Strong sense of belongingness and pride of being a Surati and at the same time always willing to accept and include people from other cultures The city is known for its social harmony
Limited human resource capacity and skills The industrial base is labour Intensive. Wages are also lower and the workers are generally deprived of social and other benefits. Limited awareness in general public on climate change risks Large segment of work force and population living in slums Dominant informal sector High costs of living
The local administration provides an opportunity to enhance quality of life of the residents, makes the city enterprising by creating conditions for a safe living and business friendly environment. Competitive businesses and industries are going to result in employment opportunities. The citizens can continue to Strengthen Government -Community interface by greater community Participation in reducing impacts of hydro-meteorological risks
Health concerns related to migrant population Threat from sea-level rise, floods and changing economies
Source: TARU analysis, 2009
ACCCRN – City Vulnerability Assessment Report A-XIX
Annex (I): SURAT: Classification of Land use and Settlements based on SECs (GIS analysis)
ACCCRN – City Vulnerability Assessment Report A-XX
Annex (J): SURAT: Proportion of HH level Maximum Education across Sample Settlements
ACCCRN – City Vulnerability Assessment Report A-XXI
Annex (K): SURAT: Livelihood profile across Sample Settlements
ACCCRN – City Vulnerability Assessment Report A-XXII
Annex (L): SURAT: House Types across Sample Settlements
ACCCRN – City Vulnerability Assessment Report A-XXIII
Annex (M): HOUSEHOLD SCHEDULE
Background Information City Date
Name of the Settlement Ward No.
Investigator Respondent
Nearest reference
Ref. No GPS point
Instructions
1. Write all units wherever necessary (e.g. liters/day, Rs/month) as told by the respondent 2. Do not insist on getting answers on sensitive questions (e.g. income details), but ask and if you
get, write down. Expenditure information is less sensitive and try to get good figures 3. You can sequence the questions differently, but ensure all information is filled before closing the
interview. Some information can be gathered just by observation like floor no., no. of stories, electricity connection, etc. DO NOT ASK SUCH QUESTIONS.
4. If the respondent is uninterested to give answers, it is better to close the interview and try another household respondent.
5. Some information can be better gathered from women, if possible, try to include both male and female members during interview.
1. Household Basic details
Name of head of the household and
relationship with head
Gender (M/F)
Age (Yrs) Education
Present occupation(Just put a mark)
Toddler (0-3 yrs) Studying Household
activity Working Temporarily working
Head of the Household
Respondent** (_______________)
Working Primary Secondary Total Distance from the Monthly Income
ACCCRN – City Vulnerability Assessment Report A-XXIV
members in the household
Occupation (name of occupation)
Occupation (name of occupation)
Working days in an year
work place A: 1-5km, B: 6-10km, C: 11-15km, D: >15km
2. House Details
a. House type Informal houses Single Row Flat Bungalow
If Flat, then floor number _________
Number of stories of House _________ Number of rooms _________ b. Ownership Rented Owned
Building Materials (record by observation) Roof Types: RCC/ RBC CGI/ ACC/ Tin Stone Biomass/ Thatch
Tarpaulin/ Plastic Sheet Tiles (MPT/ Country Tiles)
Others (Specify) …………………….........
Wall Type: Bricks Stone Blocks Wood/ Ekra/ Wattle and Daub Mud/ Earth
c. Dimensions Floor Area _______________(specify sq.m/sq.ft) Plot Area _______________(specify sq.m/sq.ft)
3. Resource status- water supply
Normal months Scarcity months Period(__________________________)
Source Use Put a
) mark
Price/ Unit (Range)
Quality*
Reliability#
Distance from source (Mention the unit)
Use Put a ( ) mark
Price/ Unit (Range)
Quality*
Reliability#
Distance from source (Mention the unit)
Municipal Ground Water
Tanker Stand Post / Hand Pump
Other Sources (specify)
Normal
Scarcity
Note: 1. *Quality- Clean-C, Hard-H, Turbid-T, Polluted/Contaminated-P 2. #Reliability-(Score 1-5, where 1 is worst)
a. Ownership or arrangements if any (by source) :
Municipal corporation Private ownership Owned by neighbor Water contractors No ownership Illegal connection From factory Shared/Community Others ----------------------------------
b. Number of Household members engaged in daily collection and management of water
Normal Month Male Number ______ Female Number ______
ACCCRN – City Vulnerability Assessment Report A-XXV
Summer Month Male Number ______ Female Number ______ c. Average time spent by family members everyday in collection and management of water -
Non-scarce months:
Less than 1 hr. 1 hr. 2 hrs. 3 hrs. 4hrs. 5hrs. More than 5hrs.
Water scarce months:
Less than 1 hr. 1 hr. 2 hrs. 3 hrs. 4hrs. 5hrs. More than 5hrs.
d. Any changes observed during the last five years in the status of water supply
Reduced water supply Reduction in the supply duration
Degradation of water Quality Water scarcity period (months) has increased
Cost of water has increased No. of Private tankers/suppliers have increased
Dependence on water tankers increased Incidence of water borne diseases increased.
Unpredictable timing of water supply
e. What are the perceived reasons for such a change (highlight perceived reasons if any):
Increase in temperature Pressure on water resources Increase in the number of borewells Cutting down of trees Water pilferage (stealing) Increase in population Increase in per capita consumption Less rains Other reasons (Specify) ------------------------------------------------------------------
f. Are you aware of climate change/ global warming and associated risks?
Yes No If yes, What has been you source of information about climate change/global warming?
TV Radio Newspaper/Magazine NGOs/CBOs Government officials/staff Friends and relatives Other (specify)?
4. In house arrangement for water storage
Units of measure#: Bucket 10L Bucket 15L Liters ( Tick only one choice)
Do you store water in your household? Yes No If yes, then mention the water storage details in the Household
Arrangement type Nos. Capacity/Volume (specify units)
Shared (Yes/No) When Installed? (Which year)
Underground storage Pump Remove this
option
Over Head Water Tank Drums/Big Containers/dols Small Vessels Others(specify)_________ 5. Water supply resource use pattern
Units of measure#: Bucket 10L Bucket 15L Liters ( Tick only one choice)
ACCCRN – City Vulnerability Assessment Report A-XXVI
What is the total water collected by the household in a day / 2days/ week / others _____ __________(#in above units)
Normal Scarcity Source* Volume/No.s
( #in above units) Source* Volume/No.s
( #in above units)
Drinking Kitchen washing Bathing Washing Flushing Floor Cleaning Vehicle Cleaning Others (specify): *Municipal Supply (M) / Private Tanker (P) / Bore Well (B) / Stand Post (S) / Mineral Water (MW) / Manual Transport (T) 6. Resource Status –Electricity
a. Is there access to electricity? Yes No
b. If yes, then
Direct connection Indirect connection others c. Do you pay for it? Yes No
d. If yes, the how much (Cost/per month)? Mention-----------------------------------------------------
e. Rate the Quality (Voltage/fluctuation) of Electricity supply to your Household on a scale of 1to 5(1-Lowest, 5-Highest):
1 2 3 4 5 f. Rate the reliability(No unscheduled cuts) of Electricity supply to your Household on a scale of 1to 5(1-
A. Sanitation details a. What is the sanitation facility available?
Individual toilet(septic tank) Individual toilet(sewerage connection) Shared toilet Community toilet None b. In case of community toilet who takes care of the operation and maintenance?
Municipal corporation Private contractors Community c. In case the community toilet is used what are the user charges paid?
Re 1/use Rs 2/use Card system (Payment per month) amt None d. In case of community toilet what are the issues? Improperly maintained Choked Women’s Safety No water Not cleaned regularly Others____________
e. What is the arrangement for the disposal of the sewerage? Sewerage connection Released in open drain/nala Septic tank None Others (specify)_________________________
f. What happens to the arrangement during flooding season? Overflow Not able to access the toilet Not clean Use other means/options No Change/still in use g. what happens to the toilet during water scarce season? No change Lack of water Not cleaned Others (specify)_________________________
h. In case the sewerage system exists in the settlement, who manages them? Municipal corporation Private contractor Self None Others(Specify)______________________
ACCCRN – City Vulnerability Assessment Report A-XXVII
i. Do you pay anything for this arrangement? Yes No If yes, how much---------------------------------
j. Is there any problem with the arrangement? If yes, specify ----------------------------------------------------------------------------------------------------------------------------------------------------------------------------------------------------------------------------------
k. What happens to the sewerage system during heavy rains/floods? Works properly Drain is choked temporarily Water logging continues for a longer period of time Others________________
B. Drainage details a. What is the arrangement for the grey water/waste water disposal?
Pucca drain/nala Open drain/nala Released in the Open None Others (Specify) -------------- b. Who manages them?
Municipal corporation Private contractor Self None Others (Specify)___________________
c. Do you pay anything for this arrangement? Yes No If yes, how much---------------------------------
d. Is there any problem with the arrangement? If yes, specify ------------------------------------------------------------------------------------------------------------------------------------------------------------------------------------------------------------------------
e. What happens to the drainage system during heavy rains/floods? Overflows to the road/compound Water gets in to the household Water does not recede for some time No change
8. Solid waste management - Handling Details
a. Where do you dispose off your household waste? House to house collection Dump on street/outside Dumping in waste bin In the river/nallah Burn Others (specify)_______ b. If there is house collection or proper management of the solid waste, mention the agency responsible Municipal corporation Private contractors Others (Mention)-------------- c. What kind of expense do you incur for solid waste disposal?
No Expenses Rs. ………………. Per month d. What happens to the solid waste disposal in case of floods/water logging?
_______________________________________________________________________ e. Are there any special issues related to the solid waste disposal?
----------------------------------------------------------------------------------------------------------------- ----------------------------------------------------------------------------------------------------------------- ----------------------------------------------------------------------------------------------------------------- 9. Exposure to Floods/Water logging/Water scarcity risks
EXPOSURE TO FLOODS/WATERLOGGING RISKS Occurrence (Mention year)
Hazard source
Distance from Hazard source
Intensity (max. depth inside the house and surrounding areas)
Duration
(days)
Damages (like loss of infrastruct-ure, goods etc.
Loss of money
Loss of income days
Before Floods
a. Do you have a Set of actions ( things to do ) identified to tackle floods? Yes No
b. What are the precautions you take just before the information of flood reaches you? (Probe a little)
ACCCRN – City Vulnerability Assessment Report A-XXVIII
c. What damage can possibly happen to house in case flood occurs?
House and household items are safe House and household items may be partially affected House and household items will be damaged
During Flood Situation a. Do you receive early warning in event of flood? Yes No
b. If yes, how much prior warning you got before the floods happened last time in your city?__________________________________________(hrs.)
c. If yes, what has been you source
Television Radio Loud speaker NGOs/CBOs Community Neighbour Other (please indicate):.............
d. Where do you and your house members move in event of flood?
___________________________________________________________________________ e. Are you still able to access the nearby areas for you daily needs? Yes No
f. How many members in your family know swimming?_________________________________
g. Does the community has any plan about handling flood situation? Yes No
h. What is the support system that you resort to in such a situation?
Self help Government NGOs/CBOs/Religious groups Community Preparedness/Neighbourhood Plan activation others (Specify).....................
After Flood Situation a. What are the major problem that you face after the flooding is over?
Problem of livelihood House repairing/Loss of House Medical cost Water Supply Problem Sanitation problem/Sewerage Others (Specify)......................................................
b. What is the support that you need after the flooding is over?
Medical support Access to Credit Easy Insurance options Livelihood support Clean Drainage/Sewerage Clean water supply Others (Specify)....................................................................................................
How can the vulnerability be reduced ? (Probe in detail and mention the options mentioned by them, a brief understanding of the options has been mentioned under each heading. If no response, then mention the same. You can also mention separate options provided by the community).
Capitals Expected Inputs Your Inputs Social/institutional (Access to Support Groups, SHGs, Festival groups etc.)
Physical (Protection of assets, Labour Security, )
Economic (Income security, Access to credit, Insurance)
Human (Access to Training, capacity Building)
10. Risks- Water scarcity
Year Months of Normal Scarcity period situation
ACCCRN – City Vulnerability Assessment Report A-XXIX
impact supply availability(in hrs)
Supply frequency
Quality degradation
Alternate sources
Additional costs/month
HOUSEHOLD LEVEL COPING MEASURES TO FLOODS/WATER SCARCITY
Measures Yes/No Costs (in Rs) Does the arrangement help or not?
Remarks
Raised plinth
New first floor
Attic Storage
Raised Shelves
Temporary Shifting/migration
If Yes, Where do they relocate to: For how many days:
Water Tank
Drums/others
Water sharing
Others, if any
Any other (specify)
Government help if any
If yes, give details:
NGO help if any If yes, give details:
11. HEALTH RISK FOR THE HOUSEHOLD
Diseases Seasons Epidemics (If Yes, mention Year)
Persons affected (in numbers)
Specific age group affected (if Yes mention the age of the HH members)
ACCCRN – City Vulnerability Assessment Report A-XXX
Hea
th
Wat
er
Scar
c
13. Disaster management plan
Do you know about DM plan?
If yes, Were you part of it? Is there any role specified for you?
Did you receive any formal training?
What role you would like to play?
Is there any mock drill that you attended?
Emergency and Relief
a. What sort of benefits/support you got? Food Emergency Shelter Clothing Drinking water Medicine Insurance/Financial support None Others(Specify)____________________________________________
b. Who all gave you support? Municipal corporation Community support Local help groups NGOs/CBOs Missionary/Charity None Others(Specify)_________________________________________________________________
(If there is any particular name of the organisation then mention the same) _______________________________________________________________________________
c. Rate the quality of support on a scale of 1to 5( 1-Lowest, 5-Highest)
1 2 3 4 5 d. Highlight inadequacies/ difficulties
No support at all Help came too late No medical support Few HHs got the benefits Support was not coordinated Support stopped after initial help Others(specify)____________________________________________________________________
_______________________________________________________________________________ 14. Family expenditure details
FAMILY EXPENDITURE DETAILS (Mention either in months/years depending upon the budget heads)
Item Expenses Rs/month Annual Rs/Yr Food Cooking Fuel (LPG/Kerosene/Fuel Wood) Rent, House maintenance House Tax, if any Entertainment/habits Transportation (Public Transport, say Train/Bus/Taxi/Auto etc)
Personal Vehicle (Fuel expenses) Services – Communication Services – Electricity
ACCCRN – City Vulnerability Assessment Report A-XXXI
FAMILY EXPENDITURE DETAILS (Mention either in months/years depending upon the budget heads)
Item Expenses Rs/month Annual Rs/Yr Services – Solid Waste Services – Water Health Education Travel(Leisure/pilgrimage) Insurance premium (Health/Home/Vehicle etc)
Remittances (MO etc) Others (specify): Total all the items to per year: Note: Some of the expenditures will be on monthly basis, while others will be on annual basis. Try to fill them accordingly. 15. Debt/Insurance savings
DEBT/INSURANCE/SAVINGS (Family Count) Debt
Type of loans
Source (can include Money lender, Bank, SHG, from relatives, Mortgage etc)
Amount (approx)
Return time frame
Remarks
House loan
Vehicle loan
Business related loan
Educational loan
Others(Specify)
Insurance Type of Insurance Policy (Health/Disability/Life/Home Property/Others)
Source Coverage Premium (approx)
Did you receive the claim (Yes/No)
Remarks
Do you save regularly?
Are Floods/Water scarcity affecting your financial planning? If Yes, give details:
16. Asset ownership
ACCCRN – City Vulnerability Assessment Report A-XXXII
ASSET OWNERSHIP A. Vehicle Description Type
and Nos.
Age Km run /month Impact of floods or any other disaster
Bicycle Motor bike Car Motorized Vehicle for Commercial Use Non Motorized commercial Do you have any of these assets as ownership?
Shop Local business enterprise like flour mill etc. others (mention)______________________ None If Yes, then how does it get affected during floods/ rainy season? 17. Appliance usage
APPLIANCE TYPE Description Numbers When
purchased Usage/day (Number of hrs.) Remarks (also
include impacts due to floods)
Normal Summer
Household appliances Fan/cooler Fridge Television Cooling/Heating appliances
Land-line phone Cell Phone Washing machine
Gas line/LPG Cylinder and Cooking Stove
Description Numbers When purchased
Usage/day (Number of Hrs.) Remarks (also include impacts due to floods)
Normal Summer Water pumping and treatment appliances Pump Filter(specify) Others (if any, specify)
Appliances in addition to the above For Commercial purpose (specify if any)
What is the normal unit consumption of electricity/month in normal circumstances?______________________ What is the normal unit consumption of electricity/month in summer season?__________________________
18. Community linkages
a. What are the community groups in your settlement?
SHG Festival groups/committee Professional groups
ACCCRN – City Vulnerability Assessment Report A-XXXIII
Affinity groups Yuva mandals Political affiliations RWA Others (mention) ___________________ b. Are you the member of any community group? Yes No c. If yes, then mention the name of the institution? d. If yes, then since how long? e. Who are the members from your household? Mention relationship along with the community linkages
What is the role assigned for the members? 1. __________________________________________ 2. __________________________________________ 3. __________________________________________
What are the benefits/support that you get from such linkages? 1. __________________________________________ 2. __________________________________________ 3. __________________________________________
19. Do you think that the water supply situation is going to improve in the near future? Details.
ACCCRN – City Vulnerability Assessment Report A-XXXIV
8. Reliability of information:
9. Any other:
ACCCRN – City Vulnerability Assessment Report A-XXXV
Annex (N): SETTLEMENT/COMMUNITY PROFILE City Ref. No. Ward No. Date Name of the settlement Investigator GPS Point Location Location of the settlement Nearby area details Respondent Name Respondent details (like Teacher, Shopkeeper,
Community person, Ward member Etc.) Contact Number/other details
Instructions
6. Write all units wherever necessary as told by the respondent 7. Do not insist on getting answers on sensitive questions, but ask and if you get, write down. 8. You can sequence the questions differently, but ensure all information is filled before closing the
interview. Some information can be gathered just by observation like major problems in the slum, house type, etc. AVOID ASKING SUCH QUESTIONS.
9. If the respondents are uninterested to give answers, it is better to close the interview and try another community group.
Try to include both male and female members during interview
1. Background Information a. Economic group in the settlement
a. Distance from Streams ___________________________________________________________
b. Past flood events (mention the years) & Impacts if any and years S.No. Flood events Impacts if any
c. Distance from new Roads/Canals or any new problems of flooding?__________________________
d. Is there Exposure to Water Logging? Yes No
e. If Yes mark the source of flooding/waterlogging(Can mark more than one) River/Stream/Nala Flow Poor drainage/waste flow from houses Others (Specify) ……………………………………………………...
f. Is there water scarcity risk in your settlement? Yes No If Yes, past water scarcity events (Can be every year)
S.No. Water Scarcity Risk (in years)
Impacts if any
ACCCRN – City Vulnerability Assessment Report A-XXXVI
g. Mention water shortage months in a year
Sr.No Month Dry months usual year ( or )
Dry months Scarce years ( or )
Remarks
1 Jan 2 Feb 3 Mar 4 Apr 5 May 6 June 7 July 8 Aug 9 Sep 10 Oct 11 Nov 12 Dec
3. SETTLEMENT DETAILS Demography Total population % illiterates Total households Total Houses Infrastructure Road Type No Provision ( %) Kachha Road ( %) Pucca Road ( %) Drain No Provision ( %) Kachha Drain ( %) Pucca Drain ( %) Main Communities (>10%) Origin State/Region (write) No.s/% (specify) Religion Name (write) No.% (specify) By main occupation Name (write) No.s /% (specify) Weaker sections Name (write) SC ST Others
No.s /% (specify)
4. SETTLEMENT HISTORY Year of establishment No of Households Remarks (mention the reason if possible) Year (major influx of people, relocation, or any changes like eviction-Specific for informal settlements
No of Households Remarks (mention the reason if possible)
ACCCRN – City Vulnerability Assessment Report A-XXXVII
5. EVENT HISTORY (Go back from recent to old events) Flood Year Area
Hospital School Anganwadi Primary School Secondary School Higher Secondary School
Community Hall/ Emergency Shelter
Ration Shop/PDS
Note: Impacts also include the closure of the facility for days/weeks/months closed.
ACCCRN – City Vulnerability Assessment Report A-XXXVIII
7. HEALTH RISK Diseases Seasons Epidemics (If
Yes, mention Year)
Persons affected (in numbers or % pop)
Specific age group affected (if Yes give the age - group)
Remarks
a. Who deals with the situation?(Can be multiple choices)
Municipal corporation Health department Community groups NGOs/CBOs Religious groups None Others (specify)____________________________________________________________
b. Who informs/updates about the situation? (Can be multiple choices)
Municipal corporation Community sources NGOs/CBOs Media sources Self None
c. What are the preventive measures taken in case of a health risk in the community? Distribution of medicines Regular health check up camps in the community Referral services to big hospitals Cleanliness of the settlement/drainage/sewerage Sample testing of water Distribution of chlorine tablets Distribution of ORS (Oral Rehydrated Solution) Inoculation None Others (specify)___________________________________________________________
Function Leader (Highlight the name of the individual/s; contact details)
Benefits to the community / Also ask how participatory is the group
SHG -1
SHG-2
SHG-3
Festival Groups
Dispute redressal groups
Common Interest Groups (Say, Taxi driver association etc)
ACCCRN – City Vulnerability Assessment Report A-XXXIX
Building societies/RWA
Others(Specify)
9. LAND AND SHELTER STATISTICS
Description Across selected settlement Total land area of settlement Average built up area per family (sq.ft/sq.m) Mention status of land ownership % households owning houses % household tenants % single, shared tenants (only slums)
10. HOUSE TYPES Type Percentage Informal Houses (Kaccha) Brick wall with tin/cement sheets Brick walls with tiles Single House unit(Middle class) Bungalow Row Houses Two storied Houses Flats Total 100%
11. SERVICES – WATER SUPPLY Source %
Household covered
Service Provider (MC or Private-
P)
Indicative costs/month/HH
Quality & reliability (Score 1-5, where 1 is
worst)
Put X, if not
available during/after disasters
Summer Other months
Q R Q R
Public Standpost/hand-pump
Individual tap Bore well Using Private Tanker Manual transport from (mention distance in _____mts/kms(specify)
Quality, availability and reliability (Score 1-5, where 1 is worst)
Summer Other months
16. MAJOR PROBLEMS OF SETTLEMENT
Description Rank top five pertinent issues (1 is the highest problem) Drinking Water Roads Flooding Water logging Sanitation/Drains Solid Waste Electricity Employment Health Do not prompt by issues. Ask them to cite in order of importance and ignore non relevant issues, if outside the scope.
ACCCRN – City Vulnerability Assessment Report A-XLII
18. LIVELIHOODS
Type % Avg. Earning/month Unskilled Labor Semiskilled Labor Skilled Construction Workers Driver/Mechanic Vendor/hawker Self employed Business/Shop etc Regular Factory/Shop/Service workers (unskilled) Regular Factory/Shop/Service workers (skilled) Professionals Govt Service (Class III, IV) Govt Service (Class I& II) Pensioners and others supported by Social security
Others (specify):
All categories 100
19. MONTHLY HOUSEHOLD INCOME Income Range % of households Remarks Up to 2000 2001-5000 5001-7500 7500-10000 10001-25000 25001 and above All categories 100
17. LITERACY EDUCATION / SKILL SET Education Level Skill Set
Level % Skilled % Illiterate Service/ Administration % <5th class Business % 5-10 class Mechanic /Drivers %10th class+ Construction Workers Up to Graduation Semiskilled Workers Up to Post Graduation Unskilled Laborers All Categories 100 All Categories 100
20. HOUSEHOLD APPLIANCES
Type % Households Fan Fridge Television Cooler AC Land-line phone Cell Phone LPG Cylinder and Cooking Stove Pumps Water filters (non electrical) Water filters (electrical)
ACCCRN – City Vulnerability Assessment Report A-XLIII
21. VEHICLE OWNERSHIP Owners in possession of Transport Vehicle for Income Generation %
Vehicle Type (Motorized/Non-Motorized) Truck/Bus Car/Van/Jeep Three Wheeler (Auto) Animal Driven Cart Hand driven cart (for selling vegetables etc) / Cycle Rickshaw Owners in possession of Vehicles for personal transport % Four Wheeler Motor-Cycle/Scooter Cycle
22. ACCESS TO EXTERNAL INSTITUTIONAL ENVIRONMENT Access to Name If Yes, Benefits received
% Household
Access to Political Leadership/MLA, MP, Ward Member
CSOs/NGOs support to build self-help groups and local resource management
Others, Specify
23. INVESTIGATORS REMARKS:
1. Water Supply
2. Drainage
3. Sewerage
4. Electricity
ACCCRN – City Vulnerability Assessment Report A-XLIV