Weighting the Criteria of Brand Selecting in Beverage Industries in Iran Naser Hamidi 1 , Pouya Majd Pezeshki 2 , Abolfazl Moradian 2
1 Associate Professor, Islamic Azad University, Qazvin Branch, Iran 2 Research Scholars, Islamic Azad University, Qazvin Branch, Iran
ABSTRACT
This research attempts to introduce important criteria which have effects on selecting the best brands in beverage industries in Iran, also to evaluate the weight of each criterion for selecting the best brand in the case Persian beverage market. Weighting methods are divided into two categories: objective methods and subjective methods. In this paper entropy were selected from objective methods and Analytic Hierarchy Process (AHP) were selected from subjective methods which lead in two weight vectors, then integration of both vectors results in the effect coefficient of brand selecting criteria. Experts’ opinions are gathered by questionnaire. Then the major criteria weights are analyzed using the analytic hierarchy process and entropy, final weights are then determined using the compromised weighting method. Brand resonance performs the most important role among all criteria by Persian consumers of beverage products. Many consumers are not fully informed when shopping for products and services, reliance on known and recognized brand names becomes important. First we gathered the most important criteria of brand equity from literatures, which could be listed as, corporation ability association, brand awareness, quality perception, brand resonance, brand extensibility, price flexibility, and repurchase intention.
Most consumers choose needful products on the basis of brands. Due to the need of identifying consumer references and formulating an appropriate branding strategy, brand positioning has become an important topic that needs additional researches. A strong brand position enables consumers to perceive the uniqueness and intensity of the brand (Aaker, 1991), and consumer brand perceptions influence longterm firmcustomer relationships (Fournier, 1998), thereby affecting profits, costrisk relationships, and competitive advantages. As an important marketing objective and prior condition for corporate success, brand positioning enables firms to identify customer preferences and shifts in customer behavior, which demand modifications to strategic planning and product designs. Most prior studies of brand positioning focus on product attributes and deal primarily with the relationship between brand or product attributes and brand selection and preferences (Cohen, 1966) (Axelrod, 1968) (Nedungadi, 1990) More recent studies instead compare brand images concerning measuring their positions (Alpert, 1971) (Hauser & Koppelman, 1979) (Barnard & Ehrenberg, 1990) (Gwin & Gwin, 2003) or expanding attribute
ASIAN JOURNAL OF MANAGEMENT RESEARCH 251
scopes (e.g., price, service, quality perceptions). In the latest studies brand positioning implies that consumers remember particular information conveyed by the brand. (Lee & Liao, 2009). Often company names are used to brand products (e.g., ZamZam Co.). Occasionally, however, a corporation name may not be used as a consumer brand (e.g., Khoshgovar Co. and Sasan Co.) and consumers known these companies by their brands name (e.g., CocaCola and Pepsi) So it seems reasonable to assume that the company name and brand together can be considered a brand in Business to Consumer (B2C) markets. A brand mark consists of a brand name, logo, and/or an icon and sometimes a tagline. They help consumers categorize brands by product type, draw correct inferences about brand attributes and benefits by their perceptions. (MacInnis, Shapiro, & Mani, 1999)
Because brand marks perform so many important tasks, their effective design is critically important. The best brand marks are those that are memorable (i.e., easy to encode and access from longterm memory), it is recommended that brand marks should (1) be distinctive, (2) convey appropriate meanings, and (3) suggest something about brand benefits.
Many consumers are not fully informed when shopping for products and services, and because searching can be time consuming, costly, and often difficult, reliance on known and recognized brand names becomes important. (Keller, 1998) Indicates brand recognition often attracts new customers willing to pay premium prices, and that helps interring new markets and provides a protection of the market from new competitors.
In the case of food consumption, surveys indicate that consumers clarify that their choice is often influenced by the taste of the product, rather than by more unrelated indications such as the brand or the packaging. At the same time, these consumers are also ready to pay more for branded food products, and indeed demonstrate brand loyalty because they believe that their brand offers a good “value for price” balance. In the mind of the consumers, there is a link between perceived quality and brands. As a matter of fact, in book, (Aaker D. , 1996a) p. 324 states that perceived quality explains “80% of the perceived value of a brand “.
In continuation of previous studies, in this study the criteria of selecting top brands are weighted by different methods.
1.1 Literature review
Brand concept refers to the image of a particular brand as it is commonly understood by consumers. The management of brand concept or brand image is an activity that is strategically undertaken by firms in order to strengthen and build equity in brands, and to achieve longrun competitive advantage (Park, Jaworski, & MacInnis, 1986). Brand concepts are categorized in two part first functionoriented brands and second prestigeoriented brands. A functionoriented brand concept emphasizes those perspectives of the brand which are deal with sustained product performance, such as reliability and durability. At the other hand, prestigeoriented brand concept is deal with images of luxury and status (Park, Milberg, & Lawson, 1991). For example, (Keller K. , 2008) defines brand image as consisting of (1) user profiles, (2) purchase and usage situations, (3) personality and values, and (4) history, heritage and experiences. Also (Aaker & Joachimsthaler, 2000) organize brand identity elements around four
ASIAN JOURNAL OF MANAGEMENT RESEARCH 252
perspectives: (1) the brand as a product, (2) the brand as an organization, (3) the brand as a person, and (4) the brand as a symbol.
By looking at what the brand elicits and looking at what elicits the brand in consumers’ minds two perspectives comes up, The first perspective would use a question like “What comes to mind when you think of CocaCola?” whereas the second would use “Which beverage do you associate with better taste?” Both perspectives affect a brand’s position in consumers’ minds and brand choice (Barnard & Ehrenberg, 1990) (Fazio, Powell, & Williams, 1989) (Krishnan, 1996).
Dealing with food and beverage products, the taste and its sensory dimensions are usually mentioned by customers as significant elements of quality perception. Numerous methodological paths have been examined to measure brand equity and its dimensions. Three of them could be mentioned here as below:
1) A first one consists of measuring the utilities of attribute combinations associated to brand names through a conjoint analysis design (Louviere & Johnson, 1988). This approach has seen further development with the discreet choice method (Louviere, Hensher, & Swait, 2000). This method has been notably used for the measuring of utilities take from brands and origin names of wines, and the interaction among products and brand attributes. So this method compares the utility of the brand (or region of origin) with other product attributes.
2) A second type of method consists of measuring brand value from actual consumers’ choices, using panel data (Kamakura & Russell, 1993). They have built a model that compares the price differences of the different brands purchased by the panelists, taking into account measures of advertising pressure during the period preceding the purchase. Thus their model explains price differences by combining of palpable and impalpable attributes. However, its Impossible to separate the performance of the product and its palpable attributes, on one side, and the performance of the brand and its impalpable attributes, on the other side.
3) A third one is explored by (Park & Srinivasan, 1994). These authors measure brand equity as a construct resulting from the difference between the consumers’ “subjective preference” and “objective preference”). These two measures (subjective, objective) are quite different in nature. Product attributes (objective measures) are evaluated by experts, whereas brand preferences are evaluated by the consumers. The brand name is successively absent and present in the combination of attributes presented to the respondents. It is interesting to note that some of the products that are tested are food products, and that the objective attributes include pertaining to pleasure scores gained from actual tasting of the products.
All three approaches refer more or less clearly to the purchase model of (Tybout & Hauser, 1981) based on the sequence perceptionpreferencechoice. This model presume that intrinsic (palpable) product attributes and extrinsic (impalpable) attributes influence the global perception of the product, which involves a favorable attitude modulated by the consumption situation, and results in a choice decision, modulated by the stimulating attributes at purchase point (price, promotions, external constraints, etc).
ASIAN JOURNAL OF MANAGEMENT RESEARCH 253
1.2 Methods of brand evaluation
By considering literature of brand there are different methods explored for evaluating and selecting premier brands. For example IntraBrand Corporation which is wellknown company in this field use below criteria:
All brands were then subject to the following criteria that narrowed candidates significantly:
1) There must be substantial publicly available financial data. 2) The brand must have at least onethird of revenues outside of its countryoforigin. 3) The brand must be a marketfacing brand. 4) The Economic Value Added (EVA) must be positive. 5) The brand must not have a purely B2B single audience with no wider public profile and
awareness.
Then candidate brands evaluated in 3 steps: first, Financial Analysis, second, Role of brand and third, Analysis and Brand Strength Score which finally result in Brand Value. Based on Brand Value the best brand selected. (Interbrand Corporation)
Another method for brand evaluation is Brand Equity, since the term “Brand Equity” came out in the 1980s; there has been a cause to become concerned with this subject among marketing academicians and Professionals (CobbWalgren, Beal, & Donthu, 1995). Considering the value of brand equity, Aaker defined it as a set of assets (and liabilities) linked to a brand’s name and symbol that add to (or subtract from) the value provided by a product or service to a firm and/or that firm’s customers (Aaker, 1991).
Brand equity may be evaluated from three aspects: first customer mind set, second product market outcomes and finally by financial market outcomes (Keller, K.L.; Lehmann, D.R, 2001). Proponents contend that for a brand to have value, it must be valued by the customer. If the brand has no meaning to the customer, the other definitions are meaningless (CobbWalgren, Beal, & Donthu, 1995) (Keller, 1993).
A comprehensive perception of brand equity from the customer’s point of view is essential for successful brand management. According to Keller’s explanation, positive customerbased brand equity “can lead to greater revenue, lower cost, and higher profit; it has direct implications for the firm’s ability to command higher prices, a customer’s willingness to seek out new distribution channels, the effectiveness of marketing communications, and the success of brand extensions and licensing opportunities.” (Keller, 1993)
Brand equity is a multidimensional concept which Keller separated it into two components: awareness and association (Keller, 2002) also Aaker explained brand equity as a combination variable of the five dimensions from the brand assets which could be advert to: brand loyalty, brand awareness, perceived quality, brand association, and other proprietary assets such as patents, trademarks, and channel relationships (Aaker, 1991). Among these five brand equity dimensions, the first four represent customers’ evaluations and reactions to the brand that can be readily understood by consumers (Barwise, 1993), so they have been widely used to measure
ASIAN JOURNAL OF MANAGEMENT RESEARCH 254
customerbased brand equity in previous studies. In summary, strong brand equity indicates that customers have high brandname awareness, patronage a favorable brand image, perceive that the brand is of high quality, and are loyal to the brand (Tong & Hawley, 2009). Aaker attempted to relate customerbased brand equity model to productmarket outcomes in a fivedimension model: brand loyalty, quality perception, brand associations, brand awareness, and market situation (including market price, and path coverage, and market share) (Aaker, 1998).
A comprehensive brand equity model is created including dimensions such as corporation ability association, brand awareness, quality/value perception and brand resonance. Based on the previous researches conceptualizations of brand equity, Wang, Wei & Yu presents a framework of brand equity building in which the customerbased model and productmarket model are combined to create a new model for brand equity. It consists of corporation ability association, brand awareness, quality perception, brand resonance, brand extensibility, price flexibility, and repurchase intention, which are shown in figure1. (Wang, Wei, & Yu, 2008)
Figure1: A conceptual framework for brand equity (Wang, Wei, & Yu, 2008)
ASIAN JOURNAL OF MANAGEMENT RESEARCH 255
Among several brand equity models in the literatures, this study has used the one constructed by Wang, Wei & Yu, which is the most comprehensive one.
2. Research Gap
Many consumers are not fully informed when shopping for products and services, reliance on known and recognized brand names becomes important. Research question is as follows: What is the effect coefficient of brand selecting criteria in beverage industries in consumers mind in Iran?
3. Objectives
This research attempts to introduce important criteria which have effects on selecting the best brands in beverage industries in Iran, also to evaluate the weight of each criterion for selecting the best brand in the case Persian beverage market.
4. Research Methodology
In such a case which needs to know relative importance of available criteria and this relative importance evaluates the degree of preferences of each criterion compare with other criteria and use it for decision making, MADM weighting methods would be used.
Weighting methods are divided into two categories: objective methods and subjective methods. In this paper entropy were selected from objective methods and Analytic Hierarchy Process (AHP) were selected from subjective methods which lead in two weight vectors, then integration of both vectors results in the effect coefficient of brand selecting criteria. AHP is used for a pair wise comparison of the criteria on a subjective. Additionally, entropy is applied to determine the objective weights. Finally, the subjective and objective weights are combined using the compromised weighting method. Statistical population of this study would be the consumers of all kind of beverages in Tehran, Qazvin, Shiraz and Tabriz which are Iranian big cities by considering their age between 18 years old to 50.
Considering the features above and the data provided, the number of samples considered for this research is 30 people obtained, with 55 percent of respondents being male and 45 percent female. Sampling method used in this stage of research is simple random sampling, in which each element of the intended population has equal chance of selection. The tool used to collect data is questionnaire which has been designed based on the pairwise comparison matrix and using Likert 5option spectrum. Diagram of the research methodology is provided in Figure 2.
ASIAN JOURNAL OF MANAGEMENT RESEARCH 256
Figure 2: Schematic diagram of research methodology
4.1 Criteria of Brand selecting
According to literature review and based on a model by (Wang, Wei, & Yu, 2008) the criteria of selecting the best brand are described as below:
• Corporation Ability Association CAA includes three proportions for observation: first corporation performance including revenue and growth rate, second corporation innovation, and finally degree of globalization. The revenue and growth rate are important instruments which show brand’s market performance, signaling that the brand is “in good standing” and popular with consumers. The advertisements by a large, high performance company are easier to be accepted by consumers (Aaker, 1998). Innovation is always associated with “trendy” and “popular” in consumer market. Globalization is accompanied by more variety of products, corporation longevity, more resources, more advanced technologies, and more promises to customers, which automatically enhance the brand associations and awareness. Consumers frequently use the globalization level as key criteria for appraising brands (Aaker, 2004). They tend to rate international brands higher than the local brands, and the use of foreign or international spokespersons in advertisements always lead them to believe that the brand is more reliable and popular (Wang, Wei, & Yu, 2008).
• Brand awareness Brand awareness is an important component of brand equity. It refers to the ability of a potential buyer to recognize or recall a brand as a member of a certain product category (Aaker, 1991) Customers should be aware about the product. Consumers will choose only the recognized item if there are two items to select. The demand for certain brand increases when more awareness and acceptance of brand are created among customers. (Seetharaman, Nadzir, & Gunalan, 2001)
ASIAN JOURNAL OF MANAGEMENT RESEARCH 257
• Quality perception Chaudhuri and Holbrook found that consumer trust based on the quality perception facilitates attitudinal and behavioral loyalty (Chaudhuri & Holbrook, 2001). When the relationship between brand name and product quality is learned prior to the relationship between product attributes and quality, consumers are more likely to be influenced by the perceived quality. Similarly, another empirical study of consumer choice behavior with respect to store brands in the US, the UK, and Spain found that uncertainty about quality, perceived quality of store brands versus national brands, were related to consumer attitudes toward risk, quality, and price of the store brands (Erdem, Zhao, & Valenzuela, 2004).
• Brand resonance Brand resonance refers to the relationship between brand and its users including consumers’ willingness to purchase and to recommend to others. The power of a brand lies in the minds of consumers, in the effect of what they have experienced and learned about the brand on their responses to the brand over time (Keller K. , 2000).
• Brand extensibility Brand extension provides a means of capitalizing on brand equity. Research has shown that consumers use perceptions of a family brand name to evaluate new products introduced under its umbrella (Aaker & Keller, 1990).
• Price flexibility A strong brand can charge a higher price than weaker brands or generic products because consumers are more willing to tolerate price increase if they perceive the quality of the brand is higher compared to alternative brands. Although pricing strategies are often short term in nature, they are predicated on longerterm brand investments. For example, Erdem found Consumer price sensitivity is impacted by brand credibility. The more consumers find brands credible, the more tolerant they are of price increase (Erdem, Swait, & Louviere, 2002).
• Repurchase intentions CobbWalgren examined the effect of brand equity on consumer preferences and purchase intentions using two sets of brands and found that the brand with the higher equity in each category generated significantly greater preferences and purchase intentions (CobbWalgren, Beal, & Donthu, 1995).
4.2 Available beverage brands in Iran and their manufacturers:
Considering the information given by reference data bank (FoodKeys) it has found that there are 62 brands of beverage are produces in Iran. In prior evaluation, some of producers which don’t have frequent activity in recent years or just have some activity in a specific time were omitted from the list. Also some brands were used distributing networks which are limited to specific cities and they are omitted too. Finally in table 2 beverage producers and their brands are listed.
ASIAN JOURNAL OF MANAGEMENT RESEARCH 258
Table 1: Criteria of brand selection
Symbol Criteria Corporation ability association Brand awareness Quality perception Brand resonance Brand extensibility Price flexibility Repurchase intentions
Table 2: List of beverage Producer Company in Iran
Brand Company Symbol Aras ZamZam Azerbayejan
Aras Cola Fard Azerbayejan Eram Eram Noosh Arsu Nik Noosh Rasht BiCi Zarin Coolak Sepahan
ParsiCola Sasan Pepsi Sasan Tops Damavand
ZamZam ZamZam 7up Sasan
Shad noosh Sasan Coca Cola Khosh Govar Miranda Sasan
4.3 Weighting the Criteria
4.3.1 Entropy
First the weight of each criterion calculated by entropy technique. The criterion has more dispersal will be the most importance criterion. (Asgharpour, 1988) Entropy is a criterion in information theory that explains the uncertainty in a discrete distribution function ( ). For the th attribute this uncertainty could be formulated as follows (Nigim, Munier, & Green, 2004)
(1)
ASIAN JOURNAL OF MANAGEMENT RESEARCH 259
Where is a positive constant and is the quantity of alternatives (DR programs, in this paper). The entropy technique can be used to evaluate the attributes in a MADM model. Consider a decision matrix, , as following
(2)
Where, is the performance of the th alternative regarding th attribute. Each element of decision matrix can be normalized as:
(3)
Then, can be calculated by Eq. (1). Now, the deviation degree ( ) according to the th attribute will be:
(4)
Then, the weighting for each attribute, , will be calculated as
(5)
F inally, the group separation measure of each attribute is combined through arithmetic mean of
th decision makers, In table 3 the matrix of criteria’s weight are gathered as through entropy method:
Table 3: The weight of each criterion via entropy
0.166 0.075 0.165 0.223 0.088 0.158 0.124
4.3.2 AHPGroup Decision Making
In continue criteria are weighted through AHP method. In this methods decision makers judge the priority of each criterion according to their knowledge and experiments. AHP was developed
ASIAN JOURNAL OF MANAGEMENT RESEARCH 260
in the early 1970s in response to military contingency planning, scarce resources allocation and the need for political participation in disarmament agreements, and AHP not only a decision method that decomposes a complex multicriteria decision problem into a hierarchy but also a measurement theory that prioritizes the hierarchy and consistency of the judgmental data provided by a group of decision makers (Saaty, 1980). The calculation procedure is presented below:
Figure 3: The decision hierarchy
Decision hierarchy structured with the determined alternative and criteria is provided in Figure 3. Establishment of pairwise comparison matrix A. Let ; ; . . . ; be the set of criteria, while represents a quantified judgment on a pair of criteria ; . The relative importance of two criteria is rated using a scale with the digits 1, 3, 5, 7 and 9, where 1 denotes ‘‘equally important’’, 3 for ‘‘slightly more important’’, 5 for ‘‘strongly more important’’, 7 for ‘‘demonstrably more important’’ and 9 for ‘‘absolutely more important’’. The digits 2, 4, 6 and 8 are used to facilitate a compromise between slightly differing judgments. A by matrix A is derived as follows:
(6)
In matrix A, the problem involves assigning a set of numerical weights ; ; . . . ; to the criteria ; ; . . . ; that ‘‘reflects the recorded judgments’’. If A is a consistency matrix,
ASIAN JOURNAL OF MANAGEMENT RESEARCH 261
the relations between weights and judgments are simply given by
(for .
In table 4 the matrix of criteria’s relative weight are gathered as through AHP method:
Table 4: The weight of each criterion via AHP
0.138 0.076 0.151 0.179 0.236 0.119 0.100
4.3.3. Compromised weighting method
Criteria weights are mostly subjectively determined by decision makers, or occasionally derived from the inability of the entropy measure of the evaluation matrix to answer to predilections of decision makers. Therefore, (Feng & Chen, 1992) suggested a compromised weighting method to resolve a situation in which weights are either more subjective or objective:
(7)
Where is the compromised weight, is the objective weight and is the subjective weight.
Finally the weight of each criterion for selecting the best brand in beverage industries gathered in table 5:
ASIAN JOURNAL OF MANAGEMENT RESEARCH 262
Table 5: The weight of each criterion of best brand selecting
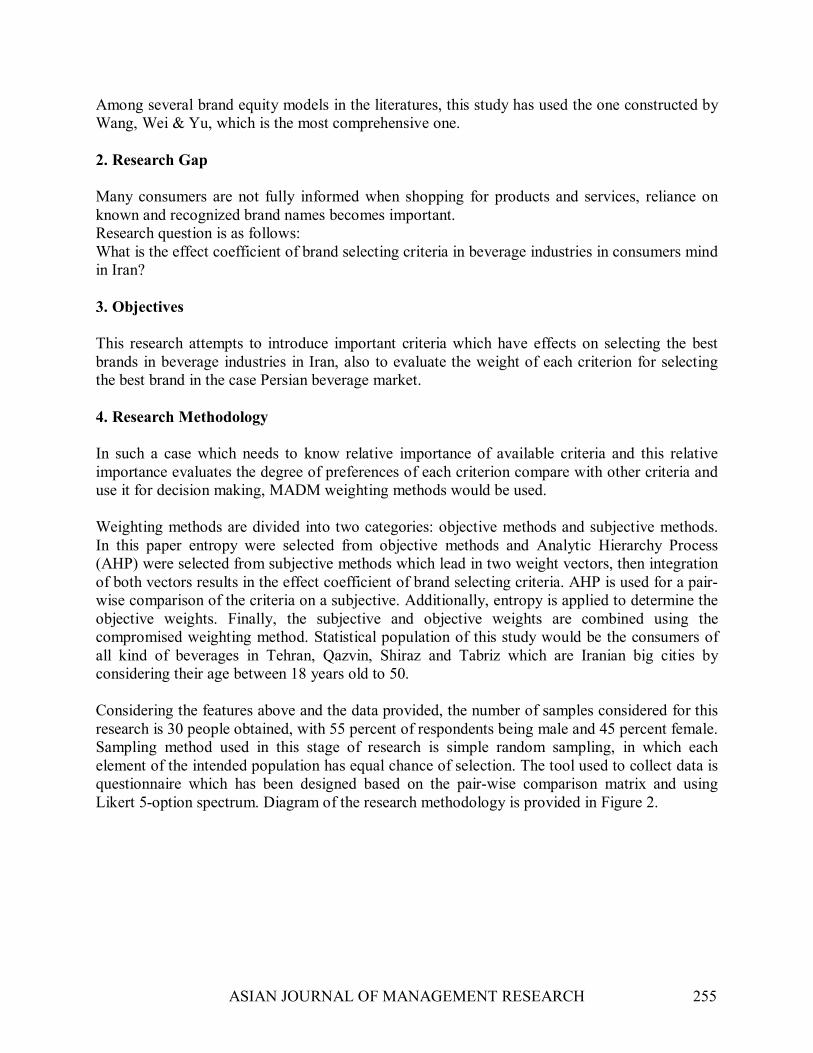
The results of integrated entropy and AHP shows that, brand resonance criterion has significant importance comparing with other criteria by Persian consumers of beverage products. Figure 5 mentioned the effects of each criterion. As it indicated before brand Resonance refers to the nature of the relationship between the customer and the brand. It is described as having four elements: behavioral loyalty, attitudinal attachment, sense of community and active engagement (Keller K. , 2001).
This concept perform an important role for business making long term benefits due to loyal customers do not need widespread promoting attempts. They are willing to pay more to get better quality of their interested brand. Also there is increasing positive word of mouth advertisement among consumers through growth of brand resonance. (Yoo, 2008) Experts’ opinions are gathered by questionnaire. Then the major criteria weights are analyzed using the analytic hierarchy process and entropy, final weights are then determined using the compromised weighting method. Brand resonance performs the most important role among all criteria by Persian consumers of beverage products.
6. Conclusion
In conclusion brand resonance advantages include Continues profit, Reduces marketing cost, Increases percustomer revenue growth, Decreases operating cost, Increases referrals, Increases price premiums and Provides competitive advantage. (Tepeci, 1999)
6.1 Future Work
It is suggested that researches study on promoting brand resonance criterion among consumers in next studies.
7. References
1) Aaker, D. (1996a). Building Strong Brands. New York, NY.: The Free Press.
2) Aaker, D. (1998). Building Strong Brands. New York: The Free Press.
ASIAN JOURNAL OF MANAGEMENT RESEARCH 264
3) Aaker, D. (2004). Leveraging the corporation brand. California Management Review , 46.
4) Aaker, D. (1991). Managing Brand Equity: Capitalizing on the Value of a Brand Name. New York, NY.: The Free Press.
5) Aaker, D., & Joachimsthaler, E. (2000). Brand leadership. New York: Free Press.
6) Aaker, D., & Keller, K. (1990). Consumer evaluations of brand extensions. Journal of Marketing , 45.
7) Alpert, M. (1971). Identification of determinant attributes: a comparison of methods. Journal of Marketing Research , Vol. 8 (No. 2), pp. 18491.
8) Asgharpour, M. (1988). Multi Criteria Decision Making. Tehran University Press.
9) Axelrod, J. (1968). Attitude measures that predict purchase. Journal of Advertising Research , Vol.8 (No. 1), pp. 317.
10) Barnard, N., & Ehrenberg, A. (1990). Robust measures of consumer brand beliefs. Journal of Marketing Research , Vol. 27 (No. 4), pp. 47784.
11) Barwise, P. (1993). Brand equity: snark or boojum? International Journal of Research in Marketing , 10, pp. pp. 93104.
12) Chaudhuri, A., & Holbrook, M. (2001). The effects from brand trust and brand affect to brand performance: the role of brand loyalty. Journal of Marketing , 65.
13) CobbWalgren, C., Beal, C., & Donthu, N. (1995). Brand equity, brand preferences, and purchase intent. Journal of Advertising , 24, pp. pp. 2540.
14) Cohen, L. (1966). The level of consciousness: a dynamic approach to the recall technique. Journal of Marketing Research , Vol. 3 (No. 2), pp. 14248.
15) Erdem, T., Swait, J., & Louviere. (2002). The impact of brand credibility on consumer price sensitivity. International Journal of Research in Marketing , 19.
16) Erdem, T., Zhao, Y., & Valenzuela, A. (2004). Performance of store brands: a cross country analysis of consumer store brand, perceptions, and risk. Journal of Marketing Research , 41.
17) Fazio, R., Powell, M., & Williams, C. (1989). The role of attitude accessibility in the attitudetobehavior process. Journal of Consumer Research , Vol. 16, pp. 2808.
18) Feng, C., & Chen, C. (1992). The determination of criteria weightscompromised weighting method’. Traffic and Transportation (Vol. 14), pp. 5167.
ASIAN JOURNAL OF MANAGEMENT RESEARCH 265
19) Fournier, S. (1998). Consumer and their brands: developing relationship theory in consumer research. Journal of Consumer Research , Vol. 24, pp. 34373.
20)Gwin, C., & Gwin, C. (2003). Product attributes model: a tool for evaluating brand positioning. Journal of Marketing Theory and Practice , Vol. 11 (No. 2), pp. 3042.
21)Hauser, J., & Koppelman, F. (1979). (1979), “Alternative perceptual mapping techniques: relative accuracy and usefulness. Journal of Marketing Research , Vol. 16 (No. 4), pp. 495506.
22) Interbrand Corporation. (n.d.). Interbrand's Method for Valuating the Best Global Brands. Retrieved 3 27, 2010, from Interbrand: http://www.interbrand.com/best_global_brands_methodology.aspx
23)Kamakura, W., & Russell, G. (1993). Measuring brand value with scanner data. International Journal of Research in Marketing , Vol. 10 (No. 1), pp. 922.
24)Keller, K. (2001). Building customerbased brand equity. 10, pp. 1419. Marketing Management.
25) Keller, K. (1993). Conceptualizing, measuring, and managing customerbased brand equity. Journal of Marketing , Vol. 57 (No. 1), pp. 122.
26)Keller, K. (1998). Strategic brand management (7 ed.). New Jersey.
28) Keller, K. (2002). Strategic Brand Management: Building, Measuring, and Management Brand Equity. Upper Saddle River: 2nd ed., Pearson Education.
29)Keller, K. (2000). The brand report card. Harvard Business Review , 78.
30)Keller, K.L.; Lehmann, D.R. (2001). The brand value chain: linking strategic and financial performance. working paper, Tuck School of Business, Dartmouth College, Hanover .
31) Krishnan, H. (1996). Characteristics of memory associations: a consumerbased brand equity perspective. International Journal of Research in Marketing , Vol. 13 (No. 4), pp. 389405.
32) Lee, C.W., & Liao, C.S. (2009). The effects of consumer preferences and perceptions of Chinese tea beverages on brand positioning strategies. British Food Journal , Vol. 111 (No. 1), pp. 8096.
ASIAN JOURNAL OF MANAGEMENT RESEARCH 266
33) Louviere, J., & Johnson, R. (1988). Measuring brand image with conjoint analysis and choice models. in 41 Leuthesser, L. (Ed.), Marketing Science Institute, Cambridge, MA.
34) Louviere, J., Hensher, D., & Swait, J. (2000). Stated Choice Methods. Analysis and Applications. Cambridge.
35)MacInnis, D. J., Shapiro, S., & Mani, G. (1999). Enhancing brand awareness through brand symbols. Advances in Consumer Research , Vol. 26, pp. 6018.
36)Nedungadi, P. (1990). Recall and consumer consideration sets: Influencing choice without altering brand evaluations. Journal of Consumer Research, , Vol. 17 (No. 3), pp. 26376.
37)Nigim, K., Munier, N., & Green, J. (2004). Pre feasibility MCDM tools to aid communities in prioritizing local viable renewable energy sources. Elsevier, Renewable energy , pp. 1775–1791.
38) Park, C., & Srinivasan, S. (1994). A surveybased method for measuring and understanding brand equity and its extendibility. Journal of Marketing Research , Vol. 31 (No. 2), pp. 27188.
39) Park, C., Jaworski, B., & MacInnis, D. (1986). Strategic brand conceptimage management. Journal of Marketing , Vol. 50, pp. 13545.
40) Park, C., Milberg, S., & Lawson, R. (1991). Evaluation of brand extensions: the role of product feature similarity and brand concept consistency. Journal of ConsumerResearch , Vol. 18, pp. pp. 18593.
41) Saaty, T. (1980). The Analytic Hierarchy Process,, . New York: McGrawHill.
42) Seetharaman, A., Nadzir, Z., & Gunalan, S. (2001). A conceptual study on brand valuation. Journal of product & brand Management , 10.
43) Tepeci, M. (1999). Increasing brand loyalty in the hospitality industry. International Journal of Contemporary Hospitality Management.
44) Tong, X., & Hawley, J. M. (2009). Measuring customerbased brand equity: empirical evidence from the sportswear market in China. Journal of Product & Brand Management .
45) Tybout, A., & Hauser, J. (1981). A marketing audit using a conceptual model of consumer behavior. Journal of Marketing , Vol. 45 (No. 4), pp. 82101.
ASIAN JOURNAL OF MANAGEMENT RESEARCH 267
46)Wang, H., Wei, Y., & Yu, C. (2008). Global brand equity model: combining customerbased with productmarket outcome approaches. Journal of Product & Brand Management .
47) Yoo, B. (2008). cross – national invariance of the effect of personal collectivistic orientation on brand loyalty and equity. Asia pacific journal of marking and logistics. 21, pp. 4157.