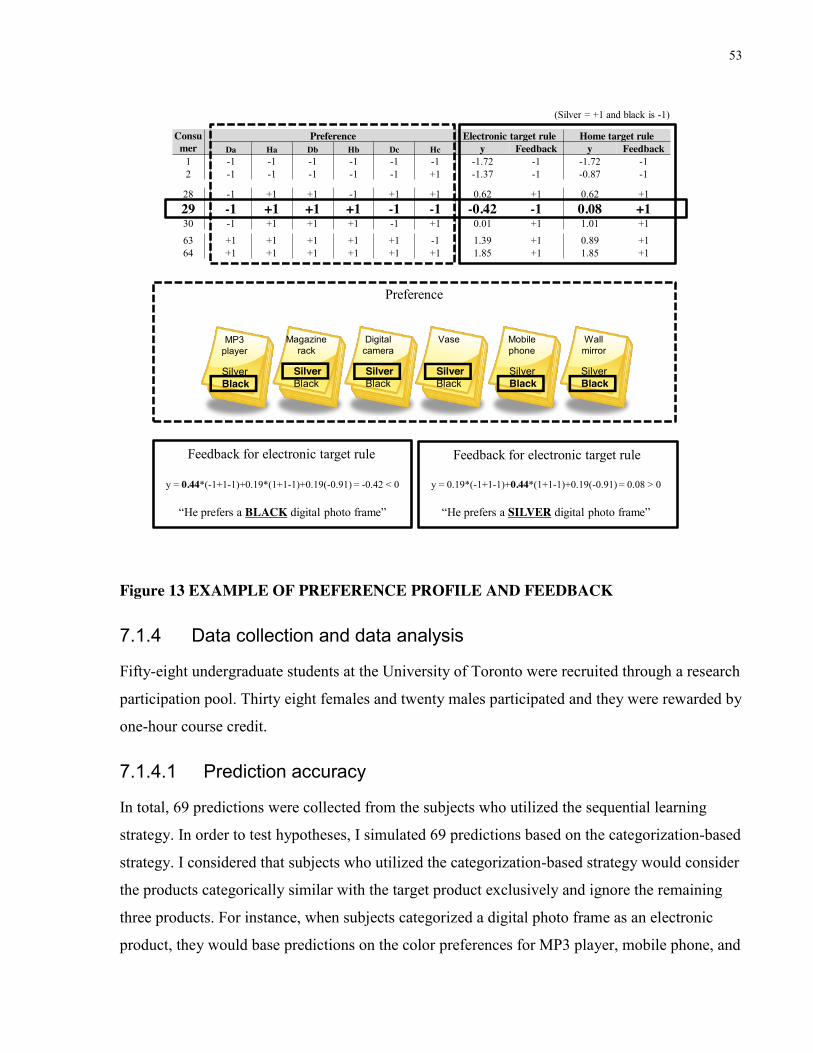
Figure 13 EXAMPLE OF PREFERENCE PROFILE AND FEEDBACK .................................. 53
Figure 14 PREDICTION ACCURACY ABOUT RANDOM 8 TRIALS AS A FUNCTION OF
CATEGORY, TARGET RULE, AND PREDICTION STRATEGY .......................................... 56
x
Figure 15 PREDICTION ACCURACY ABOUT INITIAL 8 TRIALS AS A FUNCTION OF
CATEGORY, TARGET RULE, AND PREDICTION STRATEGY .......................................... 57
Figure 16 PREDICTION ACCURACY OF THE SEQUENTIAL LEARNING STRATEGY AS
A FUNCTION OF CATEGORY, TAREGET RULE, AND PLACEMENT OF 5 TRIALS ...... 59
Figure 17 RELATIVE DIAGNOSTICITY AS A FUNCTION OF CATEGORY, TARGET
RULE, AND PREDICTION TRIALS .......................................................................................... 60
Figure 18 PREDICTION ACCURACY ABOUT 32 PREDICTION TRIALS AS A FUNCTION
OF RULE CONGRUENCY AND NUMBER OF DATA SETS ................................................. 63
1
Chapter 1
Design is the professional service of creating and developing concepts and specifications that
optimize the function, value, and appearance of products and systems for the mutual benefit of
both consumer and manufacturer (Industrial Designers Society of America). Design has attracted
increasing attention for its commercial value since the early 1990s. For instance, Roy and Potter
(1993) analyzed 220 design projects in UK companies and identified the long-term commercial
benefits of investment in design. Gemser and Leenders (2001) studied 147 Dutch companies and
also established that design investment pays off. Design Council (2004) reported that the stock
prices of 63 UK companies that had earned design awards outperformed the FTSE 100 index.
Petersen (2008) showed that the stock prices of award winning products outperformed S&P 500
by 6.5 %. Hertenstein et al. (2005) found that even when expenditure on design is controlled, the
companies with effective design programs have higher returns on sales, higher net incomes, and
higher stock market performance.
Now, managers attempt to broadly apply the insights from design to their businesses. Some
researchers argue that implementing design programs in a company can help the company
achieve its objectives (Borja de Mozota 2003), and others propose that managers should think
and work like designers to identify market opportunities (Brown 2008; Martin 1995). Design is
considered as “innovative thinking, strategy, and planning that IDEO, Jump, Design Continuum,
and Ziba do and Patrick Whitney at the Illinois Institute of Design and David Kelley at Stanford
teach” (Nussbaum 2009).
In my dissertation, design is broadly defined as an activity to benefit consumers by either
educating them if their preference is not developed (e.g., Allessi, Bang & Olufsen, and designers
in the fashion, paintings, and music industries) or serving them if their preference is well
established (e.g., US design firms such as P&G, OXO, Target, and IDEO). According to this
view, new product development is a sub-area of design (Hauser et al. 2006), including other
areas such as engineering design (Howard et al. 2008) and business design (Fraser 2007).
Therefore, not only physical attributes of a product but also non-observable or non-verifiable
2
physical attributes (e.g., thread count of sheets or shape of product), nonphysical attributes (e.g.,
warranty duration), and even non-attributes (e.g., benefits) can be design elements.
As design has expanded its boundaries in the business area, designers have started undertaking
tasks well beyond their traditional boundaries. Perks et al. (2005) investigated design tasks in 18
UK consumer goods manufacturers and found that designers not merely developed product
concepts but they also participated in market research and business analysis. Increasingly,
designers are required to support the entire product development effort by linking consumer
needs with form and function to create something attractive as an innovation (Turner 2003). As
harsh competition emphasizes innovative differentiation, they are often asked to undertake a
leadership role in the product development process (von Stamm 2004).
As designers are increasingly performing tasks that have traditionally been outside their purview
and are involved in data collection, analysis, and application, the decisions that consumers and
designers make while they participate in design tasks are being documented in case studies. For
example, when designers for Doblin developed a new furniture system with Herman Miller,
potential users were asked to provide their preference for its prototypes (Deasy et al. 2001). In
another example, when designers for Ziba developed a desktop computer with Lenovo, they
surveyed computer users’ preferences for a large variety of products to choose the most preferred
material and color for the computer (Business Week 2005). Interestingly however, designers
applied the research findings selectively; Doblin designers ignored a significant portion of the
data collected from the prototype testing and did not change their pre-consultation product
concept and Ziba designers inferred consumer preferences regarding computers by relying on
consumer preferences only for consumer electronics, choosing to ignore consumer data for all
other product categories.
These two examples raise questions such as whether consumers’ decisions indicate their
preferences accurately and whether designers’ decisions apply research findings accurately.
Although such decisions determine design outcomes significantly, the decisions made by
consumers and designers have not been studied in research papers but mostly described in case
studies. The lack of academic study of design decisions can be attributed to design researchers
emphasizing practice over academic study. Design researchers have long suggested that design is
concerned with how things ought to be but science is about how things are (Gregory 1966;
3
Simon 1969). For example, Archer (1979) and Cross (1982) compared, so called, the “designerly
way of knowing” (Cross 1982) to the scientific way of knowing and claimed that design is a
collective body of practical knowledge based upon invention and implementation, whereas
science is a collective body of theoretical knowledge based upon measurement and hypothesis
testing. This tradition continues until this day; contemporary design researchers tend to consider
developing a design project as a form of task-specific research and, therefore, a large number of
design papers published in design journals are case studies without insights transferrable to other
design research (Buchanan 2001; Franz 1998; Friedman 2000; Margolin 1999; Owen 2000).
In my dissertation, I study decisions in the design process by drawing on decision-making
literature. This literature will provide a useful framework because it studies decision bias, which
is the human tendency to make systematic errors resulting from information-processing shortcuts.
Therefore, decision-making research is well positioned to study the systematic errors that
consumers and designers make.
My dissertation discusses two biases in two design tasks. One is consumer bias that occurs when
consumers indicate their preferences. If consumers provide biased preferences, designers can
collect biased data. Another is designer bias that arises when designers use the collected data. If
designers apply the findings of the collected data in a biased way, they can result in biased
predictions even when the collected data are not biased. I study these two biases in two tasks of
design process: concept testing and preference learning. In practice, there are many design
processes that contain somewhat different tasks. As a result, these two tasks correspond to
somewhat different tasks in each of these processes. Firstly, concept testing is concerned with
assessing consumers’ responses to product concepts. This task corresponds to new product
evaluation in product development (Hauser et al. 2006), concept evaluation in product design
(Luchs and Swan 2010), screening and evaluation in engineering design (Howard et al. 2008),
and user evaluation in business design (Fraser 2007). Secondly, preference learning is concerned
with predicting consumers’ preference using available market data. Designers perform the
preference learning task in the various stages of the design process: fuzzy front end in product
development, idea generation in product design, conceptual design in engineering design, and
opportunity identification in business design.
4
In sum, I draw on the decision-making frameworks to study the relatively little-discussed topic
of decision-making in the design process. In particular, I study two different biases, consumer
bias and designer bias, in two design tasks, concept testing and preference learning. Therefore,
my dissertation consists of two essays: consumer bias in concept testing is discussed in the first
essay and designer bias in preference learning is discussed in the second essay. The two essays
are briefly summarized below.
In the first essay, I study consumer bias that occurs when consumers evaluate product concepts.
When designers test product concepts, they often ask consumers to indicate which product they
prefer between two products. Sawtooth Software, for example, reported that the proportion of
their clients who use the choice-based conjoint analysis increased from 50% in 2003 to 87% in
2009. Choice is also a dominant question format in my review of the conjoint research papers
published after 1985 (55%). Although majority of academic support and practical research
applications are in favor of the choice-based approach, having consumers make choices is not the
best way to elicit their “true” preference. Decision-making literature on the topic of preference
construction suggests that a choice question can elicit biased preference because consumers
simply choose the product that is superior on the most important attribute (Fischer and Hawkins
1993; Tversky et al. 1988). Similarly, Huber (1997) noted in his review of conjoint studies that
conjoint respondents spent significantly less time and produced less reliable outcomes when they
were asked to choose a product than when they were asked to rate a product, concluding that
choice tasks tend to oversimplify consumers’ decision-making process.
I propose that modifying the format of the question helps consumers to make trade-offs and
provide the preferences that reflect their consumption utility (Hsee et al. 2003; Shiv and Huber
2000). My three studies show that when consumers are asked to predict which product they will
enjoy more, they tend to choose the product that is less likely to serve their immediate purchase
purpose, which can differ from how the product will be used in the long term. For example, a
performance attribute tends to serve an immediate purchase purpose while an aesthetic attribute
would be more related to long-term enjoyment. When consumers are asked to predict enjoyment,
the likelihood of choosing a product superior on the performance attribute over a product
superior on the aesthetic attribute decreases compared to when they are asked to choose. These
findings suggest that making trade-offs is avoided in the choice question condition, but is
encouraged in the enjoyment prediction question condition. Thus, a simple change of question
5
format, in otherwise identical product comparisons, can elicit preference reversals. I also found
that this holds true only when product attributes are easy to evaluate; when product attributes are
hard to evaluate, changing the question format does not affect consumer choice.
The second essay examines designer bias in preference learning. When designers predict
consumer preference using market information, they often base their predictions on consumer
preferences for similar products. As introduced previously, when Ziba designers developed a
new computer in China with Lenovo, they selected the material and the color of the new
computer similar to those that Chinese computer users like for consumer electronics (Business
Week 2005). Although designers often base their predictions on categorization, this
categorization-based strategy can result in biased predictions. Decision-making research on the
topic of diagnosticity suggests that people often make biased predictions because they ignore
meaningful data or consider meaningless data important (Doherty et al. 1979) and that similar
products are not liked equally by an individual consumer, suggesting that categorization is not
necessarily meaningful for preference (Elrod 1988).
I propose that designers should not use a categorization-based strategy but should use a
sequential learning strategy – making a sequence of predictions and receiving feedback for each
prediction – and, for further improvement in prediction accuracy, they should make predictions
with multiple data sets (Brunswik and Herma 1951). I applied a typical Multiple Cue Probability
Learning experiment to a designer’s preference learning task and conducted two studies to test
whether prediction accuracy is a function of prediction strategy and the number of data sets. I
found that when subjects used a sequential learning strategy, they increased prediction accuracy
by 14% on average. Subjects further improved their prediction accuracy by 7% on average when
they made predictions in multiple sets, with a break between each set during which they reflected
on what they had learned.
In sum, in two essays, I demonstrate biases and propose approaches to avoid them in two design
tasks. Since Tversky and Kahneman (1974) claimed that people rely on a limited number of
heuristic principles that result in systematic errors, decision-making researchers have identified
biases in a wide variety of contexts and tried to help people make better decisions or predictions
(Blattberg and Hoch 1990; Gourville and Soman 1998; Hoch and Loewenstein 1991; Hoch and
Schkade 1996; Huber et al. 1982). My work adds to this body of knowledge by studying design
6
through the lens of decision-making, suggesting that the decision-making framework itself can
be crucial in understanding and improving the successful outcome of the design process.
7
Chapter 2
1 Introduction Imagine that a company develops two new stereo systems which are subsequently tested with a
group of consumers. One option provides greater power and the other provides richer sound. If
consumers have a well-defined preference, their indicated preference will not depend on the
methods to assess preference. They will choose the same option regardless of whether they are
asked to make a choice or they are asked to predict which option they would enjoy more.
However, Hsee et al. (2003) showed in his study that preference depends on questions being
asked; preference for the rich sounding option was not consistent between when subjects were
asked to choose and when they were asked to predict which option they would enjoy more.
Such preference reversals have attracted considerable attention among decision researchers as
they violate procedure invariance assumption. However, prior research on this topic focuses on
response mode and compares the preference based on a comparative response with preference
based on a non-comparative response. Studies have shown that people choose one option when
two options are presented together, but they bid, judge, or evaluate another option more highly
when each option is evaluated separately (Fischer and Hawkins 1993; Lichtenstein and Slovic
1971; Nowlis and Simonson 1997; Tversky et al. 1988). Recently, some studies have shown that
preference in the comparative response mode changes when consumers are asked different
questions (Hsee et al. 2003; Hsee et al. 2009; Shiv and Huber 2000). Note that, however, a
comprehensive understanding of why question type influences preference has not been reached
yet.
This article investigates the effect of two different question types, choice and enjoyment
prediction, on the preference in a comparative response mode, called question mode effect. It
aims to demonstrate the effect, identify one of its underlying mechanisms, and test one of its
boundary conditions. In particular, I propose that different questions evoke different decision
strategies, which in turn lead to different preferences; predict enjoyment questions compared to
choice questions encourage consumers to make a trade-off, which increases preference for an
option superior on the attributes that serve the purchase purpose to a lesser extent. Going beyond
8
demonstrating the effect, I explore whether the question mode effect is moderated by attribute
evaluability.
The present work contributes to the decision-making literature by adding question mode as a
determinant of decision strategy selection (Bettman et al. 1998; Payne et al. 1993). Research on
this topic has devoted considerable attention to characterize different decision strategies, identify
variables evoking different strategies, and encourage people to make decisions in a
compensatory way. A significant body of research formulates descriptive models of different
decision strategies (e.g., elimination-by-aspects in Tversky 1972) and finds evidence of the
utilization of non-compensatory decision strategies (Payne et al. 1993). Research indicates that
people utilize non-compensatory decision strategies when they find it difficult to make a trade-
off cognitively or emotionally, such as, when a decision is complex (Bettman et al. 1998) or
when anticipated negative emotion is considerable (Luce 1998). Because non-compensatory
decision strategies are generally assumed to lead to less normatively accurate choices1, attempt
has been made to encourage people to make decisions in a compensatory fashion. It has been
found that compensatory decision strategies are utilized when incentives are provided with
feedback over repeated choices (Cox and Grether 1996) or when people are under cognitive load
so that they do not avoid trade-off (Drolet and Luce 2004).
The present work also provides implications for choice-based conjoint analysis by advising how
to decrease consumers’ tendency to simplify task. Conjoint analysis is a statistical technique to
elicit part-worth utilities for attributes from respondents (Green and Srinivasan 1978, 1990). Its
older systems involve rating or ranking profiles. However, marketers found that respondents’
choices in the lab match their in-market behavior and individual level utilities can be estimated
by choice data (Louviere Woodworth 1983). Therefore, asking respondents to choose among
multiple profiles has become popular (e.g., 50% in 2003, 70% in 2005, 78% in 2007, and 87% in
2009 in Sawtooth Software) and the majority of recent academic support and practical research
applications are in favor of choice-based approaches. Although choice questions are widely
1 When selecting noncompensatory decision strategies, people focus on a limited number of attributes and choose or eliminate options depending on the values of those attributes. However, compensatory decision strategies consist of considering one option at a time, examining each of the attributes for that option, multiplying each attribute’s subjective value times its importance weight, summing these products across all the attributes to obtain an overall value for each option, and choosing the option with the highest value.
9
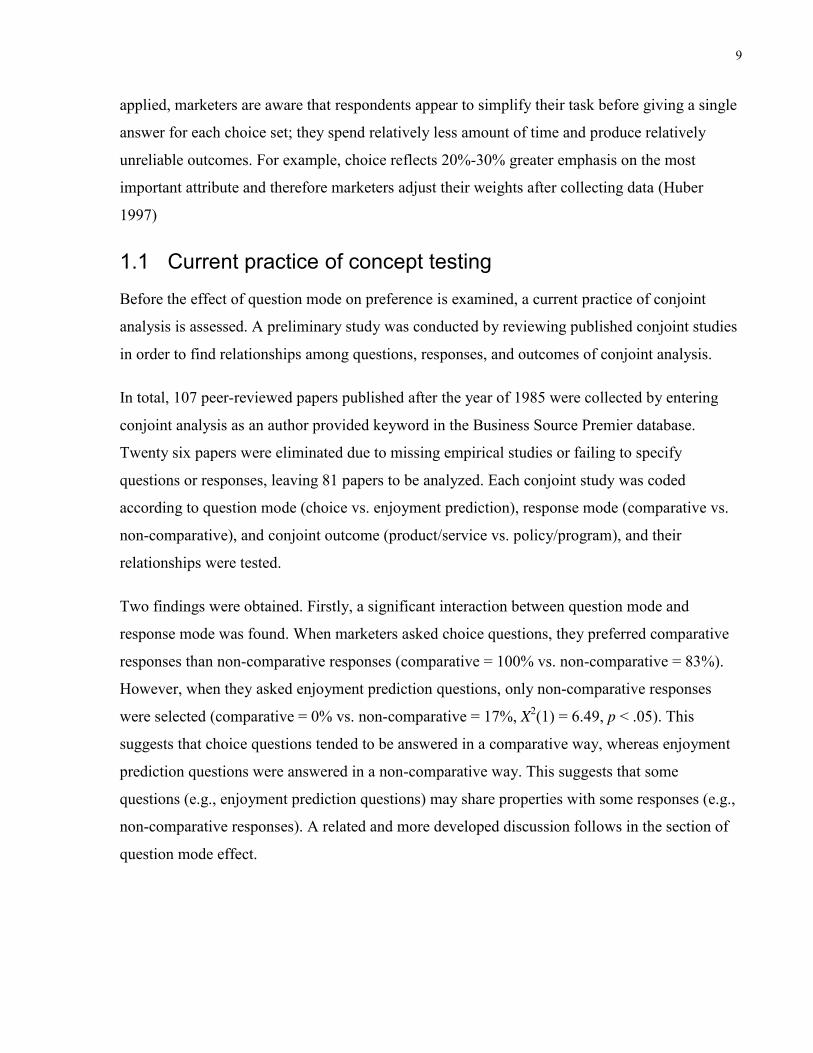
applied, marketers are aware that respondents appear to simplify their task before giving a single
answer for each choice set; they spend relatively less amount of time and produce relatively
unreliable outcomes. For example, choice reflects 20%-30% greater emphasis on the most
important attribute and therefore marketers adjust their weights after collecting data (Huber
1997)
1.1 Current practice of concept testing
Before the effect of question mode on preference is examined, a current practice of conjoint
analysis is assessed. A preliminary study was conducted by reviewing published conjoint studies
in order to find relationships among questions, responses, and outcomes of conjoint analysis.
In total, 107 peer-reviewed papers published after the year of 1985 were collected by entering
conjoint analysis as an author provided keyword in the Business Source Premier database.
Twenty six papers were eliminated due to missing empirical studies or failing to specify
questions or responses, leaving 81 papers to be analyzed. Each conjoint study was coded
according to question mode (choice vs. enjoyment prediction), response mode (comparative vs.
non-comparative), and conjoint outcome (product/service vs. policy/program), and their
relationships were tested.
Two findings were obtained. Firstly, a significant interaction between question mode and
response mode was found. When marketers asked choice questions, they preferred comparative
responses than non-comparative responses (comparative = 100% vs. non-comparative = 83%).
However, when they asked enjoyment prediction questions, only non-comparative responses
were selected (comparative = 0% vs. non-comparative = 17%, X2(1) = 6.49, p < .05). This
suggests that choice questions tended to be answered in a comparative way, whereas enjoyment
prediction questions were answered in a non-comparative way. This suggests that some
questions (e.g., enjoyment prediction questions) may share properties with some responses (e.g.,
non-comparative responses). A related and more developed discussion follows in the section of
question mode effect.
10
Figure 1PERCENTAGE OF CONJOINT STUDIES AS A FUNCTION OF QUESTION MODE AND RESPONSE MODE
Secondly, a significant interaction between conjoint outcome and response mode was found.
When marketers studied products or services, they tended to use comparative rather than non-
comparative responses (comparative = 58% vs. non-comparative = 42%). However, when they
studied policies or programs, they preferred non-comparative over comparative responses
(comparative = 32% vs. non-comparative = 68%, X2(1) = 3.90, p < .05). This finding is in line
with the characteristics products/services and policies/programs. In general, products and
services can be compared with other options. However, policies and programs are often
evaluated separately.
11
Figure 2 PERCENTAGE OF CONJOINT STUDIES AS A FUNCTION OF CONJOINT OUTCOME AND RESPONSE MODE
Two findings generally suggest that questions, responses, and outcomes appear to be associated.
When marketers study something which needs to be compared with other options, they ask
choice questions and employ comparative responses. However, when conjoint analysis is
conducted for something that is not often compared with other options, marketers can ask
enjoyment prediction questions and use non-comparative responses. In other words, choice
questions and comparative responses are preferred for comparing multiple options, whereas
enjoyment prediction questions and non-comparative responses are suitable for evaluating a
single option.
The rest of the article is organized as follows. Firstly, prior literature on preference reversals due
to preference elicitation method is reviewed under the title of response mode effect. Secondly, I
hypothesize question mode effect by extending the underlying mechanism of the response mode
effect. Thirdly, a boundary condition of the hypothesized question mode effect is proposed on
attribute evaluability. Then, the four studies testing the question mode effect and its boundary
condition are presented. Previewed briefly, findings suggest that (1) the likelihood of preferring a
12
product superior on less instrumental attributes is greater when consumers are asked to predict
enjoyment than when asked to make choices and (2) the proposed question mode effect
disappears when attributes are hard to evaluate. Finally, I conclude with discussing implications
of the findings for product development.
2 Conceptual background
2.1 Response mode effect
The classical theory of preference assumes that each individual has a well-defined preference
and it does not depend on preference elicitation method. However, the growing belief among
decision researchers is that people may construct preferences on the spot when needed, such as
when they make a choice (Bettman et al. 1998; Payne et al. 1993). In particular, studies have
shown that preferences depend on the methods used to assess, violating the assumption of
procedure invariance (Lichtenstein and Slovic 1971; Fischer and Hawkins 1993; Nowlis and
Simonson 1997; Tversky et al. 1988).
Early work in this topic area contrasted choice with bidding or matching. In Lichtenstein and
Slovic’s (1971) original demonstration, for instance, subjects were asked to indicate their
preferences between two risky options: two bets of almost equal expected value. One (P bet) has
a higher probability of winning a modest amount and the other ($ bet) has a smaller probability
of winning a large amount. When asked to choose between two bets presented together, more
subjects chose the P bet. However, when asked to bid two bets presented separately, the $ bet
received a higher bid amount. Similar findings were obtained in subsequent studies in which
preferences for two riskless options were compared between in a comparative response (e.g.,
choice) and in a non-comparative response (e.g., matching or evaluation) (Fischer and Hawkins
1993; Nowlis and Simonson 1997; Tversky et al. 1988).
Such response-based preference reversals are attributed to the difference of the way people make
decisions. According to Lichtenstein and Slovic (1971), choices are influenced by probabilities
while bids are primarily determined by winning amount because subjects in the choice task make
decisions in a non-compensatory way (compared each attribute of one bet directly with the same
attribute of the other bet), whereas subjects in the bidding task make decisions in a compensatory
way (had a starting point, amount to win, and then adjusted accordingly with probability to win).
13
Extending this argument to the riskless condition, Tversky et al. (1988) proposed prominence
effect. According to this argument, people tend to resolve the close choice with a non-
compensatory strategy in choice tasks, that is, by choosing an option that is superior on the most
important (prominent) attribute. By contrast, matching tasks typically evoke a compensatory
process in which differences on the prominent attribute are traded off against differences on
other attributes. Later, Fischer and Hawkins (1993) generalized the prominence effect from
choice versus matching to strategy-compatibility hypothesis regarding any comparison of a
qualitative and quantitative response mode. They proposed that people seek out compatibility
between the meta-property of response mode (qualitative vs. quantitative) and the meta-property
of decision strategy (ordering of attribute importance vs. making a trade-off). They showed that a
qualitative response mode (choice) was more likely than a quantitative mode (rating or pricing)
to evoke preferences for the option that is superior on the most important attribute (e.g., price).
A compensatory strategy is one in which a good value on one attribute can compensate for a
poor value on another. For instance, deciding how much one is willing to sacrifice color for very
good rather than average battery life of a mobile phone involves making an explicit trade-off
between color and battery life. An example of the compensatory decision strategies is the
weighted adding strategy (Bettman et al. 1998). It is based on the assumption that a consumer
can assess the importance of each attribute and assign a subjective value to each possible
attribute level. Consumers using the weighted adding strategy consider one option at a time,
examine each of the attributes for that option, multiplying each attribute’s subjective value times
its importance weight (e.g., multiplying the subjective value of a given color of a mobile phone
times the importance of a mobile phone’s color), sum these products across all the attributes to
obtain an overall value for each option, and finally choose the option with the highest value. In
contrast, consumers can use non-compensatory strategies in which a good value on one attribute
does not make up for a poor value on another (e.g., lexicographic in Tversky 1972). For
example, if a consumer decides to choose a mobile phone with the most preferred color, then the
mobile phone with the highest rating on color is preferred regardless of its high price or the high
rating on the battery life of another option. The compensatory strategy is often considered to be
more normatively accurate than the non-compensatory strategies though it potentially places
great demands on consumers’ working memory and computational capabilities (Frisch and
Clemen 1994).
14
Going beyond inferring strategies from expressed preferences, some empirical studies have
process evidence that choice leads to compensatory decision strategy. Hawkins (1994) tested the
prominence effect using the Mouselab computer process tracing system and demonstrated that
the response time for choice is smaller than for matching and that the relative attention (fixation
time) devoted to the prominent attribute compared to non-prominent attribute is greater in choice
than in matching. Similarly, Schkade and Johnson (1989) also reported that the pricing judgment
for gambles takes significantly longer than the choice.
In sum, preferences for the option superior on the most important attribute can be shaped by
responses; they are greater when people choose between two options presented together than
when they evaluate each option presented separately, because the former response mode evokes
non-compensatory strategies whereas the latter evokes compensatory strategies.
2.2 Question mode effect
Extending the literature on response mode effect, I propose different questions also can evoke
different strategies, which results in preference reversals. Firstly, drawing on the literature on
imagery processing, I propose that enjoyment prediction questions evoke compensatory decision
strategies. Secondly, drawing on the literature on consumption goal, I propose that compensatory
decision strategies increase preferences for the option superior on less instrumental attributes.
Two arguments are elaborated and then combined in the following three sections.
2.2.1 Decision strategy
Different responses evoke different strategies primarily because options are presented
differently; two options are presented together in a comparative response and only one option is
presented in a non-comparative response. Although the way options are physically presented is
governed by response mode, question mode can influence how consumers present them
“mentally.” If a question encourages consumers to focus on one option, they will be more likely
to utilize compensatory strategies.
I propose that enjoyment prediction questions evoke compensatory strategies because they
induce imagery processing, a conceptually distinct way of representing information that is “very
like picturing and very unlink describing” (Fodor 1981, p. 76). Imagery processing appeared in
the problem solving literature that people can visually imagine a product in use and use that
15
evoked scenario as a basis for subsequent problem solving activities (Simon and Hayes 1976). It
refers to imagining the actual experience with an alternative and assessing the desirability of the
alternative according to the affective response to this imagined experience (McGill and Anand-
Keller 1989).
There are two related reasons that imagery processing leads to compensatory strategies. Firstly, it
is characterized as “within-option processing strategies as opposed to across-option strategies”
(MacInnis and Price 1987, p. 479). Therefore, people who process information in an imagery
way, compared to those who process information verbally or non-imaginary fashion, are more
likely to consider the attributes of each option more carefully. Prior studies have demonstrated
that when options are presented in a visual form compared to a verbal form, people are more
likely to enter attribute interactions of each option into their evaluation (Holbrook and Moore
1981) and less likely to lend itself to attribute-by-attribute comparisons between options (Park
and Mittal 1985). Furthermore, imagining future consumption experiences requires limited
processing resources. When people process information about two options, resources available
for processing information about one option are reduced and, therefore, people may end up with
processing information about only one option (McInnis and Price 1987; McGill and Anand-
Keller 1989).
According to Kahneman and Snell (1990, 1992), discrepancies between decision and experience
results from one of two reasons; consumers either fail to predict accurately how much they will
enjoy the consumption of the consequences of a chosen option in the future or predict their
enjoyment relatively accurately but fail to choose based on the prediction. The former reason is
established by several bodies of psychological work on affective forecasting that people tend to
over-predict how much a future event will influence them emotionally (Gilbert et al. 2002;
Wilson and Gilbert 2003). The latter reason is well documented by the work on rule-following
decisions suggesting that people tend to discount their predicted enjoyment as they make a
decision following rules (Prelec and Herrnstein 1991). For instance, people show status-quo bias
when following the rule of “if it ain't broke, don't fix it” (Baron 1994), they continue an endeavor
once an investment is made when following the “don’t waste” rule (Arkes and Ayton 1999), or
they refuse to pay for delays even when the delays are beneficial when following the “don’t pay
for delay” rule (Amir and Ariely 2007). In the present work, I do not investigate the former
instance that people do not predict their enjoyments accurately. Rather, I examine the latter
16
instance that enjoyment prediction is relatively accurate but it is not considered when people
make a decision. This suggests that I assume that enjoyment prediction question results in
accurate prediction.
2.2.2 Instrumental attribute
Prior research on response mode effect demonstrates that non-compensatory decision strategies
favor the most important attribute (Tversky et al. 1988) or price (Fischer and Hawkins 1993;
Luce et al. 1999). This argument can be generalized that non-compensatory decision strategies
increase the weight of an attribute that serve the consumers’ purchase purpose.
In the present work, attribute instrumentality is defined as the degree to which an attribute serves
the consumers’ purchase purpose (Batra and Ahtola 1990; Ratneshwar et al. 2000). Research on
consumer attitude suggests that product evaluation is often made based on instrumental reasons.
Furthermore, research on consumption goal suggests that when an attribute appears to serve the
purchase purpose, consumers tend to consider it importantly. For instance, when consumers look
for a desk that fits into a small space, they consider size of desk. When seeking a good looking
desk, however, they consider whether a desk is mass produced or not (Ratneshwar et al. 2000).
Similarly, when consumers intend to gather information from a website, they concentrate on
what will remain as the residue after the reading. However, when they approach a website to be
entertained, they enjoy of rhythms and metaphors of the text (Schlosser 2003).
Attribute instrumentality does not always depend on attribute characteristics (e.g., performance
or aesthetic appeal). Rather, it can be determined by contextual variables which activate a
specific purchase purpose, such as product type or consumer trait. For instance, when a product
is an aesthetic product and consumed primarily for its own sake, as a product in itself, apart from
any utilitarian functions performed or tangible benefits gained through product use, its aesthetic
attribute will be more instrumental than its performance attribute.2 Alternatively, for consumers
2 Aesthetic experience takes place when a product is viewed without attention to practical or utilitarian consideration (Bullough 1912). Therefore, “nothing is truly beautiful except that which can serve for nothing;; whatever is useful is ugly” (Osborne 1968, p. 20), and that a product supposed to provide sensory pleasure serves any functional purpose is considered as a “serious defect” (Davies et al. 1999, p. 128).
17
who generally pursue sensory pleasure more strongly than practical benefits will consider
aesthetic attributes are more instrumental than performance attributes.3
Consider two attributes, the number of translated languages and color, of digital dictionary.
When a consumer buys a digital dictionary to translate multiple languages, the former attribute is
more instrumental than the latter attribute. However, when the aesthetic purpose dominates the
performance purpose in the purchase condition (e.g., a consumer purchases a dictionary to show
it off to friends or one generally considers aesthetic appeal importantly), color is a more
instrumental attribute than the number of translated languages. This example illustrates that
aesthetic appeal often belongs to a less instrumental attribute because it does not enhance
performance, but it is highly instrumental when consumers make purchase decisions for sensory
pleasure.
2.2.3 Question, decision strategy, and instrumental attribute
Two arguments elaborated in the previous sections lead me to hypothesize question mode effect;
preferences for the option superior on less instrumental attributes are greater when consumers are
asked to predict enjoyment than when asked to make choices.
Choice questions will lead consumers to avoid making trade-offs and such avoidance can be
accomplished by using non-compensatory strategies. These strategies minimize confronting the
possibility that one attribute must be sacrificed to gain on another, and place heavy weight on
highly instrumental attributes and ignore less instrumental attributes. In the present work, these
strategies are called score-based decision strategies to represent consumers’ tendency to
construct preferences in order to maximize purchase purpose. By contrast, enjoyment prediction
questions will lead consumers to make a trade-off by utilizing compensatory strategies. These
strategies assure that less instrumental attributes receive some weight. In the present work, these
strategies are called usage-based decision strategies to represent consumers’ tendency to
construct preferences based on their imagined usage of an option.
3 Research on consumption goals indicates that life themes and values guide consumers to seek which types of benefits. Studies show that consumers evaluate fashion design differently depending on their gender and their tendency to visualize and verbalize (Holbrook 1986), and consumers have different levels of significance that visual aesthetics hold in their relationships with products (Bloch et al. 2003).
18
The proposed question mode effect is supported by some recent studies (Hsee et al. 2003; Hsee
et al. 2009; Shiv and Huber 2000). For example, Hsee et al. (2003) in a study compared purchase
decision (choice) and enjoyment prediction between a pair of TVs; one has a significantly better
sound quality and the other has a marginally better picture quality. When asked to predict which
option they would enjoy more when using it, 76% of the participants chose the TV with much
better sound quality. However, it was preferred by 55% when subjects were asked to make a
choice as participants placed greater weight on picture quality (as opposed to making trade-offs
between sound quality and picture quality) under the condition of choice. Hsee et al. (2009) also
found in a study that preferences for the mobile phone with a more vivid screen are greater when
asked to indicate how much they like than when asked to choose. Shiv and Huber (2000)
obtained a similar finding from a study comparing choice with anticipated satisfaction between a
pair of computers; one is cheaper and the other has a built-in power protection feature. When
asked to make a choice, only 50% of the subjects chose the computer with the power protection
feature. However, when subjects were asked to choose an option after anticipating satisfaction,
the percentage of those who selected the same option went up to 80%. All of these findings share
with my proposition a focus on the effect of questions on preferences in the comparative
response mode; choice questions increase preferences for the option superior on an attribute that
serves the purchase purpose to a greater extent (e.g., picture quality of TV, screen size of mobile
phone, and price of computer), whereas enjoyment prediction questions (e.g., liking or
anticipating satisfaction) increase preferences for an option superior on an attribute that serves a
purchase purpose to a little extent (e.g., sound quality of TV, screen vividness of mobile phone,
and power protection of computer). We add to their findings by identifying decision strategy as
an underlying mechanism and specifying that attributes weighted in different strategies. Formally
speaking,
Hypothesis 1: Likelihood of preferring a product superior on a less instrumental attribute is
greater when consumers are asked to predict enjoyment than when asked to make choices.
2.3 Attribute evaluability Making a trade-off requires calculating an exchange rate between attribute values. When the
exchange rate is difficult to calculate, consumers avoid making a trade-off, leading to non-
compensatory decision strategies (Dick et al. 1990; Jacoby et al. 1994; Johnson and Meyer 1984;
19
Olshavsky 1979; Payne et al. 1988; Simonson and Tversky 1992). I propose that attribute
evaluability can determine the ease of calculating the exchange rate.
Attribute Evaluability refers to the degree to which one’s subjective evaluation is responsive to
objective variations in value of an attribute (Hsee 1996). While evaluability depends on
numerous factors including evaluation mode and attribute knowledge (Hsee and Zhang 2010),
two aspects of attribute nature are discussed in the present work: measurability and objectivity.
Measurability is the degree to which consumers assign a quantitative value to a given value of an
attribute easily. The more difficult it is to assign a score, the less measurable (and less evaluable)
the attribute is. Objectivity is the degree to which consumers interpret a given value of an
attribute unambiguously. If consumers perceive there is a lot of variance across consumers in
interpreting a given value, the less objective (and less evaluable) the attribute is. Note that
measurability has to do with attribute value and objectivity has to do with attribute nature; any
value of any attribute can be quantified but some attributes are by nature more objective than
others. In general, performance features (e.g., memory size, waterproof, or display size) are more
objective than aesthetic appeal (e.g., color, shape, or resolution). For those less objective
attributes, even if scores are assigned to their values, they are likely to be less objective unless a
standard measurement scale is developed by experts and widely used (Hsee and Tsai 2009).
Consider, again, the number of translated languages and color of digital dictionary. The number
of translated languages is a quantified and unambiguous attribute. However, consumers have
difficulty in assigning a score to a given color and they may have different preferences for the
same color, suggesting that the number of translated languages is easier to evaluate than color.
Prior studies have shown that people tend to evaluate an option superior on easy-to-evaluate
attributes more highly than an option superior on hard-to-evaluate attributes (Bazerman et al.
1999; Hsee 1996; Hsee and Zhang 2010). Findings are generally interpreted that attribute
evaluability determines how much people place weight on an attribute while they evaluate
multiple options; the easier an attribute is to be evaluated, the more heavily it is weighted. This
implies that easy-to-evaluate attributes are entered into exchange-rate calculation, whereas hard-
to-evaluate attributes are not. Therefore, when attributes are hard to evaluate, consumers avoid
making a trade-off and are more likely to utilize non-compensatory strategies than when
attributes are easy to evaluate. Formally speaking,
20
Hypothesis 2a: When attributes are easy to evaluate, likelihood of preferring a product superior
on a less instrumental attribute is greater when consumers are asked to predict enjoyment than
when asked to make choices.
Hypothesis 2b: When attributes are hard to evaluate, likelihood of preferring a product superior
on a less instrumental attribute is same when consumers are asked to predict enjoyment as when
asked to make choices.
In sum, I propose that different questions evoke different decision strategies, which in turn
results in different preferences. When asked to predict which option they will enjoy, consumers
utilize compensatory decision strategies, which in turn prefer an option superior on less
instrumental attributes. However, this question mode effect will disappear when attributes are
hard to evaluate. In the next section, I present four studies testing two hypotheses.
Question
Preference for the option
superior on a less instumental
attribute
Decision strategy
Attribute evaluability
Figure 3 RESEARCH FRAMEWORK
21
3 Empirical test I present four studies that tested my hypotheses. The first three studies tested hypothesis 1 by
measuring or manipulating different constructs which affect attribute instrumentality: product
type in study 1, consumer trait in study 2, and purchase purpose in study 3. The last study tested
hypothesis 2. In all the studies, the respondents were asked to indicate their preferences between
a pair of options which involve a trade-off between two attributes. Preferences for the option
superior on a less instrumental attribute were compared between two questions: choice and
enjoyment prediction. These studies tapped different products and attributes. Table 4 summarizes
them.
Study Product Attribute 1 Attribute 2
1
Smart phones
Memory size (16GB vs. 8GB)
Color (Black vs. Silver)
Mouse pads
Adhesive on the back (Yes vs. No)
Drawing on the front (Yes vs. No)
2
Digital
dictionaries
Number of translated languages (5 vs. 2)
Color (White vs. Grey)
3
Digital cameras
Waterproof (Yes vs. No)
Shape (Square vs. Round)
4
E-book readers
Display size (9.7 vs. 6 inch diagonal)
Display resolution (960x640 vs. 480x320 pixels)
Table 1 OVERVIEW OF STUDIES
3.1 Study 1: Smart phones and mouse pads
3.1.1 Objectives
Study 1 was designed to test hypothesis 1 using two products. One is a product often serves
consumers’ performance purpose and the other is a product providing sensory pleasure.
22
3.1.2 Stimuli and procedure
A smart phone and a mouse pad were selected for two products. An intuition is that consumers
tend to consider performance features importantly for a smart phone, such as memory size,
because they generally want to download, store, and run various applications. However, for a
mouse pad, consumers usually place it on a desk (like hanging a picture on a wall) and therefore
consider its aesthetic appeal importantly. This suggests that performance attributes are more
likely to be highly instrumental for the former product but they can be less instrumental for the
latter product.
For a smart phone, memory size (16GB vs. 8GB) was chosen for a performance attribute and
color (black vs. silver) for an aesthetic attribute. A performance attribute of a mouse pad was
repositionable adhesive on the back (yes vs. no) and an aesthetic attribute was drawing on the
front (yes vs. no). Therefore, two options of a smart phone are equipped with the same processor
and the same camera, and priced similar, but one is black with an 8GB memory and the other is
silver with a 16 GB memory. Similarly, two options of a mouse pad have an identical size and
are priced similar, but one has a drawing on the front without an adhesive on the back and the
other has an adhesive on the back without a drawing on the front.
A pre-test was conducted to test the type of the two products and to find the relative value of the
aesthetic attributes: color for a smart phone and a drawing for a mouse pad. Twenty four
undergraduate students were asked to indicate, firstly, how much they agree with the two
sentences borrowed from the prior literature on product aesthetics (Davies et al. 1999; Bloch et al.
2003) on a 7 point Likert-scale (1 = not at all vs. 7 = very much); (1) Smart phones (mouse pads)
are supposed to provide sensory pleasure and, when they serve any performance purposes, they
are serious defects and (2) a design of the smart phones (mouse pads) is a source of pleasure.
Secondly, they indicated how much each option appeals aesthetically on a 7 point Likert-scale (1
= not at all vs. 7 = very much). Data show that they agreed with the first sentence more strongly
when the products are mouse pads (5.96) than smart phones (4.83, t(23) = 3.15, p < .01) and that
they also showed greater agreement with the second sentence for mouse pads (4.88) than for
smart phones (3.71, t(23) = 2.53, p < .05), indicating that mouse pads are more likely to be
aesthetic products than smart phones. Findings suggest that adhesive on the back (performance
attribute) is less instrumental than drawing on the front (aesthetic attribute) for mouse pads,
23
whereas color (aesthetic attribute) is less instrumental than memory size (performance attribute)
for smart phones. Furthermore, they indicated that the black smart phone (4.83) appealed more
than the silver smart phone (3.71, paired sample t-test = 1.62, t(23) = 1.96, p < .10) and the
mouse pad with a drawing on the front (5.96) appealed more than the mouse pad without a
Figure 10 PREFERENCE AS A FUNCTION OF QUESTION MODE AND ATTRIBUTE EVALUABILITY
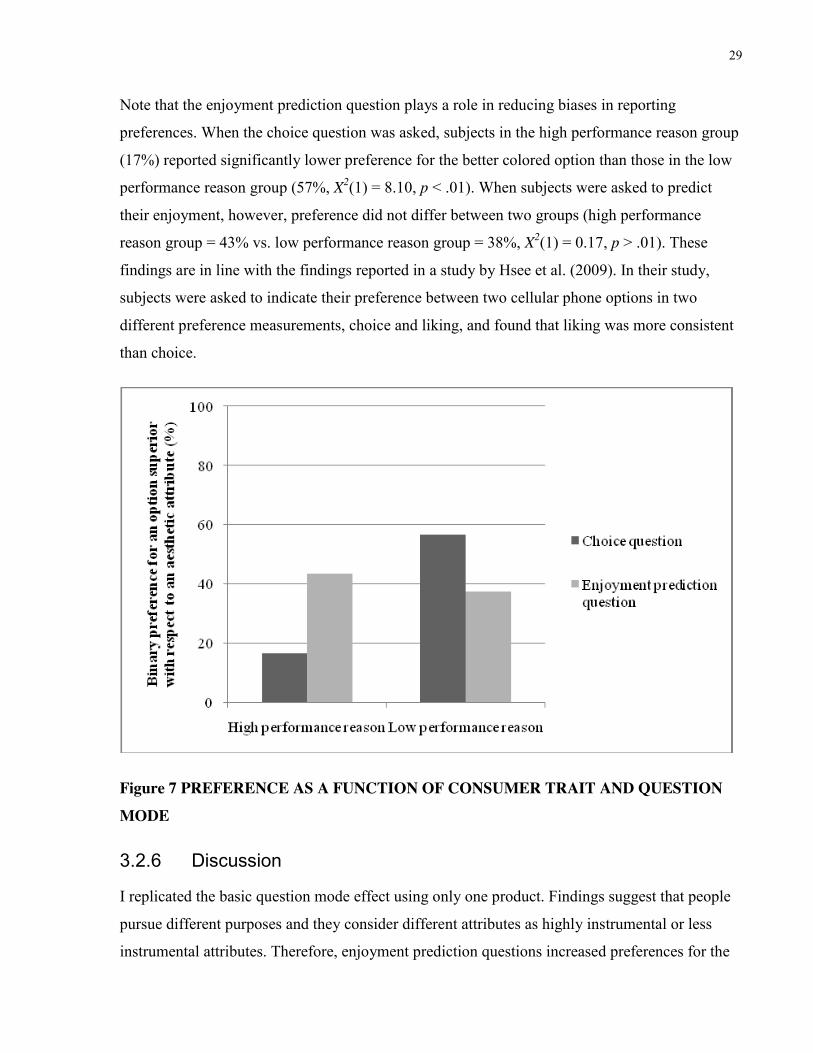
3.4.6 Discussion
This study produced two key findings. First, I replicated the basic question effect in the condition
which attributes are easy to evaluate. Second, I demonstrated that attribute evaluability
moderated the question mode effect; enjoyment prediction questions failed to increase
preferences for the option superior on a less instrumental attribute when attributes are hard-to-
evaluate. Findings support the hypothesis that attribute evaluability determines consumers’
decision strategy selection in the enjoyment prediction condition, eliminating the proposed
question mode effect.
37
4 General discussion Four studies tested question mode effect and its boundary condition. The first three studies
demonstrated that asking enjoyment prediction questions increase preferences for the option
superior on a less instrumental attribute, an attribute inconsistent with product type (study 1), an
attribute inconsistent with consumer trait (study 2), or an attribute inconsistent with purchase
purpose (study 3). The last study showed that question mode effect disappears when attributes
are hard to evaluate. Findings contribute to decision strategy selection and conjoint analysis.
4.1 Contributions to decision strategy selection
Firstly, the present work adds to the literature on discrepancies between choice and various types
of preference. Prior work suggests that choice leads people to rationalize their decision and
choose an option superior on easy-to-justify attributes. It results in biased choices when people
do not carefully analyze attributes of an option (Shafir et al. 1993) or the chosen option does not
maximize their own interests (Amir and Ariely 2008). This work shows that choice decreases
people’s tendency to make trade-offs, increasing the weight of a purpose-serving attribute,
suggesting that decision strategy selection is an underlying mechanism of discrepancies between
choice and preference.
Secondly, it adds to the literature on decision strategy selection. A significant body of research
finds evidence of the utilization of non-compensatory decision strategies (Payne et al. 1993),
examines when simpler decision heuristics are utilized (Simonson and Tversky 1992; Luce et al.
1999), and investigates how compensatory decision strategies are encouraged (Drolet and Luce
2004; Cox and Grether 1996). In particular, as the number of options being offered increases and
Web-based search tools are available, consumers often sort products on key attributes and screen
them for inclusion in their consideration sets. As a result, firms want to know when and how
consumers use a non-compensatory decision strategy to screen products. For instance, about 300
make-model combinations of automobiles are available and 62% of automobile purchasers
search online (J.D. Power 2002), General Motors considers its greatest design challenge in the
2000s to be the ability to design products that customers will consider (Urban and Hauser 2004).
While there has been extensive consumer research (Bettman et al. 1998) and econometric
research on decision strategy (Gilbride and Allenby 2004), only recently have researchers begun
to study the impact of non-compensatory decision strategies as they relate to the identification of
38
opportunities in product development. This work clarifies must-have attributes, identifies why
they get a product into consumers’ consideration set, and how to help them make decisions in a
compensatory fashion.
4.2 Contributions to conjoint analysis
Firstly, the present work adds to the consumer research on conjoint analysis. Because marketers
often use conjoint analysis to test products for successful product development, consumer
researchers study contextual variables which can influence the reported part-worth utilities of
product attributes. Examples include response mode and profile presentation (Green and
Srinivasan 1978, 1990). Studies have found that, for example, when responses are measured by a
comparative choice scale, price is weighted more heavily than other attributes than when
responses are measured by a non-comparative likelihood-of-purchase scale. It has been also
found that consumers place more weight on “stylistic” attributes or attribute interactions when
profiles are presented in pictorial or three-dimensional model forms than when they are
presented verbally (Holbrook and Moore 1981). Adding to this line of research, I show that what
questions being asked has a considerable effect in identifying part-worth utilities of product
attributes. More importantly, it is in line with the prescriptive approach toward product test
(Hoeffler 2003; Luo et al. 2008). Hoeffler (2003), for instance, suggested that marketers would
predict consumers’ preferences for really new products more accurately by incorporating mental
simulations and analogies and decreasing consumers’ uncertainty between attributes and their
benefit. Luo et al. (2008) claimed that product designers would obtain more accurate predictions
of consumers’ preferences when consumer’s perceptions of the subjective characteristics (e.g.,
ease of use of power tool) are included in attribute-based product test.
Secondly, more broadly speaking, the present work has implications for market research. While
market research is an essential stage in developing products (Hauser et al. 2006; Wind and
Mahajan 1997), the validity of market research is often called into question. Some researchers
claim that technological push matters more than market pull or customer insight (Hamel and
Prahalad 1994) and marketers often develop products without conducting market research. For
instance, designers at Bang and Olufsen, Herman Miller, and Allessi either avoid market
research or ignore market research data, following their own way in finding new product ideas
(Verganti 2006). Findings from the present work are in line with this argument that when asked
39
to make a choice, consumers emphasize the attributes that serve their purchase purpose, which in
turn results in biased data.
4.3 Limitations and future research Although the present work contributes to the decision-making research and provides practical
implications for conjoint analysis, it certainly has several limitations that need to be further
examined.
Firstly, the proposed question mode effect appears only when highly instrumental attributes are
not aligned with the predictors of enjoyment. When highly instrumental attributes are important
in predicting enjoyment, changing the choice question with the enjoyment prediction question
may not result in preference reversals. Imagine that there are two financial advisors; one
produces a better performance but has less time with clients and the other produces worse
performance but less busy (more time with client). In this case, performance is not only more
instrumental but also predicts enjoyment better than time with client. Therefore, consumers will
be more likely to choose and, at the same time, predict greater enjoyment from the better
performing, busier financial advisor than the other. In the future research, alignment between
attribute instrumentality and enjoyment prediction should be further examined in order to specify
a boundary condition of the question mode effect.
Secondly, findings from the four studies do not clarify the underlying mechanism of the question
mode effect. Although selecting different decision strategies in different questions are proposed
to affect preference, preference can be determined by changing of attribute weighting in different
questions; consumers may place greater (less) weight on highly (less) instrumental attributes in
the choice question than in the enjoyment prediction question (see other attribute weighting
accounts in Hsee et al. 2003; Shiv and Huber 2000). In the future research, the decision strategy
account needs to be further tested by employing the experimental methods such as protocol,
response time, direct test, or cognitive load. Firstly, consumers’ descriptions of the processes by
which they develop the preferences and their perceptions of these processes can provide insights
into the selection of decision strategy (Coupey et al. 1994). Secondly, consumers’ response time
indirectly supports the decision strategy account (Hawkins 1994; Schkade and Johnson 1989).
For example, Schkade and Johnson (1989) reported that pricing judgments take significantly
longer than choices for gambles and Hawkins (1994) showed that the response time for matching
40
is greater than for choice. Thirdly, a carefully designed study directly tests whether consumers
actually make a trade-off when responding to a choice question. For example, in a study
conducted by Luce (1999), each subject makes a series of choices, assessing relative preference
for the high quality alternative at a variety of prices for that alternative. These prices are
determined by the subject’s previous trade-off for that task. This prior trade-off price is assigned
to price level 3; level 1 and 2 are less than the trade-off value and level 4 and 5 are greater than
it. Thus, for level 1, 2, 4, and 5, she predicted the choice that each subject would make if he or
she recalculated the trade-off during choice exactly as he or she did during matching. Finally, a
study employing cognitive load tests whether consumers are less likely to make a trade-off when
they are under cognitive load even when the prediction question encourages them to do so.
The present work provides practical implications for concept testing by offering an economical
and easy way to improve conjoint analysis: changing the question. In the future research, it needs
to be tested whether changing the question is more effective than employing other methods such
as using the non-comparative response mode or changing the context of conjoint studies.
Furthermore, whether the enjoyment prediction question always captures consumer preference
better than other questions needs to be examined because my findings cannot speak to the
situations in which consumers judge future consumption experience poorly (Kahneman and Snell
1992; Wilson and Gilbert 2003).
41
Chapter 3
5 Introduction Imagine that marketers try to identify which color consumers prefer for a newly developed
computer. Suppose that marketers are not aware of consumers’ color preferences for the
computer but they know that consumers prefer silver for digital electronics but they prefer black
for home accessories. Which color do marketers choose for the computer? In other words, how
do marketers use information to make a prediction?
Such a question has been much discussed in decision-making literature. Research generally
indicates that even when information is not biased, people often make biased predictions because
the way they make predictions is biased. For instance, they sometimes discount or ignore highly
diagnostic4 information such as base rate (Kahneman and Tversky 1973) or false alarm rate
(Doherty et al. 1979). Alternatively, they sometimes place too much weight on less diagnostic
information (Klayman and Brown 1993; Shah and Oppenheimer 2007) or even non-diagnostic
information (Meyvis and Janiszewski 2002; Simonson et al. 1994; Zukier and Jennings 1983).
The present work applies a framework of literature from decision making to a market research
context, to investigate the effect of marketers’ prediction strategy on their prediction accuracy. In
particular, I build on categorization research and argue that their conventional prediction strategy
results in biased predictions. I build on Multiple Cue Probability Learning (MCPL) research and
propose that marketers adopt an alternative prediction strategy in order to increase their
prediction accuracy. This is because the alternative prediction strategy enables marketers to find
4 Information diagnosticity refers to how useful information is for a task. While it can be understood in many ways (e.g., reduction in uncertainty or improvement in probability of making a correct decision), a widely used conceptualization of diagnosticity is Weight Of Evidence (WOE) suggested by Good (1950, 1975, 1983). According to this approach, information increases its diagnosticity when it supports a focal hypothesis or negating an alternative hypothesis. Thus, diagnosticity is often measured by the likelihood ratio between hit rate and false-alarm rate. Since Good’s WOE is theoretically defensible and experimentally testable, subsequent work adopting WOE can test whether people identify and use diagnostic information normatively when making predictions (Doherty et al. 1996; Fischoff and Beyth-Marom 1983; Slowiazek et al. 1992).
42
and use diagnostic information regardless of whether two rules—an implicit rule of
categorization (perceived diagnosticity of consumer preference data inferring from categorical
similarity) and a target rule of data (actual diagnosticity of consumer preference data)—are
congruent or not. Going beyond comparing two prediction strategies, I explore whether
marketers utilizing the alternative prediction strategy can further increase their prediction
accuracy when information has multiple sets rather than a single set.
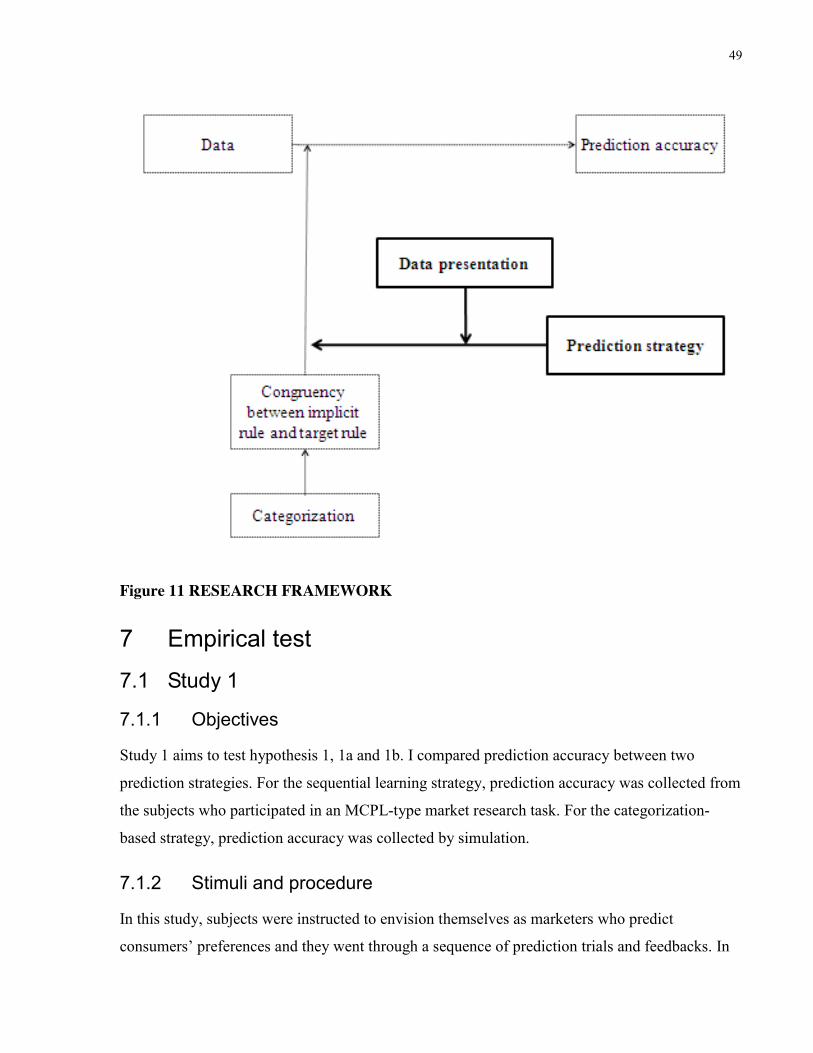
The present work contributes to MCPL and market research. Firstly, it tests sequential learning
strategy in a new context and suggests that breaking down information into multiple sets
improves learning. A significant body of research on MCPL examines whether and when
sequential learning strategy (making predictions multiple times and receiving feedback for each
prediction) leads to accurate predictions. Numerous studies have shown that sequential learning
strategy can increase prediction accuracy (Meyer 1987; West et al. 1996) but its effect depends
on contextual variables such as noise in environment, relationships among cues, number of
predictions, type and timeliness of feedback, and world knowledge prompted by cue labels, to
name a few (Adelman 1981; Aniezek 1986; Hogarth et al. 1991; Karelaia and Hogarth 2008;
Klayman 1984, 1988; Stewart and Rusk 1994).
Secondly, the present work provides implications for market research by demonstrating that
marketers often make inaccurate predictions and can increase prediction accuracy by selecting an
alternative prediction strategy. On the topic of market research, considerable attention has been
paid to develop new methods (Arnould and Wallendorf 1994; Griffin and Hauser 1993; Urban
and Hauser 2004; Zaltman 1997). However, little is known about whether marketers make
accurate predictions and what other prediction strategies are available for them. Such discussions
have been made in the engineering context (House of Quality in Hauser and Clausing 1988) and
in the management context (Decision Support Systems in Hoch and Schkade 1996) but not in the
market research context.
5.1 Current practice of preference learning Marketers often collect consumers’ preference information for multiple products in order to
predict their preferences for a target product. For instance, when Lenovo developed a desktop
computer for Chinese consumers, Ziba designers surveyed the color preference of Chinese
computer users for various products including digital electronics and home accessories (Business
43
Week 2005). When Mayo Clinic attempted to improve its services, IDEO designers observed not
only patients in the hospital but also people in public spaces such as subway stations, theaters,
and shopping malls (Kelley 2001). When Harley-Davidson aimed to serve its rider communities
better, designers from Jump Associates studied communities of similar firms such as Disney as
well as its own communities (Patnaik and Mortenstein 2009).
Although it has not been studied yet, marketers appear to consider information more importantly
when the information is categorically similar with the prediction target. For instance, Ziba
designers found that Chinese computer users like silver for digital electronics and they selected
silver for their new computer (Business Week 2005). While it is not clarified, patients in the
hospital might have been considered more importantly than people in the public spaces, and
communities of Harley-Davidson might have studied more carefully than communities of Disney.
The rest of the article is organized as follows. Firstly, literature on categorization and literature
on Multiple Cue Probability Learning (MCPL) are reviewed to offer the first hypothesis.
Secondly, in the literature on inference type, evidence are collected to propose that information
broken down into multiple sets benefit learning compared to information with a single set. Next,
two empirical studies testing two hypotheses are reported. Previewed briefly, studies are
demonstrating that, firstly, prediction accuracy of the sequential learning strategy is greater than
that of categorization-based strategy and that, secondly, prediction accuracy of the sequential
learning strategy is greater when information has multiple sets than when it has a single set.
Implications of the findings for MCPL and market research are discussed in the final section.
6 Conceptual background
6.1 Categorization-based strategy
Psychologists have long suggested that categorization shapes the way people make predictions
using information, suggesting that marketers utilize categorization-based prediction strategy and
tend to judge diagnosticity based on categorical similarity. Studies have shown that when people
make an educated guess in the face of limited knowledge, they tend to use categorical similarity
as a vehicle to transfer information between information and a prediction target (Aaker and
Keller 1990; Medin et al. 1993; Osherson et al. 1990). For instance, Rips (1975) demonstrated in
a classic study that when subjects were informed about an unknown disease in rabbits, they
44
predicted that the same disease would be more likely to be found in dogs than in bears. Similarly,
when consumers evaluate a newly extended brand, they draw on their own evaluations of the
original brand only when the extended brand is categorically similar with the original brand
(Aaker and Keller 1990). Emphasizing categorical similarity as a fundamental prediction
strategy, some researchers even argued that people tend to make similarity claims vaguely (e.g.,
X and Y are similar) rather than specifically (e.g., X and Y are similar in terms of A, B, and C)
because they expect to find undiscovered information common between them (Medin and Ortony
1989).
Although marketers make predictions based on categorization, consumer research suggests that it
is risky to assume that preferences are consistent with overall categorical similarity (Shocker et
al. 1990). For instance, consumers’ toy preferences are not related with the way they categorize
toys. Their soft drink preferences also differ from how, they believe, the soft drink market is
categorized (Shocker et al. 1990). Findings imply that when marketers utilize the categorization-
based strategy, their prediction accuracy will depend on the consistency between two rules, an
implicit rule of categorization (perceived diagnosticity of consumer preferences inferring from
categorical similarity) and a target rule of data (actual diagnosticity of consumer preferences).
When the two rules are consistent, predictions are accurate. However, when the two rules are
inconsistent, predictions are biased (Hogarth 1981).
Premise: Prediction accuracy of the categorization-based strategy is greater when the two rules—
an implicit rule of categorization and a target rule of data—are congruent than when not.
6.2 Sequential learning strategy Multiple Cue Probability Learning (MCPL) is a research paradigm about whether and how
people learn identifying and using multiple cues with probabilistic relationships as they utilize
sequential learning strategy (i.e., make predictions and receive feedback) (Goldstein 2004). It is
based on Brunswik’s Lens Model (1955) that people’s prediction and the target being predicted
are two separate functions of cues available in the environment, and the accuracy of people’s
prediction depends on the extent to which the function describing the people’s prediction
matches its environmental counterpart or ecology (Stewart and Lusk 1994). A significant body of
studies has shown that when doctors diagnose diseases, interviewers assess job candidates, or
consumers evaluate multi-attribute products, sequential learning strategy leads to accurate
45
predictions because it enables people to identify and use diagnostic cues (Klayman 1984; Meyer
1987; West et al. 1996). These findings suggest that marketers can make predictions more
accurately when they utilize the sequential learning strategy rather than the categorization-based
strategy.
In particular, the sequential learning strategy will benefit marketers when the two rules, an
implicit rule of categorization and a target rule of data, are not congruent. This argument is
supported by the findings that the prediction accuracy based on the sequential learning strategy is
not influenced by cue labels (Adelman 1981; Sniezek 1986) or preference similarity between
agent and target (West 1996). For instance, Adelman (1981) tested whether subjects predicted
GPA scores more accurately when the scores are positively related with academic achievement
than when negatively related. Later, Sniezek (1986) tested whether subjects predicted college
math GPA scores more accurate when the scores are positively related with high school math
GPA scores than when positively related with high school English GPA scores. Two studies
commonly showed that prediction accuracy is not influenced by cue labels. When the world
knowledge prompted by cue labels accounted for the data (e.g., positive relationship between
GPA scores and academic achievement or positive relationships between college math GPA
scores and high school math GPA scores), subjects made predictions accurately from the initial
prediction trials. However, when the world knowledge prompted by cue labels is not consistent
with the data, subjects reinterpreted cue labels to agree with the data and increase their prediction
accuracy (“if what makes sense does not work, make sense out of what does work” in Sniezek
1986). Similarly, West (1996) demonstrated that subjects initially predicted others’ preferences
by projecting their own preferences. Therefore, subjects who had similar preferences with the
target showed greater prediction accuracy than those who did not. However, when they were
provided with feedback, preference similarity between agents and targets showed no effect on
prediction accuracy. These findings suggest that when two rules—an implicit rule of
categorization (the world knowledge prompted by cue labels) and a target rule of data—are
inconsistent, the sequential learning strategy eliminates the effect of rule congruency on
prediction accuracy by enabling marketers to discard the incorrect implicit rule and learn the
correct target rule.
This argument is illustrated by an example that compares categorization-based strategy and
sequential learning strategy. Suppose, again, that marketers predict consumers’ color preferences
46
for a computer and they are informed that consumers prefer silver for digital electronics and
black for home accessories. When marketers employ the categorization-based strategy, they will
choose silver for the computer, the color that consumers prefer for digital electronics because the
computer is categorically similar with digital electronics. In this case, their prediction accuracy
depends on whether consumers’ color preference is consistent with categorical similarity.
Alternatively, when marketers utilize the sequential learning strategy, they will choose a color
for the computer based on diagnosticity. They will choose silver if preferences for digital
electronics are more diagnostic than those for home accessories, but they choose black if the
relative diagnosticity is opposite. Formally speaking,
Hypothesis 1: Prediction accuracy is greater when the sequential learning strategy is utilized
than when the categorization-based strategy is utilized.
Hypothesis 1a: When the two rules—an implicit rule of categorization and a target rule of
data—are incongruent, prediction accuracy is greater when the sequential learning strategy is
utilized than when the categorization-based strategy is utilized.
Hypothesis 1b: When the two rules—an implicit rule of categorization and a target rule of
data—are congruent, prediction accuracy is same when the sequential learning strategy is
utilized as when the categorization-based strategy is utilized.
6.3 Data presentation
Research on MCPL indicates that the effect of sequential learning strategy on prediction
accuracy depends on various contextual variables such as noise in environment, relationships
among cues, number of predictions, type and timeliness of feedback, and clarity of rewards, to
name a few (Karelaia and Hogarth 2008; Klayman 1988; Stewart and Rusk 1994). In the present
work, I propose that when information is provided in different ways, the effectiveness of
sequential learning strategy differs. In particular, when the information has multiple sets,
marketers utilizing the sequential learning strategy can make predictions more accurately than
when the information has a single set.
This is supported by the research comparing two types of learning, classification learning and
inference learning, about coherent and abstract categories (Erickson et al. 2005; Rehder and Ross
47
2001). According to this research framework, in the classification learning, people are provided
with items and asked to classify them, whereas in the inference learning, people are provided
with pre-classified items and asked to infer each category. Then, whether and how they form
coherent (i.e., making sense in light of prior knowledge) and abstract (i.e., being independent of
any fixed set of features or stimulus dimensions) categories successfully. Studies have found that
people engaged in classification learning often do not understand the underlying coherence or
fundamental similarity between items through which people induce abstract categories. However,
people engaged in inference learning usually achieve this outcome. Researchers attribute these
findings to learning about different information; classifying acquires between-category
information, whereas inference obtains within-category information (Markman and Ross 2003;
Yamauchi and Markman 1998).
For example, different instances of stealing have different observable features, and yet the
relationship among these features remains the same within each instance of the concept—a thief
takes some type of property from some property owners. When people are provided with a single
set of data, they try to classify items, leading them to focus on differences among instances (e.g.,
the thief and property owner can be any different individuals or groups, and the property can be a
diamond ring, a book, or an animal). However, when items are provided in pre-classified
multiple sets, people try to infer each category, leading them to focus on relationships among
items and obtain better understanding about each category.
As people understand the underlying coherences of categories better when engaged in inference
learning than when engaged in categorization learning, marketers learn the relationships between
consumers’ preferences for one product with for other products better when the information is
provided as multiple, pre-classified sets than when it is provided as a single set. Note that
marketers often collect large amount of data and categorize them into several groups according
to, for instance, product category (e.g., whether consumer preferences are about digital
electronics or home accessories), consumer trait (e.g., whether consumers are male or female), or
research tool (e.g., whether consumer preferences are collected by interview or observation).
Then, they analyze each group of data separately to find an underlying mechanism of preferences
for each category. When designers analyze market research data, they often break down a large
amount of data into several groups. For instance, when they analyze qualitative data such as
consumer needs written on the sticky notes, video-taped behavior, or audio-taped interview
48
materials, they tend to use the divide-and-conquer strategy in order to identify “insights” or
deep-rooted causes for unarticulated consumer needs or consumers’ habitual behavior. Therefore,
they often categorize the collected data into several groups according to, for instance, product
category (e.g., whether consumer preferences are about digital electronics or home accessories),
consumer trait (e.g., whether consumers are male or female), or research tool (e.g., whether
consumer preferences are collected by interview or observation). Then, they analyze each group
of data rather separately to find an underlying mechanism of preferences for each category.
Although the current practice of the way designers analyze data may improve the performance of
their learning of the consumer preference, it has been little studied in the context of MCPL.
Formally speaking,
Hypothesis 2: Prediction accuracy based on the sequential learning strategy is greater when the
information has multiple sets than when it has a single set.
In sum, when marketers predict consumers’ preferences for a target product, they often use the
categorization-based strategy; they consider preferences based on categorical similarity with the
target product. It can result in biased predictions when two rules—an implicit rule of
categorization and a target rule of data—are inconsistent. When marketers utilize the sequential
learning strategy and make prediction trials and receive feedback, they will make predictions
more accurately because the effect of rule congruency on prediction accuracy is eliminated.
Besides, marketers utilizing the sequential learning strategy can further increase their prediction
accuracy when consumers’ preferences are presented in multiple sets; they learn the relationships
of the consumer preferences between products. I now turn to the two studies in which an MCPL
experiment was applied to a typical market research.
49
Figure 11 RESEARCH FRAMEWORK
7 Empirical test
7.1 Study 1
7.1.1 Objectives
Study 1 aims to test hypothesis 1, 1a and 1b. I compared prediction accuracy between two
prediction strategies. For the sequential learning strategy, prediction accuracy was collected from
the subjects who participated in an MCPL-type market research task. For the categorization-
based strategy, prediction accuracy was collected by simulation.
7.1.2 Stimuli and procedure
In this study, subjects were instructed to envision themselves as marketers who predict
consumers’ preferences and they went through a sequence of prediction trials and feedbacks. In
50
order to employ the sequential learning strategy, I applied a typical MCPL study to a market
research task. In total, they made prediction trials about 69 hypothetical consumers. In each
prediction trial, they went through three stages; they (1) were provided with a preference profile
indicating which color a consumer prefers for the three electronic products and the three home
accessories, (2) predicted which color the consumer prefers for a digital photo frame, and finally
(3) received feedback about which color the consumer actually prefers for a digital photo frame.
Preference profiles about the 69 hypothetical consumers were simulated. Firstly, I distributed
two colors, silver and black, randomly to six products to create a 64 preference profiles (26=64).
Next, I randomized the order of the 64 preference profiles. Finally, I repeated the initial 5
preference profiles at the end of the 64 preference profiles, having a set of 69 preference profiles.
Each profile indicates the color preferences for six products about one consumer and it was
reproduced as a graphic image of six sticky notes.
Three points are worth mentioning in this study. Firstly, digital photo frame was selected for the
target product because it can be either an electronic product or a home accessory. The ambiguity
of the category of the digital photo frame allowed me to manipulate the way consumers
categorize it and test the effect of an implicit rule of categorization (combined with a target rule
of data) on prediction accuracy. Secondly, the binary response (black vs. silver) was employed to
simplify the study. Two most popular colors for both electronic products and home accessories
were selected in order to avoid the effect of color preference. Finally, three products were
selected for each product category because odd cues were needed for each product category to
simulate predictions based on the categorization-based strategy (See Data Collection for more
detailed discussion). I conducted a series of pilot tests to have six products which are
unambiguously categorized into two categories; MP3 player, mobile phone, and digital camera
for electronic products and magazine rack, vase, and wall mirror for home accessories. While
testing products, TV, candle holder, and table lamp were eliminated.
51
Figure 12 SCREEN SHOT
7.1.3 Design
The study consisted of a 2 (category of the target product: electronic vs. home) x 2 (target rule of
data: electronic vs. home) between-subjects design.
Firstly, the category of a target product was manipulated by emphasizing different attributes of
digital photo frame. This is inspired by the previous studies demonstrating that people tend to
categorize an identical product differently depending on which attributes are emphasized
(MacInnis et al.1992; Medin et al. 1993; Medin et al. 1997; Murphy and Ross 1999). Subjects in
the electronic category condition read the electronic attributes of digital photo frame (“digital
photo frames support JPEG and BMP photo formats, are manufactured by companies such as
Polaroid and Kodak, and attract attentions with slide show features”). In the home category
condition, subjects read the home decoration attributes of digital photo frame (“digital photo
frames are placed on a table top or hung on a wall, are available in shops such as Pottery Barn,
and attract attentions by filling up empty space with photos”).
52
A pilot study was conducted in order to check category manipulations. In total, 48 undergraduate
students read one of the two descriptions about digital photo frames and indicated how similar a
digital photo frame is with the six products including three electronic products and three home
accessories on a 7-point Likert scale. Subjects who read the description about electronic
attributes of the digital photo frame indicated that it is more similar with three electronic
products (4.40) than the three home accessories (2.70, F(1,45) = 22.23, p < .01). Subjects who
read the other description indicated that the digital photo frame is more similar with the home
accessories (4.69) than with the electronic products (2.63, F(1,45) = 26.01, p < .01), suggesting
that manipulation was successful.
Next, the target rule of data was manipulated by developing two different data sets. In order to
explain the relationships between an individual’s color preference for a digital photo frame (yi)
and the individual’s color preferences for six products (MP3 player ( aD ), digital camera ( bD ),
mobile phone ( cD ), magazine rack ( aH ), vase ( bH ), and wall mirror ( cH )), a simple additive
linear regression model was developed ( HCHHHBDDDAy cbacbai )()( ,
where D and H = +1 for silver and -1 for black, and )1,0(~ NH ). I placed different amount of
weights on two groups of products (A and B) to create two different data sets. When the target
rule of data is electronic, preferences for electronic products (0.44) were more important than
those for home accessories (0.19). Therefore, the function says,
H19.0)(19.0)(44.0 cbacbai HHHDDDy . For the home target rule, a greater score
was assigned to the home accessories than the electronic products. Its function says,
( H19.0)(44.0)(19.0 cbacbai HHHDDDy ).
An example is illustrated about one hypothetical consumer (numbered as 29) in order to clarify
how to manipulate the target rule of data and develop two different data sets (Figure 9).
According to the random distribution of the two colors for six products, the consumers prefers
silver (+1) for magazine rack ( aH ), digital camera ( bD ), and vase ( bH ), whereas he prefers
black (-1) for MP3 player ( aD ), mobile phone ( cD ), and wall mirror ( cH ). If he is a consumer
who follows the electronic target rule of data, he prefers black for the digital photo frame as her
preference score is negative. Alternatively, if he is a consumer who follows the home target rule
of data, he prefers silver for the digital photo frame.
53
SilverBlack
MP3 player
SilverBlack
Magazinerack
SilverBlack
Digitalcamera
SilverBlack
Vase
SilverBlack
Mobilephone
SilverBlack
Wallmirror
y = 0.44*(-1+1-1)+0.19*(1+1-1)+0.19(-0.91) = -0.42 < 0
“He prefers a BLACK digital photo frame”
Preference
Consumer
Preference Electronic target rule Home target ruleDa Ha Db Hb Dc Hc y Feedback y Feedback
* Scores indicate the percentage of the correct predictions. In each condition, a score not in the parenthesis represents the prediction accuracy of the sequential learning strategy and a score in the parentheses represents the prediction accuracy of the categorization-based strategy.
Table 2 PREDICTION ACCURACY
56
Going beyond describing differences between two strategies, I obtained evidence that the
sequential learning strategy is the better option than the categorization-based strategy. Consider
prediction accuracy about the random 8 trials (Table 5). When the two rules are congruent, the
sequential learning strategy performed poorly compared to the categorization-based strategy
based = 87.50%, t(13) = 2.69, p < .05; home category + home target rule: sequential learning =
74.17% vs. categorization-based = 75.00%, t(14) = 0.29, p > .05). However, the sequential
learning strategy dominated the categorization-based strategy when the two rules are incongruent
(electronic category + home target rule: sequential learning = 74.11% vs. categorization-based =
50.00%, t(13) = 6.74, p < .01; home category + electronic target rule: sequential learning =
79.17% vs. categorization-based = 37.50%, t(14) = 12.34, p < .01). This suggests that marketers
increase their prediction accuracy by 14% in average by changing their prediction strategy from
categorization-based to sequential learning strategy ((78.57-87.50) + (74.17-75.00) + (74.11-
50.00) + (79.17-37.50)/4). Similar findings were reported about 64 trials and other randomly
selected trials, supporting hypothesis 1.
Figure 14 PREDICTION ACCURACY ABOUT RANDOM 8 TRIALS AS A FUNCTION OF CATEGORY, TARGET RULE, AND PREDICTION STRATEGY
57
However, about the initial 8 trials, the sequential learning strategy did not benefit subjects. Data
suggest that marketers lose their prediction accuracy by 8% when switching from the
categorization-based strategy to the sequential learning strategy ((75.89-100) + (79.17-100) +
(70.54-62.50) + (65.83-62.50)/4). This is because the categorization-based strategy performs
well, but the sequential learning strategy performs poorly.
Figure 15 PREDICTION ACCURACY ABOUT INITIAL 8 TRIALS AS A FUNCTION OF CATEGORY, TARGET RULE, AND PREDICTION STRATEGY
Prediction accuracy of the sequential learning strategy suggests that subjects learn how to use
information as they make prediction trials and receive feedback, in particular when the two rules
are incongruent. When category and target rule are congruent, prediction accuracy about the final
5 prediction trials is not different from prediction accuracy about the initial 5 prediction trials
(electronic category + electronic target rule: initial = 78.57% vs. final = 72.86%; home category
+ home target rule: initial = 86.67% vs. final = 80.00%). However, when the two rules are
incongruent, they made predictions more accurately after the 64 prediction trials than before the
64 prediction trials (electronic category + home target rule: initial = 71.43% vs. final = 81.43%,
58
t(13) = 1.53, p = .15; home category + electronic target rule: initial = 58.67% vs. final = 84.00%,
t(14) = 4.75, p < .01). A clearer picture was obtained after analyzing the initial 5 prediction trials
and the final 5 prediction trials separately. For the initial 5 prediction trials, prediction accuracy
was greater when the two rules are congruent than when they are incongruent (category x target
rule interaction, F(1,54) = 14.86, p < .01). Using a simple main effects analysis, I confirmed that
how subjects categorize the target product influenced their prediction accuracy both when the
target rule of data is electronic (F(1,54) = 9.53, p < .01) and when it is home (F(1,54) = 5.59, p <
.05). This suggests that rule congruency influenced prediction accuracy for the initial 5
prediction trials. For the final 5 prediction trials, however, rule congruency had no impact on
prediction accuracy (electronic category + electronic target rule = 73%, home category + home
target rule = 80%, electronic category + home target rule = 81%, home category + electronic
target rule = 84%). A significant three-way interaction effect (category of target product x target
rule of data x time, F(1,54) = 19.65, p < .01) can be interpreted that the sequential learning
strategy led subjects to increase prediction accuracy.
59
Figure 16 PREDICTION ACCURACY OF THE SEQUENTIAL LEARNING STRATEGY AS A FUNCTION OF CATEGORY, TAREGET RULE, AND PLACEMENT OF 5 TRIALS
7.1.5.2 Diagnosticity
Diagnosticity scores suggest that subjects modified diagnosticity only when category of the
target product and the target rule of data are not congruent. The relative diagnosticity scores prior
to prediction trials were positive for subjects who categorized the target product as a electronic
product (+1.36) and negative for those who categorized it as a home accessory (-0.76, F(1,54) =
13.90, p < .01). This suggests that before making prediction trials, subjects judged diagnosticity
based on how they categorize the digital photo frame. However, they either maintained or
modified diagnosticity depending on whether the target rule of data is congruent or not with the
way they categorize the digital photo frame. When it is congruent, they did not modify the
relative diagnosticity (electronic category + electronic target rule: before = 1.33 vs. after = 1.73;
home category + home target rule: before = -0.57 vs. after = -1.37). When the two rules are
incongruent, however, they modified diagnosticity (electronic category + home target rule:
before = 1.39 vs. after = -0.55, t(13) = 3.02, p < .01; home category + electronic target rule:
before = -0.94 vs. after = 0.33, t(14) = 2.13, p = .05). Two significant two-way interactions about
relative diagnosticity (category x time, F(1,54) = 3.07, p < .10; target rule x time, F(1,54) =
14.55, p < .01) suggest that subjects judged diagnosticity based on the implicit rule of
categorization at first and then after making prediction trials and receiving feedback, they judged
diagnosticity based on the target rule of data.
60
Figure 17 RELATIVE DIAGNOSTICITY AS A FUNCTION OF CATEGORY, TARGET RULE, AND PREDICTION TRIALS
7.1.6 Discussion
In this study, hypothesis 1, 1a, and 1b are tested. Data show that the sequential learning strategy
outperformed the categorization-based strategy when the two rules—an implicit rule of
categorization and the target rule of data—are not congruent. Additional analysis of diagnosticity
suggests that the sequential learning strategy benefited subjects as they modified diagnosticity
judgment. In sum, the sequential learning strategy increases prediction accuracy by eliminating
the effect of rule congruency on prediction accuracy.
7.2 Study 2
7.2.1 Objectives
The objective of study 2 is to test hypothesis 2 that whether marketers make predictions more
accurately when consumer preference data are broken down into multiple sets. In order to test
61
this hypothesis, we compared prediction accuracy based on the sequential learning strategy
between two data sets: a single set and multiple sets.
7.2.2 Stimuli and procedure
I used the identical stimuli and procedures employed in study 1. Similar with the previous study,
subjects were provided consumers’ color preferences for six products and asked to predict their
color preferences for a digital photo frame. They made prediction trials and received feedback
for each consumer. Differently from the previous study, subjects made 32 prediction trials, the
half of the full profiles using in study 1.
As this study tested whether data presentation moderates the performance of the sequential
learning strategy, I provided the identical preference profiles about 32 hypothetical consumers to
two randomly assigned subjects in two different formats. In the single set condition, a set of 32
preference profiles were provided and subjects were asked to complete the 32 prediction trials. In
the multiple sets condition, 4 sets of 32 preference profiles (8 preference profiles for each set)
were provided and subjects were forced to stop making predictions every 8th prediction trial and,
in the three breaks, they were asked to answer what they had learned in order for them to resume
making predictions. Although subjects were informed that they might encounter several breaks
while they performed prediction trials, they were not informed about when and how many breaks
stopped their prediction trials and what they should do to resume their predictions. Subjects in
the multiple sets condition were allowed to spend as long as they wanted in each of the three
breaks.5
7.2.3 Design
This study consisted of a 2 (rule congruency: congruent vs. incongruent) x 2 (number of data
sets: single vs. multiple) between-subjects design. Different from study 1, the category of digital
photo frame is not manipulated in this study. Instead, subjects were provided with its electronic
5 In this study, I developed a survey program using Java's Swing, an Application Programming Interface, to generate the graphical components of the survey program and using the Eclipse IDE to build and compile our code throughout the entire development process. Then, I used JExcelApi, an Application Programming Interface to read, write, and modify Excel spreadsheets for retrieving and storing data generated during the program's execution.
62
attributes to encourage them to categorize it as an electronic product. Note that prior research
indicates that people are more likely to categorize products based on their features rather than
usages (MacInnis et al. 1992).
Firstly, rule congruency was manipulated by providing the data sets based on different target
rules. In the congruent rule condition, subjects were provided with a data set based on the
electronic target rule. Data show that the color preference for the digital photo frame is more
closely related with the color preferences for the electronic products than those for home
accessories ( H19.0)(19.0)(44.0 cbacbai HHHDDDy ). In the incongruent condition,
subjects were provided with a data set based on the home target rule
( H19.0)(44.0)(19.0 cbacbai HHHDDDy ).
Secondly, number of data sets was manipulated by whether the data set was provided as a one set
of data or it was provided as four sets of data. Subjects in the single data set condition were
asked to complete 32 prediction trials without having a break. By contrast, subjects in the
multiple data set condition were forced to stop making predictions after every 8th prediction trials.
Then, a blank page appeared and subjects were asked to answer in an open-ended box what they
have learned so far in order to continue making predictions.
7.2.4 Data collection and data analysis
In total, 158 undergraduate students at the University of Toronto were recruited through a
research participation pool. They were rewarded by one-hour course credit.
Same as study 1, each subject’s predictions about 32 profiles were collected and compared with
the modeled predictions, obtaining prediction accuracy. Firstly, it was tested whether rule
congruency and the number of data sets influence the accuracy of their predictions. Secondly,
whether rule congruency and the number of data sets influence the accuracy of the predictions
about the initial 8 prediction trials and the last 8 prediction trials.
7.2.5 Results
Firstly, I conducted an ANOVA on the accuracy of the whole predictions with rule congruency
and the number of data sets as between-subjects factors. When data have multiple sets, subjects
made predictions more accurately than when data have a single set (single set = 59% vs. multiple
63
sets = 69%, F(1,154) = 20.12, p < .01). This effect was observed regardless of whether the two
rules are congruent (single set = 65% vs. multiple sets = 78%) or they are incongruent (single set
= 54% vs. multiple sets = 59%).
Figure 18 PREDICTION ACCURACY ABOUT 32 PREDICTION TRIALS AS A FUNCTION OF RULE CONGRUENCY AND NUMBER OF DATA SETS
The number of data sets, however, benefited prediction accuracy only after subjects made
prediction trials and received feedback. Accuracy about the initial 8 prediction trials were not
influenced by the number of data sets (single set = 61% vs. multiple sets = 64%, F(1,154) = 1.40,
p > .10) but only determined by whether the two rules are congruent (68%) or incongruent (57%,
F(1,154) = 20.75, p < .01). Accuracy about the last 8 prediction trials were influenced by both
the number of data sets (single set = 65% vs. multiple sets = 77%, F(1,154) = 15.58, p < .01) and
rule congruency (congruent = 76% vs. incongruent = 65%, F(1,154) = 14.04, p < .01).
64
7.2.6 Discussion
Study 2 tested hypothesis 2; whether the number of data sets moderates the effect of sequential
learning strategy on prediction accuracy. Data suggests that this strategy can increase prediction
accuracy. An analysis of prediction accuracy between the initial 8 prediction trials and the last 8
prediction trials suggests that people can learn diagnosticity more accurately when they are
provided with multiple data sets than a single set. Although subjects did not make predictions as
accurately when the two rules are incongruent as when they are congruent probably because 32
prediction trials are not long enough for them to identify and use diagnostic information correctly,
I replicated in this study that the sequential learning strategy increases prediction accuracy
regardless of rule congruency.
8 General Discussion Two studies tested sequential learning strategy in the context of market research. Study 1
demonstrated that prediction accuracy based on the sequential learning strategy was greater than
the categorization-based strategy because the former strategy enabled subjects to identify and use
diagnostic information. Study 2 showed that prediction accuracy based on the sequential learning
strategy can increases when the data set is broken down into multiple sets. Findings contribute to
MCPL and market research.
8.1 Contributions to MCPL research Firstly, the present work adds to the literature in decision-making by demonstrating that the
sequential learning strategy introduced by MCPL helps people make unbiased predictions.
Decision-making studies provide abundant evidence that people often make predictions
intuitively, which results in biased predictions. They often judge diagnosticity based on the
characteristics of data (Klayman and Brown 1993; Shah and Oppenheimer 2007; York et al.
1987). For instance, when people predict a plant’s growth based on two factors (e.g., the amount
of moisture and fertilizer), they do not consider the diagnostic factor but consider the factor that
has a small random error (York et al. 1987). Medical students also learn diseases not based on
diagnostic symptoms but based on typical symptoms (Klayman and Brown 1993). People also
often judge diagnosticity relying on the fluency of data such as how clearly they are written,
whether they are in focus, or how easy they are pronounced (Shah and Oppenheimer 2007).
65
People not only judge diagnosticity in a biased way but also use non-diagnostic data or ignore
diagnostic data. A representative example is dilution effect; people change their judgments when
non-diagnostic information is added to diagnostic information (Meyvis and Janiszewski 2002;
Zukier and Jennings 1983). Jurors are less likely to find a man guilty of murdering his aunt when
diagnostic information (e.g., “He was known to have argued with his aunt”) is supplemented
with non-diagnostic information (e.g., “The defendant is of average height and vision”) (Zukier
and Jennings 1983). Similarly, ambiguous product experience enhances the perceived quality of
an advertised product (Hoch and Ha 1986), valueless promotions or useless product features
influence consumer choices (Simonson et al. 1994), and irrelevant product information weakens
consumers’ beliefs about product benefits (Meyvis and Janiszewski 2002). People also ignore
diagnostic data when they estimate the posterior probability of an event. They consider the
provided probability information heavily and ignore diagnostic information such as false-alarm
rate (Doherty et al. 1979) or base rate information (Kahneman and Tversky 1973; Bar-Hillel
1980), suggesting that people may not have a working knowledge of the concept of diagnosticity
(Doherty et al. 1979, p. 118). In order to help people misjudge diagnosticity or use non-
diagnostic information, MCPL literature suggests that the sequential learning strategy enables
people to identify and use diagnostic information (Meyer 1987; West et al. 1996). It helps
consumers identify the relationship between the attributes of a product and its overall quality
(Meyer 1987) and predict others’ preferences for hard-to-decompose products (e.g., quilt) (West
et al. 1996).
Secondly, the present work adds to the literature on MCPL by identifying the number of data sets
as a moderator of the effectiveness of the sequential learning strategy. Numerous contextual
variables have been identified that either facilitate or deter the learning effect including noise in
environment, relationships among cues, number of predictions, and type and timeliness of
feedback, to name a few (Karelaia and Hogarth 2008; Klayman 1984, 1988; Stewart and Rusk
1994).
8.2 Contributions to market research The present work raises a rather ignored issue market research; how marketers use data and
make predictions. Prior work focuses on marketers’ data collection and therefore pays
considerable attention to developing market research tools. It sheds little light on whether market
66
research can produce inaccurate results because marketers make predictions in an inaccurate way
even though data are accurate. I draw on the framework from the literature on MCPL and clarify
why marketers tend to make predictions in a biased way and how they can avoid this tendency.
Therefore, this work demonstrates that MCPL can play an important role in improving the
quality of market research by helping people who use data.
8.3 Limitations and future research
This work is based on two assumptions; consumer preferences in different categories are
independent from the similarity among the different categories and using the sequential learning
strategy incurs no additional cost. I discuss the implications of sequential learning strategy when
these two assumptions are not satisfied, followed by the limitation and future research.
Firstly, it has been well established in marketing that preferences are not consistent with overall
categorical similarity. Studies have shown that consumers’ toy preference or their soft drink
preference is not related with how consumers categorize toys or soft drinks (Shocker et al. 1990).
Differently from study findings, however, consumers may infer their preference from past
experiences in using products from other categories and the data-based target rule is in line with
how data are categorized. For instance, some consumers are more likely to prefer a color in a
product category or, alternatively, they may pursue a specific color in a product category to
achieve “ensemble effect” (Bell, Holbrook and Solomon 1991). In this case, the categorization-
based strategy has no problem and this argument was empirically supported in study 1 showing
that the categorization-based strategy outperforms the sequential learning strategy when the two
rules are congruent. However, designers are unable to know whether the two rules,
categorization-based implicit rule and data-based target rule, are congruent or not in advance.
Therefore, given that the average prediction accuracy favors the sequential learning strategy, I
conclude that the sequential learning strategy is a better strategy for designers when analyzing
data.
Secondly, switching from the categorization-based strategy to the sequential learning strategy
may not be efficient if the cost associated with data collection and analysis is not covered by the
benefits obtained from using the sequential learning strategy. In general, the sequential learning
strategy, compared to the categorization-based strategy, requires of not only collecting a greater
amount of data (multiple categories vs. single category) but also analyzing the collected data
67
more carefully (multiple predictions vs. single prediction). This suggests that in some cases, even
when the proposed rational, regression model may make better predictions, the conventional,
heuristic model may still be efficient given the cost of collecting and analyzing data.
A primary limitation of this work is that the moderating effect of data presentation on sequential
learning strategy is unclear. Although data presentation was manipulated in study 2 whether data
were provided as a single set or multiple sets, subjects in the multiple sets condition had
opportunities to enjoy 3 breaks in the intermission of each set of data. Therefore, our findings
that the sequential learning strategy performed better in the multiple sets condition compared to
the single set condition cannot be because subjects inferred the rules of each set of data more
carefully in the multiple sets condition but may be because a series of breaks helped subjects
process the whole data more globally by reflecting what they learned. This alternative hypothesis
is reasonable because subjects were informed in advance that they might encounter breaks,
implying that different sets of data follow the same data-based target rule. In the future research,
the effects of data presentation (data unpacking) and break of the sequential learning strategy
need to be tested separately and more rigorously. For example, the effects of data presentation
should be tested by comparing between when subjects are aware of and when they are unaware
of whether multiple sets of data follow the identical data-based target rule Besides, the effects of
break should be tested by comparing between when subjects want to take a break and when they
do not want to take a break.
68
Chapter 4
9 Discussion
9.1 Summary Understanding and improving the design process has attracted much scholarly attention across
various disciplines including design, engineering, and management (Cross 1982; Finger and
Dixon 1989; Hauser et al. 2006; Ulrich and Eppinger 2000). However, the role of behavioural
decision theory to inform design has been little discussed (Simonson 1993). In my dissertation, I
study consumers’ decisions and designers’ decisions in two design tasks – concept testing and
preference learning – and aim to help designers better acquire, analyze, and apply consumer data.
In two essays, I identify a bias, provide a solution to eliminate the bias, and explore a boundary
condition of the bias in each design task.
In the first essay, I examine whether consumers construct their preference in concept testing
depending on question format and attribute evaluability. Findings from four studies suggest that
when consumers are asked to choose, they tend to choose the product that serves their immediate
purchase purpose, indicating biased preferences. However, when consumers are asked to predict
enjoyment, they tend to indicate the preferences that reflect their consumption utility. This holds
true when attributes are easy to evaluate; when attributes are hard to evaluate, changing the
question format does not affect consumer preference.
In the second essay, I examine whether designers learn consumer preferences differently
depending on prediction strategy and the number of data sets, even when they use the same
consumer data. Empirical evidence collected from two studies suggests that designers tend to
base their predictions on categorically similar data, predicting consumer preference in a biased
way. On the other hand, designers increase their prediction accuracy when they use a sequential
learning strategy. Moreover, predicting with consumer data in multiple sets further improves
their prediction performance.
69
9.2 Contributions to decision making literature My dissertation broadly contributes to the decision-making research by identifying and
proposing approaches to eliminate biases in the context of design. Decision-making researchers
have studied biases in a wide variety of contexts since Kahneman and Tverksy (1974). For
example, researchers have shown that people’s choices are influenced by the set of alternatives
under consideration, purchase timing, and meaningless adding features (Gourville and Soman
1998; Huber et al. 1982; Simonson et al. 1994), and they have suggested that people can
eliminate biases in their predictions and make accurate predictions, for example, when they
replace or combine their predictions with models or they supplement the predictions with a data
base (Blattberg and Hoch 1990; Dawes 1979; Hoch and Schkade 1996). The research into
decision-making bias is extensive but has not specifically studied bias in the context of design.
Essay one contributes to the decision-making literature on preference construction and decision
strategy. Firstly, it provides evidence that consumers construct their preferences depending on
preference elicitation methods. Differently from prior work demonstrating that consumers
indicate different preferences depending on different response formats, I show their preferences
are determined by question formats (Tversky et al. 1988). Although some researchers have
recently reported that people do not choose the product that they predict they will enjoy more,
they proposed that easy-to-justify attributes are considered important in a choice question and
easy-to-imagine attributes are emphasized in an enjoyment prediction question (Hsee et al. 2003;
Shiv and Huber 2000). In this essay, I argue that choice discrepancies between two question
formats result from different decision strategies, suggesting a new underlying mechanism.
Secondly, this essay shows that consumers select different decision strategies depending on
question format and attribute evaluability. A significant body of research on the topic of decision
strategy suggests that when people find it cognitively or emotionally difficult to make trade-offs
between attribute values, they use non-compensatory decision strategies (Bettman et al. 1998). I
add to this body of knowledge by suggesting that question format and attribute evaluability affect
people’s willingness to make trade-offs.
Essay two contributes to the decision-making literature on the topics of intuitive diagnosticity
judgment and MCPL. Firstly, it provides evidence that categorization is a source of prediction
bias. Previous work suggests that people often base their predictions not on diagnostic
70
information but on the information that is typical, that is easy to read, or that has small random
errors (Klayman and Brown 1993; Shah and Oppenheimer 2007; York et al. 1987). I add to this
body of research by demonstrating that people tend to base their predictions on categorically
similar information and make biased predictions. Secondly, this essay adds to the literature on
MCPL by replicating and improving the effect of a sequential learning strategy. Much discussion
has been made whether and when a sequential learning strategy enhances prediction performance
(Karelaia and Hogarth 2008; Klayman 1984). I add to this discussion by showing that predictions
based on a sequential learning strategy are generally accurate and these predictions can be further
improved when predictions are made with multiple data sets. I add to this knowledge by
9.3 Contributions to design literature
My dissertation broadly contributes to the design research by suggesting that decision-making
framework helps in understanding and managing the design process. Historically, design
researchers have illustrated in case studies the behaviors that consumers and designers exhibit,
but paid little attention to examining these behaviors and generalizing these insights to multiple
cases. Although some design researchers have applied decision-making framework to design and
studied cognitive heuristics employed by designers (Yilmaz and Seifert 2010) or decisions in the
product development process (Krishnan and Ulrich 2001), bias in the design process has not
been examined.
My thesis contributes to the prior literature discussing different design tasks. Firstly, essay one
contributes to the attempts that behavioral researchers have made to improve conjoint analysis,
an attribute-based concept testing. Researchers have long suggested that response format or
presentation format affects the weighting of product attributes (Green and Srinivasan 1990). For
example, price receives more weight when responses are measured by a choice scale than when
measured by a likelihood-of-purchase scale (Huber 1997), and stylistic attributes receive more
weight when products are presented in pictures than when described verbally (Holbrook and
Moore 1981). I add question format to these variables by showing that question format can have
a considerable effect on the weighting of product attributes.
Next, essay two suggests that preference learning is a potential research topic in design research.
Considerable discussion has been made on how to collect consumer data (Zaltman 1997), but
little is known about how designers predict consumer preference by analyzing and applying the
71
collected consumer data. While such questions have been addressed for engineers and managers
(Hauser and Clausing 1988; Hoch and Schkade 1996), I shed light on a new topic in design to
understand and help designers.
9.4 Managerial implications for design practice
My dissertation broadly benefits designers by providing insights into how designers should
collect consumer data and analyze the collected consumer data. The first essay suggests that
when designers collect consumer preference for testing concepts, they should select the question
format carefully so that it serves their objectives of concept testing. When designers attempt to
identify the market behavior of consumers or the market share of the products, the conventional
choice question is appropriate. However, when they predict the consumers’ post-purchase
enjoyment or the products’ long-term market performance, an enjoyment prediction questions is
a better option. This essay also suggests that designers can use the enjoyment prediction question
to test whether consumers over-emphasize an attribute while they answer the choice question. If
consumers show inconsistent preferences between two questions, these findings indicate that
consumers place too much emphasis on one attribute in the choice task. However, if consumers’
preferences do not differ between the two questions, these findings indicate the attribute
considered important in the choice task actually dominates other remaining attributes.
The second essay suggests that designers should carefully apply a large amount of cross-category
consumer data. Designers are increasingly using various research methods to collect consumer
data across domains. For example, when the Mayo clinic improved its services, IDEO designers
observed patients in the hospital as well as people in public spaces such as subway stations,
theaters, and shopping malls (Kelley 2001). Similarly, when Harley-Davidson wanted to serve its
rider communities better, designers from Jump Associates investigated its own communities and
Disney’s communities (Patnaik and Mortenstein 2009). Designers will make better predictions
using these data only when they avoid using a heuristic prediction strategy, such as a
categorization-based strategy.
9.5 Future research
I have conducted two studies in essay two using undergraduate students as research subjects in
order to understand and improve the prediction strategies used by professional designers.
72
However, professional designers do not necessarily learn consumer preferences in the same way
as undergraduate students. Previous research offered two conflicting hypotheses concerning the
relative performance of the preference learning between professional designers and
undergraduate students. According to the research on expertise, prior experience leads experts to
focus on diagnostic information and disregard irrelevant information, suggesting that
professional designers outperform undergraduate students (Alba and Hutchinson 1987).
However, design research suggests that individual designers rely heavily on their own heuristics
when performing a design task, such as developing concepts, and these heuristics are developed
by the repetition of similar tasks (Yilmaz and Seifert 2010). Future research should examine
whether prior experience helps or hurts professional designers in learning consumer preference.
Another future research is to study how designers use their heuristics strategically to learn
consumer preference accurately: they can offset the bias in the consumer data or they do not
collect consumer data at all. My two essays suggest that designers collect biased consumer data
and that they use consumer data in a biased way. Paradoxically, it seems that two wrongs may
make a right: designers use the biased data in a biased way, and end up making unbiased
predictions. This argument is supported by Burson et al. (2008) who have studied how people
predict others’ preferences under uncertainty. They found that, firstly, predictors anticipate
others’ beliefs about the likelihood of uncertain events inaccurately and that, secondly, predictors
anticipate the weight that beliefs will have on others’ choices inaccurately. Predictors typically
err at both steps, but the errors they make are often of opposing directions. Where predictors
think others are more optimistic about likelihood than they actually are, predictors also think that
others will weigh beliefs more negatively than they actually do. Likewise, where predictors think
that others are more pessimistic about likelihood than they actually are, predictors also think that
others will weigh beliefs more positively than they actually do. Thus, people’s errors often offset
to yield predictions that are “accidentally accurate” overall. Alternatively, designers do not use
consumer data at all to avoid any biased conclusion. This conjecture is supported by the
decisions made by the product designers for Bang and Olufsen and Allessi, who intentionally
avoid conducting market research because, they believe, survey responses do not reflect
consumers’ true preferences (Verganti 2006). Future research should examine whether
designers’ heuristic decisions regarding consumer data can result in accurate preference learning.
73
References (chapter 1)
Archer, Leonard Bruce (1979), “Whatever Became of Design Methodology?” Design Studies, 1 (1), 17-18.
Blattberg, Robert and Stephen Hoch (1990), “Database Models and Managerial Intuition: 50% Model + 50% Manager”, Management Science, 36 (8), 887-899.
Mozota, Brigitte Borja de (2003), Design Management: Using Design to Build Brand Value and Corporate Innovation, Allworth Press: New York.
Brown, Tim (2008), “Design Thinking,” Harvard Business Review, June, 85-92.
Brunswik, Egon and Hans Herma (1951), “Probability Learning of Perceptual Cues in the Establishment of a Weight Illusion,” Journal of Experimental Psychology, 41 (4), 281-290.
Buchanan, Richard (2001), “Design Research and the New Learning,” Design Issues, 17 (4), 3-23.
BusinessWeek (2005), “Designed for Loving,” (July 21).
Cross, Nigel (2006), Designerly Ways of Knowing, Springer: Germany.
Deasy, Dorothy, Peter Flannery, and Darrel Rhea (2001), “Using Research to Foster and Predict Successful Innovation: The Resolve Office System,” Design Management Journal, 12 (3), 50-57.
Design Council (2005), “Design Index: The Impact of Design on Stock Market Performance,” Available from www.designcouncil.org.uk.
Doherty, Michael, Clifford Mynatt, Ryan Tweney, and Michael Schiavo (1979), “Pseudodiagnosticity,” Acta Psychologica, 43 (2), 111-121.
Elrod, Terry (1988), “Choice Map: Inferring a Product-Market Map from Panel Data,” Marketing Science, 7 (Winter), 21-40.
Fischer, Gregory W. and and Scott Hawkins (1993), “Strategy Compatibility, Scale Compatibility, and the Prominence Effect,” Journal of Experimental Psychology: Human Perception and Performance, 19 (June), 580–597.
Franz, Jill Maree (1997), “A Phenomenographic Study of Design in the Interior Design Context,” Doctoral Dissertation, Queensland University of Technology.
Fraser, Heather (2007), “The Practice of Breakthrough Strategies by Design,” Journal of Business Strategy, 28 (4), 66-74.
Friedman, Ken (2000), “Design Knowledge: Context, Content and Continuity,” In: D. Durling and K. Friedman, eds. Doctoral Education in Design: Foundations for the Future, La Clusaz, France, 8-12 July 2000. Stoke-on-Trent: Staffordshire University Press, 5-16.
Gemser, Gerda and Mark Leenders (2001), “How Integrating Industrial Design in the Product Development Process Impacts on Company Performance,” Journal of Product Innovation Management, 18 (1), 28-38.
74
Gourville, John and Dilip Soman (1998), “Payment Depreciation: The Behavioral Effects of Temporally Separating Payments from Consumption,” Journal of Consumer Research, 25 (2), 160-174.
Hauser, John, Gerald J. Tellis, and Abbie Griffin (2006), “Research on Innovation: A Review and Agenda for Marketing Science,” Marketing Science, 25 (6), 687-717.
Hertenstein, Julie, Marjorie Platt, and Robert Veryzer (2005), “The Impact of Industrial Design Effectiveness on Corporate Financial Performance,” Journal of Product Innovation Management, 22, 3-21.
Hoch, Stephen and George Loewenstein (1991), “Time-Inconsistent Preferences and Consumer Self-Control”, Journal of Consumer Research, 17 (March), 492-507.
Hoch, Stephen and David Schkade (1996), “A Psychological Approach to Decision Support Systems,” Management Science, 42 (1), 51-64
Howard T. J., S. J. Culley, and E. Dekoninck (2008), “Describing the Creative Design Process by the Integration of Engineering Design and Cognitive Psychology Literature,” Design Studies, 29 (2), 160-180.
Hsee, Christopher, Jiao Zhang, Fang Yu, and Yiheng Xi (2003), “Lay Rationalism and Inconsistency between Predicted Experience and Decision,” Journal of Behavioral Decision Making, 16 (4), 257-272.
Huber, Joel (1997), “What We Have Learned From 20 Years of Conjoint Research,” Sawtooth: Research Paper Series.
Huber, Joel, John Payne, and Christopher Puto (1982), “Adding Asymmetrically Dominated Alternatives: Violations of Regularity and Similarity Hypothesis,” Journal of Consumer Research, 9 (June), 90-98.
Luchs, Michael and Scott Swan (2011), “Perspective: The Emergence of Product Design as a Field of Marketing Inquiry,” Journal of Product Innovation Management, 28 (3), 327-345.
Margolin, Victor (1999), “History, Theory, and Criticism in Doctoral Education,” In: R. Buchanan, D. Doordan, and L. Justice, eds. Doctoral Education in Design, Ohio, 8-11 October 1998. Pittsburgh, Pennsylvania: The School of Design, Carnegie Mellon University.
Martin, Roger (2005), “Embedding Design into Business,” Rotman Management, Fall, 4-7.
Owen, Charles (1998), “Design Research: Building the Knowledge Base,” Design Studies, 19 (January), 9-20.
Perks, Helen, Rachel Cooper, and Cassie Jones (2005), “Characterizing the Role of Design in New Product Development: An Empirically Derived Taxonomy,” Journal of Product Innovation Management, 22 (2), 111-127.
Petersen, Soren (2008), “Design Quantification: Design Concept Argument as related to Product Performance Metrics,” Unpublished Doctoral Dissertation, Stanford University.
Roy, Robin, Johann Riedel and Stephen Potter (1998), “Market Demands that Reward Investment in Design (MADRID),” Final Report submitted to The Design Council.
75
Shiv, Baba and Joel Huber (2000), “The Impact of Anticipating Satisfaction on Consumer Choice,” Journal of Consumer Research, 27 (September), 202-216.
Simon, Herbert (1969), The Sciences of the Artificial, Second Edition, Cambridge: Mass, London, England
Turner, Raymond (2000), “Design and Business Who Calls the Shots?” Design Management Journal, 11 (4), 42-47.
Tversky, Amos and Daniel Kahneman (1974), “Judgment under Uncertainty: Heuristics and Biases,” Science, 185, 1124-1131.
Tversky, Amos, Shmuel Sattah, and Paul Slovic (1988), “Contingent Weighting in Judgment and Choice,” Psychological Review, 95 (July), 371–384.
von Stamm, Bettina (2004), “Innovation-What’s Design Got to Do with It?” Design Management Review, 15 (1), 10-19.
76
References (chapter 2)
Arnould, Eric and Melanie Wallendorf (1994), “Market-Oriented Ethnography: Interpretation Building and Marketing Strategy Formulation,” Journal of Marketing Research, 31 (November), 484-504.
Bargh, John A., Peter M. Gollwitzer, Annett Lee-Chai, Kimberly Barndollar, and Roman Trotschel (2001), “The Automated Will: Nonconscious Activation and Pursuit of Behavioral Goals,” Journal of Personality and Social Psychology, 81 (6), 1024-1027.
Bazerman, Max H., Don A. Moore, Ann E. Tenbrunsel, Kimberly A. Wade-Benzoni, and Sally Blount (1999), “Explaining How Preferences Change Across Joint versus Separate Evaluation,” Journal of Economic Behavior and Organization, 39 (1), 41-58.
Bettman, R. James, Mary Frances Luce, and John W. Payne (1998), “Constructive Consumer Choice Processes,” Journal of Consumer Research, 25 (December), 187-217.
Coupey, Eloise, Julie R. Irwin, and John W. Payne (1998), “Product Category Familiarity and Preference Construction,” Journal of Consumer Research, 24 (March), 459-468.
Cox, James C. and David M. Grether (1996), “The Preference Reversal Phenomenon: Response Mode, Markets, and Incentives,” Economic Theory, 7 (3), 381-405.
Deasy, Dorothy, Peter Flannery, and Darrel Rhea (2001), “Using Research to Foster and Predict Successful Innovation: The Resolve Office System,” Design Management Journal, 12 (3), 50-57.
Dahan, Ely and V. Srinivasan (2000), “The Predictive Power of Internet-Based Product Concept Testing Using Visual Depiction and Animation,” Journal of Product Innovation Management, 17 (2), 99-109.
Drolet, Aimee and Mary Frances Luce (2004), “The Rationalizing Effects of Cognitive Load on Emotion-Based Trade-off Avoidance,” Journal of Consumer Research, 31 (June), 63-77.
Feldman, Jack and John G. Lynch (1988), “Self-generated Validity and Other Effects of Measurement on Belief, Attitude, Intention, and Behavior,” Journal of Applied Psychology, 73 (August), 421-435.
Fischer, Gregory W. and and Scott Hawkins (1993), “Strategy Compatibility, Scale Compatibility, and the Prominence Effect,” Journal of Experimental Psychology: Human Perception and Performance, 19 (June), 580–597.
Gilbride, Timothy J. and Greg M. Allenby (2004), “A Choice Model with Conjunctive, Disjunctive, and Compensatory Screening Rules,” Marketing Science, 23 (Summer), 391-406.
Green, Paul E. and V. Srinivasan (1978), “Conjoint Analysis in Consumer Research,” Journal of Consumer Research, 5 (September), 103-123.
Green, Paul E. and V. Srinivasan (1990), “Conjoint Analysis in Marketing: New Developments with Implications for Research and Practice,” Journal of Marketing, 54 (October), 3-19.
77
Griffin, Abbie and John Hauser (1993), “The Voice of the Customer,” Marketing Science, 12 (Winter), 1-27.
Hauser, John, Gerald J. Tellis, and Abbie Griffin (2006), “Research on Innovation: A Review and Agenda for Marketing Science,” Marketing Science, 25 (6), 687-717.
Hsee, Christopher (1996), “The Evaluability Hypothesis: An Explanation for Preference Reversals between Joint and Separate Evaluations of Alternatives,” Organizational Behavior and Human Decision Processes, 67 (3), 247-257.
Hsee, Christopher and Claire Tsai (2008), “Hedonomics in Consumer Behavior,” in Handbook of Consumer Psychology, ed. Curtis P. Haugtvedt, Paul M. Herr, and Frank R. Kardes, Mahwah, NJ: Lawrence Erlbaum Associates, 639-658.
Hsee, Christopher, Yang Yang, Yangjie Gu, and Jie Chen (2009), “Specification Seeking, How Product Specifications Influence Consumer Preference,” Journal of Consumer Research, 35 (April), 952-966.
Hsee, Christopher and Jiao Zhang (2010), “General Evaluability Theory,” Perspectives on Psychological Science, 5 (4), 343-355.
Hsee, Christopher, Jiao Zhang, Fang Yu, and Yiheng Xi (2003), “Lay Rationalism and Inconsistency between Predicted Experience and Decision,” Journal of Behavioral Decision Making, 16 (4), 257-272.
Huber, Joel (1997), “What We Have Learned From 20 Years of Conjoint Research,” Sawtooth: Research Paper Series.
Huffman, Cynthia, S. Ratneshwar, and David Glen Mick (2000), “Consumer Goal Structures and Goal-Determination Processes: An Integrative Framework,” in The Why of Consumption: Contemporary Perspectives on Consumer Motives, Goals, and Desires, ed. S. Ratneshwar, David Glen Mick and Cynthia Huffman, New York: Routledge, 9-35.
Kruglanski, Arie W. (1996), “Goals as Knowledge Structures,” in The Psychology of Action, ed. Peter M. Gollwitzer and John A. Bargh, New York: Guilford, 599-618.
Lichtenstein, Sarah and Paul Slovic (1971), Reversals of Preference between Bids and Choices in Gambling Decisions,” Journal of Experimental Psychology, 89 (1), 46-55.
Louviere, Jordan J., Deborah Street, and Leonie Burgess (2004), “A 20+Years’ Retrospective on Choice Experiments,” in Tribute to Paul Green, ed. Jerry Wind, Dordrecht, the Netherlands: Kluwer Academic Publishers, International Series in Quantitative Marketing.
Louviere, Jordan J. and George Woodworth (1983),” Design and Analysis of Simulated Consumer Choice or Allocation Experiments: An Approach Based on Homogeneous Data,” Journal of Marketing Research, 20 (November), 350-367.
Luce, Mary Frances (1998), “Choosing to Avoid: Coping with Negatively Emotion-Laden Consumer Decisions,” Journal of Consumer Research, 24 (March), 409-433.
MacInnis, Deborah J. and Linda L. Price (1987), “The Role of Imagery in Information Processing: Review and Extensions,” Journal of Consumer Research, 13 (March), 473–491.
78
McGill, Ann L. and Punam Anand-Keller (1989), “The Effect of Vivid Attributes on the Evaluation of Alternatives: The Role of Differential Attention and Cognitive Elaboration,” Journal of Consumer Research, 16 (September), 188-196
Nowlis, Stephen M. and Itamar Simonson (1997), “Attribute-Task Compatibility as a Determinant of Consumer Preference Reversals,” Journal of Marketing Research, 34 (May), 205–218.
Payne, John W., James R. Bettman, and Eric J. Johnson (1993), The Adaptive Decision Maker, Cambridge: Cambridge University Press.
Shah, James Y. and Arie W. Kruglanski (2003), “When Opportunity Knocks: Bottom-up Priming of Goals by Means and Its Effects on Self-Regulation,” Journal of Personality and Social Psychology, 84 (6), 1109-1122.
Shiv, Baba and Joel Huber (2000), “The Impact of Anticipating Satisfaction on Consumer Choice,” Journal of Consumer Research, 27 (September), 202-216.
Simmons, Carolyn J., Barbara A. Bickart, and John G. Lynch, Jr. (1993), “Capturing and Creating Public Opinion in Survey Research,” Journal of Consumer Research, 20 (September), 316-329.
Simonson, Itamar (1989), “Choice Based on Reasons: The Case of Attraction and Compromise Effects,” Journal of Consumer Research, 16 (September), 158-174.
Slovic, Paul, Dale Griffin, and Amos Tversky (1990), “Compatibility Effects in Judgment and Choice,” in Insights in Decision Making, ed. Robin Hogarth, Chicago: University of Chicago Press, 5-27.
Srinivasan, V., William Lovejoy and David Beach (1997), “Integrated Product Design for Marketability and Manufacturing,” Journal of Marketing Research, 34 (February), 154-163.
Thompson, Debora Viana and Rebecca W. Hamilton (2006), “The Effects of Information Processing Mode on Consumers’ Responses to Comparative Advertising,” Journal of Consumer Research, 32 (March), 530-540.
Tversky, Amos (1972), “Elimination by Aspects: A Theory of Choice,” Psychological Review, 79 (July), 281-299.
Tversky, Amos, Shmuel Sattah, and Paul Slovic (1988), “Contingent Weighting in Judgment and Choice,” Psychological Review, 95 (July), 371–384.
Urban, L. Glen and John R. Hauser (2004), “Listening-in to Find and Explore New Combinations of Customer Needs,” Journal of Marketing, 68 (April), 72-87.
Wind, Jerry and Vijay Mahajan (1997), “Issues and Opportunities in New Product Development: An Introduction to the Special Issue,” Journal of Marketing Research, 34 (February), 1-12.
Zaltman, Gerald (1997), “Rethinking Market Research: Putting People Back In,” Journal of Marketing Research, 34 (November), 424-437.
Zhang, Ying, Ayelet Fishbach, and Arie W. Kruglanski (2007), “The Dilution Model: How Additional Goals Undermine the Perceived Instrumentality of a Shared Path,” Journal of Personality and Social Psychology, 92 (3), 389-401.
79
References (chapter 3)
Aaker, David and Kevin Keller (1990), “Consumer Evaluation of Brand Extensions,” Journal of Marketing, 54 (1), 27-41
Adelman, Leonard (1981), “The Influence of Formal, Substantive, and Contextual Task Properties on the Relative Effectiveness of Different Forms of Feedback in Multiple-Cue Probability Learning Tasks,” Organizational Behavior and Human Performance, 27 (3), 423-442.
Brunswik, Egon (1955), “Representative Design and Probabilistic Theory in a Functional Psychology,” Psychological Review, 62 (May), 193-217.
Brunswik, Egon and Hans Herma (1951), “Probability Learning of Perceptual Cues in the Establishment of a Weight Illusion,” Journal of Experimental Psychology, 41 (4), 281-290.
Dahl, Darren, Amitava Chattopadhyay, and Gerald Gorn (1999), “The Use of Visual Mental Imagery in New Product Design,” Journal of Marketing Research, 36 (February), 18-28.
Elrod, Terry (1988), “Choice Map: Inferring a Product-Market Map from Panel Data,” Marketing Science, 7 (Winter), 21-40.
Goldstein, William (2004), “Social Judgment Theory: Applying and Extending Brunswik’s Probabilistic Functionalism,” in Blackwell Handbook of Judgment and Decision Making, ed. Derek J. Koehler and Nigel Harvey, Oxford: Blackwell, 37-61.
Hogarth, Robin (1981), “Beyond Discrete Biases: Functional and Dysfunctional Aspects of Judgmental Heuristics,” Psychological Bulletin, 90 (2), 197-217.
Hogarth, Robin M., Brain J. Gibbs, Craig R. McKenzie, and Margaret A. Marquis (1991), “Learning from Feedback: Exactingness and Incentives,” Journal of Experimental Psychology: Learning, Memory, and Cognition, 17 (July), 734-752
Hauser, John R. and Don Clausing (1988), “The House of Quality,” Harvard Business Review, May-June, 63-73.
Karelaia, Natalia and Robin Hogarth (2008), “Determinants of Linear Judgment: A Meta-Analysis of Lens Model Studies,” Psychological Bulletin, 134 (3), 404–426.
Klayman, Joshua (1984), “Learning from Feedback in Probabilistic Environments,” Acta Psychologica, 56 (1-3), 81-92.
Klayman, Joshua (1988), “Cue Discovery in Probabilistic Environments: Uncertainty and Experimentation,” Journal of Experimental Psychology: Learning, Memory, and Cognition, 14 (2), 317-330.
Klayman, Joshua and Kaye Brown (1993), “Debias the Environment Instead of the Judge: An Alternative Approach to Improving Diagnostic (and Other) Judgment,” Cognition, 49 (1-2), 97-122.
Medin, Douglas, Robert Goldstone, and Dedre Gentner (1993), “Respects For Similarity,” Psychological Review, 100 (2), 254-278.
80
Meyer, Robert J. (1987), “The Learning of Multiattribute Judgment Policies,” Journal of Consumer Research, 14 (September), 155-173.
Meyvis, Tom and Chris Janiszewski (2002), “Consumers’ Beliefs about Product Benefits: The Effect of Obviously Irrelevant Product Information,” Journal of Consumer Research, 28 (March), 618-635.
Osherson, Daniel N., Edward E. Smith, Ormond Wilkie, Alejandro Lopez, and Eldar Shafir (1990), “Category-Based Induction,” Psychology Review, 97 (2), 185-200
Pham, Michel Tuan and Tamar Avnet (2004), “Ideals and Oughts and the Weighting of Affect versus Substance in Persuasion,” Journal of Consumer Research, 30 (March), 503-518.
Shah, Anuj K. and Daniel M. Oppenheimer (2007), “Easy Does It: The Role of Fluency in Cue Weighting,” Judgment and Decision Making, 2 (6), 371-379.
Shocker, Allan D., David W. Stewart, and Anthony J. Zahorik (1990), “Determining the Competitive Structure of Product- Markets,” working paper, Carlson School of Management, University of Minnesota, Minneapolis.
Sniezek, Janet A. (1986), “The Role of Variable Labels in Cue Probability Learning Tasks,” Organizational Behavior and Human Decision Processes, 38 (2), 141-161.
Stewart, Thomas R. and Cynthia M. Lusk (1994), “Seven Components of Judgmental Forecasting Skill: Implication for Research and the Improvement of Forecasts,” Journal of Forecasting, 13, 579-599.
West, Patricia M. (1996), “Predicting Preferences: An Examination of Agent Learning,” Journal of Consumer Research, 23 (June), 68-80.
West, Patricia M., Christina L. Brown, and Stephen J. Hoch (1996), “Consumption Vocabulary and Preference Formation,” Journal of Consumer Research, 23 (September), 120-135.
Whipple, Thomas W. (1976), “Variation among Multidimensional Scaling Solutions: An Examination of the Effect of Data Collection Differences,” Journal of Marketing Research, 13 (February), 98-103.
York, Kenneth M., Michael E. Doherty, and Joseph Kamouri (1987), “The Influence of Cue Unreliability on Judgment in a Multiple Cue Probability Learning Task,” Organizational Behavior and Human Decision Processes, 39 (3), 303-317.
81
References (chapter 4)
Alba Joseph W. and J. Wesley Hutchinson (1987), “Dimensions of Consumer Expertise,” Journal of Consumer Research, 13 (March), 411-454.
Bettman, R. James, Mary Frances Luce, and John W. Payne (1998), “Constructive Consumer Choice Processes,” Journal of Consumer Research, 25 (December), 187-217.
Burson, Katherine, David Faro, and Yuval Rottenstreich (2008), “Can Two Wrongs Make a Right? Accidental Accuracy in Predictions of Others’ Preferences Under Uncertainty,” Advances in Consumer Research, 35, 244.
Dawes, Robyn (1979), “The Robust Beauty of Improper Linear Models in Decision Making”, American Psychologist, 34 (7), 571-582.
Finger, Susan and John Dixon (1989), “A Review of Research in Mechanical Engineering Design. Part 1: Descriptive, Prescriptive, and Computer-Based Models of Design Processes,” Research in Engineering Design, 1 (1), 51-67.
Green, Paul E. and V. Srinivasan (1990), “Conjoint Analysis in Marketing: New Developments with Implications for Research and Practice,” Journal of Marketing, 54 (October), 3-19.
Hauser, John and Don Clausing (1988), “The House of Quality,” Harvard Business Review, 3 (May-June), 63-73.
Holbrook, Morris and William Moore (1981), “Feature Interactions in Consumer Judgments of Verbal versus Pictorial Presentations,” Journal of Consumer Research, 8 (June), 103-113.
Karelaia, Natalia and Robin Hogarth (2008), “Determinants of Linear Judgment: A Meta-Analysis of Lens Model Studies,” Psychological Bulletin, 134 (3), 404–426.
Kelley, Tom (2001), The Art of Innovation, New York: Doubleday.
Klayman, Joshua (1984), “Learning from Feedback in Probabilistic Environments,” Acta Psychologica, 56 (1-3), 81-92.
Klayman, Joshua and Kaye Brown (1993), “Debias the Environment Instead of the Judge: An Alternative Approach to Improving Diagnostic (and Other) Judgment,” Cognition, 49, 97-122.
Krishnan, V. and Karl T. Ulrich (2001), “Product Development Decisions: A Review of the Literature,” Management Science, 47 (January), 1-21.
Patnaik, Dev and Peter Mortensen (2009), Wired to Care: How Companies Prosper when They Create Widespread Empathy, Upper Saddle River, New Jersey: FT Press.
Shah, Anuj K. and Daniel M. Oppenheimer (2007), “Easy Does It: The Role of Fluency in Cue Weighting,” Judgment and Decision Making, 2 (6), 371-379.
Simonson, Itamar, Ziv Carmon, and Sue O’Curry (1994), “Experimental Evidence on the Negative Effect of Product Features & Sales Promotions on Brand Choice,” Marketing Science, 13 (Winter), 23-40.
82
Ulrich, Karl T. and Steven D. Eppinger (1985), Product Development and Design, New York: McGraw-Hill, Inc.
Verganti, Roberto (2006), “Innovation Through Design,” Harvard Business Review, December, 1-8.
Yilmaz, Seda and Colleen Seifert (2010), “Creativity Through Design Heuristics: A Case Study of Expert Product Design,” Design Studies (in review).
York, Kenneth M., Michael E. Doherty, and Joseph Kamouri (1987), “The Influence of Cue Unreliability on Judgment in a Multiple Cue Probability Learning Task,” Organizational Behavior and Human Decision Processes, 39, 303-319.
Zaltman, Gerald (1997), “Rethinking Market Research: Putting People Back In,” Journal of Marketing Research, 34 (November), 424-437.
83
Appendices
APPENDIX A: CHOICE QUESTION AND ENJOYMENT PREDICTION QUESTION (Hsee et al. 2003) Choice question: Which option would you choose? Enjoyment prediction question: Which option will you enjoy more when you use it? Appendix B: A QUESTION FOR MEASURING CONSUMER TRAIT IN STUDY 2, CHAPTER 2 Imagine that you consider purchasing a digital dictionary. Please write as many reasons as you could in the bullet point form why you purchase a digital dictionary. APPENDIX C: QUESTIONS FOR MANIPULATION CHECK OF PRODUCT TYPE IN STUDY 1, CHAPTER 2 (Davies et al. 1999; Bloch et al. 2003) How much do you agree with the following four sentences? (1 = not at all, 7 = very much) Smart phones are supposed to provide sensory pleasure and, when they serve any performance purposes, they are serious defects. Mouse pads are supposed to provide sensory pleasure and, when they serve any performance purposes, they are serious defects. A design of the smart phones is a source of pleasure. A design of the mouse pads is a source of pleasure. APPENDIX D: STIMULI FOR STUDIES 1 – 4 IN CHAPTER 2 Smart phones in study 1: Here are two newly developed smart phones. They are equipped with the same processor and the same camera, and priced similarly. Option B (A) has 16 MB of expandable memory, whereas Option A (B) has 8MB of memory. Mouse pads in study 1: Here are two newly developed mouse pads. They have the same size (11.5” width x 12.5” depth) and cost about $10. Option B (A) has an adhesive on the back so that it stows on back of notebook.
84
Digital dictionary in study 2: Here are two newly developed digital dictionaries. They are equipped with the same CPU and priced similarly. Option B (A) translates among 5 languages (English, French, German, Spanish, and Italian), whereas Option A (B) translates between 2 languages (English and French). Digital cameras in study 3: Here are two newly developed digital cameras. They offer 10 megapixels, store about 150 high-resolution pictures, and have an automatic flash. Option B (A) is water-proof but Option A (B) is not. E-book readers in study 4: Here are two newly developed E-book readers. They are both weighted about 10 ounces, hold over 1500 reading materials, and cost around $350. Option B (A) has a 9-inch display with the resolution of 480x320 pixels, whereas Option A (B) has a 6-inch display with the resolution of 960 x 640 pixels. APPENDIX E: MANIPULATION OF PURCHASE PURPOSE IN STUDY 3, CHAPTER 2 Performance purchase purpose condition: Imagine that you consider purchasing a digital camera to take pictures of the sport activities during your vacation. Aesthetic purchase purpose condition: Imagine that you consider purchasing a digital camera to take pictures of the daily life of your boyfriend or girlfriend. APPENDIX F: MANIPULATION OF ATTRIBUTE EVALUABILITY IN STUDY 4, CHAPTER 2 Easy-to-evaluate condition: The display size of the e-book readers available in the market varies between 6 and 10 inches diagonally and their display resolution varies between 480 x 256 and 1024 x 640 pixels. Hard-to-evaluate condition: The display size of the e-book readers available in the market varies between 4 and 15 inches diagonally and their display resolution varies between 240 x 124 and 2048 x 960 pixels.