32
ASL MARINE DBS Vickers Pulse of Asia Roadshow 10 January 2012
ASL MARINE
DBS Vickers Pulse of Asia Roadshow
10 January 2012

22
Presentation Outline
Group Overview
1Q FY2012 Financial Review
(3 months ended 30 September 2011)
Operations Review
- Shipbuilding
- Shiprepair and Conversion
- Shipchartering
Business Outlook

ASL MARINEGroup Overview
44
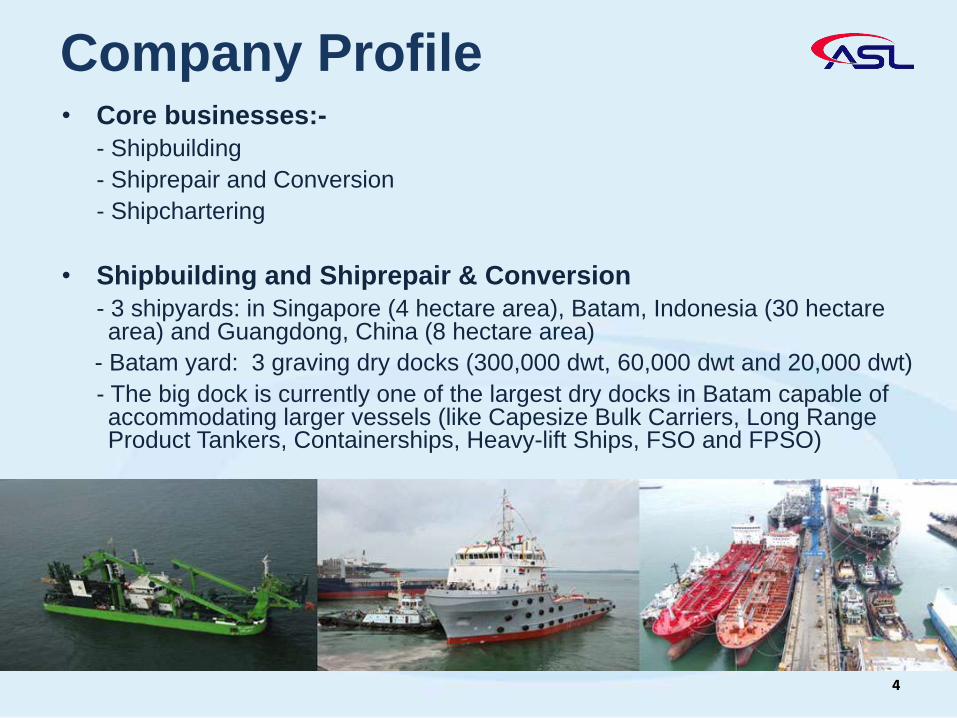
• Core businesses:-
- Shipbuilding
- Shiprepair and Conversion
- Shipchartering
• Shipbuilding and Shiprepair & Conversion
- 3 shipyards: in Singapore (4 hectare area), Batam, Indonesia (30 hectarearea) and Guangdong, China (8 hectare area)
- Batam yard: 3 graving dry docks (300,000 dwt, 60,000 dwt and 20,000 dwt)
- The big dock is currently one of the largest dry docks in Batam capable ofaccommodating larger vessels (like Capesize Bulk Carriers, Long RangeProduct Tankers, Containerships, Heavy-lift Ships, FSO and FPSO)
Company Profile

55
Company Profile• Shipbuilding and Shiprepair & Conversion (cont.)
- Builds a variety of vessels, specialises in building:
i) Offshore Support Vessels (Heavy-Lift cum Pipelay Vessel, SubseaOperation Vessel, AHTS, PSV, Offshore Maintenance/AccommodationVessel, Rescue and Standby Vessel)
ii) Construction Vessels and Dredgers (Cutter Suction Dredger and WaterInjection Dredger)
iii) Tugs (Rotor Tugs and Azimuth Stern Drive Tugs)
iv) Barges (Accommodation, Pipe laying and Work)
v) Tankers (Chemical Tanker (IMO II/III), Bunkering and Product Tankers)

66
• Shipchartering
- Fleet size at 30 September 2011: 196 vessels
- Mainly barges, towing tugs, Anchor Handling Tugs, AHTS, ROV supportvessel and other vessels
- Vessels on time or bareboat charter to following industries:
i) Offshore Oil and Gas
ii) Marine Infrastructure
iii) Dredging, Land Reclamation and Marine Construction Works
iv) Transportation of Cargoes e.g. coal, aggregates, heavy equipment
Company Profile
77
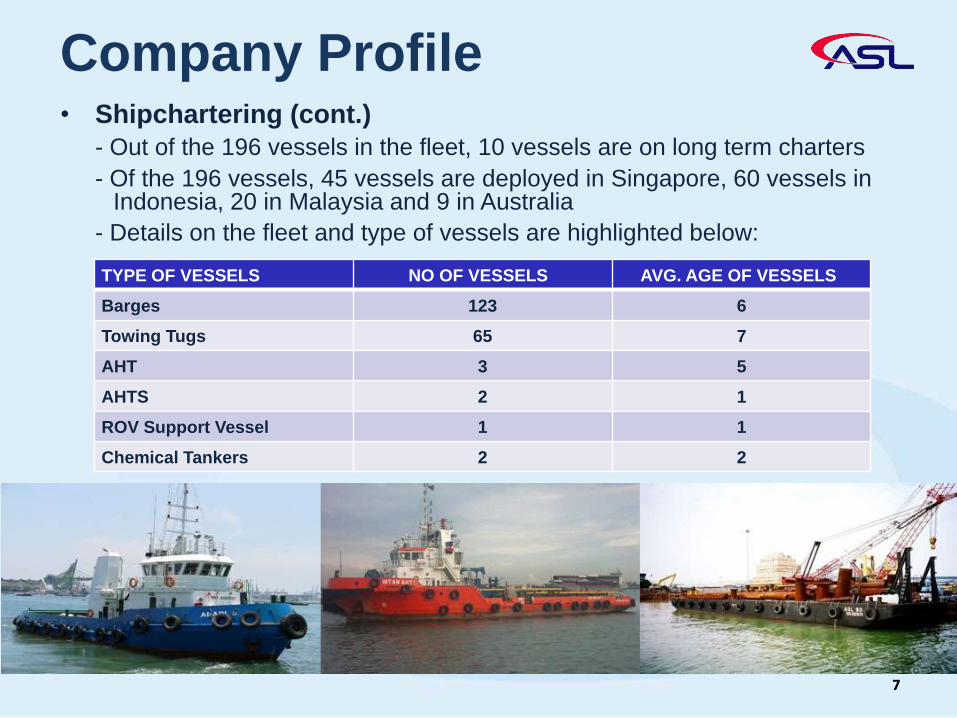
• Shipchartering (cont.)
- Out of the 196 vessels in the fleet, 10 vessels are on long term charters
- Of the 196 vessels, 45 vessels are deployed in Singapore, 60 vessels in Indonesia, 20 in Malaysia and 9 in Australia
- Details on the fleet and type of vessels are highlighted below:
Company Profile
TYPE OF VESSELS NO OF VESSELS AVG. AGE OF VESSELS
Barges 123 6
Towing Tugs 65 7
AHT 3 5
AHTS 2 1
ROV Support Vessel 1 1
Chemical Tankers 2 2
88
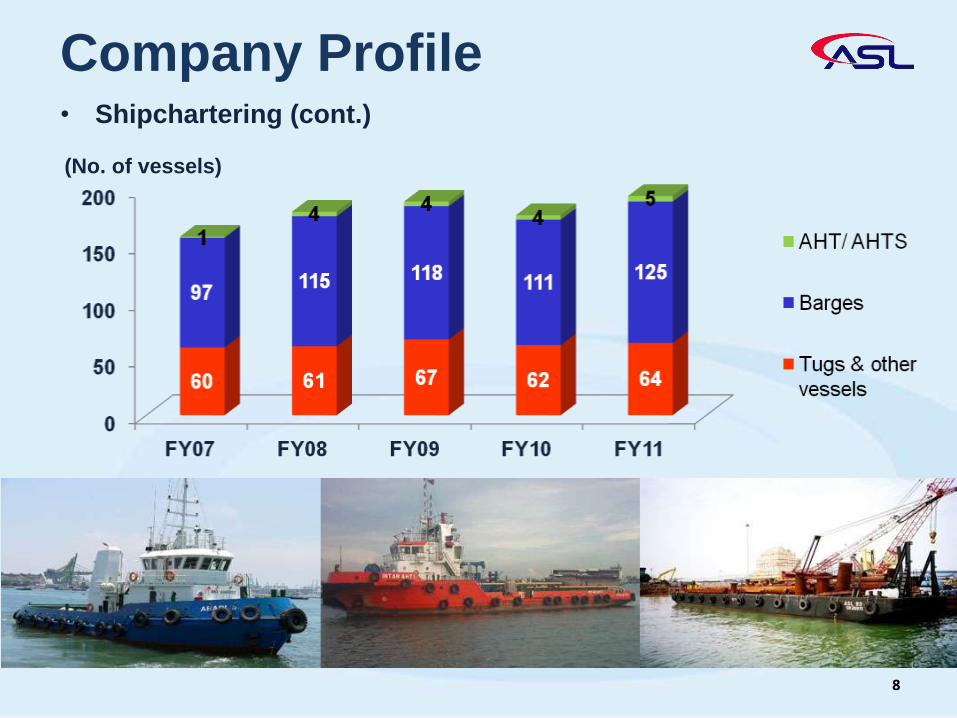
• Shipchartering (cont.)
Company Profile
(No. of vessels)

99
ASL MARINEFinancial Review

1010
Revenue Trend – 5 Yrs
318.4
400.4435.4
468.4
363.2
0.0
100.0
200.0
300.0
400.0
500.0
FY07 FY08 FY09 FY10 FY11
(S$’m)

1111
Profit Trend – 5 Yrs
(S$’m)
1212
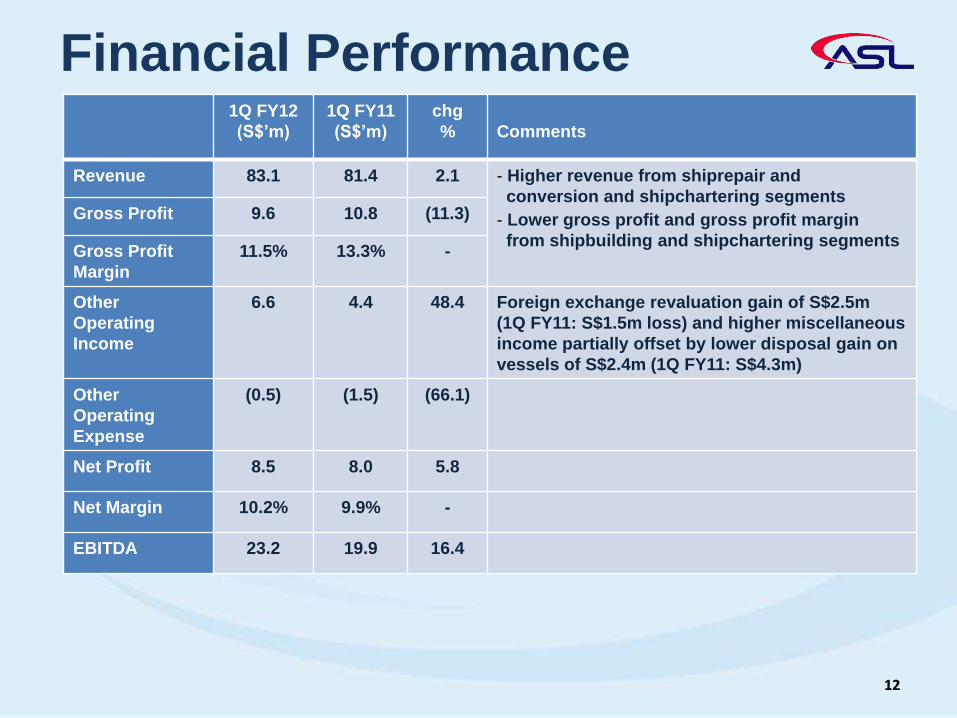
Financial Performance1Q FY12
(S$’m)
1Q FY11
(S$’m)
chg
% Comments
Revenue 83.1 81.4 2.1 - Higher revenue from shiprepair and
conversion and shipchartering segments
- Lower gross profit and gross profit margin
from shipbuilding and shipchartering segments
Gross Profit 9.6 10.8 (11.3)
Gross Profit
Margin
11.5% 13.3% -
Other
Operating
Income
6.6 4.4 48.4 Foreign exchange revaluation gain of S$2.5m
(1Q FY11: S$1.5m loss) and higher miscellaneous
income partially offset by lower disposal gain on
vessels of S$2.4m (1Q FY11: S$4.3m)
Other
Operating
Expense
(0.5) (1.5) (66.1)
Net Profit 8.5 8.0 5.8
Net Margin 10.2% 9.9% -
EBITDA 23.2 19.9 16.4

1313
Nm: Not meaningful
Cash Flows
Cash Flows (S$’m) 1Q FY12 1Q FY11
Chg
%
Net cash generated from operating activities 14.2 55.0 (74.2)
Net cash generated from/ (used in) investing activities
(Capital expenditure net of disposal)
4.0 (21.7) Nm
Net cash used in financing activities
(Borrowings net of repayments)
(4.0) (23.5) (82.9)
Net increase in cash 14.1 9.7 45.1
Cash at beginning of the period 44.8 83.3 (46.3)
Cash at end of the period 59.1 92.6 (36.1)

Based on weighted average of 1 419,511,294 shares in issue for 1Q FY12 (1Q FY11: 419,445,494)2 419,511,294 shares in issue for 1Q FY12 (1Q FY11: 419,463,041)3 419,511,294 shares as at 30 September 2011 and 30 June 2011
* The earnings per ordinary share (basic and fully diluted basis) for 1Q FY2011 have been restated taking into consideration the bonus share issuance on 29 December 2010.
Financial Ratios
14
1Q FY12 1Q FY11
Basic Earnings per Share1 (cents) 2.02 1.91*
Fully Diluted Earnings per Share2 (cents) 2.02 1.91*
Return on Equity (annualised) 9.7% 9.8%
Return on Total Assets (annualised) 4.0% 4.4%
As at 30 Sep 11 30 Jun 11
Net Asset Value per Share3 (cents) 81.24 80.05
Gearing Ratio 0.76 0.77
Net Gearing Ratio 0.57 0.62

1 Bonus shares on the basis of 4 bonus shares for every 10 existing shares were issued in December 2010
Share Price Information
15
As at 4 Jan 12 3 Jan 11
Share Price1 (S$) 0.50 0.75
Price Earnings Ratio 6.19 9.82
Price / Net Asset Value per Share 0.62 0.70
Market Capitalization (S$’m) 209.8 224.7
So
urc
e: B
loo
mb
erg

So
urc
e: B
loo
mb
erg
ASL vs Indices
16
STI
FSTOG
ASL
ASL’s share price versus STI and FTSE Straits Times Oil & Gas Index (FSTOG)
(for 1 January to 31 December 2011 – normalised graph based on %)

ASL MARINEOperation Overview

1818
Segmental Trend – 5 Yrs
Segmental Revenue Segmental Gross Profit
(S$’m) (S$’m)

Revenue S$83.1m (1Q FY11: S$81.4m) Gross Profit S$9.6m (1Q FY11: S$10.8m)
S$46.9m,
56%
S$49.0m,
60%
S$19.2m,
23%
S$17.4m,
21%
S$17.0m,
21%S$15.0m,
19%
0.0
10.0
20.0
30.0
40.0
50.0
60.0
70.0
80.0
90.0
1Q FY11 1Q FY12
S$3.2m,
33%
S$4.5m,
42%
S$3.9m,
41%
S$3.1m,
29%
S$2.5m,
26%
S$3.2m,
29%
0.0
2.0
4.0
6.0
8.0
10.0
12.0
1Q FY11 1Q FY12
Shipchartering
Shiprepair
Shipbuilding
Revenue and Gross Profit by Activities
(1QFY12 vs 1QFY11)
19
(S$’m) (S$’m)

2020
ShipbuildingRevenue (S$’m)
46.9
49.0
1Q FY11 1Q FY12
Gross Profit (S$’m)4.5
3.2
1Q FY11 1Q FY12
1Q FY12 revenue marginally lowerby S$2.1m to S$46.9m
1Q FY12 gross profit declined29.4% to S$3.2m with lower grossmargin at 6.8% (1Q FY12: 9.2%)due to higher cost provisions forcompleted projects
In 1Q FY12, 5 vessels weredelivered from the yards and 30vessels are being built

• Included secured orders announced in October 2011 worth S$267 million for 5vessels comprising 2 Platform Supply Vessels, 1 Dredger and 2 Barges
• Total outstanding order book of S$542 million comprised of 30 vessels withprogressive deliveries up to first quarter of 2014
(S$’m)
622
693
523
327 310
542
At 30 Jun 07 At 30 Jun 08 At 30 Jun 09 At 30 Jun 10 At 30 Jun 11 Current
Shipbuilding Order Book
21

2222
1 Diving Support Vessel, Offtake Support & Supply Vessels, AHTS, EmergencyResponse & Rescue Vessels and Platform Supply Vessels
2 Rotor Tugs and Azimuth Stern Drive Tugs
Shipbuilding Order BookType of Vessels Units S$’m %
Offshore Support Vessels1 16 294 54
Tugs2 8 60 11
Dredgers 2 182 34
Barges and other vessels 4 6 1
Total 30 542 100

2323
Vessel Delivery Schedule
3
2
1
2
11
3
2
3
9
21
0
2
4
6
8
10
1H FY12 2H FY12 1H FY13 2H FY13 1H FY14 2H FY14
Offshore
Support
Vessels
Dredgers
Barges and
other vessels
Tugs
(No. of vessels)

2424
Shiprepair and ConversionRevenue (S$’m)
19.2
17.4
1Q FY11 1Q FY12
Gross Profit (S$’m)3.9
3.1
1QFY11 1QFY12
1Q FY12 revenue increased by10.5% to S$19.2m due to a largership conversion job undertaken
1Q FY12 gross profit rose by 25.1%to S$3.9m at higher gross margin of20.6% (1Q FY11: 18.2%)
In 1Q FY12, the Group had most ofrevenue derived from repair oftankers
2525
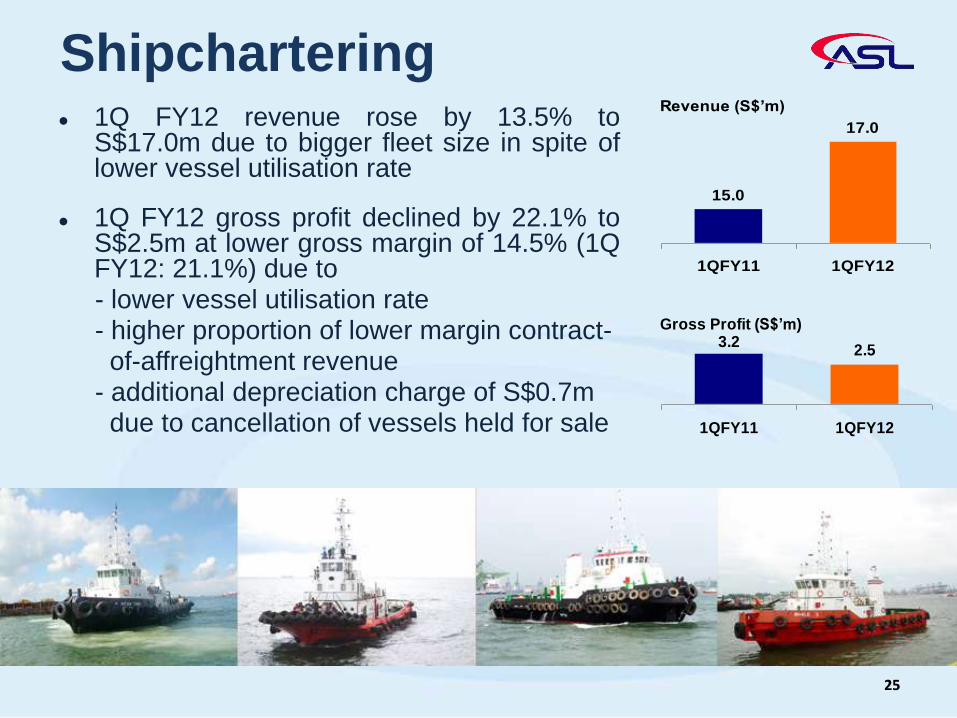
ShipcharteringRevenue (S$’m)
15.0
17.0
1QFY11 1QFY12
Gross Profit (S$’m)
2.53.2
1QFY11 1QFY12
1Q FY12 revenue rose by 13.5% toS$17.0m due to bigger fleet size in spite oflower vessel utilisation rate
1Q FY12 gross profit declined by 22.1% toS$2.5m at lower gross margin of 14.5% (1QFY12: 21.1%) due to- lower vessel utilisation rate- higher proportion of lower margin contract-of-affreightment revenue
- additional depreciation charge of S$0.7mdue to cancellation of vessels held for sale

ASL MARINEBusiness Outlook

2727
Shipbuilding
• Demand for new shipbuilding orders continue to be affected by uncertaintiesover global economy outlook
• Secured new orders worth S$267 million for 5 vessels comprised 2 PlatformSupply Vessels, 1 Dredger and 2 Barges
• Total outstanding order book of S$542 million for 30 vessels will sustainshipbuilding operations up to first quarter of 2014
Business Outlook
Shiprepair and Conversion
• Market conditions remain very competitive
• Demand underpinned by:
- Increasing world fleet
- Recurring and mandatory requirements to maintain sea worthiness ofvessels and to comply with requirement of classification societies
- Regional demand particularly within Indonesia
2828
Shiprepair and Conversion (cont’d)
• Well equipped facilities at Batam yard:
- 1 dry dock of 340 metres length (300,000 dwt)
- 2 medium-sized dry docks of 230 metres and 180 metres length
(60,000 dwt and 20,000 dwt)
• Establishing offshore services division to target on higher value offshore oiland gas related conversion and repair contracts (such as FSO and FPSO)
Business Outlook
Shipchartering
• Demand supported by:
- Domestic marine infrastructure, construction and land reclamationprojects e.g. port expansion, new international cruise terminal
- Transportation demand (e.g. coal & aggregates) in Indonesia and SouthEast Asia regions
- Offshore oil and gas activities in South East Asia and Australia
- Marine infrastructure, harbour and terminal services sectors in Australia
• Order book of S$57 million for long term charter contracts
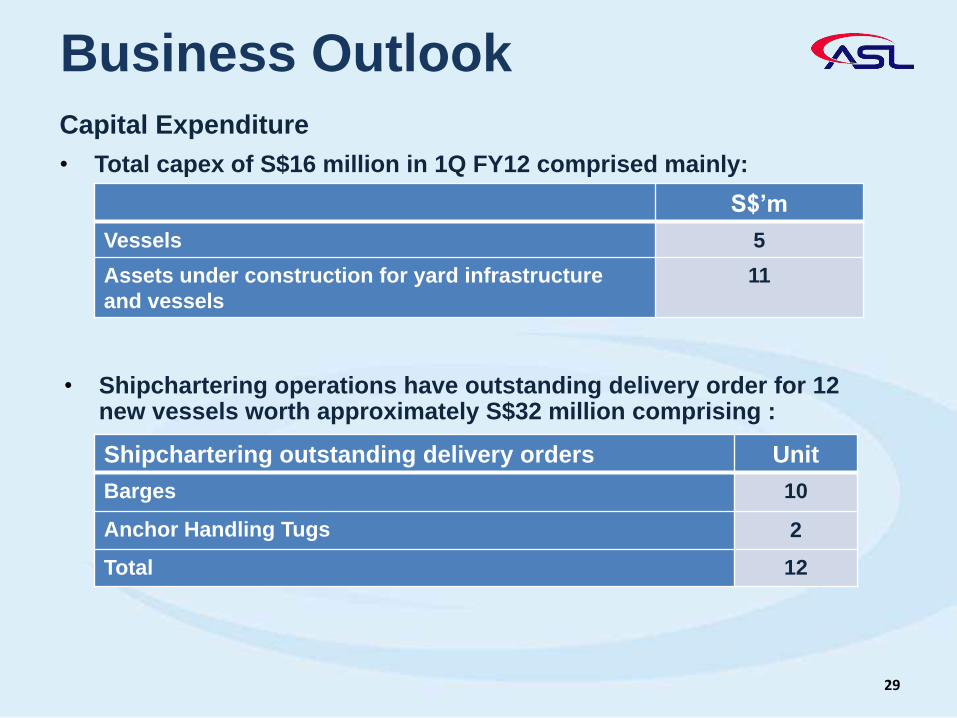
Capital Expenditure
• Total capex of S$16 million in 1Q FY12 comprised mainly:
Business Outlook
29
S$’m
Vessels 5
Assets under construction for yard infrastructure
and vessels
11
• Shipchartering operations have outstanding delivery order for 12new vessels worth approximately S$32 million comprising :
Shipchartering outstanding delivery orders Unit
Barges 10
Anchor Handling Tugs 2
Total 12
3030
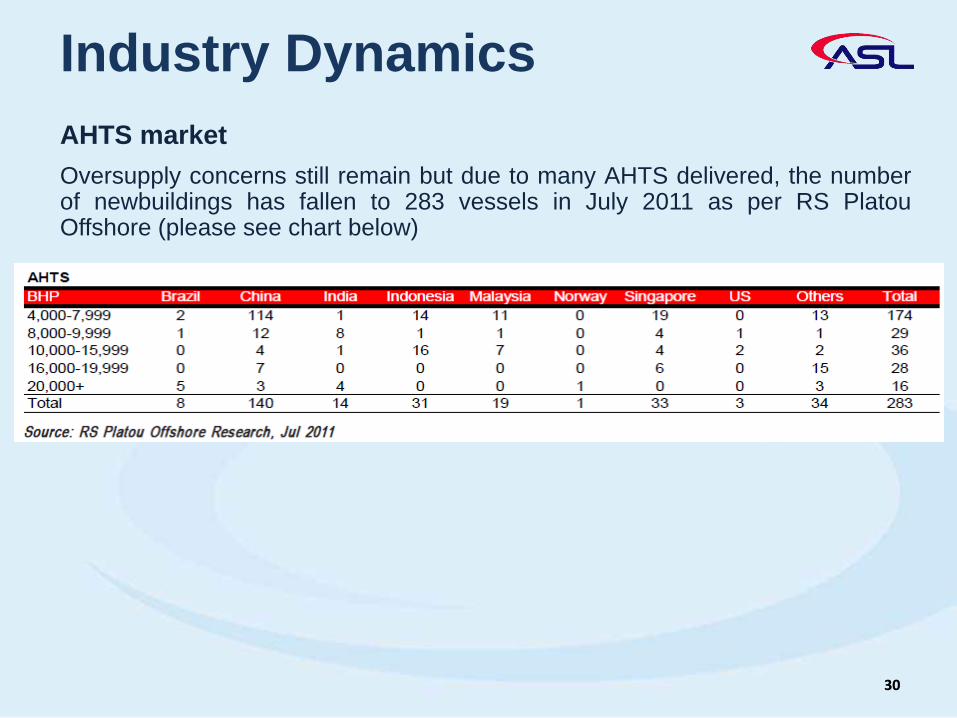
Industry Dynamics
AHTS market
Oversupply concerns still remain but due to many AHTS delivered, the numberof newbuildings has fallen to 283 vessels in July 2011 as per RS PlatouOffshore (please see chart below)

Industry Dynamics
PSV market
Demand for PSV newbuilds has recently been stronger than that of AHTS dueto growing interest in deepwater activities. Thus, the PSV-to-rig ratio is expectedto rise 4% over the next three years, compared to a 3% fall for the AHTS-to-rigratio, according to Pareto Research

3232
ASL MARINEThank You


