Eukaryotic metatranscriptome profiling identifies the unique responses of phytoplankton functional groups to deep water upwelling at station ALOHA Harriet Alexander 1 , Monica Rouco-Molina 2 , Sheean Haley 2 , Sonya Dyhrman 2 1 MIT/WHOI Joint Program in Oceanography 2 Earth and Environmental Science, Lamont-Doherty Earth Observatory, Columbia University
Transcript
Eukaryotic metatranscriptome profiling identifies the unique responses of phytoplankton functional groups to deep water upwelling at station ALOHA
1 MIT/WHOI Joint Program in Oceanography2 Earth and Environmental Science, Lamont-Doherty Earth Observatory, Columbia University
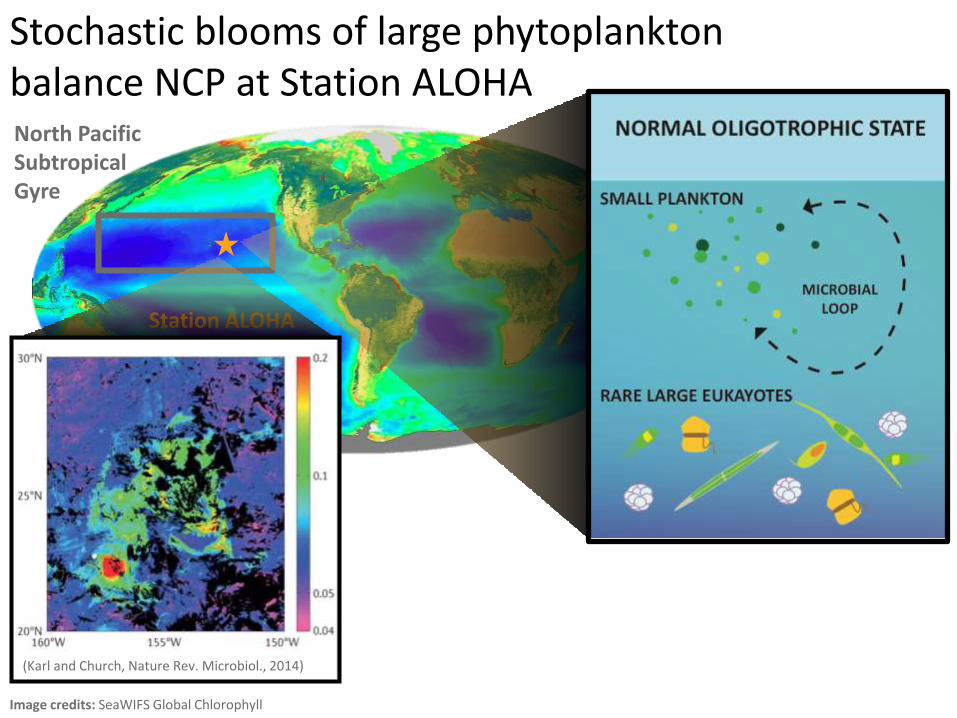
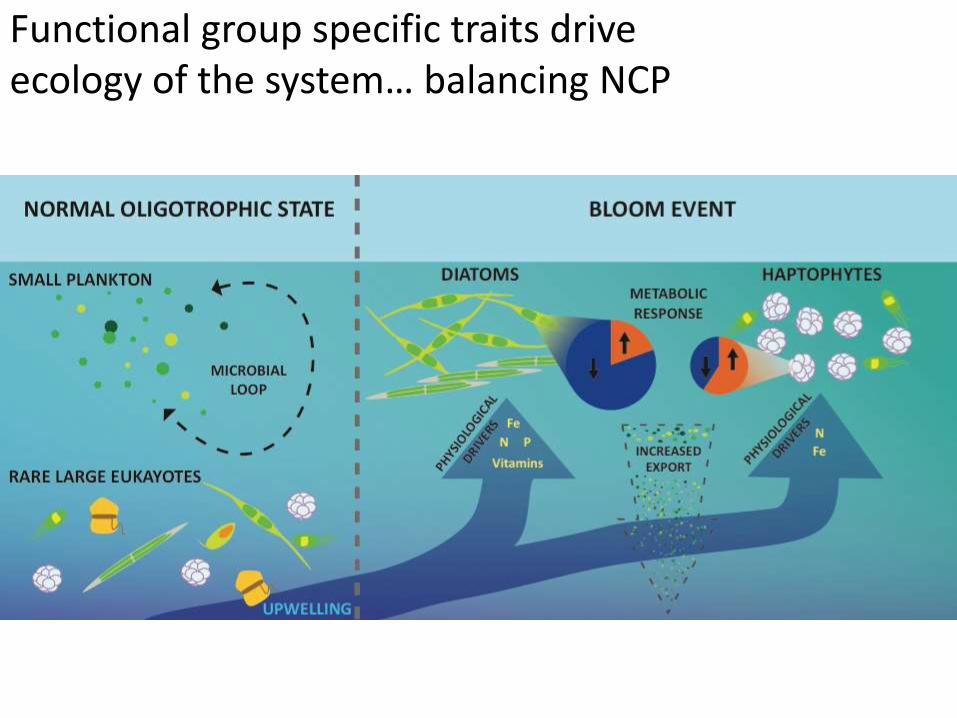
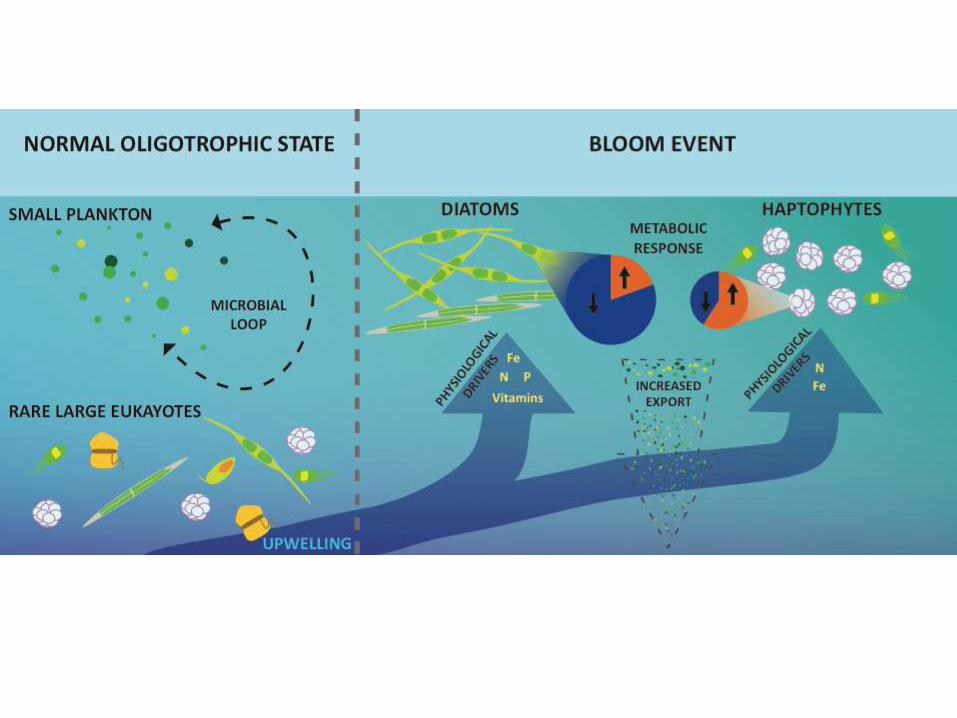
Stochastic blooms of large phytoplankton balance NCP at Station ALOHA
Image credits: SeaWIFS Global Chlorophyll
North Pacific Subtropical Gyre
Station ALOHA
(Karl and Church, Nature Rev. Microbiol., 2014)
0
100
200
8/6 8/10 8/14 8/23 8/27 8/31 9/89/4
S1 S2
0.9
0.6
0.3
0
CTD
Ch
loro
pig
me
nt
(μg
/L)
Pre
ssu
re (
db
ar)
S3
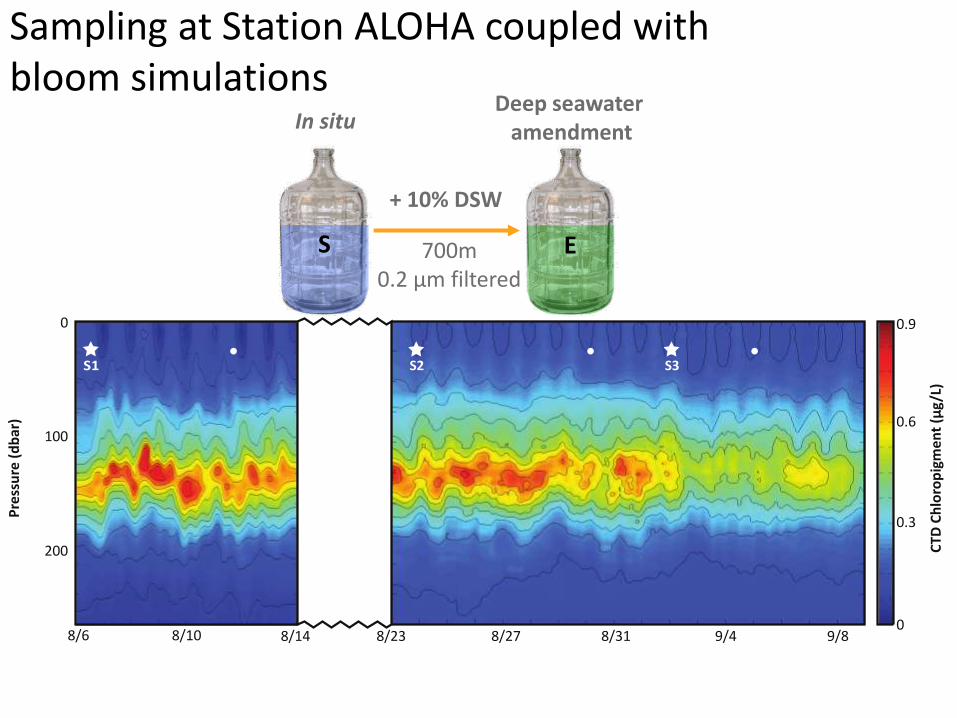
Sampling at Station ALOHA coupled with bloom simulations
+ 10% DSW
700m0.2 μm filtered
S
In situ
E
Deep seawater amendment
0
100
200
8/6 8/10 8/14 8/23 8/27 8/31 9/89/4
S1 S2
0.9
0.6
0.3
0
CTD
Ch
loro
pig
me
nt
(μg
/L)
Pre
ssu
re (
db
ar)
S3
E1S1 E2S2 E3S3
6 August 24 August 2 September0.0
0.4
0.8
1.2
0 h
168 h
Chlorophyll (mg m-3)
Start date of experiment
S1
E1
S2
E2
S3
E3
S = In situE = Experimental
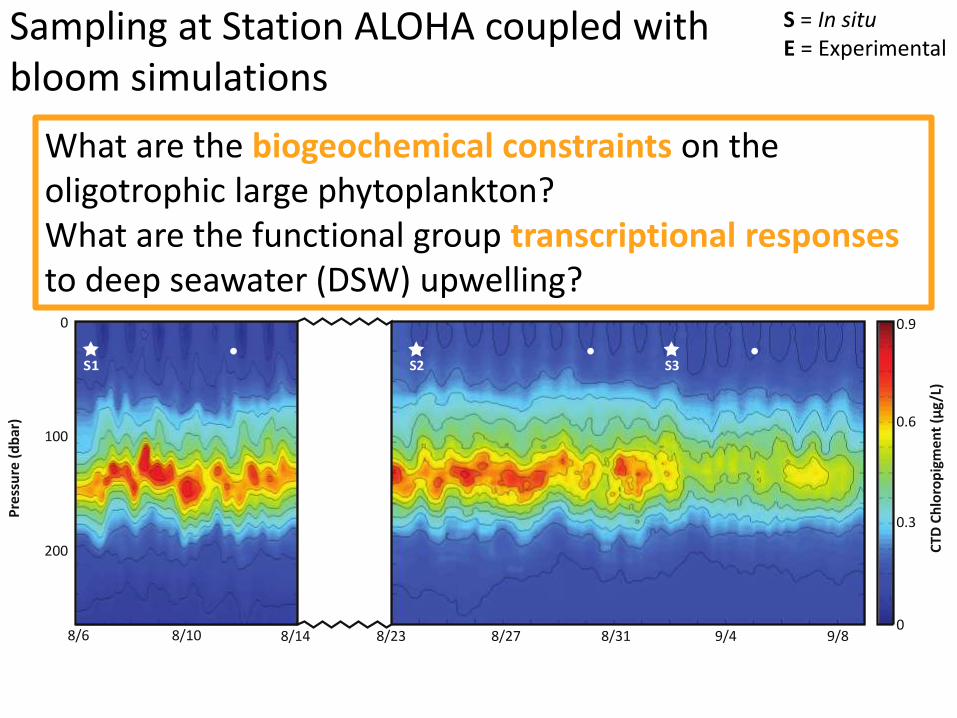
Sampling at Station ALOHA coupled with bloom simulations
0
100
200
8/6 8/10 8/14 8/23 8/27 8/31 9/89/4
S1 S2
0.9
0.6
0.3
0
CTD
Ch
loro
pig
me
nt
(μg
/L)
Pre
ssu
re (
db
ar)
S3
E1S1 E2S2 E3S3
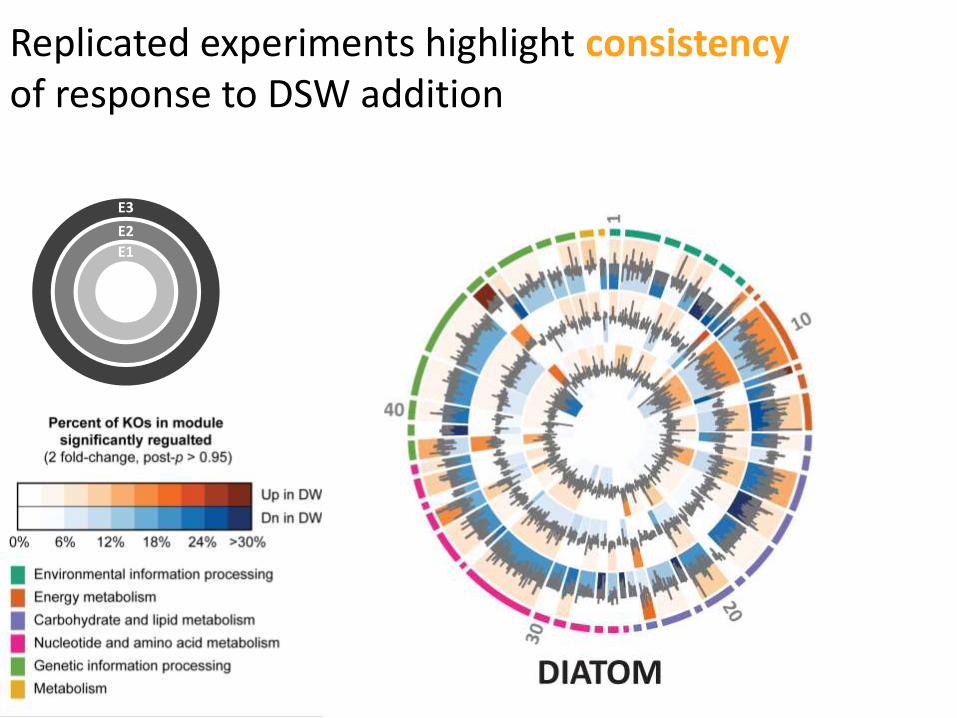
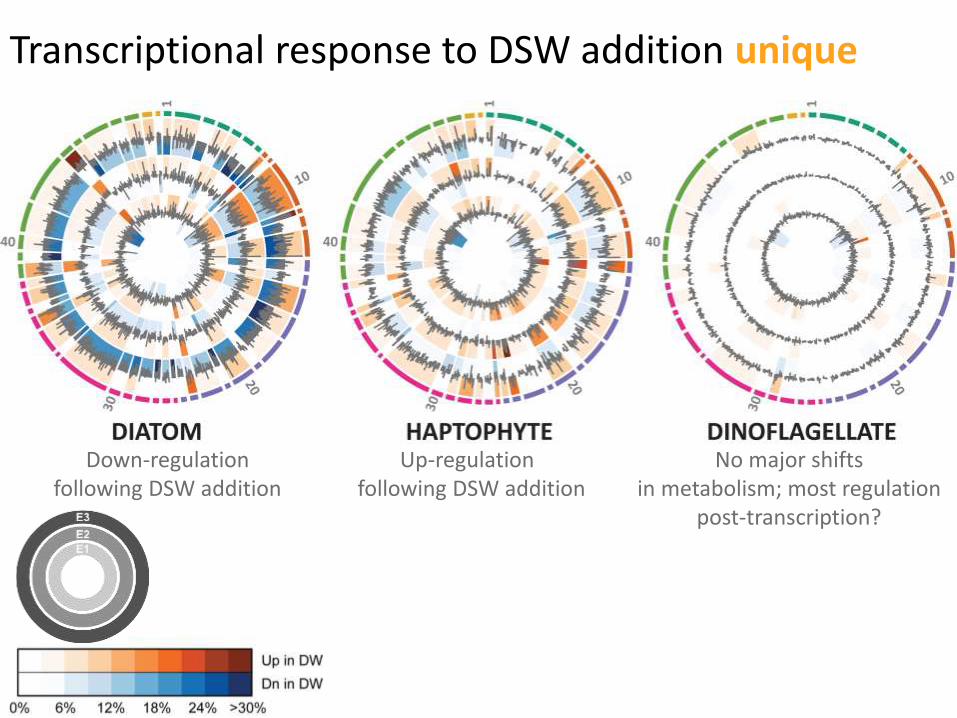
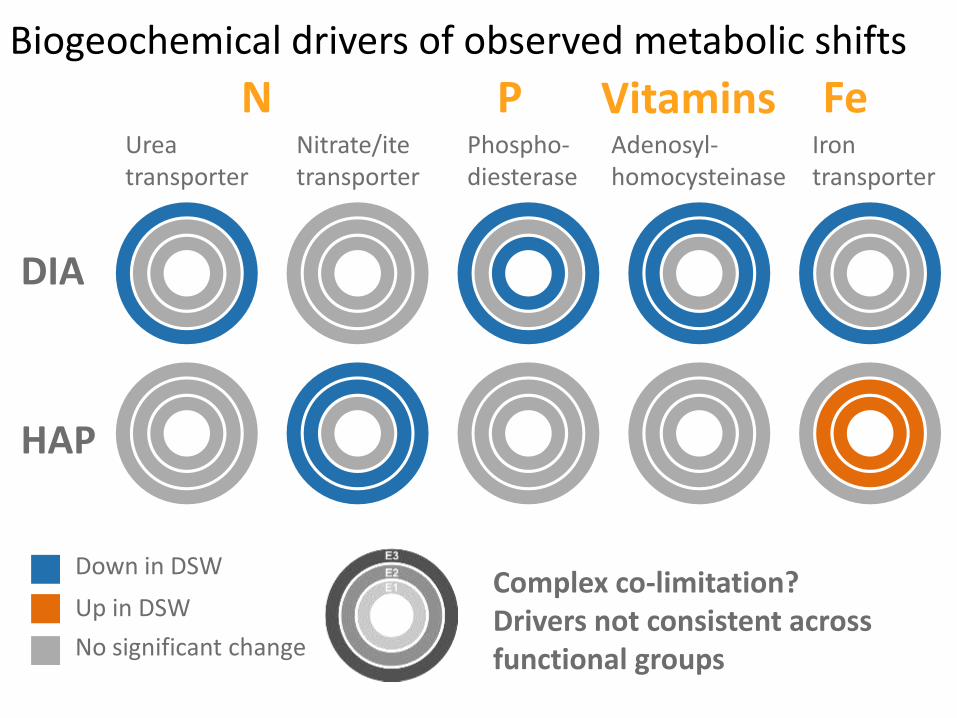
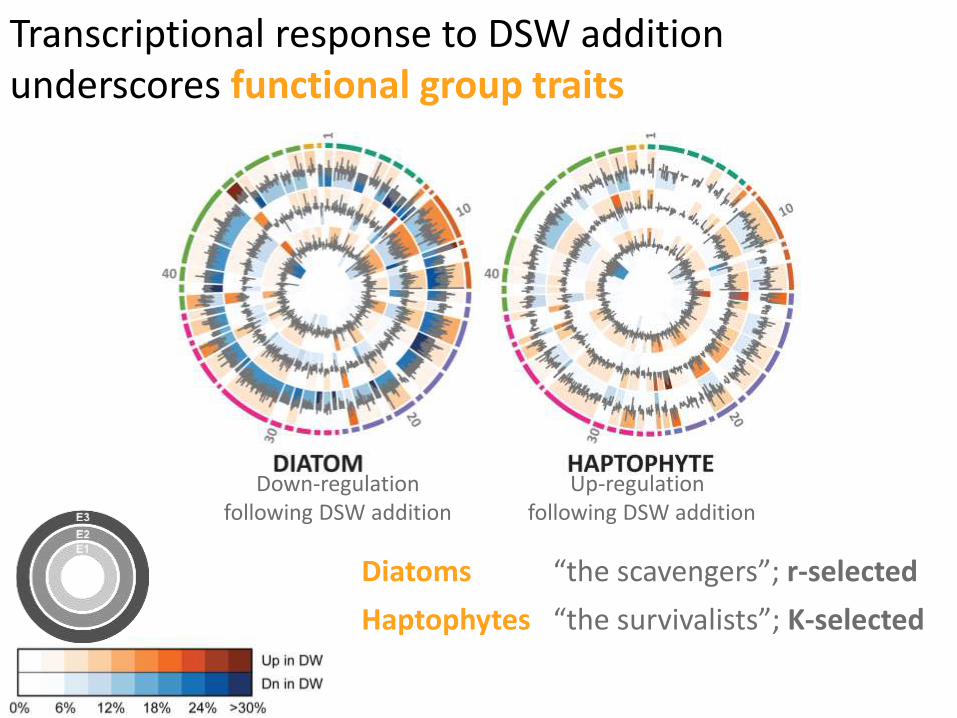
What are the biogeochemical constraints on the oligotrophic large phytoplankton? What are the functional group transcriptional responses to deep seawater (DSW) upwelling?
S = In situE = Experimental
Sampling at Station ALOHA coupled with bloom simulations