July 27, 2017 Mr. Ed Jones Washington State Department of Ecology, NWRO 3190 160th Avenue SE Bellevue, Washington 98008-5452 Re: West of 4 th Site Agreed Order #DE10402 Capital Industries Plant 4 Interim Action Work Plan Dear Mr. Jones: Please find enclosed the Capital Industries Plant 4 Interim Action Work Plan. This report was prepared by Farallon Consulting on behalf of the four potentially liable persons (PLPs) [Art Brass Plating, Blaser Die Casting, Capital Industries, and PSC Environmental Services, LLC] identified by Ecology in the Agreed Order #DE10402 for the West of 4 th Site. Sincerely, Aspect consulting, LLC Dana Cannon, LHG W4 Project Coordinator [email protected]Attachments: Capital Industries Plant 4 Interim Action Work Plan S:\Art Brass Plating 050067\W4 Ecology Correspondence\Cover Letters\CIPlant4_IAWP_072717.docx
Transcript
July 27, 2017
Mr. Ed Jones Washington State Department of Ecology, NWRO 3190 160th Avenue SE Bellevue, Washington 98008-5452
Re: West of 4th Site Agreed Order #DE10402 Capital Industries Plant 4 Interim Action Work Plan
Dear Mr. Jones:
Please find enclosed the Capital Industries Plant 4 Interim Action Work Plan. This report was prepared by Farallon Consulting on behalf of the four potentially liable persons (PLPs) [Art Brass Plating, Blaser Die Casting, Capital Industries, and PSC Environmental Services, LLC] identified by Ecology in the Agreed Order #DE10402 for the West of 4th Site.
Z:\457008 Feasibility Study\Working Folder\Interim Action Work Plan\Revised IA Cover Ltr 7-26-17.docx
Qual i ty Serv ice for Envi ronmenta l So lut ions | fara l lonconsu l t ing.com
July 27, 2017
Mr. Ed Jones, Project Manager Washington State Department of Ecology 3190 160th Avenue Southeast Bellevue, Washington 98008-5452
BY E-MAIL AND MAIL
RE: SITE UNIT 2 INTERIM ACTION WORK PLAN CAPITAL INDUSTRIES PLANT 4 BUILDING CAPITAL INDUSTRIES, INC., SEATTLE, WASHINGTON AGREED ORDER NO. DE 10402 FARALLON PN: 457-008
Dear Mr. Jones:
Farallon Consulting, L.L.C. (Farallon) has prepared an Interim Action Work Plan on behalf of Capital Industries, Inc. (Capital) for the property at 5801 3rd Avenue South in Seattle, Washington (herein referred to as the Capital Site). The proposed interim action will be conducted at the Capital Plant 4 building in accordance with Agreed Order No. DE 10402 entered into by potential liable persons (PLPs) that include Capital; Art Brass Plating, Inc.; Blaser Die Casting Co.; and PSC Environmental Services, LLC; and also with the Washington State Department of Ecology (Ecology) dated April 23, 2014 (Agreed Order). Capital and the other PLPs listed above are referred to collectively as the West of 4th Group. The West of 4th Group site under the Agreed Order consists of Site Unit 1 (SU1) and Site Unit 2 (SU2). The Capital Site is located within SU2.
This letter also includes the Ecology-required response to comments presented in the letter regarding West of 4th Site – Feasibility Study dated June 27, 2017, from Mr. Ed Jones of Ecology to Messrs. Mike Merryfield, Ronald S. Taylor, Kevin Callan, and Andy Maloy of the West of 4th Group, in which Ecology summarizes its position regarding the elimination of the SU2 pilot study and provides an alternative proposal to conduct an interim action at the Capital Plant 4 building while the SU1 pilot studies are being conducted.
INTERIM ACTION VERSUS PILOT STUDY STATUS
In December 2016, Ecology and the West of 4th Group agreed to evaluate the feasibility of select cleanup technologies via bench and/or field-scale pilot testing to reduce the time frame for cleanup and protect the Lower Duwamish Waterway. At that time, the West of 4th Group and Ecology concurred that the pilot study also would have a secondary benefit as a small-scale interim action that would reduce contaminant mass. Between December 2016 and June 2017, the West of 4th Group had numerous internal meetings and met with Ecology on several
Z:\457008 Feasibility Study\Working Folder\Interim Action Work Plan\Revised IA Cover Ltr 7-26-17.docx
Qual i ty Serv ice for Envi ronmenta l So lut ions | fara l lonconsu l t ing.com
occasions to reach concurrence on the scope and location for the SU2 pilot study/interim action. During those meetings, the location evolved from:
• Conducting the pilot study in an area near monitoring well CI-14 to;
• Conducting the pilot study north of monitoring well CI-14 along 1st Avenue South to;
• Conducting the pilot study near monitoring well CG-141 to;
• Conducting the pilot study near monitoring well CI-15; and to
• Conducting the pilot study in the areas of either monitoring well CG-141 or monitoring well CI-15.
Each location involved trade-offs between logistical and access difficulty, benefit as an interim action, and benefit as a pilot study for future implementation of the final remedy.
The selection of a location for the SU2 pilot study was further complicated by unresolved technical issues related to the degree to which the vinyl chloride concentrations in groundwater at the area near 1st Avenue South is comingled from multiple sources. In June 2017, during the most recent meeting between the West of 4th Group and Ecology, implementation of an interim action at the Capital Plant 4 building was suggested as a less than optimal alternative to implementing a pilot study/interim action near 1st Avenue South. It is the opinion of the West of 4th Group that the benefits of implementing an interim action at the Capital Plant 4 building outweigh the benefits of an unsatisfactory compromise to a pilot study near 1st Avenue South that would no longer meet the original pilot study objectives, and would require further protracted negotiations to reach concurrence. The basis for this opinion is summarized below:
• The West of 4th Group understand that reduction of high vinyl chloride concentrations at the areas of monitoring wells CG-141and CI-15 are a higher priority to Ecology than the tetrachloroethene/trichloroethene plume at the Capital Plant 4 building. However, the groundwater data at the locations of monitoring wells CG-141 and CI-15 indicate that vinyl chloride biodegradation is occurring based on elevated ethene and ethane concentrations. Monitoring wells down-gradient have historically also had low concentrations of vinyl chloride indicating that an imminent threat to the Lower Duwamish Waterway does not exist, hence Ecology not requiring an interim action during the Remedial Investigation/Feasibility Study phases of work. On this basis, delaying cleanup at the areas of monitoring wells CG-141 and CI-15 does not pose a risk to human health or the environment.
Z:\457008 Feasibility Study\Working Folder\Interim Action Work Plan\Revised IA Cover Ltr 7-26-17.docx
Qual i ty Serv ice for Envi ronmenta l So lut ions | fara l lonconsu l t ing.com
• The West of 4th Group has also been exploring possible additional investigation to resolve data gaps that will refine the conceptual site model for contaminant fate and transport near monitoring wells CG-141, CI-15, and CG-140. The objective of the additional investigation would be to resolve technical data gaps that contributed to the difficulty in selecting a location for the pilot test. Resolving these issues would likely provide a better understanding of the subsurface conditions and support an appropriate cleanup approach.
• The tetrachloroethene/trichloroethene plume at the Capital Plant 4 building is not an imminent threat to the Lower Duwamish Waterway, but the contamination is present in the Water Table Zone, which is not highly conducive to reductive dechlorination and will not readily naturally attenuate without further action. Consequently, the Water Table Interval contamination represents an ongoing vapor intrusion risk. Vapor intrusion risk and mitigation measures at the neighboring Pacific Food Systems building may be eliminated by conducting the interim action now.
In summary, replacing an SU2 pilot study near 1st Avenue South with an interim action at the Capital Plant 4 building will not affect evaluation of alternatives presented in the SU2 Feasibility Study Report. Further, the vinyl chloride at the areas of monitoring wells CG-141 and CI-15 is being biodegraded and does not represent an immediate threat to human health or the environment. The injection work that will be conducted during the SU1 pilot study and the proposed interim action at the Capital Plant 4 building will also provide information required to refine the understanding of the application of in situ chemical reduction technologies via direct injection. The SU2 PLPs believe that the interim action at the Capital Plant 4 building should be completed concurrently with the SU1 pilot studies. The West of 4th PLPs also will continue work voluntarily on refining the conceptual site model for the vinyl chloride concentrations in the areas of monitoring wells CG-141, CI-15, and CG-140. Understanding this area’s source and fate and transport will result in a more effective cleanup approach for concurrence by West of 4th PLPs and Ecology.
Z:\457008 Feasibility Study\Working Folder\Interim Action Work Plan\Revised IA Cover Ltr 7-26-17.docx
Qual i ty Serv ice for Envi ronmenta l So lut ions | fara l lonconsu l t ing.com
CLOSING
Farallon trusts that this quarterly progress report provides sufficient information for Ecology needs. If you have questions regarding this project, please contact the undersigned at (425) 295-0800.
Sincerely,
Farallon Consulting, L.L.C.
Jeffrey Kaspar, L.G., L.H.G. Principal Geologist
cc: Ron Taylor, Capital Industries, Inc. (by e-mail) Donald Verfurth, Gordon and Rees, L.L.P. (by e-mail)
E-mail with link to electronic copy on project website: Janet Knox, Pacific Groundwater Group Dana Cannon, Aspect Consulting Bill Carroll, Arrow Environmental Bill Beck, Stericycle Environmental Solutions
6.1.1 Field Implementation Work Plan ................................................. 6-1 6.1.2 Quarterly Status Reports .............................................................. 6-2 6.1.3 Interim Action Completion Report .............................................. 6-2
7.0 SCHEDULE AND REPORTING ..................................................................... 7-1
ii P:\457 Capital Indust\457008 Feasibility Study\Reports\IA Work Plan\457-008 Interim Action WP DFCR.docx
FIGURES Figure 1 Site Diagram
Figure 2 Property Diagram
Figure 3A Plant 4 Soil Analytical Results and Tetrachloroethene Soil Gas Results
Figure 3B Plant 4 Soil Analytical Results and Trichloroethene Soil Gas Results
Figure 3C Plant 4 Soil Analytical Results and Cis-1,2-Dichloroethene Soil Gas Results
Figure 4 Plant 4 Groundwater CVOC Results
Figure 5 Plant 4 ISCO Injection Points
TABLES Table 1 Summary of Soil Analytical Results for CI Plant 4
Table 2 Summary of Groundwater Analytical Results for CI Plant 4
Table 3 Summary of Preliminary Cleanup Levels
Table 4 Summary of Natural Attenuation and Water Quality Parameters
APPENDIX Appendix A A Citizen’s Guide to In Situ Chemical Oxidation
DRAFT—Issued for Regulatory Review
iii P:\457 Capital Indust\457008 Feasibility Study\Reports\IA Work Plan\457-008 Interim Action WP DFCR.docx
ACRONYMNS AND ABBREVIATIONS
Aspect Aspect Consulting
bgs below ground surface
CI Capital Industries, Inc.
cis-1,2-DCE cis-1,2-dichloroethene
CVOCs chlorinated volatile organic compounds
Ecology Washington State Department of Ecology
EPA U.S. Environmental Protection Agency
Farallon Farallon Consulting, L.L.C.
ISCO in-situ chemical oxidation
PCE tetrachloroethene
PCULs preliminary cleanup levels
PGG Pacific Groundwater Group
PLP potentially liable parties
RI Remedial Investigation
ROI radius of influence
SEPA State Environmental Policy Act
Site The West of 4th Group Site consisting of Site Unit 1 and Site
Unit 2
SU2 Site Unit 2
DRAFT—Issued for Regulatory Review
iv P:\457 Capital Indust\457008 Feasibility Study\Reports\IA Work Plan\457-008 Interim Action WP DFCR.docx
SU2 FS Report West of 4th Site Unit 2 Feasibility Study, Seattle, Washington
dated August 11, 2016, prepared by West of Fourth Group and
Pacific Groundwater Group
TCE trichloroethene
UIC underground injection control
West of 4th Group Art Brass Plating, Inc.; Blaser Die Casting Co.; Capital
Industries, Inc.; and PSC Environmental Services, LLC
Work Plan Draft Conceptual Interim Action Work Plan, Site Unit 2, Seattle,
Washington dated July 27, 2017, prepared by Farallon
Consulting, L.L.C. (this document)
DRAFT—Issued for Regulatory Review
1-1 P:\457 Capital Indust\457008 Feasibility Study\Reports\IA Work Plan\457-008 Interim Action WP DFCR.docx
1.0 INTRODUCTION
Farallon Consulting, L.L.C. (Farallon) has prepared this Interim Action Work Plan (Work Plan)
on behalf of Art Brass Plating, Inc.; Blaser Die Casting Co.; Capital Industries, Inc. (CI); and
Burlington Environmental, LLC1 (collectively referred to herein as the West of 4th Group), which
are the potentially liable parties (PLPs) at the West of 4th Group Site (herein referred to as the Site).
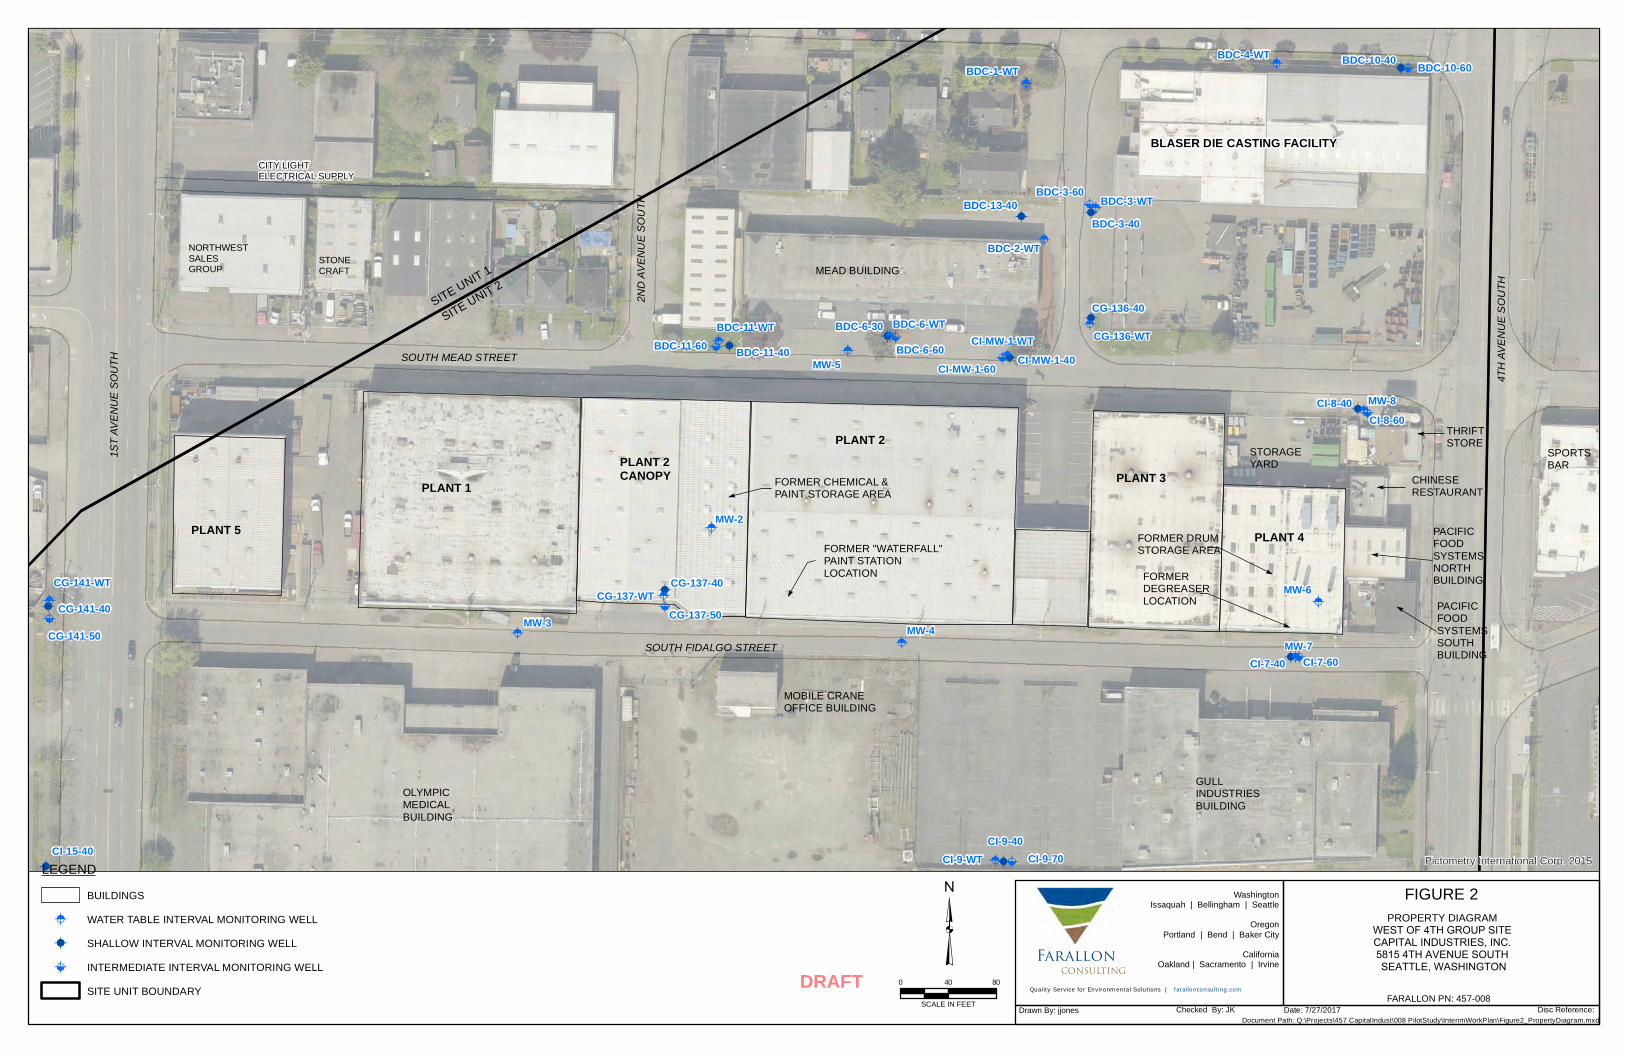
The Site consists of Site Unit 1 and Site Unit 2 (SU2) as depicted on Figure 1. The Art Brass
Plating, Inc. property is located at Site Unit 1. The CI and Blaser Die Casting Co. properties are
located at SU2. The CI property comprises five buildings identified as Plants 1 through 5 (Figure
2).
This Work Plan has been prepared in accordance with the requirements of Agreed Order No. DE
10402 entered into by the West of 4th Group and the Washington State Department of Ecology
(Ecology) in April 2014, and the Washington State Model Toxics Control Act Cleanup Regulation
as established in Chapter 173-340 of the Washington Administrative Code.
1.1 OBJECTIVE
The purpose of the Work Plan is to provide the general conceptual overview and framework for
implementation of an in-situ chemical oxidation (ISCO) interim action at CI Plant 4 (Figure 2) in
SU2 as discussed in the West of 4th Site Unit 2 Feasibility Study, Seattle, Washington dated August
11, 2016, prepared by West of Fourth Group and Pacific Groundwater Group (PGG) (West of
Fourth Group and PGG 2016) (SU2 FS Report). The ISCO technology that will be used includes
direct injection of potassium permanganate into the subsurface to treat shallow soil and
groundwater. The objectives of the interim action are tied to the remedial action objectives for the
Site as described in the SU2 FS Report and include:
• Reduce chlorinated volatile organic compound (CVOC) concentrations in soil beneath CI
Plant 4 to concentrations less than the preliminary cleanup levels (PCULs) for the Site to
reduce inhalation risks to acceptable levels;
1 Burlington Environmental, LLC, is a wholly owned subsidiary of PSC Environmental Services, LLC, which is a wholly owned subsidiary of Stericycle Environmental Solutions, Inc.
DRAFT—Issued for Regulatory Review
1-2 P:\457 Capital Indust\457008 Feasibility Study\Reports\IA Work Plan\457-008 Interim Action WP DFCR.docx
• Reduce CVOC concentrations in shallow groundwater that allegedly originated from CI
Plant 4 to concentrations less than the PCULs for the Site; and
• Reduce risk of recontamination of soil and/or shallow groundwater beneath CI Plant 4 from
up-gradient sources off the CI property to the extent practicable.
The Work Plan provides sufficient detail regarding the interim action for Ecology to approve
proceeding under Agreed Order No. DE 10402. A detailed Field Implementation Work Plan that
includes a Health and Safety Plan, Sampling and Analysis Plan, and Quality Assurance
Performance Plan, as described in Section 6.0, will be prepared following approval of this
conceptual Work Plan.
1.2 ORGANIZATION
This Work Plan summarizes pertinent background information and provides context and a general
framework for the ISCO interim action at SU2. This Work Plan is organized into the following
sections:
• Section 1, Introduction, presents an overview of the Site, and the objectives and
organization of the Work Plan;
• Section 2, Background, presents background information, including a summary of
relevant investigations and a description of the constituents of concern that will be targeted
The oxidation of PCE and vinyl chloride will be similar, with varying amounts of the byproducts
in the above reaction being produced.
Injection of potassium permanganate will be implemented through direct-push ISCO injection
points. At this time, the radius of influence (ROI) is anticipated to range from 5 to 20 feet and will
be dependent on the soil types within the vadose and saturated zones, as well as the injection
pressures that can be applied. No pilot testing has been performed for injection work; therefore,
the ISCO injections for the interim action will be phased to first evaluate the ROI and concentration
of potassium permanganate that will be effective prior to conducting a second series of injections.
The proposed injection locations are depicted on Figure 5. Effectiveness of ISCO will be evaluated
in accordance with the monitoring program described in Section 5.6, Monitoring.
5.2 BASELINE GROUNDWATER SAMPLING
Baseline groundwater samples will be collected from Water Table Interval monitoring wells MW-
6 and MW-7. The groundwater sampling will be conducted in general accordance with standard
procedures cited in the technical memorandum regarding FINAL West of 4th Groundwater
Monitoring Program Plan 2017 through Draft Cleanup Action Plan, W4 Joint Deliverable, Agreed
Order No. DE 10402 dated March 21, 2017, from Ms. Janet Knox of PGG to Mr. Ed Jones of
Ecology (PGG 2017). The groundwater samples will be submitted to a Washington-accredited
laboratory for analysis for CVOCs by EPA Method 8260C. Additional geochemical parameters
that will be directly measured during sample collection using field instrumentation will include
temperature, pH, dissolved oxygen, oxidation-reduction potential, and specific conductance.
5.3 PERMITTING
Ecology requires an Underground Injection Control (UIC) permit prior to injection of any material
into groundwater. Farallon will secure the UIC permit for the ISCO injection. Farallon will also
prepare a State Environmental Policy Act (SEPA) checklist for submittal to Ecology prior to
implementation of the interim action.
DRAFT—Issued for Regulatory Review
5-3 P:\457 Capital Indust\457008 Feasibility Study\Reports\IA Work Plan\457-008 Interim Action WP DFCR.docx
5.4 UTILITY CLEARANCE
Public and private utility locating services will be contracted to clear the proposed ISCO injection
and confirmation boring locations prior to drilling activities. Information pertaining to the
locations of subsurface utilities will be documented for future reference. Drilling locations may
be modified as necessary during field activities based on access considerations and the locations
of utilities and other features.
5.5 INTERIM ACTION APPROACH
Typical ROIs for injections range from 2.5 feet for tight clays to 25 feet in permeable saturated
soils (Interstate Technology Regulatory Council 2005). Subsurface environments are rarely
homogeneous and isotropic, and the injection design must also take this into account. Pilot testing
is typically necessary to understand the variation in ROI and enable effective distribution of the
oxidant throughout the subsurface. The potassium permanganate will be injected in two stages.
Stage 1 is intended to evaluate the logistics of injecting into the vadose zone and the Water Table
Interval prior to implementing the full-scale interim action. Distribution of potassium
permanganate will be verified by drilling performance borings to visually confirm the presence of
potassium permanganate at varying distances and directions from the Stage 1 ISCO injection
points. Stage 1 performance monitoring also will include a second series of performance sampling
to evaluate when the potassium permanganate is expended and the post-injection CVOC
concentrations in soil and groundwater. The two performance sampling events will provide data
on the ROI/distribution and dosing to inform any necessary changes to the Stage 2 phase of the
interim action. Stage 2 is the full-scale implementation of the interim action. Stage 2 injections
will target soil and Water Table Interval groundwater with ISCO. Performance and/or
confirmation soil and groundwater sampling will be conducted to evaluate the effectiveness of the
full-scale ISCO injections.
Additional stages of ISCO injection may be required to achieve the interim action objectives based
on the performance and confirmation monitoring results obtained after completion of Stages 1 and
2.
DRAFT—Issued for Regulatory Review
5-4 P:\457 Capital Indust\457008 Feasibility Study\Reports\IA Work Plan\457-008 Interim Action WP DFCR.docx
The proposed injection locations are depicted on Figure 5. The conceptual layout at this time
includes a grid pattern throughout CI Plant 4 that is currently on 20-foot centers. The results of
the Stage 1 pilot testing described in Section 5.5.1 will be used to refine the spacing for borings
focused on treatment of CVOCs in the vadose zone and saturated zone.
5.5.1 Stage 1 - Pilot Testing Stage 1 will be conducted by advancing three ISCO injection points to evaluate the ROI in:
• The silty sand in the upper portion of the vadose zone at ISCO injection location B3;
• The vadose zone where the highest concentrations of PCE and TCE are present in the silt
with sand layer at approximately 1 foot bgs and extending to a depth of approximately 6
feet bgs at ISCO injection location F5; and
• The Water Table Interval and extending up into the vadose zone at ISCO injection location
E5.
Injection pressure, flow, and volume will be monitored throughout the injection. Sudden changes
in these parameters usually indicate the injected materials have found a path of less resistance and
are perhaps surfacing.
Performance borings will be advanced after Stage 1 has been completed, to assess the effectiveness
of the ISCO injections under these three scenarios. Details of the performance monitoring are
presented in Section 5.6, Monitoring. The performance monitoring will provide data on the ROI,
oxidant demand/lifespan in the subsurface, and whether a 3 percent concentration of potassium
permanganate is adequate to overcome the natural oxidant demand and reduce concentrations of
the CVOCs to less than the PCULs for soil and groundwater. The groundwater data will also be
used to assess the potential for rebound of CVOCs following the initial injection event.
5.5.2 Stage 2 – Full-Scale Implementation For the purpose of this Work Plan, it is assumed that a 20-foot ROI can be achieved. Based on the
assumed ROI, 23 injection points will be necessary to treat the CVOC-affected area at CI Plant 4
(Figure 5). The full-scale injection details regarding the potassium permanganate concentration
and number of injection points will be based on performance data collected during Stage 1. The
DRAFT—Issued for Regulatory Review
5-5 P:\457 Capital Indust\457008 Feasibility Study\Reports\IA Work Plan\457-008 Interim Action WP DFCR.docx
final ROI may vary depending on the target injection zone (i.e., vadose versus saturated) and will
be adjusted accordingly to achieve the interim action objectives.
Following the initial full-scale injection event, performance sampling will be conducted as
described in Section 5.6, Monitoring. The time frame for conducting the sampling will be based
on the Stage 1 pilot testing results, which provide an estimate of the potassium permanganate
lifespan in the subsurface. The sampling will include advancing direct-push borings to evaluate
CVOC concentrations in soil and the ROI.
Groundwater will also be evaluated as described in Section 5.6, Monitoring. Following treatment,
if CVOC concentrations in groundwater begin to rebound, supplemental ISCO applications may
be necessary to achieve the interim action objectives. CVOC concentrations will rebound if the
chemical oxidant does not come into direct contact with the affected soil that is the source of the
dissolved-phase CVOCs in groundwater, or if the chemical oxidant is expended before all the
contamination is treated. The potential for rebound of CVOCs may take several weeks or months
to evaluate, depending on the lifespan of the potassium permanganate in the subsurface and the
rate of dissolution from the affected soil to groundwater.
The soil and groundwater performance monitoring data will be used to evaluate whether additional
ISCO injection events are necessary to meet the interim action objectives. It is likely that
additional events will be necessary; however, the areas containing residual CVOCs that exceed the
PCULs for soil are expected to become progressively smaller.
5.6 MONITORING
The effectiveness of the ISCO injections will be evaluated through:
• Assessment of the physical distribution of the potassium permanganate in the subsurface
by advancing performance borings within the anticipated ROI of the ISCO injections;
• Advancement of performance and confirmation borings near previous soil borings P4-B1
through P4-B9 to confirm that concentrations of CVOCs have been reduced to
concentrations less than the PCULs protective of air and surface water quality. If the data
from the borings proximate to existing borings confirm that CVOC concentrations are less
DRAFT—Issued for Regulatory Review
5-6 P:\457 Capital Indust\457008 Feasibility Study\Reports\IA Work Plan\457-008 Interim Action WP DFCR.docx
than the PCULs, supplemental confirmation soil borings will be advanced in other areas of
CI Plant 4 to confirm the soil cleanup; and
• Monitoring groundwater in Water Table Interval monitoring wells MW-6 and MW-7 to
assess whether concentrations of CVOCs have been reduced to concentrations less than the
applicable PCULs and whether rebound occurs, indicating that the CVOCs in soil that are
affecting groundwater have not been fully treated.
Farallon will contract with a drilling company that will advance performance and confirmation
borings using a limited-access direct-push drill rig. Soil cores will be collected continuously from
approximately 0 to 25 feet bgs. Soil samples will be collected from depths at which historical soil
sampling at CI Plant 4 indicated CVOCs exceeding the PCULs existed. Upon completion, the
borings will be backfilled with bentonite grout to approximately 1 foot from the ground surface to
mitigate settling, and patched with concrete at the ground surface to match the existing grade. The
bentonite grout will mitigate the potential for surfacing of future ISCO injections that may be
required and also eliminate preferential pathways at the potential locations of future ISCO
injections.
Farallon will monitor the effectiveness of the Stage 2 ISCO injections for groundwater treatment
at Water Table Interval monitoring wells MW-6 and MW-7 monthly for a period of 3 months. The
results of the initial monitoring will be evaluated to determine whether additional ISCO injections
targeting the Water Table Interval are necessary to meet the interim action objectives, or whether
the monitoring frequency can be decreased to monitor attenuation of CVOCs. The monitoring
work will be conducted as described in the sections herein.
5.6.1 Stage 1 ISCO Performance Monitoring Performance monitoring for Stage 1 injections will be accomplished through advancement of post-
injection performance borings within the assumed ROI of 20 feet to visually observe the
distribution of potassium permanganate. Potassium permanganate will cause the soil to exhibit a
purple to pink hue based on distribution and concentration, which becomes black as the soil is
exposed to air. Performance borings will be advanced the same day or the day following the Stage
1 ISCO injections.
DRAFT—Issued for Regulatory Review
5-7 P:\457 Capital Indust\457008 Feasibility Study\Reports\IA Work Plan\457-008 Interim Action WP DFCR.docx
Three performance borings will be drilled around each Stage 1 ISCO injection point in a triangular
configuration at various distances and directions from the injection point to assess the distribution
of potassium permanganate. These performance borings will be advanced at distances of 5 feet
north, 10 feet southeast, and 15 feet southwest of each Stage 1 ISCO injection point and to the
total depth of the ISCO injection point to assess the actual injection radius of each pilot test
injection location and the distribution of the potassium permanganate within the soil matrix. These
data will be used to adjust spacing between injection points and vertical injection volume for
subsequent injection points, and possibly the method of ISCO delivery, to maximize distribution
in the soil matrix.
A second series of performance monitoring borings will be advanced within 2 weeks of the
injection event to evaluate the effect of the ISCO on CVOC concentrations in soil within the ROI
established during the initial performance monitoring drilling event described above. Visual
observations of whether the potassium permanganate persists will be made. If evidence is
discovered that the potassium permanganate persists, further sampling will be discontinued for a
period of 2 weeks to allow more time for the potassium permanganate to react. If the potassium
permanganate appears expended, soil samples will be collected at depths where previous sampling
indicated CVOCs were detected, and submitted to the analytical laboratory for analysis for CVOCs
by EPA Method 8260C. The results will be used to evaluate whether the initial 3 percent
concentration of potassium permanganate is sufficient to overcome the natural oxidant demand of
the soil matrix and also reduce CVOC concentrations to less than the PCULs.
Performance monitoring in groundwater within the Water Table Interval will be conducted within
2 weeks of the injection event to evaluate the effect of the ISCO injection on CVOC concentrations
in groundwater. Groundwater samples collected during the post-Stage 1 performance monitoring
event will be analyzed for CVOCs by EPA Method 8260C.
The concentration of potassium permanganate solution that will be used for the Stage 2 ISCO
injections will be adjusted based on the Stage 1 performance sampling data.
DRAFT—Issued for Regulatory Review
5-8 P:\457 Capital Indust\457008 Feasibility Study\Reports\IA Work Plan\457-008 Interim Action WP DFCR.docx
5.6.2 Stage 2 ISCO Performance Monitoring and Confirmation Sampling Stage 2 ISCO compliance monitoring will include soil and groundwater sampling to evaluate the
effectiveness of the ISCO injections on meeting the interim action objectives. Performance soil
sampling conducted post Stage-2 ISCO injections may be used as confirmation sampling data if
the analytical results indicate the PCULs have been achieved within the grid area.
Performance soil sampling will be conducted using direct-push drilling once the potassium
permanganate is expended. The time frame for when the oxidant will likely be expended will be
based on the results of the Stage 1 pilot testing and adjusted accordingly if the concentration of
potassium permanganate is altered for the Stage 2 injection work. A grid will be established within
the CI Plant 4 injection area based on the ROI established during the Stage 1 pilot testing. At this
time one boring per grid, which may be modified due to areas within CI Plant 4 that cannot be
readily accessed, is presumed to be sufficient to evaluate the ISCO effectiveness. The initial
performance monitoring will be limited to locations in the southeastern corner of CI Plant 4 where
the highest concentrations of CVOCs in shallow soil have been documented. This area will be
used to evaluate whether the PCULs have been obtained or whether additional ISCO injection
work is required.
At this time, up to six performance sampling borings are planned to be advanced to depths of up
to 10 feet bgs to evaluate CVOC concentrations in soil. Continuous soil cores will be collected
and soil samples will be collected for laboratory analysis at depths of 1, 3, 5, 7, and 10 feet bgs.
All soil samples will be submitted to the analytical laboratory for analysis for CVOCs by EPA
Method 8260C. The results of the initial performance monitoring results will be used to evaluate
whether additional ISCO injection is required or whether confirmation soil sampling throughout
the affected areas of CI Plant 4 can be conducted. The soil sampling details will be presented in
the Field Implementation Work Plan.
If confirmation soil sampling is warranted, direct-push borings will be advanced throughout the
remaining grid locations within CI Plant 4 following the same sampling intervals identified above.
The confirmation soil sampling work will be confirmed with Ecology following receipt of the
results of the performance soil sampling. The performance soil sampling work will also be used
DRAFT—Issued for Regulatory Review
5-9 P:\457 Capital Indust\457008 Feasibility Study\Reports\IA Work Plan\457-008 Interim Action WP DFCR.docx
to evaluate the scope of future ISCO injections, which will also be presented to Ecology for
discussion prior to implementing the injection work.
5.6.3 Groundwater Monitoring Monthly post-injection groundwater sampling will be conducted for the first 3 months and
quarterly for the first year at Water Table monitoring wells MW-6 and MW-7. Whether
groundwater sampling is necessary for longer than 1 year following the final ISCO injections will
be evaluated based on evaluation of the initial year of sampling data. The groundwater sampling
will be conducted in general accordance with standard procedures cited in the technical
memorandum regarding FINAL West of 4th Groundwater Monitoring Program Plan 2017 through
Draft Cleanup Action Plan (PGG 2017), with the ultimate goal of reducing CVOC concentrations
in the Water Table Interval to less than the applicable PCULs. The groundwater samples will be
submitted to a Washington-accredited laboratory for analysis for CVOCs by EPA Method 8260C.
Additional geochemical parameters that will be directly measured during sample collection using
field instrumentation will include temperature, pH, dissolved oxygen, oxidation-reduction
potential, and specific conductance. Additionally, monitoring wells will be sampled to confirm
oxidant distribution. Potassium permanganate can be detected in groundwater by its purple color.
If groundwater in Water Table Interval monitoring wells MW-6 and/or MW-7 is purple, the well
will not be sampled until the oxidant is expended. Groundwater samples collected while potassium
permanganate is present would not be representative for performance monitoring purposes.
DRAFT—Issued for Regulatory Review
6-1 P:\457 Capital Indust\457008 Feasibility Study\Reports\IA Work Plan\457-008 Interim Action WP DFCR.docx
6.0 INTERIM ACTION DOCUMENTATION
This section summarizes the interim action documents that will be generated during the interim
action activities.
6.1 PROJECT DOCUMENTS AND REPORTING
6.1.1 Field Implementation Work Plan A Field Implementation Work Plan for the interim action will be submitted to Ecology following
Ecology approval of this Work Plan in accordance with the schedule presented in Section 7.0,
Schedule and Reporting. The Field Implementation Work Plan will provide additional details
regarding implementation of the interim action, including the final ISCO injection locations, ISCO
injection design criteria, performance monitoring details, criteria for evaluating effectiveness of
the interim action, and reporting requirements based on comments from Ecology regarding this
Work Plan. The Field Implementation Work Plan will also include the following supporting
documents.
6.1.1.1 Sampling and Analysis Plan
The Field Implementation Work Plan will include a Sampling and Analysis Plan to guide
the sampling efforts associated with the interim action. The Sampling and Analysis Plan
will include a discussion of sample locations and frequency to establish baseline
groundwater conditions prior to the interim action and monitor the effectiveness of the
interim action for up to 1 year following injection of the potassium permanganate.
The Sampling and Analysis Plan will include standard operating procedures related to the
specific field tasks that will be performed during the interim action. These standard
operating procedures may include field sampling and documentation, soil sampling,
groundwater sampling, and waste management.
6.1.1.2 Quality Assurance Project Plan
The Field Implementation Work Plan will include a Quality Assurance Project Plan to
assess the quality and reproducibility of analytical data generated in association with the
DRAFT—Issued for Regulatory Review
6-2 P:\457 Capital Indust\457008 Feasibility Study\Reports\IA Work Plan\457-008 Interim Action WP DFCR.docx
interim action. The Quality Assurance Project Plan will also discuss quality
assurance/quality control samples that will be collected to support the interim action.
6.1.1.3 Health and Safety Plan
The Field Implementation Work Plan will include a Health and Safety Plan required for all
field activities in accordance with Section 810 of Chapter 173-340 of the Washington
Administrative Code. The Health and Safety Plan will comply with the requirements of
the Occupational Safety and Health Act of 1970 and the Washington Industrial Safety and
Health Act (Chapter 49.17 of the Revised Code of Washington).
6.1.2 Quarterly Status Reports Quarterly status reports will be submitted to Ecology in the standard Quarterly Progress Reports
prepared by CI. The Quarterly Progress Reports will include a summary of the performance
monitoring results as the interim action progresses. If necessary, more-frequent progress reporting
via electronic mailing or meetings with Ecology will be conducted to refine the scope of work
based on performance monitoring data for the interim action.
6.1.3 Interim Action Completion Report An Interim Action Completion Report will be submitted to Ecology following the conclusion of
the interim action, and will include a summary of the overall interim action results and conclusions.
The Interim Action Completion Report will summarize the effectiveness of ISCO in reducing
CVOC concentrations in soil and groundwater and whether further action is required during the
cleanup action.
DRAFT—Issued for Regulatory Review
7-1 P:\457 Capital Indust\457008 Feasibility Study\Reports\IA Work Plan\457-008 Interim Action WP DFCR.docx
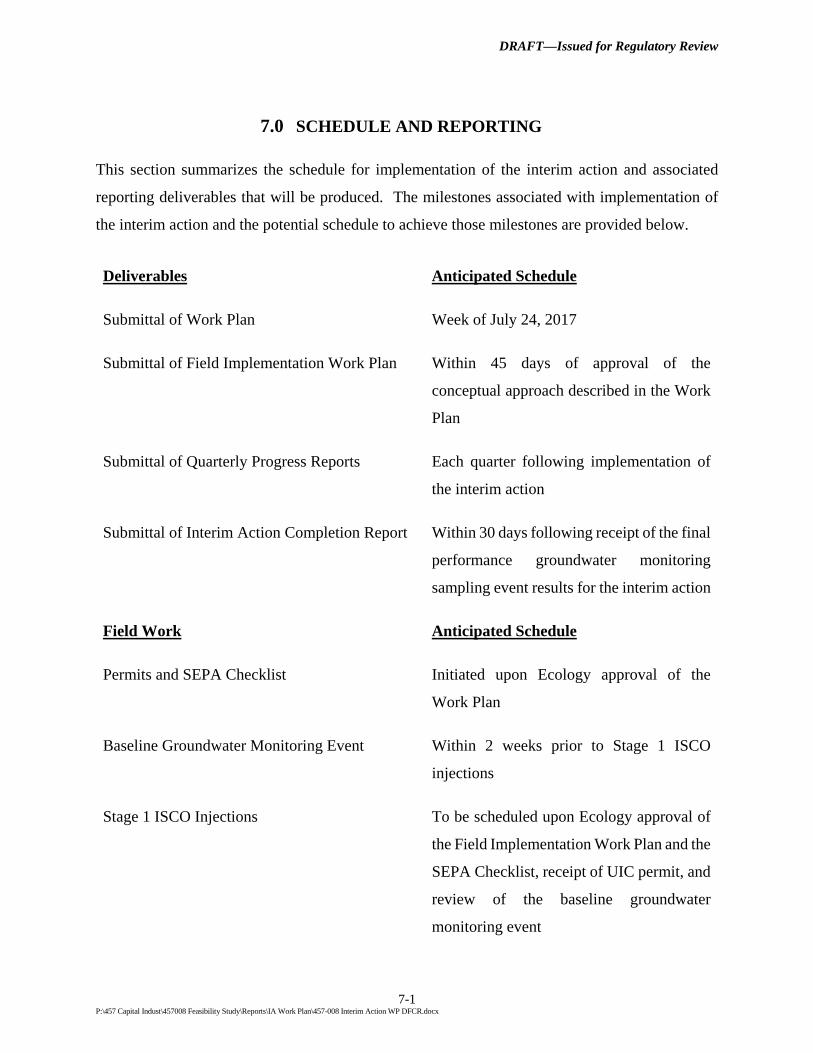
7.0 SCHEDULE AND REPORTING
This section summarizes the schedule for implementation of the interim action and associated
reporting deliverables that will be produced. The milestones associated with implementation of
the interim action and the potential schedule to achieve those milestones are provided below.
Deliverables Anticipated Schedule
Submittal of Work Plan Week of July 24, 2017
Submittal of Field Implementation Work Plan Within 45 days of approval of the
conceptual approach described in the Work
Plan
Submittal of Quarterly Progress Reports Each quarter following implementation of
the interim action
Submittal of Interim Action Completion Report Within 30 days following receipt of the final
performance groundwater monitoring
sampling event results for the interim action
Field Work Anticipated Schedule
Permits and SEPA Checklist Initiated upon Ecology approval of the
Work Plan
Baseline Groundwater Monitoring Event Within 2 weeks prior to Stage 1 ISCO
injections
Stage 1 ISCO Injections To be scheduled upon Ecology approval of
the Field Implementation Work Plan and the
SEPA Checklist, receipt of UIC permit, and
review of the baseline groundwater
monitoring event
DRAFT—Issued for Regulatory Review
7-2 P:\457 Capital Indust\457008 Feasibility Study\Reports\IA Work Plan\457-008 Interim Action WP DFCR.docx
Advancement of Performance Borings The first round of Stage 1 performance
borings will be advanced immediately
following the Stage 1 ISCO injections for
visual observations of the ISCO injection
radius. A second round of performance
borings will be advanced 2 weeks after the
Stage 1 injection for visual observations of
the persistence of the potassium
permanganate, and to assess CVOC
concentrations in soil proximate to the Stage
1 injection locations if the potassium
permanganate has been expended. This
schedule will be modified accordingly if
evidence of potassium permanganate
persists.
Stage 2 ISCO Injections Within 2 weeks of review of performance
boring data and review/comments from
Ecology regarding modifications that
deviate from this Work Plan and/or the
Field Implementation Work Plan
Advancement of Stage 2 Performance and/or
Confirmation Borings
To be determined based on Stage 1 pilot
study data
Monthly Performance Groundwater Monitoring Monthly for 3 months following completion
of the full-scale Stage 2 ISCO injections
Quarterly Performance Groundwater Monitoring Quarterly for up to 1 year following
completion of the full-scale Stage 2 ISCO
injections
DRAFT—Issued for Regulatory Review
8-1 P:\457 Capital Indust\457008 Feasibility Study\Reports\IA Work Plan\457-008 Interim Action WP DFCR.docx
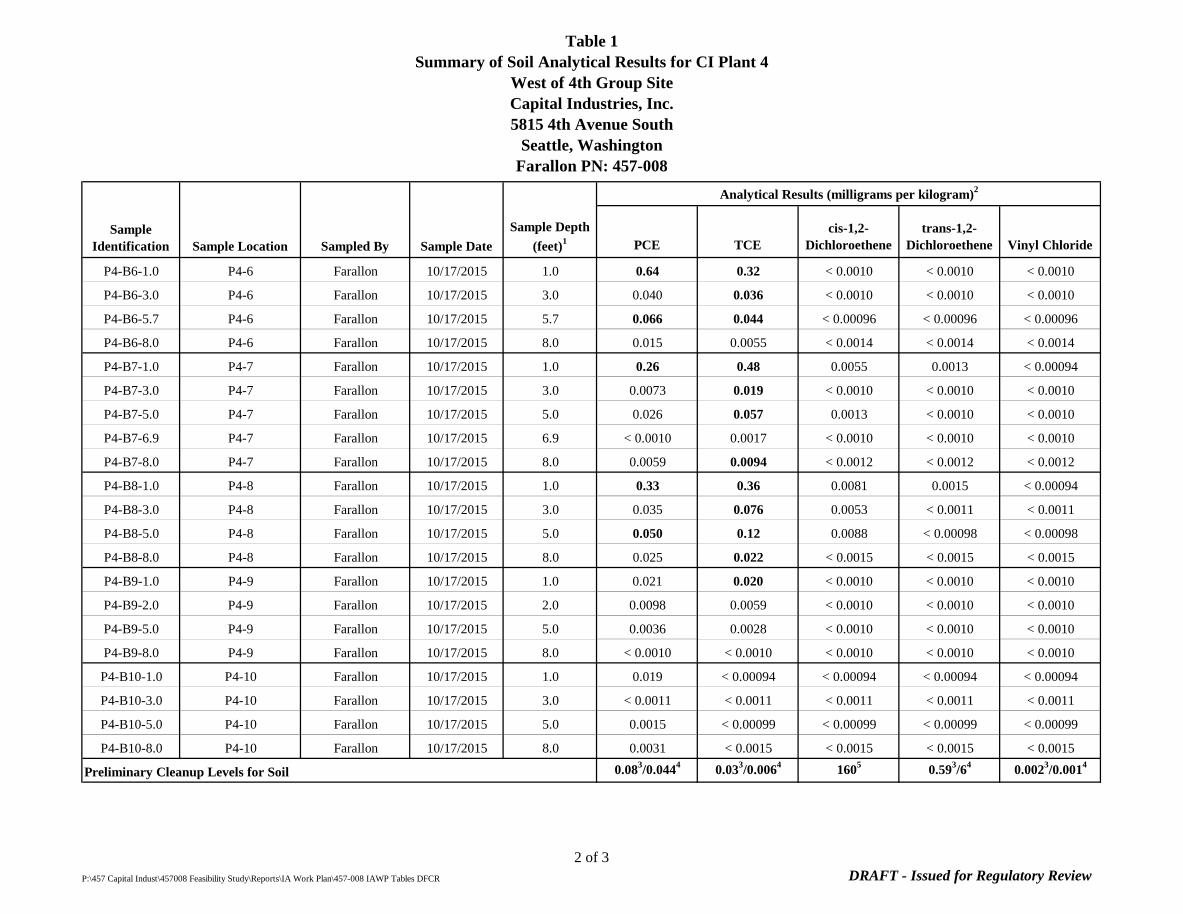
DEPTH PCE TCE cis-1,2-DCE trans-1,2-DCE VC1.0 0.0085 0.045 0.00098 U 0.00098 U 0.00098 U3.0 0.0013 0.0068 0.00099 U 0.00099 U 0.00099 U5.0 0.0031 0.015 0.0010 U 0.0010 U 0.0010 U7.8 0.0036 0.0068 0.0016 U 0.0016 U 0.0016 U
P4-B1
DEPTH PCE TCE cis-1,2-DCE trans-1,2-DCE VC1.0 0.00099 U 0.0039 0.00099 U 0.00099 U 0.00099 U3.0 0.0011 U 0.0011 U 0.0011 U 0.0011 U 0.0011 U5.0 0.00096 U 0.002 0.00096 U 0.00096 U 0.00096 U8.0 0.0015 U 0.0015 U 0.0015 U 0.0015 U 0.0015 U
P4-B2
DEPTH PCE TCE cis-1,2-DCE trans-1,2-DCE VC1.0 0.00089 U 0.0069 0.00089 U 0.00089 U 0.00089 U3.0 0.0010 U 0.0028 0.0010 U 0.0010 U 0.0010 U5.0 0.0011 U 0.0028 0.0011 U 0.0011 U 0.0011 U6.3 0.0012 U 0.0053 0.0012 U 0.0012 U 0.0012 U8.0 0.0010 U 0.0010 U 0.0010 U 0.0010 U 0.0010 U
P4-B3
DEPTH PCE TCE cis-1,2-DCE trans-1,2-DCE VC1.0 0.0010 U 0.060 0.0022 0.0010 U 0.0010 U3.0 0.0011 U 0.0090 0.0011 U 0.0011 U 0.0011 U5.0 0.0010 U 0.010 0.0010 U 0.0010 U 0.0010 U8.0 0.0010 U 0.0010 U 0.0010 U 0.0010 U 0.0010 U
P4-B4
DEPTH PCE TCE cis-1,2-DCE trans-1,2-DCE VC1.0 0.012 0.013 0.00099 U 0.00099 U 0.00099 U3.0 0.0087 0.010 0.0010 U 0.0010 U 0.0010 U5.0 0.016 0.016 0.0010 U 0.0010 U 0.0010 U6.0 0.023 0.023 0.0012 U 0.0012 U 0.0012 U8.0 0.0094 0.0074 0.0011 U 0.0011 U 0.0011 U
P4-B5
DEPTH PCE TCE cis-1,2-DCE trans-1,2-DCE VC1.0 0.64 0.32 0.0010 U 0.0010 U 0.0010 U3.0 0.040 0.036 0.0010 U 0.0010 U 0.0010 U5.7 0.066 0.044 0.00096 U 0.00096 U 0.00096 U8.0 0.015 0.0055 0.0014 U 0.0014 U 0.0014 U
P4-B6
DEPTH PCE TCE cis-1,2-DCE trans-1,2-DCE VC1.0 0.26 0.48 0.0055 0.0013 0.00094 U3.0 0.0073 0.019 0.0010 U 0.0010 U 0.0010 U5.0 0.026 0.057 0.0013 0.0010 U 0.0010 U6.9 0.0010 U 0.0017 0.0010 U 0.0010 U 0.0010 U8.0 0.0059 0.0094 0.0012 U 0.0012 U 0.0012 U
P4-B7
DEPTH PCE TCE cis-1,2-DCE trans-1,2-DCE VC1.0 0.33 0.36 0.0081 0.0015 0.00094 U3.0 0.035 0.076 0.0053 0.0011 U 0.0011 U5.0 0.050 0.12 0.0088 0.00098 U 0.00098 U8.0 0.025 0.022 0.0015 U 0.0015 U 0.0015 U
P4-B8
DEPTH PCE TCE cis-1,2-DCE trans-1,2-DCE VC1.0 0.021 0.020 0.0010 U 0.0010 U 0.0010 U2.0 0.0098 0.0059 0.0010 U 0.0010 U 0.0010 U5.0 0.0036 0.0028 0.0010 U 0.0010 U 0.0010 U8.0 0.0010 U 0.0010 U 0.0010 U 0.0010 U 0.0010 U
P4-B9
DEPTH PCE TCE cis-1,2-DCE trans-1,2-DCE VC1.0 0.019 0.00094 U 0.00094 U 0.00094 U 0.00094 U3.0 0.0011 U 0.0011 U 0.0011 U 0.0011 U 0.0011 U5.0 0.0015 0.00099 U 0.00099 U 0.00099 U 0.00099 U8.0 0.0031 0.0015 U 0.0015 U 0.0015 U 0.0015 U
P4-B10
DEPTH PCE TCE cis-1,2-DCE trans-1,2-DCE VC1.0 0.054 0.0031 0.0010 U 0.0010 U 0.0010 U3.0 0.005 0.0010 U 0.0010 U 0.0010 U 0.0010 U5.0 0.0059 0.0011 U 0.0011 U 0.0011 U 0.0011 U8.0 0.0039 0.0010 U 0.0010 U 0.0010 U 0.0010 U
P4-B11
DEPTH PCE TCE cis-1,2-DCE trans-1,2-DCE VC1.0 0.028 0.0028 0.0012 U 0.0012 U 0.0012 U2.8 0.0059 0.0011 U 0.0011 U 0.0011 U 0.0011 U5.0 0.0089 0.0011 0.0010 U 0.0010 U 0.0010 U8.0 0.0014 0.0011 U 0.0011 U 0.0011 U 0.0011 U
P4-B12
DEPTH PCE TCE cis-1,2-DCE trans-1,2-DCE VC1.0 0.0029 0.004 0.0010 U 0.0010 U 0.0010 U3.0 0.0011 U 0.0011 U 0.0011 U 0.0011 U 0.0011 U5.0 0.00097 U 0.00097 U 0.00097 U 0.00097 U 0.00097 U8.0 0.0016 0.0018 0.0011 U 0.0011 U 0.0011 U
P4-B13
DEPTH PCE TCE cis-1,2-DCE trans-1,2-DCE VC1.0 0.018 0.0095 0.0011 U 0.0011 U 0.0011 U3.0 0.0095 0.0069 0.0010 U 0.0010 U 0.0010 U5.0 0.016 0.0092 0.00096 U 0.00096 U 0.00096 U8.0 0.0076 0.0040 0.0014 U 0.0014 U 0.0014 U
P4-B14
STORMWATER MAINLINE (WITHINSTALL DATE AND FLOW DIRECTIONS)
SOIL RESULTS ARE INMILLIGRAMS PER KILOGRAM
SANITARY SEWER MAIN LINE AND FLOW DIRECTION
= INDICATES CONCENTRATIONS EXCEED WEST OF FOURTH GROUP SOIL INVESTIGATION PRELIMINARY CLEANUP LEVELS= INDICATES CONCENTRATIONS NOT DETECTED ABOVE THE STATED LABORATORY PRACTICAL QUANTITATION LIMIT= TETRACHLOROETHENE= TRICHLOROETHENE= CIS-1,2-DICHLOROETHENE= TRANS-1,2-DICHLOROETHENE= VINYL CHLORIDE
BOLD U
PCE TCE
cis-1,2-DCE trans-1,2-DCE
VCWATER MAIN LINE
LEGENDDIRECT-PUSH SOIL BORINGS
HYDRANT
STORMWATER CATCH BASIN
SANITARY SEWER MANHOLE
PLANT 4 SOIL ANALYTICAL RESULTS AND TETRACHLOROETHENE SOIL GAS RESULTS
WEST OF 4TH GROUP SITECAPITAL INDUSTRIES, INC.5815 4TH AVENUE SOUTH SEATTLE, WASHINGTON
DEPTH PCE TCE cis-1,2-DCE trans-1,2-DCE VC1.0 0.0085 0.045 0.00098 U 0.00098 U 0.00098 U3.0 0.0013 0.0068 0.00099 U 0.00099 U 0.00099 U5.0 0.0031 0.015 0.0010 U 0.0010 U 0.0010 U7.8 0.0036 0.0068 0.0016 U 0.0016 U 0.0016 U
P4-B1
DEPTH PCE TCE cis-1,2-DCE trans-1,2-DCE VC1.0 0.00099 U 0.0039 0.00099 U 0.00099 U 0.00099 U3.0 0.0011 U 0.0011 U 0.0011 U 0.0011 U 0.0011 U5.0 0.00096 U 0.002 0.00096 U 0.00096 U 0.00096 U8.0 0.0015 U 0.0015 U 0.0015 U 0.0015 U 0.0015 U
P4-B2
DEPTH PCE TCE cis-1,2-DCE trans-1,2-DCE VC1.0 0.00089 U 0.0069 0.00089 U 0.00089 U 0.00089 U3.0 0.0010 U 0.0028 0.0010 U 0.0010 U 0.0010 U5.0 0.0011 U 0.0028 0.0011 U 0.0011 U 0.0011 U6.3 0.0012 U 0.0053 0.0012 U 0.0012 U 0.0012 U8.0 0.0010 U 0.0010 U 0.0010 U 0.0010 U 0.0010 U
P4-B3
DEPTH PCE TCE cis-1,2-DCE trans-1,2-DCE VC1.0 0.0010 U 0.060 0.0022 0.0010 U 0.0010 U3.0 0.0011 U 0.0090 0.0011 U 0.0011 U 0.0011 U5.0 0.0010 U 0.010 0.0010 U 0.0010 U 0.0010 U8.0 0.0010 U 0.0010 U 0.0010 U 0.0010 U 0.0010 U
P4-B4
DEPTH PCE TCE cis-1,2-DCE trans-1,2-DCE VC1.0 0.012 0.013 0.00099 U 0.00099 U 0.00099 U3.0 0.0087 0.010 0.0010 U 0.0010 U 0.0010 U5.0 0.016 0.016 0.0010 U 0.0010 U 0.0010 U6.0 0.023 0.023 0.0012 U 0.0012 U 0.0012 U8.0 0.0094 0.0074 0.0011 U 0.0011 U 0.0011 U
P4-B5
DEPTH PCE TCE cis-1,2-DCE trans-1,2-DCE VC1.0 0.64 0.32 0.0010 U 0.0010 U 0.0010 U3.0 0.040 0.036 0.0010 U 0.0010 U 0.0010 U5.7 0.066 0.044 0.00096 U 0.00096 U 0.00096 U8.0 0.015 0.0055 0.0014 U 0.0014 U 0.0014 U
P4-B6
DEPTH PCE TCE cis-1,2-DCE trans-1,2-DCE VC1.0 0.26 0.48 0.0055 0.0013 0.00094 U3.0 0.0073 0.019 0.0010 U 0.0010 U 0.0010 U5.0 0.026 0.057 0.0013 0.0010 U 0.0010 U6.9 0.0010 U 0.0017 0.0010 U 0.0010 U 0.0010 U8.0 0.0059 0.0094 0.0012 U 0.0012 U 0.0012 U
P4-B7
DEPTH PCE TCE cis-1,2-DCE trans-1,2-DCE VC1.0 0.33 0.36 0.0081 0.0015 0.00094 U3.0 0.035 0.076 0.0053 0.0011 U 0.0011 U5.0 0.050 0.12 0.0088 0.00098 U 0.00098 U8.0 0.025 0.022 0.0015 U 0.0015 U 0.0015 U
P4-B8
DEPTH PCE TCE cis-1,2-DCE trans-1,2-DCE VC1.0 0.021 0.020 0.0010 U 0.0010 U 0.0010 U2.0 0.0098 0.0059 0.0010 U 0.0010 U 0.0010 U5.0 0.0036 0.0028 0.0010 U 0.0010 U 0.0010 U8.0 0.0010 U 0.0010 U 0.0010 U 0.0010 U 0.0010 U
P4-B9
DEPTH PCE TCE cis-1,2-DCE trans-1,2-DCE VC1.0 0.019 0.00094 U 0.00094 U 0.00094 U 0.00094 U3.0 0.0011 U 0.0011 U 0.0011 U 0.0011 U 0.0011 U5.0 0.0015 0.00099 U 0.00099 U 0.00099 U 0.00099 U8.0 0.0031 0.0015 U 0.0015 U 0.0015 U 0.0015 U
P4-B10
DEPTH PCE TCE cis-1,2-DCE trans-1,2-DCE VC1.0 0.054 0.0031 0.0010 U 0.0010 U 0.0010 U3.0 0.005 0.0010 U 0.0010 U 0.0010 U 0.0010 U5.0 0.0059 0.0011 U 0.0011 U 0.0011 U 0.0011 U8.0 0.0039 0.0010 U 0.0010 U 0.0010 U 0.0010 U
P4-B11
DEPTH PCE TCE cis-1,2-DCE trans-1,2-DCE VC1.0 0.028 0.0028 0.0012 U 0.0012 U 0.0012 U2.8 0.0059 0.0011 U 0.0011 U 0.0011 U 0.0011 U5.0 0.0089 0.0011 0.0010 U 0.0010 U 0.0010 U8.0 0.0014 0.0011 U 0.0011 U 0.0011 U 0.0011 U
P4-B12
DEPTH PCE TCE cis-1,2-DCE trans-1,2-DCE VC1.0 0.0029 0.004 0.0010 U 0.0010 U 0.0010 U3.0 0.0011 U 0.0011 U 0.0011 U 0.0011 U 0.0011 U5.0 0.00097 U 0.00097 U 0.00097 U 0.00097 U 0.00097 U8.0 0.0016 0.0018 0.0011 U 0.0011 U 0.0011 U
P4-B13
DEPTH PCE TCE cis-1,2-DCE trans-1,2-DCE VC1.0 0.018 0.0095 0.0011 U 0.0011 U 0.0011 U3.0 0.0095 0.0069 0.0010 U 0.0010 U 0.0010 U5.0 0.016 0.0092 0.00096 U 0.00096 U 0.00096 U8.0 0.0076 0.0040 0.0014 U 0.0014 U 0.0014 U
P4-B14
STORMWATER MAINLINE (WITHINSTALL DATE AND FLOW DIRECTIONS)
SOIL RESULTS ARE INMILLIGRAMS PER KILOGRAM
SANITARY SEWER MAIN LINE AND FLOW DIRECTION
= INDICATES CONCENTRATIONS EXCEED WEST OF FOURTH GROUP SOIL INVESTIGATION PRELIMINARY CLEANUP LEVELS= INDICATES CONCENTRATIONS NOT DETECTED ABOVE THE STATED LABORATORY PRACTICAL QUANTITATION LIMIT= TETRACHLOROETHENE= TRICHLOROETHENE= CIS-1,2-DICHLOROETHENE= TRANS-1,2-DICHLOROETHENE= VINYL CHLORIDE
BOLD U
PCE TCE
cis-1,2-DCE trans-1,2-DCE
VC
FIGURE 3BPLANT 4 SOIL ANALYTICAL RESULTS AND TRICHLOROETHENE SOIL GAS RESULTS
WEST OF 4TH GROUP SITECAPITAL INDUSTRIES, INC.5815 4TH AVENUE SOUTH SEATTLE, WASHINGTON
DEPTH PCE TCE cis-1,2-DCE trans-1,2-DCE VC1.0 0.0085 0.045 0.00098 U 0.00098 U 0.00098 U3.0 0.0013 0.0068 0.00099 U 0.00099 U 0.00099 U5.0 0.0031 0.015 0.0010 U 0.0010 U 0.0010 U7.8 0.0036 0.0068 0.0016 U 0.0016 U 0.0016 U
P4-B1
DEPTH PCE TCE cis-1,2-DCE trans-1,2-DCE VC1.0 0.00099 U 0.0039 0.00099 U 0.00099 U 0.00099 U3.0 0.0011 U 0.0011 U 0.0011 U 0.0011 U 0.0011 U5.0 0.00096 U 0.002 0.00096 U 0.00096 U 0.00096 U8.0 0.0015 U 0.0015 U 0.0015 U 0.0015 U 0.0015 U
P4-B2
DEPTH PCE TCE cis-1,2-DCE trans-1,2-DCE VC1.0 0.00089 U 0.0069 0.00089 U 0.00089 U 0.00089 U3.0 0.0010 U 0.0028 0.0010 U 0.0010 U 0.0010 U5.0 0.0011 U 0.0028 0.0011 U 0.0011 U 0.0011 U6.3 0.0012 U 0.0053 0.0012 U 0.0012 U 0.0012 U8.0 0.0010 U 0.0010 U 0.0010 U 0.0010 U 0.0010 U
P4-B3
DEPTH PCE TCE cis-1,2-DCE trans-1,2-DCE VC1.0 0.0010 U 0.060 0.0022 0.0010 U 0.0010 U3.0 0.0011 U 0.0090 0.0011 U 0.0011 U 0.0011 U5.0 0.0010 U 0.010 0.0010 U 0.0010 U 0.0010 U8.0 0.0010 U 0.0010 U 0.0010 U 0.0010 U 0.0010 U
P4-B4
DEPTH PCE TCE cis-1,2-DCE trans-1,2-DCE VC1.0 0.012 0.013 0.00099 U 0.00099 U 0.00099 U3.0 0.0087 0.010 0.0010 U 0.0010 U 0.0010 U5.0 0.016 0.016 0.0010 U 0.0010 U 0.0010 U6.0 0.023 0.023 0.0012 U 0.0012 U 0.0012 U8.0 0.0094 0.0074 0.0011 U 0.0011 U 0.0011 U
P4-B5
DEPTH PCE TCE cis-1,2-DCE trans-1,2-DCE VC1.0 0.64 0.32 0.0010 U 0.0010 U 0.0010 U3.0 0.040 0.036 0.0010 U 0.0010 U 0.0010 U5.7 0.066 0.044 0.00096 U 0.00096 U 0.00096 U8.0 0.015 0.0055 0.0014 U 0.0014 U 0.0014 U
P4-B6
DEPTH PCE TCE cis-1,2-DCE trans-1,2-DCE VC1.0 0.26 0.48 0.0055 0.0013 0.00094 U3.0 0.0073 0.019 0.0010 U 0.0010 U 0.0010 U5.0 0.026 0.057 0.0013 0.0010 U 0.0010 U6.9 0.0010 U 0.0017 0.0010 U 0.0010 U 0.0010 U8.0 0.0059 0.0094 0.0012 U 0.0012 U 0.0012 U
P4-B7
DEPTH PCE TCE cis-1,2-DCE trans-1,2-DCE VC1.0 0.33 0.36 0.0081 0.0015 0.00094 U3.0 0.035 0.076 0.0053 0.0011 U 0.0011 U5.0 0.050 0.12 0.0088 0.00098 U 0.00098 U8.0 0.025 0.022 0.0015 U 0.0015 U 0.0015 U
P4-B8
DEPTH PCE TCE cis-1,2-DCE trans-1,2-DCE VC1.0 0.021 0.020 0.0010 U 0.0010 U 0.0010 U2.0 0.0098 0.0059 0.0010 U 0.0010 U 0.0010 U5.0 0.0036 0.0028 0.0010 U 0.0010 U 0.0010 U8.0 0.0010 U 0.0010 U 0.0010 U 0.0010 U 0.0010 U
P4-B9
DEPTH PCE TCE cis-1,2-DCE trans-1,2-DCE VC1.0 0.019 0.00094 U 0.00094 U 0.00094 U 0.00094 U3.0 0.0011 U 0.0011 U 0.0011 U 0.0011 U 0.0011 U5.0 0.0015 0.00099 U 0.00099 U 0.00099 U 0.00099 U8.0 0.0031 0.0015 U 0.0015 U 0.0015 U 0.0015 U
P4-B10
DEPTH PCE TCE cis-1,2-DCE trans-1,2-DCE VC1.0 0.054 0.0031 0.0010 U 0.0010 U 0.0010 U3.0 0.005 0.0010 U 0.0010 U 0.0010 U 0.0010 U5.0 0.0059 0.0011 U 0.0011 U 0.0011 U 0.0011 U8.0 0.0039 0.0010 U 0.0010 U 0.0010 U 0.0010 U
P4-B11
DEPTH PCE TCE cis-1,2-DCE trans-1,2-DCE VC1.0 0.028 0.0028 0.0012 U 0.0012 U 0.0012 U2.8 0.0059 0.0011 U 0.0011 U 0.0011 U 0.0011 U5.0 0.0089 0.0011 0.0010 U 0.0010 U 0.0010 U8.0 0.0014 0.0011 U 0.0011 U 0.0011 U 0.0011 U
P4-B12
DEPTH PCE TCE cis-1,2-DCE trans-1,2-DCE VC1.0 0.0029 0.004 0.0010 U 0.0010 U 0.0010 U3.0 0.0011 U 0.0011 U 0.0011 U 0.0011 U 0.0011 U5.0 0.00097 U 0.00097 U 0.00097 U 0.00097 U 0.00097 U8.0 0.0016 0.0018 0.0011 U 0.0011 U 0.0011 U
P4-B13
DEPTH PCE TCE cis-1,2-DCE trans-1,2-DCE VC1.0 0.018 0.0095 0.0011 U 0.0011 U 0.0011 U3.0 0.0095 0.0069 0.0010 U 0.0010 U 0.0010 U5.0 0.016 0.0092 0.00096 U 0.00096 U 0.00096 U8.0 0.0076 0.0040 0.0014 U 0.0014 U 0.0014 U
P4-B14
STORMWATER MAINLINE (WITHINSTALL DATE AND FLOW DIRECTIONS)
SOIL RESULTS ARE INMILLIGRAMS PER KILOGRAM
SANITARY SEWER MAIN LINE AND FLOW DIRECTION
= INDICATES CONCENTRATIONS EXCEED WEST OF FOURTH GROUP SOIL INVESTIGATION PRELIMINARY CLEANUP LEVELS= INDICATES CONCENTRATIONS NOT DETECTED ABOVE THE STATED LABORATORY PRACTICAL QUANTITATION LIMIT= TETRACHLOROETHENE= TRICHLOROETHENE= CIS-1,2-DICHLOROETHENE= TRANS-1,2-DICHLOROETHENE= VINYL CHLORIDE
BOLD U
PCE TCE
cis-1,2-DCE trans-1,2-DCE
VCWATER MAIN LINE
LEGENDDIRECT-PUSH SOIL BORINGS
HYDRANT
STORMWATER CATCH BASIN
SANITARY SEWER MANHOLE
PLANT 4 SOIL ANALYTICAL RESULTS AND CIS-1,2,DICHLOROETHENE SOIL GAS RESULTS
WEST OF 4TH GROUP SITECAPITAL INDUSTRIES, INC.5815 4TH AVENUE SOUTHSEATTLE, WASHINGTON
DATE PCE TCE cis-1,2-DCE trans-1,2-DCE VC3/18/2015 0.20 U 0.20 U 24 0.20 U 129/22/20153/22/2016 0.20 U 0.20 U 20 0.20 U 109/20/20163/30/2017
NOT SAMPLED
NOT SAMPLEDNOT SAMPLED
CI-8-40(SHALLOW INTERVAL)
DATE PCE TCE cis-1,2-DCE trans-1,2-DCE VC3/17/2015 0.20 U 0.20 U 2.5 0.20 U 1.79/23/2015 0.20 U 0.20 U 0.20 U 0.20 U 0.813/22/2016 0.20 U 0.20 U 1.2 0.20 U 0.969/20/2016 0.20 U 0.20 U 0.20 U 0.20 U 0.783/30/2017 NOT SAMPLED
CI-7-40(SHALLOW INTERVAL)
DATE PCE TCE cis-1,2-DCE trans-1,2-DCE VC3/19/2015 6.8 3.2 0.20 U 0.20 U 0.20 U9/24/20153/22/2016 6.1 1.9 0.20 U 0.20 U 0.20 U9/22/20163/30/2017 5.3 2.6 0.29 0.20 U 0.20 U
NOT SAMPLED
NOT SAMPLED
MW-6(WATER TABLE
INTERVAL)
DATE PCE TCE cis-1,2-DCE trans-1,2-DCE VC3/19/20159/24/20153/22/2016 0.20 U 0.20 U 0.20 U 0.20 U 0.20 U9/21/20163/28/2017
CI-7-60 (INTERMEDIATE
INTERVAL)
NOT SAMPLEDNOT SAMPLED
NOT SAMPLEDNOT SAMPLED
DATE PCE TCE cis-1,2-DCE trans-1,2-DCE VC3/18/2015 0.20 U 0.20 U 0.20 U 0.20 U 0.20 U9/23/20153/22/2016 0.20 U 0.20 U 0.20 U 0.20 U 0.20 U9/21/20163/29/2017
CI-8-60(INTERMEDIATE
INTERVAL)
NOT SAMPLED
NOT SAMPLEDNOT SAMPLED
LEGEND
WATER TABLE INTERVAL MONITORING WELL
SHALLOW INTERVAL MONITORING WELL
INTERMEDIATE INTERVAL MONITORING WELL
APPROXIMATE DIRECTION OF GROUNDWATER FLOW
DATE PCE TCE cis-1,2-DCE trans-1,2-DCE VC3/17/2015 13 8.7 4.3 0.20 U 0.259/23/2015 12 4.6 3.1 0.20 U 0.743/22/2016 30 20 1.4 0.20 U 0.20 U9/20/2016 8.8 4.7 2.4 0.20 U 0.233/29/2017 15 10 1.5 0.20 U 0.20 U
CI = Capital Industries, Inc.Farallon = Farallon Consulting, L.L.C.PCE = tetrachloroetheneTCE = trichloroethene
< denotes analyte not detected at or exceeding the laboratory reporting limit listed.
Preliminary Cleanup Levels for SoilNOTES:Results in bold denote reporting limits that exceed the most conservative preliminary cleanup level.
1Depth in feet below ground surface.2Analyzed by U.S. Environmental Protection Agency Method 8260B.3Soil cleanup levels for protection of air quality. These are preliminary values only. Values calculated using Model Toxics Control Act (MTCA) Equation 747-1 where the potable Method B groundwater cleanup level was used as Cw. Concentrations of hazardous substances in soil that meet the potable groundwater protection standard currently are considered sufficiently protective of the air pathway for unrestricted and industrial land uses.4Soil cleanup levels for protection of surface water quality. These are preliminary values only. Values are calculated using MTCA Equation 747-1 where the groundwater cleanup level protective of surface water in this table was used as Cw.5Cleanup level is based on standard MTCA Method B (unrestricted land use) values from the Cleanup and Risk Calculation tables. <https://fortress.wa.gov/ecy/clarc/Reporting/ChemicalQuery.aspx>
P:\457 Capital Indust\457008 Feasibility Study\Reports\IA Work Plan\457-008 IAWP Tables DFCR
3 of 3DRAFT - Issued for Regulatory Review
Table 2Summary of Groundwater Analytical Results for CI Plant 4
West of 4th Group SiteCapital Industries, Inc.5815 4th Avenue South
NOTES:CI = Capital Industries, Inc.µg/l = micrograms per literJ = result is an estimatePCE = tetrachloroethene
TCE = trichloroethene
4Groundwater cleanup levels protective of the surface water pathway.
3NR denotes "not researched," which indicates that no regulatory standards or toxicity information is available for the constituent of concern to derive a cleanup level for the medium of potential concern.
Results in bold denote concentrations exceeding applicable cleanup levels.
1Analyzed by U.S. Environmental Protection Agency Method 8260B or 8260C.< denotes analyte not detected at or exceeding the laboratory reporting limit listed.
Shallow Zone = groundwater collected from 20 to 40 feet below ground surface
Water Table Zone = groundwater collected from the first-encountered groundwater to 20 feet below ground surface
2Groundwater cleanup levels protective of the air pathway for unrestricted land use (residential and commercial sites) and industrial land use were derived using the following equation: Gwcul = Aircul/GIVF.
Preliminary Cleanup Levels-Intermediate Zone
P:\457 Capital Indust\457008 Feasibility Study\Reports\IA Work Plan\457-008 IAWP Tables DFCR
4 of 4 DRAFT -- Issued for Regulatory Review
Table 3Summary of Preliminary Cleanup Levels
Updated January 17, 2017West of 4th Group SiteCapital Industries, Inc.5815 4th Avenue South
Seattle, WashingtonFarallon PN: 457-008
Sediment
Puget Sound Background
Concentrations for Metals1
Soil Cleanup Level Protective of Direct
Contact Pathway (Unrestricted Land Use)2
Soil Cleanup Level Protective of Direct
Contact Pathway (Industrial Land Use)2
Soil Cleanup Level Protective of Air Quality based on
Protection of Groundwater as Potable Drinking
Water3
Soil Cleanup Level Protective of Groundwater
Concentrations Protective of Surface
Water Quality4
Groundwater Cleanup Level Protective of Air
Quality Water Table Zone (Unrestricted Land Use)5
Groundwater Cleanup Level Protective of Air
Quality Water Table Zone (Industrial Land Use)5
Groundwater Cleanup Level
Protective of Surface Water6
Groundwater Cleanup Level Protective of
Sediment7
Air Cleanup Level Protective of Inhalation
Pathway (Unrestricted Land Use)2
Air Cleanup Level Protective of Inhalation Pathway (Industrial Land Use)2
Surface Water Cleanup Level Protective of
Human Health8
Surface Water Cleanup Level Protective of
Aquatic Life Sediment Cleanup Level9
(Milligrams/kilogram)
Tetrachloroethene Carcinogen -- 476 21,000 0.08 0.044 116 482 2.9 36,000 9.6 40 2.9 -- 190Trichloroethene Carcinogen -- 12 1,750 0.03 0.006 6.9 37 0.7 4,760,000 0.37 2 0.7 194 12 8,950cis-1,2-Dichloroethene Non-Carcinogen -- 160 7,000 -- -- -- -- -- -- -- -- -- -- --trans-1,2-Dichloroethene Non-Carcinogen -- 1,600 70,000 0.59 6 559 1,224 1,000 -- 27.4 60 1,000 -- --1,1-Dichloroethene Non-Carcinogen -- 4,000 175,000 0.055 0.025 538 1,176 3.2 -- 91.4 200 3.2 -- --Vinyl chloride Carcinogen -- 0.67 87.5 0.002 0.001 1.3 12.7 0.18 543,000 0.28 2.8 0.18 210 13 2021,4-Dioxane Carcinogen -- 10 1,310 0.004 0.32 2,551 25,510 78 -- 0.5 5 78 -- --Arsenic Carcinogen 20 20 87.5 Not Applicable 0.082 Not Applicable Not Applicable 0.14 / 5 10 241 Not Applicable Not Applicable 0.14 / 5 10 36 14 7Barium Non-Carcinogen -- 16,000 700,000 Not Applicable 824 Not Applicable Not Applicable -- -- Not Applicable Not Applicable -- -- --Cadmium Non-Carcinogen 1 80 3,500 Not Applicable 1.2 Not Applicable Not Applicable 8.8 760 Not Applicable Not Applicable -- 8.8 15 5.1Copper Non-Carcinogen 36 3,200 140,000 Not Applicable 1.1 Not Applicable Not Applicable 3.1 11 18,000 Not Applicable Not Applicable -- 3.1 15 390Iron Non-Carcinogen 58,700 58,700 2,450,000 Not Applicable -- Not Applicable Not Applicable -- -- Not Applicable Not Applicable 1,000 -- --Manganese Non-Carcinogen 1,200 11,200 490,000 Not Applicable -- Not Applicable Not Applicable 100 -- Not Applicable Not Applicable 100 -- --Nickel Non-Carcinogen 48 1,600 70,000 Not Applicable 11 Not Applicable Not Applicable 8.2 2,200 Not Applicable Not Applicable 100 8.2 15 15.9Zinc Non-Carcinogen 85 24,000 1,050,000 Not Applicable 101 Not Applicable Not Applicable 81 6,600 Not Applicable Not Applicable 1,000 81 15 410NOTES:
Preliminary cleanup levels presented represent the most stringent cleanup levels for the constituent of concern listed in the media indicated.
-- denotes no value is available. In the case of applicable or relevant and appropriate requirements (ARARs), the reference sources do not publish values for the noted chemicals. In the case of calculated values, one or more input parameters are not available.
1 Backgound metals values from Washington State Department of Ecology Publication No. 94-115, Natural Background Soil Metals Concentrations in Washington State. Arsenic background from Washington State Model Toxics Control Act (MTCA) Table 740-1, Method A Soil Cleanup Levels for Unrestricted Land Uses.2 Cleanup level is based on standard (MTCA Method B (unrestricted land use) or Method C (industrial land use) values from the Cleanup and Risk Calculations tables (CLARC).
10 Arsenic Cleanup level of 5 µg/l based on background concentrations for the State of Washington (MTCA Table 720-1).11 The surface water cleanup level for copper had previously been tabulated as 2.4 µg/l; however, this value is based on an approach using a site-specific water effects ratio that has not been determined. We have replaced this with 3.1 µg/l, National Recommended Water Quality Criteria published by EPA under 304 of the Federal Clean Water Act - Aquatic Life Criteria Table.12 Based on the Oak Ridge Nation Laboratory Toxicological Benchmarks for Screening Potential Contaminants of Concern for Effects on Aquatic Biota13 DeRooij, C. et al. 2004. Euro Chlor Risk Assessment for the Marine Environment OSPARCOM Region: North Sea – Environmental Monitoring and Assessment.14 WAC 173-201A-24015 National Recommended Water Quality Criteria published by EPA under 304 of the Federal Clean Water Act - Aquatic Life Criteria Table
Table updated August 14, 2015 based on revisions to EPA Aquatic Water Quality Criteria; July 20, 2016 based on Ecology comments on the Draft FS Reports for SU1 and SU2 (clarify footnotes, add sediment values, add surface water CULs protective of aquatic life); and January 17, 2017 based on EPA's revisions to the Clean Water Act Human Health criteria dated November 15, 2016.
7 Groundwater screening levels based on the transfer of contaminants from groundwater to sediment were calculated by dividing the sediment screening level by the associated partition coefficients. Koc and Kd values are from MTCA. Fraction of carbon assumed at 0.02 based on Lower Duwamish Waterway Feasibility Study (AECOM 2012).
9 Sediment has not been confirmed to be affected by groundwater discharge to surface water. Sediment cleanup levels were derived from the Lower Duwamish Waterway Superfund Site Record of Decisions (EPA 2014), which does not contain values for nickel, TCE, PCE, or vinyl chloride. These constituents are not listed in the Sediment Managment Standards (WAC 173-204), either. EPA Region 3 BTAG Marine Sediment Ecological Screening Benchmarks (EPA 2006) have been listed for nickel, TCE, and PCE. EPA Region 3 has no value listed for vinyl chloride; therefore, the older Region 5 benchmarks were used (EPA 2003).
8 The most stringent exposure pathway for human health receptors is for consumption of fish. Listed values are based on ARARs listed in CLARC, with the exception of: (1) 1,4-dioxane is derived from MTCA Method B default values; (2) PCE, TCE, trans-DCE, vinyl chloride, nickel, and zinc are based on the U.S. Environmental Protection Agency (EPA) revised CWA Human Health Criteria - Organism Only dated 11/15/16.
(Micrograms/liter)
Not Applicable denotes the constituent of concern will not affect the medium of potential concern due to an incomplete pathway.
3 Soil cleanup levels for protection of air quality are calculated using MTCA Equation 747-1, where the potable Method B groundwater cleanup level was used as Cw. Concentrations of hazardous substances in soil that meet the potable groundwater protection standard currently are considered sufficiently protective of the air pathway for unrestricted and industrial land uses.4 Soil cleanup levels for protection of surface water quality are calculated using MTCA Equation 747-1, where the groundwater cleanup level protective of surface water in this table was used as Cw. 5 Groundwater cleanup levels protective of the air pathway for unrestricted land use (residential and commercial sites) and industrial land use were derived using the following equation: Gwcul = Aircul/GIVF. 6 Human health and marine aquatic ecologic receptors were considered. Refer to the Surface Water Cleanup Levels Protective of Human Health and Aquatic Life in this table. The more stringent value of the two receptors has been listed for the Groundwater Cleanup Level Protective of Surface Water.
Constituent of ConcernCarcinogen or Non-
Carcinogen
Preliminary Cleanup Levels
Soil Groundwater Air Surface Water
P:\457 Capital Indust\457008 Feasibility Study\Reports\IA Work Plan\457-008 IAWP Tables DFCR 1 of 1 DRAFT - Issued for Regulatory Review
Table 4Summary of Natural Attenuation and Water Quality Parameters
West of 4th Group SiteCapital Industries, Inc.5815 4th Avenue South
Seattle, WashingtonFarallon PN: 457-008
3/24/2010 0.37 NA NA NA NA NA NA NA NA NA 6.03 16.23 0.24 78 NA
6/17/2010 1.19 NA NA 2,900 NA 250 NA NA NA NA 6.20 16.32 0.23 36.8 NA
9/28/2010 2.08 NA NA NA NA NA NA NA NA NA 6.65 14.64 0.224 53 NA
12/16/2010 7.29 NA NA NA NA NA NA NA NA NA 6.66 16.51 0.21 207.7 NA
3/18/2011 0.29 NA NA NA NA NA NA NA NA NA 6.24 15.45 0.243 82.8 NA
3/19/2015 0.67 NA NA NA 0.2 NA < 0.1 NA NA NA 5.94 15.85 0.396 83.5 NA
3/22/2016 0.38 NA NA NA 1.0 NA < 0.1 NA NA NA 5.98 16.05 0.295 85.2 NA
3/30/2017 0.56 NA NA NA NA NA NA NA NA NA 6.12 16.2 0.370 136.3 NA
3/24/2010 0.43 NA NA NA NA NA NA NA NA NA 5.70 16.06 0.285 47.8 NA
3/24/2010 0.27 NA NA NA NA NA NA NA NA NA 6.98 15.40 0.465 -102.5 NA
6/16/2010 0.63 NA NA 6,900 NA 360 NA NA NA NA 7.28 14.90 0.362 77.7 NA
9/30/2010 0.51 NA NA NA NA NA NA NA NA NA 7.14 15.87 0.418 -141.6 NA
12/16/2010 6.49 NA NA NA NA NA NA NA NA NA 7.34 14.40 0.394 107.9 NA
3/15/2011 0.21 NA NA NA NA NA NA NA NA NA 8.02 13.77 0.503 -67.2 NA
3/18/2015 0.94 NA NA NA < 0.2 NA < 0.1 NA NA NA 6.76 14.95 0.507 -88.2 NA
3/22/2016 0.23 NA NA NA 2.0 NA < 0.1 NA NA NA 6.97 14.27 0.506 -89.1 NANOTES:< denotes analyte not detected at or exceeding the reporting limit listed. ° = degrees1Collected using a Yellow Springs Instrument multimeter with flow-through cell. electron receptors = compounds that gain electrons and are sources of energy during biodegradation2Analyzed by U.S. Environmental Protection Agency (EPA) Method 353.2. IE = instrument error3Analyzed by American Society for Testing and Materials Method D516-02 or D516-07. J = result is an estimate4Analyzed by EPA Method 6010C. metabolic byproducts = compounds that result from biodegradation processes5Measured in the field using conventional chemistry parameters by EPA/American Public Health Association Methods. mg/l = milligrams per liter; equivalent to parts per million6Analyzed by EPA Method RSK-175. mS/cm = milliSiemens per centimeter specific conductance units7Analyzed by Standard Method 5310B. mV = millivolt units for measurement of oxidation-reduction potential (ORP) µg/l = micrograms per liter
NA= not analyzedTOC = total organic carbon
Intermediate Zone
CI-7-60
CI-8-60
CI-8-40
Shallow Zone
P:\457 Capital Indust\457008 Feasibility Study\Reports\IA Work Plan\457-008 IAWP Tables DFCR
3 of 3 DRAFT -- Issued for Regulatory Review
DRAFT—Issued for Regulatory Review
P:\457 Capital Indust\457008 Feasibility Study\Reports\IA Work Plan\457-008 Interim Action WP DFCR.docx
APPENDIX A A CITIZEN’S GUIDE TO IN SITU CHEMICAL OXIDATION
INTERIM ACTION WORK PLAN Site Unit 2
Seattle, Washington
Farallon PN: 457-008
A Citizen’s Guide to In Situ Chemical Oxidation
What Is In Situ Chemical Oxidation?Chemical oxidation uses chemicals called “oxidants” to help change harmful contaminants into less toxic ones. It is commonly described as “in situ” because it is conducted in place, without having to excavate soil or pump out groundwater for aboveground cleanup. In situ chemical oxidation, or “ISCO,” can be used to treat many types of contaminants like fuels, solvents, and pesticides. ISCO is usually used to treat soil and groundwater contamination in the source area where contaminants were originally released. The source area may contain contaminants that have not yet dissolved into groundwater. Following ISCO, other cleanup methods, such as pump and treat or monitored natural attenuation, are often used to clean up the smaller amounts of contaminants left behind. (See A Citizen’s Guide to Pump and Treat [EPA 542-F-12-017] and A Citizen’s Guide to Monitored Natural Attenuation [EPA 542-F-12-014].)
How Does It Work?When oxidants are added to contaminated soil and groundwater, a chemical reaction occurs that destroys contaminants and produces harmless byproducts. To treat soil and groundwater in situ, the oxidants are typically injected underground by pumping them into wells. The wells are installed at different depths
in the source area to reach as much dissolved and undissolved contamination as possible. Once the oxidant is pumped down the wells, it spreads into the surrounding soil and groundwater where it mixes and reacts with contaminants.
To improve mixing, the groundwater and oxidants may be recirculated between wells. This involves pumping oxidants down one well and then pumping the groundwater mixed with oxidants out another well. After the mixture is pumped out, more oxidant is added, and it is pumped back (recirculated) down the first well. Recirculation helps treat a larger area faster. Another option is to inject and mix oxidants using mechanical augers or excavation equipment. This may be particularly helpful for clay soil.
The four major oxidants used for ISCO are permanganate, persulfate, hydrogen peroxide and ozone. The first three oxidants are typically injected as liquids. Although ozone is a strong oxidant, it is a gas, which can be more difficult to use. As a result, it is used less often.
Catalysts are sometimes used with certain oxidants. A catalyst is a substance that increases the speed of a chemical reaction. For instance, if hydrogen peroxide is added with an iron catalyst, the mixture becomes more reactive and destroys more contaminants than hydrogen peroxide alone.
Following treatment, if contaminant concentrations begin to climb back up or “rebound,” a second or third injection may be needed. Concentrations will rebound if the injected oxidants did not reach all of the contamination, or if the oxidant is used up before all the contamination is treated. It may take several weeks to months for the contamination to reach monitoring wells and to determine if rebound is occurring.
ISCO may produce enough heat underground to cause the contaminants in soil and groundwater to evaporate and rise to the ground surface. Controlling the amount of oxidant helps avoid excessive heat, and if significant gases are produced, they can be captured and treated.
United States Office of Solid Waste and EPA 542-F-12-011 Environmental Protection Emergency Response September 2012 Agency (5102G) www.epa.gov/superfund/sites
www.cluin.org
NOTE: This fact sheet is intended solely as general information to the public. It is not intended, nor can it be relied upon, to create any rights enforceable by any party in litigation with the United States, or to endorse the use of products or services provided by specific vendors. The Agency also reserves the right to change this fact sheet at any time without public notice.
Example
Groundwater near a former wastewater treatment plant at the Naval Air Station Pensacola in Florida was contaminated with solvents and acids from painting and electroplating. A groundwater pump and treat system had operated for more than 10 years to control migration of contaminated groundwater. However, it did not do much to lower the concentrations of contaminants. ISCO using hydrogen peroxide with an iron catalyst was chosen to reduce contaminant concentrations in the source area enough to allow monitored natural attenuation to complete the cleanup.
The natural chemistry of the site’s groundwater was found to limit the effectiveness of the first phase of injections. In the second phase, a chemical was added to the reagent mix to stabilize the oxidant mixture. Contaminant levels fell substantially. The successful use of ISCO at this site was estimated to save several million dollars compared with continued pump and treat.
For More Information
For more information about this and other technologies in the Citizen’s Guide Series, visit:
www.cluin.org/remediationwww.cluin.org/products/
citguidewww.cluin.org/chemox
How Long Will It Take?ISCO works relatively quickly to clean up a source area. Cleanup may take a few months or years, rather than several years or decades. The actual cleanup time depends on several factors that vary site to site. For example, ISCO will take longer where:
• The source area is large.• Contaminants are trapped in hard-to-reach areas like fractures or clay.• The soil or rock does not allow the oxidant to spread quickly and evenly.• Groundwater flow is slow.• The oxidant does not last long underground.
Is ISCO Safe?The use of ISCO poses little risk to the surrounding community. Workers wear protective clothing when handling oxidants, and when handled properly, these chemicals are not harmful to the environment or people. Because contaminated soil and groundwater are cleaned up underground, ISCO does not expose workers or others at the site to contamination. Workers test soil and groundwater regularly to make sure ISCO is working.
How Might It Affect Me?Nearby residents and businesses may see drilling rigs and tanker trucks with oxidants and supplies as they are driven to the site. Residents may also hear the operation of drilling rigs, pumps, and other equipment leading up to and during the injection period. Following an injection, however, the cleanup process occurs underground with little aboveground disruption. Workers may visit the site to collect soil and groundwater samples to monitor cleanup progress.
Why Use ISCO?ISCO is usually selected to clean up a source area, where it destroys the bulk of contaminants in situ without having to dig up soil or pump out groundwater for aboveground treatment. This can save time and money. ISCO has successfully cleaned up many contaminated sites and has been selected or is being used at around 40 Superfund sites and many other sites across the country.
ISCO system installed behind a small drycleaning facility.