301 ANNALS OF GEOPHYSICS, VOL. 52, N. 3/4, June/August 2009 Key words Ionospheric propagation – mid-latitude trough – radiolocation – propagation modelling – backscatter sounding 1. Propagation along the mid-latitude trough 1.1. Introduction For terrestrial HF radio systems, the elec- tron density depletion in the trough region re- duces the maximum frequency that can be re- Aspects of HF radio propagation E. Michael Warrington ( 1 ), Alain Bourdillon ( 2 ), Eulalia Benito ( 3 ), Cesidio Bianchi ( 4 ), Jean-Philippe Monilié ( 3 ), Martha Muriuki ( 1 ), Marco Pietrella ( 4 ), Veronique Rannou ( 3 ), Hanna Rothkaehl ( 5 ), Stephane Saillant ( 3 ), Ozgur Sari ( 6 ), Alan J. Stocker ( 1 ), Ersin Tulunay ( 7 ), Yurnadur Tulunay ( 8 ) and Nikolay Y. Zaalov ( 1 ) ( 1 ) Department of Engineering, University of Leicester, UK ( 2 ) IETR, Université de Rennes 1, France ( 3 ) Electromagnetism and Radar Department, Onera, Palaiseau, France ( 4 ) Istituto Nazionale di Geofisica e Vulcanologia, Roma, Italy ( 5 ) Space Research Centre PAS 00-716 Warsaw, Poland ( 6 ) Aselsan A.S., Macunkoy, Ankara, Turkey ( 7 ) ODTÜ/METU, Department of Electrical and Electronics Engineering, Ankara, Turkey ( 8 ) ODT /METU, Department of Aerospace Engineering, Ankara, Turkey Abstract The propagation characteristics of radio signals are important parameters to consider when designing and operating radio systems. From the point of view Working Group 2 of the COST 296 Action, interest lies with effects associ- ated with propagation via the ionosphere of signals within the HF band. Several aspects are covered in this paper: a) The directions of arrival and times of flight of signals received over a path oriented along the trough have been examined and several types of propagation effects identified. Of particular note, combining the HF obser- vations with satellite measurements has identified the presence of irregularities within the floor of the trough that result in propagation displaced from the great circle direction. An understanding of the propagation effects that result in deviations of the signal path from the great circle direction are of particular relevance to the operation of HF radiolocation systems. b) Inclusion of the results from the above mentioned measurements into a propagation model of the norther- ly ionosphere (i.e. those regions of the ionosphere located poleward of, and including, the mid-latitude trough) and the use of this model to predict the coverage expected from transmitters where the signals impinge on the northerly ionosphere. c) Development of inversion techniques enabling backscatter ionograms obtained by an HF radar to be used to estimate the ionospheric electron density profile. This development facilitates the operation of over the hori- zon HF radars by enhancing the frequency management aspects of the systems. d) Various propagation prediction techniques have been tested against measurements made over the trough path mentioned above, and also over a long-range path between Cyprus and the UK. e) The effect of changes in the levels of ionospheric disturbances on the operational availability at various data throughput rates has been examined for the trough path mentioned earlier. The topics covered in this paper are necessarily brief, and the reader is referred to full papers referenced herein on individual aspects. Mailing address: Prof. E. Michael Warrington, Depart- ment of Engineering, University of Leicester, Leicester, LE1 7RH, U.K.; e-mail: [email protected]Vol52,3,2009 20-09-2009 19:06 Pagina 301
Transcript
301
ANNALS OF GEOPHYSICS, VOL. 52, N. 3/4, June/August 2009
For terrestrial HF radio systems, the elec-tron density depletion in the trough region re-duces the maximum frequency that can be re-
Aspects of HF radio propagation
E. Michael Warrington (1), Alain Bourdillon (2), Eulalia Benito (3), Cesidio Bianchi (4), Jean-Philippe Monilié (3), Martha Muriuki (1), Marco Pietrella (4), Veronique Rannou (3),
Hanna Rothkaehl (5), Stephane Saillant (3), Ozgur Sari (6), Alan J. Stocker (1), Ersin Tulunay (7), Yurnadur Tulunay (8) and Nikolay Y. Zaalov (1)
(1) Department of Engineering, University of Leicester, UK(2) IETR, Université de Rennes 1, France
(3) Electromagnetism and Radar Department, Onera, Palaiseau, France(4) Istituto Nazionale di Geofisica e Vulcanologia, Roma, Italy
(5) Space Research Centre PAS 00-716 Warsaw, Poland(6) Aselsan A.S., Macunkoy, Ankara, Turkey
(7) ODTÜ/METU, Department of Electrical and Electronics Engineering, Ankara, Turkey(8) ODT /METU, Department of Aerospace Engineering, Ankara, Turkey
AbstractThe propagation characteristics of radio signals are important parameters to consider when designing and operatingradio systems. From the point of view Working Group 2 of the COST 296 Action, interest lies with effects associ-ated with propagation via the ionosphere of signals within the HF band. Several aspects are covered in this paper:
a) The directions of arrival and times of flight of signals received over a path oriented along the trough havebeen examined and several types of propagation effects identified. Of particular note, combining the HF obser-vations with satellite measurements has identified the presence of irregularities within the floor of the trough thatresult in propagation displaced from the great circle direction. An understanding of the propagation effects thatresult in deviations of the signal path from the great circle direction are of particular relevance to the operationof HF radiolocation systems.
b) Inclusion of the results from the above mentioned measurements into a propagation model of the norther-ly ionosphere (i.e. those regions of the ionosphere located poleward of, and including, the mid-latitude trough)and the use of this model to predict the coverage expected from transmitters where the signals impinge on thenortherly ionosphere.
c) Development of inversion techniques enabling backscatter ionograms obtained by an HF radar to be usedto estimate the ionospheric electron density profile. This development facilitates the operation of over the hori-zon HF radars by enhancing the frequency management aspects of the systems.
d) Various propagation prediction techniques have been tested against measurements made over the troughpath mentioned above, and also over a long-range path between Cyprus and the UK.
e) The effect of changes in the levels of ionospheric disturbances on the operational availability at variousdata throughput rates has been examined for the trough path mentioned earlier.
The topics covered in this paper are necessarily brief, and the reader is referred to full papers referencedherein on individual aspects.
Mailing address: Prof. E. Michael Warrington, Depart-ment of Engineering, University of Leicester, Leicester, LE17RH, U.K.; e-mail: [email protected]
Vol52,3,2009 20-09-2009 19:06 Pagina 301
302
E.M. Warrington, A. Bourdillon, E. Benito, C. Bianchi, J.-P. Monilie, M. Muriuki, M. Pietrella, V. Rannou, H. Rothkaehl, S. Saillant, O. Sari, A. J. Stocker, E. Tulunay, Y. Tulunay and N. Y. Zaalov
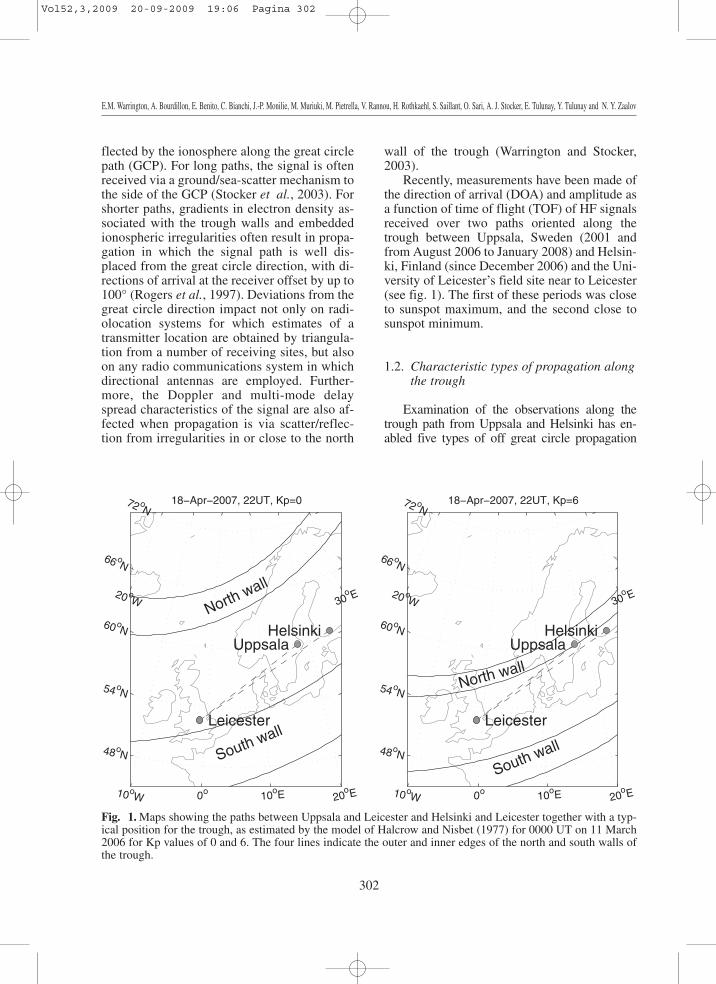
flected by the ionosphere along the great circlepath (GCP). For long paths, the signal is oftenreceived via a ground/sea-scatter mechanism tothe side of the GCP (Stocker et al., 2003). Forshorter paths, gradients in electron density as-sociated with the trough walls and embeddedionospheric irregularities often result in propa-gation in which the signal path is well dis-placed from the great circle direction, with di-rections of arrival at the receiver offset by up to100° (Rogers et al., 1997). Deviations from thegreat circle direction impact not only on radi-olocation systems for which estimates of atransmitter location are obtained by triangula-tion from a number of receiving sites, but alsoon any radio communications system in whichdirectional antennas are employed. Further-more, the Doppler and multi-mode delayspread characteristics of the signal are also af-fected when propagation is via scatter/reflec-tion from irregularities in or close to the north
wall of the trough (Warrington and Stocker,2003).
Recently, measurements have been made ofthe direction of arrival (DOA) and amplitude asa function of time of flight (TOF) of HF signalsreceived over two paths oriented along thetrough between Uppsala, Sweden (2001 andfrom August 2006 to January 2008) and Helsin-ki, Finland (since December 2006) and the Uni-versity of Leicester’s field site near to Leicester(see fig. 1). The first of these periods was closeto sunspot maximum, and the second close tosunspot minimum.
1.2. Characteristic types of propagation alongthe trough
Examination of the observations along thetrough path from Uppsala and Helsinki has en-abled five types of off great circle propagation
18−Apr−2007, 22UT, Kp=0
20 oW
10oW 0o 10oE 20
oE
30o E
48oN
54 oN
60 oN
66 oN
72 oN
Leicester
Uppsala Helsinki
North wall
South wall
18−Apr−2007, 22UT, Kp=6
20 oW
10oW 0o 10oE 20
oE
30o E
48oN
54 oN
60 oN
66 oN
72 oN
Leicester
Uppsala Helsinki
North wall
South wall
Fig. 1. Maps showing the paths between Uppsala and Leicester and Helsinki and Leicester together with a typ-ical position for the trough, as estimated by the model of Halcrow and Nisbet (1977) for 0000 UT on 11 March2006 for Kp values of 0 and 6. The four lines indicate the outer and inner edges of the north and south walls ofthe trough.
Vol52,3,2009 20-09-2009 19:06 Pagina 302
12 13 14 15 16 17 18 19 20 21 22 23 000
10
20
30
40
50
60
ex11, Upp, 10 MHz, 2007/04/18−2007/04/19, Type II
Azi
mut
h (d
egre
es)
12 13 14 15 16 17 18 19 20 21 22 23 00
4
5
6
7
8
Tim
e of
flig
ht (
ms)
Time (UT)
303
Aspects of HF radio propagation
events to be identified (see Stocker et al. (2009)for full details):
• Type 1: These are characterised at onset bya large sudden increase in time of flight accom-panied by a sudden deviation of the bearing tothe north. Subsequently, the time of flight de-creases over a period of hours while the az-imuth either remains fairly constant or returnsslowly to close to the great circle direction.Type 1 events were commonly observed, ex-cept in the summer, close to solar maximum(2001) (see Siddle et al., 2004a for a number ofexamples) when they also tended to be longer-lived and were observed on a wider range offrequencies. Theoretical considerations indicatethat these events are consistent with the signal
scattering from irregularities in the polewardwall of the trough or from the auroral region(Siddle et al., 2004b).
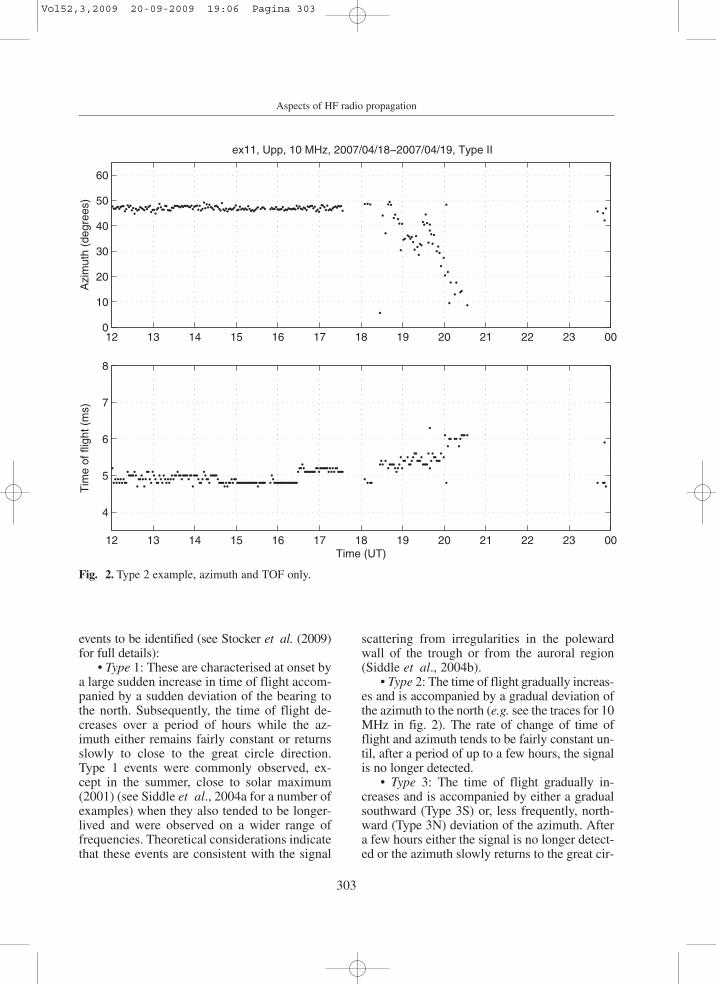
• Type 2: The time of flight gradually increas-es and is accompanied by a gradual deviation ofthe azimuth to the north (e.g. see the traces for 10MHz in fig. 2). The rate of change of time offlight and azimuth tends to be fairly constant un-til, after a period of up to a few hours, the signalis no longer detected.
• Type 3: The time of flight gradually in-creases and is accompanied by either a gradualsouthward (Type 3S) or, less frequently, north-ward (Type 3N) deviation of the azimuth. Aftera few hours either the signal is no longer detect-ed or the azimuth slowly returns to the great cir-
Fig. 2. Type 2 example, azimuth and TOF only.
Vol52,3,2009 20-09-2009 19:06 Pagina 303
304
E.M. Warrington, A. Bourdillon, E. Benito, C. Bianchi, J.-P. Monilie, M. Muriuki, M. Pietrella, V. Rannou, H. Rothkaehl, S. Saillant, O. Sari, A. J. Stocker, E. Tulunay, Y. Tulunay and N. Y. Zaalov
cle direction (this distinguishes Type 3N propa-gation from Type 2).
• Type 4: This type of propagation is charac-terised by a sudden large increase in the time offlight and a strong deviation to the south (typi-cally the azimuth is around 120°). The signal isusually relatively weak, and is consistent withsidescatter from a ground reflection in thevicinity of the Alps.
• Type 5: This type is similar to Type 1, ex-cept that although there is a sudden increase inthe time of flight, the signal is deviated to thesouth instead of the north. Over the following
few hours the azimuth usually returns to thegreat circle direction.
The occurrence (as a percentage of nightsof observation) of Types 1, 2, and 4 as a func-tion of season, frequency and Kp is presentedin fig. 3 (Types 3 and 5 are generally rare). Theseasons have been defined with spring includ-ing all of March and April, summer includingMay to August, autumn September and Octo-ber and winter November to February (as inITU, 1997). Type 1 events are most commonin spring with no clear trend with frequency.For 4.64 MHz, this type of propagation is also
4.64 8.01 11.120
10
20
30
40Type 1
SummerAutumnWinterSpring
4.64 8.01 11.120
10
20
30
40
Occ
urre
nce
(% o
f nig
hts)
Type 2
4.64 8.01 11.120
10
20
30
40
Frequency (MHz)
Type 4
4.64 8.01 11.120
10
20
30
40Type 1
0−22−44+
4.64 8.01 11.120
10
20
30
40
Occ
urre
nce
(% o
f nig
hts)
Type 2
4.64 8.01 11.120
10
20
30
40
Frequency (MHz)
Type 4
Fig. 3. The percentage occurrence of Types 1, 2, and 4 off great circle propagation (August 2006-September2007). Left hand panels show variation with season, and the right hand panels the variation with Kp (averaged1800-0000 UT).
Vol52,3,2009 20-09-2009 19:06 Pagina 304
305
Aspects of HF radio propagation
common in winter, while for most other fre-quencies it occurs least often in winter. Thisbehaviour may be contrasted with that ob-served in 2001 (see Siddle et al., 2004a,b)where Type 1 propagation was frequently ob-served (~40–70% of nights depending on fre-quency) except in summer. Furthermore, theevents observed in 2001 tended to consist oflarger changes in time of flight and azimuthand to be of longer duration. Type 2 eventstend to occur more frequently in spring and, forfrequencies in the range 8.01-11.12 MHz, inthe summer. However, for 6.95 MHz, there is
little other seasonal variation, while at 4.64 and14.36 MHz the events are rarely observed. Inspring, the occurrence strongly depends on fre-quency, peaking at 10.39 MHz. Type 4 eventsare also a springtime phenomenon, being ob-served on over 30% of nights for 10.39 and11.12 MHz, but rarely at other frequencies.
At frequencies of 8.01 MHz and below,Type 1 propagation events become more fre-quent as Kp increases, while for frequencieshigher than this the percentage of nights onwhich this type of propagation is observed isroughly independent of Kp (although there is
Fig. 4. Map showing the inferred reflection point of an 8.01 MHz signal on 18 April 2007, 2030UT to 19 April,0000 UT.
Type 2, 8.01 MHz, 2007/04/18, 21:17 UT, Kp=2.5
20 oW
10oW 0o 10oE 20oE
30o E
45oN
55 oN
65 oN
Uppsala
Leicester
Vol52,3,2009 20-09-2009 19:06 Pagina 305
306
E.M. Warrington, A. Bourdillon, E. Benito, C. Bianchi, J.-P. Monilie, M. Muriuki, M. Pietrella, V. Rannou, H. Rothkaehl, S. Saillant, O. Sari, A. J. Stocker, E. Tulunay, Y. Tulunay and N. Y. Zaalov
some suggestion of a slight decrease in occur-rence with increasing Kp). For Type 2 propaga-tion, there is a clear decrease in the occurrenceof observations with increasing Kp for all fre-quencies except 4.64 MHz, where the oppositeis the case. Type 4 propagation is more com-monly observed at the middle range of frequen-cies (8.01-11.12 MHz), and becomes more fre-quent with increasing Kp.
1.3. Comparison of satellite measurementswith HF measurements
The mechanism by which Type 1 off greatcircle path propagation occurs has been investi-gated through simulation (Siddle et al.,2004b). However, the modelling has not yetbeen able to explain why the deviations of dif-
ferent types occur on one day but not on other-wise very similar days. In previous work, theparameters describing electron density irregu-larities embedded in the background iono-sphere used in simulation have not been welldefined. In this paper, the HF measurements areexamined in conjunction with satellite observa-tions of the electron density structure. Somecaution must be exercised in comparing the HFand satellite measurements since the satellite al-titude is about 700 km, while the HF propaga-tion is most strongly affected by the ionosphereat heights of about 200-400 km. Since the elec-tron density distribution in the topside iono-sphere is the near-Earth signature of the magne-tospheric plasmapause, it may be expected thatthe structure of the irregularities due to precipi-tations will be well correlated at different alti-tudes, while the behaviour of the instabilities
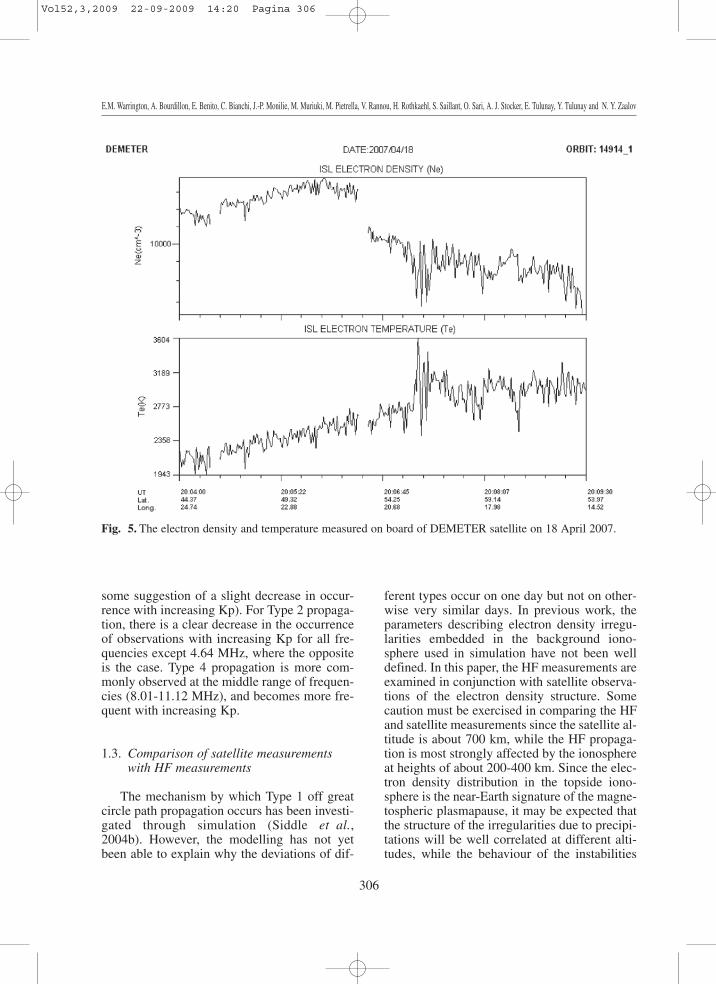
Fig. 5. The electron density and temperature measured on board of DEMETER satellite on 18 April 2007.
Vol52,3,2009 22-09-2009 14:20 Pagina 306
307
Aspects of HF radio propagation
inside the trough region will depend on height.For reasons of space, only a single example ofType 2 off great circle propagation from 18April 2007 will be presented here.
Based on the measured angles of arrival andthe time of flight of the HF signal (fig. 2), andassuming a single, mirror-like reflection (seeSiddle et al., 2004b), the reflection point (fig.4) moves steadily north of the great circle pathreaching a point close to the poleward wall ofthe trough before the signal is no longer re-ceived. It is evident from Figure 4 that the re-flection points of the HF signal in this event arelocated inside the trough. The DEMETERsatellite data (fig. 5) indicates that, as well asthe expected reduction in electron density, thereare strong filamentary electron density struc-tures (i.e. irregularities) inside the main ionos-pheric trough at this time, and we suggest thatscattering from these irregularities is the mainmechanism responsible for formation of Type 2off great circle propagation.
2. Ionospheric model for ray-tracing
Zaalov et al. (2003; 2005) have developeda unique ray-tracing model that accurately re-produces many of the features observed in theexperimental measurements referred to earlierto a level well beyond that which we originallyanticipated would be possible. A major out-come of these ray-tracing simulations is thatpaths other than those that have been the subjectof experimental investigation can readily be as-sessed.
The simulations make use of a numericalray tracing code (Jones and Stephenson, 1975)to estimate the ray paths through a model iono-sphere comprising two Chapman layers, themain parameters of which (critical frequency,critical height, vertical scale height of each lay-er) are based on values obtained from the Inter-national Reference Ionosphere (IRI) (Bilitza,1990). The most important causes of off-greatcircle propagation in the polar cap are the pres-ence of convecting patches or sun-aligned arcsof enhanced ionisation. Patches are formed inthe dayside auroral oval and generally convectin an anti-sunward direction across the polar
cap into the nightside auroral oval, whereas arcsoccur under different geomagnetic conditionsand drift in a duskwards direction. Localised,time varying, perturbations in the electron den-sity are then applied to the background modelto represent the convecting patches and arcs ofenhanced electron density.
Sun aligned arcs (Carlson et al., 1984): theshape of each sun-aligned arc is defined withinthe model by a small number of three-dimen-sional Gaussian perturbations in electron densi-ty of different spatial scales (altitude, longitudeand latitude) randomly distributed near to thecentre of the arc. Several Gaussian perturba-tions were combined in defining the shape ofeach modelled arc in order to prevent the shapesof the arcs being too stylised. For all arcs awayfrom close proximity to the dawn or dusk auro-ral oval, the plasma strands are elongated forseveral hundreds or thousands of kilometreswith a latitudinal scale which is significantlylarger than the longitudinal scale. Evolution ofthe structures relative to the propagation path isdetermined by the rotation of the Earth beneaththe arcs and by movement of the arcs in thedawn-dusk direction.
Convecting patches (Weber et al., 1984;Buchau et al., 1983): the temporal evolution ofthe patches relative to the propagation path issimulated by means of a convection flowscheme coupled with the rotation of the Earthbeneath the convection pattern, the precise formof which depends upon the components of theIMF. The intensity and spatial scales of thepatches can also be varied with simulation time.In practice, the shape, size and number ofpatches in the convection flow area depends up-on many geophysical parameters, not only uponthe instantaneous values but also upon their his-tory. By using up to four vortices based on themodelled convection flow patterns associatedwith the various IMF orientations many realis-tic situations may be simulated.
Mid-latitude trough: the Halcrow and Nis-bet model (1977) was used in the simulations asa basis for the position of the trough walls. Inorder to add smaller-scale structure to the wall,the following modifications were performed:(a) The latitude of the walls was perturbed bytwo-scaled random functions of longitude, and
Vol52,3,2009 20-09-2009 19:06 Pagina 307
308
E.M. Warrington, A. Bourdillon, E. Benito, C. Bianchi, J.-P. Monilie, M. Muriuki, M. Pietrella, V. Rannou, H. Rothkaehl, S. Saillant, O. Sari, A. J. Stocker, E. Tulunay, Y. Tulunay and N. Y. Zaalov
(b) a landscape of patches elongated in the di-rection of the trough were added to each wall.Initially, no perturbations were added to thefloor of the trough. The depletion of the troughmaximum was set according to Kp, typically,30% for Kp = 2-3 and 60% for Kp = 6.
Particle precipitation: the auroral oval is anenhancement of electron density caused by par-ticle precipitation in the E-region and above. Asa function of distance along (near-vertical) fieldlines, the density enhancement was modelled asstarting 100 km from the ground, having one or
more peaks of about 1013 electrons/m3 around110 km, and then decaying slowly toward 200km (Bates and Hunsucker, 1974). Small scaleelectron density enhancements can also beadded to the model.
The model is able to reflect the day-to-dayvariation of received HF signals. See, for exam-ple, the time history of the azimuth of arrivaland time of flight of a 10.4 MHz signal propa-gating along Uppsala to Leicester path on 18-19April 2007 given in fig. 2 and the simulation re-sults in fig. 6.
Fig. 6. Simulated time history of the azimuth of arrival and time of flight of a 10.4 MHz signal propagatingalong Uppsala to Leicester path between noon 18 April and noon 19 April 2007. Azimuth deviation - top pan-el, time of flight - bottom panel.
Vol52,3,2009 20-09-2009 19:06 Pagina 308
309
Aspects of HF radio propagation
3. Area coverage simulations
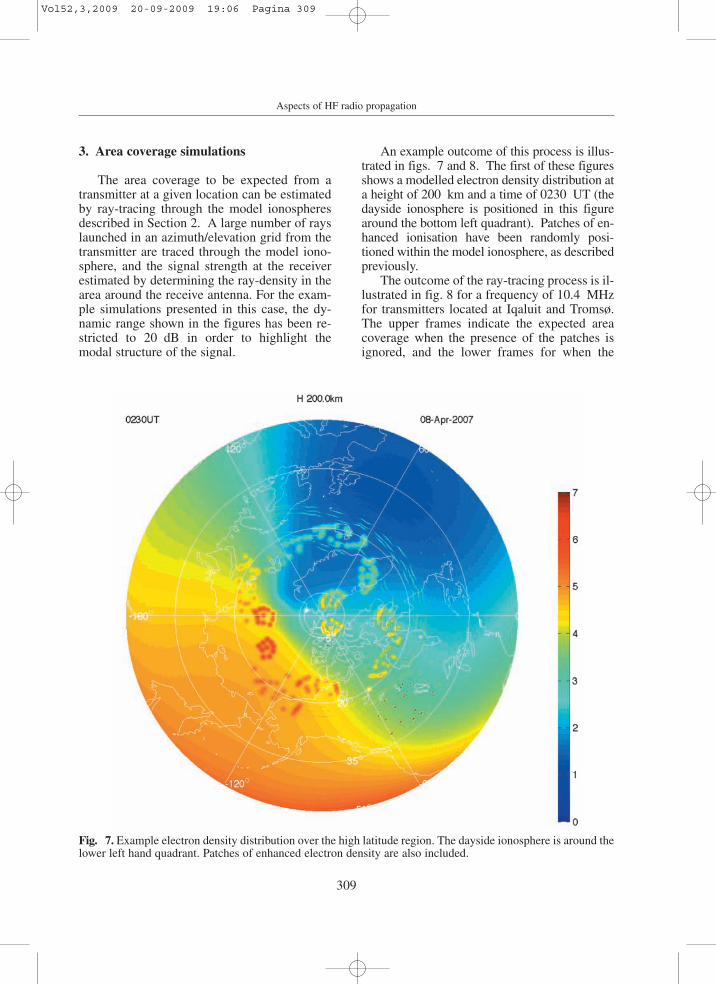
The area coverage to be expected from atransmitter at a given location can be estimatedby ray-tracing through the model ionospheresdescribed in Section 2. A large number of rayslaunched in an azimuth/elevation grid from thetransmitter are traced through the model iono-sphere, and the signal strength at the receiverestimated by determining the ray-density in thearea around the receive antenna. For the exam-ple simulations presented in this case, the dy-namic range shown in the figures has been re-stricted to 20 dB in order to highlight themodal structure of the signal.
An example outcome of this process is illus-trated in figs. 7 and 8. The first of these figuresshows a modelled electron density distribution ata height of 200 km and a time of 0230 UT (thedayside ionosphere is positioned in this figurearound the bottom left quadrant). Patches of en-hanced ionisation have been randomly posi-tioned within the model ionosphere, as describedpreviously.
The outcome of the ray-tracing process is il-lustrated in fig. 8 for a frequency of 10.4 MHzfor transmitters located at Iqaluit and Tromsø.The upper frames indicate the expected areacoverage when the presence of the patches isignored, and the lower frames for when the
Fig. 7. Example electron density distribution over the high latitude region. The dayside ionosphere is around thelower left hand quadrant. Patches of enhanced electron density are also included.
Vol52,3,2009 20-09-2009 19:06 Pagina 309
310
E.M. Warrington, A. Bourdillon, E. Benito, C. Bianchi, J.-P. Monilie, M. Muriuki, M. Pietrella, V. Rannou, H. Rothkaehl, S. Saillant, O. Sari, A. J. Stocker, E. Tulunay, Y. Tulunay and N. Y. Zaalov
patches are taken into account. Focussing ofthe rays at the 1, 2 and 3 hop skip zone rangesis clearly evident in all cases. It is interesting tonote that the presence of the patches severelydistorts the background pattern on the ground,that coverage is reduced in places but also thatcoverage is obtained in areas where it was notpresent without the presence of the patches.This later situation is more evident at higherfrequencies, not illustrated here.
In considering the effect of the presence ofthe patches, it is important to remember that thepatch distribution shown is only illustrative andthat in reality the patches will be distributed dif-ferently, and also that as time progresses thepatches will move in accordance with the pre-
vailing convection cell pattern (in turn, a func-tion of the geomagnetic conditions).
4. Inversion of HF radar backscatter ionograms
HF radars use the refraction by the iono-sphere of radio waves emitted by the radar to de-tect targets up to 3000 km. The distance coveredby the radio waves depends on different parame-ters: the ionospheric characteristics, the transmit-ted frequency and the elevation angle. In order tooptimise the radar frequencies for the geograph-ical area of interest and to localize the targets ac-curately, knowledge of the ionospheric charac-
Fig. 8. Calculated signal strength variations for a 10.4 MHz transmitters located at Iqaluit (left frames) andTromsø (right frames) covering the high latitude region using the modelled ionosphere of fig. 7. The upperframes are without the presence of polar patches, and the lower frames are with the presence of the patches.
Vol52,3,2009 20-09-2009 19:06 Pagina 310
311
Aspects of HF radio propagation
teristics is required in quasi real time. In to ac-quire the necessary ionospheric information, theradar can be used as an oblique backscattersounder. For this purpose, an inversion method isneeded as the forward problem is strongly nonlinear. By scanning the radar beam in elevationfor a fixed azimuth at one operating frequency,the group path can be measured to obtain abackscatter ionogram (a 3D image of magnitude,elevation angle β, and group path P’).
The Quasi-Parabolic Segment model (QPS)developed by Dyson and Bennett (1988) hasbeen chosen for the inversion. In this model,each layer of the ionosphere and also the join-ing segments can be characterized with a QPsegment by only three parameters: the criticalfrequency (fc), the peak height (hm) and thesemithickness (ym). Then the group path P’ andthe ground range D can be obtained using ana-lytical propagation equations.
4.1. Inversion technique
The purpose is to recover the initial modelparameters (fc, hm, ym) of each layer of the iono-sphere from n points of the backscatter ionogram(n�3). With these model parameters the calcula-tion of the ground range, D, is possible so the re-al position of the target can be determined. Thedata points used are the coordinates of n grouppaths (P’meas 1, …, P’meas n) at n fixed elevationangles (βref 1, …, βref n) called of reference foreach layer. The method, based on Tarantola(1987) and Landeau et al. (1997), will inverteach ionosphere’s layer one by one. For each pa-rameter a value is chosen in the parameter spaceto create a QPS model of the ionosphere and tosimulate the elevation-group path curve by usingray tracing. The coordinates of the n group pathssimulated corresponding to the n fixed elevationangles are taken (P’simu 1, …, P’simu n).
With the coordinates of the n group pathsmeasured and simulated, the a posteriori proba-bility density, σp, can be calculated, using theequation:
, ,, ,
f h y
P
P f h y P1
1p c m m
meas i
simu i c m m meas ii
n
1
σ
δ
=+
-=
ll l
^^
d
hh
n
%
where δP’meas1, …, δP’measn represent the vari-ances of the measurement errors over P’meas1,…, P’measn. These variances are presumed to beCauchy distributed and independent of eachother.
The optimal parameters are those for whichσp is maximum. To find them, each value of theparameters space must be evaluated. But thisprocedure is costly in time and the ionosphereis changing with time, sometimes on a timescale smaller than 15 minutes. It is thus neces-sary to use an optimization algorithm to get agood approximation of the global optimum.Two different optimization algorithms havebeen tested: the simulated annealing and the ge-netic algorithm.
Simulated annealing: The simulated anneal-ing algorithm (SA) developed by Kirkpatrick etal. (1983) is based on the manner in which met-als recrystallize in the process of annealing. Foreach step of the SA algorithm a random neigh-bour of the current solution is considered. If thenew solution is better, it is chosen. If it is worse,it can still be chosen with a probability that de-pends on the difference between the correspon-ding function values and on a parameter calledthe temperature (T).
The temperature is gradually decreased dur-ing the process. At the beginning the current so-lution changes almost randomly, but the accept-ance of bad solutions decreases as T goes to ze-ro. The allowance for bad solutions saves themethod from becoming fixed at local minima.
Genetic algorithm: The second optimizationmethod used is a genetic algorithm developedby Goldberg (1989). Genetic algorithms arebased on the mechanics of natural selection andgenetics. An initial generation is created wherethe individuals are binary coded strings. By us-ing selection, crossover and mutation a newgeneration is created from the old generation.Each generation is better than the previous one,until the optimal solution is found.
4.2. Validation on synthesized data
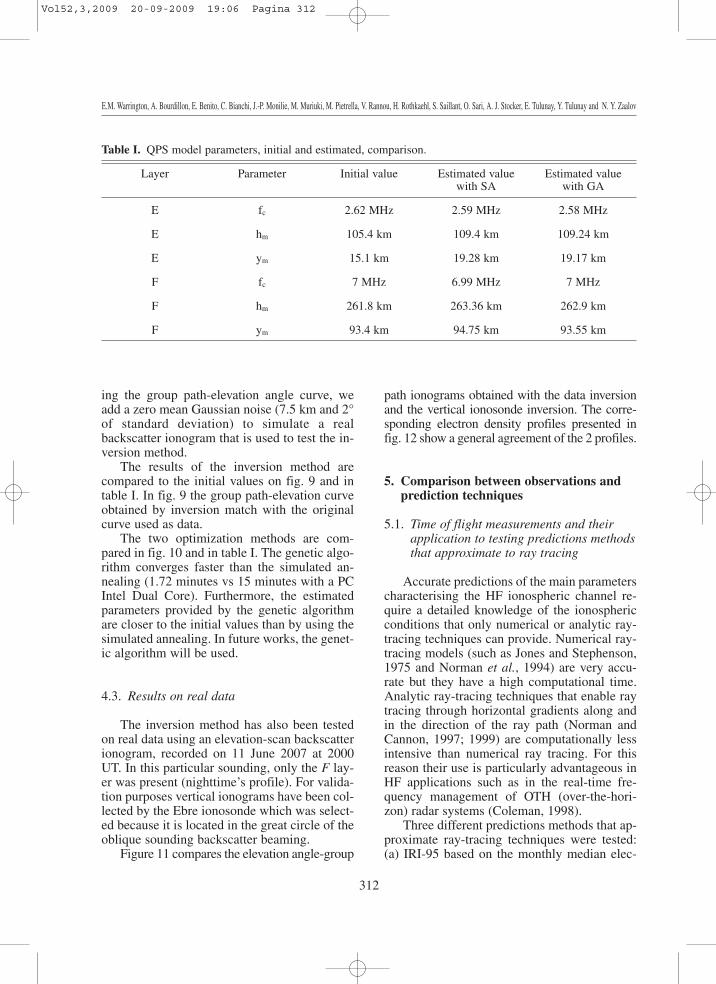
Synthesized data are created from a modelof electronic density profile given by predic-tions of the ionosphere (table I). After calculat-
Vol52,3,2009 20-09-2009 19:06 Pagina 311
312
E.M. Warrington, A. Bourdillon, E. Benito, C. Bianchi, J.-P. Monilie, M. Muriuki, M. Pietrella, V. Rannou, H. Rothkaehl, S. Saillant, O. Sari, A. J. Stocker, E. Tulunay, Y. Tulunay and N. Y. Zaalov
ing the group path-elevation angle curve, weadd a zero mean Gaussian noise (7.5 km and 2°of standard deviation) to simulate a realbackscatter ionogram that is used to test the in-version method.
The results of the inversion method arecompared to the initial values on fig. 9 and intable I. In fig. 9 the group path-elevation curveobtained by inversion match with the originalcurve used as data.
The two optimization methods are com-pared in fig. 10 and in table I. The genetic algo-rithm converges faster than the simulated an-nealing (1.72 minutes vs 15 minutes with a PCIntel Dual Core). Furthermore, the estimatedparameters provided by the genetic algorithmare closer to the initial values than by using thesimulated annealing. In future works, the genet-ic algorithm will be used.
4.3. Results on real data
The inversion method has also been testedon real data using an elevation-scan backscatterionogram, recorded on 11 June 2007 at 2000UT. In this particular sounding, only the F lay-er was present (nighttime’s profile). For valida-tion purposes vertical ionograms have been col-lected by the Ebre ionosonde which was select-ed because it is located in the great circle of theoblique sounding backscatter beaming.
Figure 11 compares the elevation angle-group
path ionograms obtained with the data inversionand the vertical ionosonde inversion. The corre-sponding electron density profiles presented infig. 12 show a general agreement of the 2 profiles.
5. Comparison between observations andprediction techniques
5.1. Time of flight measurements and their application to testing predictions methodsthat approximate to ray tracing
Accurate predictions of the main parameterscharacterising the HF ionospheric channel re-quire a detailed knowledge of the ionosphericconditions that only numerical or analytic ray-tracing techniques can provide. Numerical ray-tracing models (such as Jones and Stephenson,1975 and Norman et al., 1994) are very accu-rate but they have a high computational time.Analytic ray-tracing techniques that enable raytracing through horizontal gradients along andin the direction of the ray path (Norman andCannon, 1997; 1999) are computationally lessintensive than numerical ray tracing. For thisreason their use is particularly advantageous inHF applications such as in the real-time fre-quency management of OTH (over-the-hori-zon) radar systems (Coleman, 1998).
Three different predictions methods that ap-proximate ray-tracing techniques were tested:(a) IRI-95 based on the monthly median elec-
Table I. QPS model parameters, initial and estimated, comparison.
Layer Parameter Initial value Estimated value Estimated value with SA with GA
E fc 2.62 MHz 2.59 MHz 2.58 MHz
E hm 105.4 km 109.4 km 109.24 km
E ym 15.1 km 19.28 km 19.17 km
F fc 7 MHz 6.99 MHz 7 MHz
F hm 261.8 km 263.36 km 262.9 km
F ym 93.4 km 94.75 km 93.55 km
Vol52,3,2009 20-09-2009 19:06 Pagina 312
313
Aspects of HF radio propagation
Fig. 9. Backscatter ionogram inversion results.
Fig. 10. Comparison of the optimization algorithms speed.
Vol52,3,2009 20-09-2009 19:06 Pagina 313
314
E.M. Warrington, A. Bourdillon, E. Benito, C. Bianchi, J.-P. Monilie, M. Muriuki, M. Pietrella, V. Rannou, H. Rothkaehl, S. Saillant, O. Sari, A. J. Stocker, E. Tulunay, Y. Tulunay and N. Y. Zaalov
Fig. 11. Elevation angle-group path curves obtained with the inverted parameters and with the ionosonde in-version parameters, and data points used for the inversion at a low operating frequency.
Fig. 12. Electron density profiles obtained with the inverted parameters and with the ionosonde parameters.
Vol52,3,2009 20-09-2009 19:06 Pagina 314
315
Aspects of HF radio propagation
tron density profiles provided by the IRI-95model (Bilitza, 1990; 2001), (b) SIRM&BR_Dbased on the SIRM (Zolesi et al., 1993; 1996)in conjunction with the Bradley-Dudeney mod-el (Bradley and Dudeney, 1973), and (c)ICEPAC based on the Ionospheric Communica-tions Enhanced Profile Analysis and Circuitprediction program (Stewart, undated).
For the IRI-95 and SIRM&BR_D predic-tion methods, the monthly median electron den-sity profiles provided by the models have beenused to calculate the vertical plasma frequencyprofiles at the mid-point of the Uppsala -Leicester radio link (see Section 1). As the ef-fect of Earth’s curvature is important for groundranges greater than 500 km, the curvature of theEarth and the known ground range (1411 km)of the radio link have been taken into accountfor calculating the angle of incidence of the rayat the base of the ionosphere. The values of theangle of incidence have been calculated assum-ing a very simple geometry based on ionospher-ic reflections taking place from a simple hori-zontal mirror at the appropriate height. Subse-
quently, the secant law was applied to calculatethe oblique transmission frequencies. Thelength of the oblique ray path, its correspondingtime of flight (TOF) and take off angle havebeen calculated from simple geometry.
The version of ICEPAC used in this studyutilizes the monthly median electron densityprofiles (Haydon and Lucas, 1968) at the mid-point of the radio link derived from CCIR foF2and M(3000)F2 coefficients (CCIR, 1966) and,from these, provides predictions of elevation an-gle, TOF, virtual height, etc. for a given obliquetransmission frequency and time of day.
In order to test the validity of these methodsunder quiet ionospheric conditions, compar-isons between the predictions and the TOF me-dian measurements for the one hop propagationmodes 1E and 1F were carried out for differentfrequencies and seasons.
For 1E modes (see table II), IRI-95 andSIRM&BR_D provide a similar performance,while ICEPAC is in general somewhat better.This is particularly the case when Es is present.The errors for 1F modes (table III) are larger
Table II. The minimum and maximum value of the r.m.s. error of TOF are shown taking into account all thefrequencies which arrive at the receiver following the 1E on great circle propagation modes.
Table III. The minimum and maximum value of the r.m.s. error of TOF are shown taking into account all thefrequencies which arrive at the receiver following the 1F on great circle propagation modes.
E.M. Warrington, A. Bourdillon, E. Benito, C. Bianchi, J.-P. Monilie, M. Muriuki, M. Pietrella, V. Rannou, H. Rothkaehl, S. Saillant, O. Sari, A. J. Stocker, E. Tulunay, Y. Tulunay and N. Y. Zaalov
than for 1E, and the performance is similar forall three methods, although ICEPAC can pro-duce significantly better results in winter.
Further details of this aspect of the investi-gation can be found in Pietrella et al. (2009).
5.2. Comparison of oblique sounding measurements and VOACAP predictions on a mid-latitude path between Cyprus and the UK
Signals from FMCW sounders located inCyprus were received in Leicester (a path length~3340 km) from 1 February 2008 to 13 July 2008.The monthly median MUF as a function of timeof day is presented in fig. 13. Predictions of theMUF made using VOACAP (version 05.0119W)are also presented in fig. 13. VOACAP has beenrun using a minimum take-off angle of 0.1°, pre-
dicted smoothed sunspot numbers ranging from 7in February to 11 in July (NGDC, 2008), and withthe sporadic E model switched off. Although theobservations generally have a similar form to thepredictions, there are some discrepancies. For ex-ample, the predicted median MUF at 0700–0800UT in February is much higher than the observedvalue (the largest daily value in the month is 21.9MHz at 0700 UT and 23.5 MHz at 0800 UT), inJune the characteristic reduction in MUF at noonis not observed, whilst in July, the observed MUFis higher than the predicted value at all times. InJune and July the discrepancy results from thepresence of sporadic-E layers with high (on occa-sions >30 MHz) peak frequencies. The predictedMUF(Es) values (obtained using VOACAPmethod 11, with a FPROB multiplier of 1.0 forEs) are closer to those observed in the morningand early afternoon, but significantly lower thanthe observations in the evening.
Table IV. Modem availabilities with DST=0
2400 bps 1200 bps 600 bps 300 bps 150 bps 75 bps
4 MHz 0 0 0.004 0.983 0.974 1
6 MHz 0 0.026 0.245 0.891 0.869 0.983
10 MHz 0.288 0.472 0.576 0.978 0.978 0.991
11 MHz 0.179 0.424 0.533 0.987 0.974 1
14 MHz 0.122 0.258 0.380 0.987 0.978 0.996
18 MHz 0.153 0.183 0.253 1 0.991 1
Table V. Modem availabilities with DST=-050
2400 bps 1200 bps 600 bps 300 bps 150 bps 75 bps
4 MHz 0 0 0.04 1 0.96 1
6 MHz 0 0 0.12 0.96 0.92 1
10 MHz 0.32 0.4 0.56 1 0.96 1
11 MHz 0.2 0.4 0.56 1 0.92 11
14 MHz 0.08 0.2 0.28 1 0.92 1
18 MHz 0.16 0.2 0.2 1 0.96 1
Vol52,3,2009 20-09-2009 19:06 Pagina 316
317
Aspects of HF radio propagation
00 06 12 18 005
10
15
20
25
30February
00 06 12 18 005
10
15
20
25
30March
00 06 12 18 005
10
15
20
25
30April
MU
F (
MH
z)
00 06 12 18 005
10
15
20
25
30May
00 06 12 18 005
10
15
20
25
30June
Time (UT)00 06 12 18 00
5
10
15
20
25
30July
Time (UT)
Fig. 13. Monthly median MUF on a path Cyprus-Leicester for February to July 2008. The observations areplotted as a solid line, while the dashed line represents predicted values from VOACAP (the predicted MUF(Es)is plotted as a dotted line in the July panel). All month-hours had at least 26 observations with the exception ofJuly, which only had 13 for all hours.
6. Assessment of HF channel availability under ionospherically disturbed conditions
Various workers have conducted investiga-tions on the signalling characteristics of HFchannels, and on the influence of the channelscattering characteristics on data communica-tions capabilities. For example, Jodalen et al.(2001) reported on a comparison between mo-dem characterisations and channel measure-ments from the Doppler and Multipath Sound-
ing Network (DAMSON) (Cannon et al.,2000). This system characterised narrow-bandchannels by measuring their SNR, Dopplerspread, and delay spread parameters. Measure-ments of these characteristics may then be ap-plied to three-dimensional performance sur-faces to assess signalling capability for varioustypes of modem.
For the path from Sweden to the UK dis-cussed earlier in this paper, Warrington andStocker (2003) previously reported the varia-tion in delay and Doppler spreading observed
Vol52,3,2009 20-09-2009 19:06 Pagina 317
318
E.M. Warrington, A. Bourdillon, E. Benito, C. Bianchi, J.-P. Monilie, M. Muriuki, M. Pietrella, V. Rannou, H. Rothkaehl, S. Saillant, O. Sari, A. J. Stocker, E. Tulunay, Y. Tulunay and N. Y. Zaalov
as a function of season and time of day. Thisprevious analysis did not consider variationswith ionospheric disturbance, a topic that is ad-dressed here. Joint probability density functions(PDFs) of SNR, Doppler spread, and effectivemultipath spread versus the Disturbance StormType (DST) index (see, for example fig. 14)were produced for measurements made over thepath from Uppsala, Sweden (59.92º N; 17.63ºE) and Leicester UK (52.63º N; 1.08º W) in2001. It has been demonstrated by Sari (2006)by determining the conditional PDFs and by us-ing Bayes’ Theorem, that there were dependen-cies between DST and the above mentionedsignal parameters.
As examples of modem characterizations,various military standards were considered. Inthese standards, HF modem performances arespecified in terms of effective multipath spread,Doppler spread, SNR, bit error rate, modulation
type, and data conversion (long-short inter-leaver). Modem availability was quantified as afraction of the time that the modem would func-tion satisfactorily (the availability of a modemcan be estimated by determining the differencebetween the measured SNR and the SNR re-quired to give an acceptable BER for a givendelay and Doppler spread - a positive SNR dif-ference indicates that the modem would operatesatisfactorily (see fig. 15)). Tables IV and Vshow the probability of modem availability fordifferent data rates and frequencies accordingto requirements defined in STANAG 4538.
7. Concluding remarks
Various propagation related topics of directrelevance to the planning and operation of HFradio systems have been investigated during the
Fig. 14. Joint PDF for hourly mean of SNR and negative of DST, 4 MHz (Sari, 2006).
Joint pdf for hourly_mean (SNR) and neg (DST), f = 4 MHz
0.025
0.02
0.015
0.01
0.005
0
020
40600
400 300200
1000
hourly mean (SNR) neg(DST)
Vol52,3,2009 20-09-2009 19:06 Pagina 318
319
Aspects of HF radio propagation
COST 296 Action, outline details of which arepresented in this paper. For mid-latitude paths,these investigations have included comparisonsbetween predicted channel MUFs for a pathfrom Cyprus to the UK with predicted valuesobtained using VOACAP. Significant progresshas been made in relation to the operation ofHF over the horizon radars. Such systems re-quire detailed knowledge of the ionosphericelectron density profile. In the work presentedhere, the radar is operated as a backscattersounder for a period to measure the backscattercharacteristics as a function of frequency andelevation angle. These measurements are theninput to a new inversion technique to obtain therequired electron density profile.
The results presented in the paper illustratethe importance of understanding and taking in-to account the presence of various structuralfeatures in the northerly ionosphere, i.e. the
electron depletion and irregularities associatedwith the sub-auroral trough, patches and arcs ofenhanced electron density within the polar cap,and irregularities within the auroral zone whenplanning and operating HF radio links. Thesefeatures result in radiowaves propagating overpaths well displaced from the great circle direc-tion and have clear relevance in the operation ofHF radiolocation (HF-DF) systems where devi-ations from the great circle path may result insignificant (sometimes inter-continental) trian-gulation errors. A full understanding of the pre-vailing propagation mechanisms will enable ap-propriate selection of receiver sites to be madein order to optimise the positional accuracy.However, the impact of these propagation ef-fects is much wider than this particular applica-tion, extending to almost any HF communica-tions system where the signal impacts on theionosphere within the region polewards of the
Fig. 15. Approximated availability surface according to STANAG 4538 (NATO, 2000).
SN
R (
dB)
Available Point
Unavailable Point
Doppler Spread (Hz)
Multipath (m
s)
Vol52,3,2009 20-09-2009 19:06 Pagina 319
320
E.M. Warrington, A. Bourdillon, E. Benito, C. Bianchi, J.-P. Monilie, M. Muriuki, M. Pietrella, V. Rannou, H. Rothkaehl, S. Saillant, O. Sari, A. J. Stocker, E. Tulunay, Y. Tulunay and N. Y. Zaalov
sub-auroral trough. This has been illustratedhere by employing the northerly ionosphericmodel to indicate the effect of polar patches onthe coverage area of two transmitters located atArctic sites. Development of this aspect is cur-rently being undertaken with the aim of im-proving the HF communications forecasts andnowcasts available to the airlines when operat-ing on trans-polar routes (note that over-conser-vative forecasts of the likelihood of disturbedcommunications results on flights being rerout-ed to non-polar routes with consequent increas-es in flight time and fuel usage). In addition tothe directionally related effects referred toabove, the channel transfer characteristics arealso affected by the presence of the ionosphericstructures, in particular increases in delay andDoppler spread are evident. These increasedspreads limit the available data throughputavailable on a particular channel, or alternative-ly the system availability may be reduced for aparticular type of modem. Consideration of thisaspect has been given for the trough path.
Acknowledgements
The authors would like to thank theSwedish Meteorological Institute, Uppsala andthe Finnish Meteorological Institute, Helsinkifor hosting the transmitter systems. The authorswould also like to acknowledge support fromthe EPSRC under various grants.
REFERENCES
BATES, H.F. and R.D. HUNSUCKER (1974): Quiet and dis-turbed electron-density profiles in auroral zone iono-sphere, Radio Science, 9 (4), 455-467.
BILITZA, D. (ed.) (1990): International Reference Ionosphere1990, NSSDC 90-22, (Greenbelt, Maryland, USA).
BILITZA, D. (2001): International Reference Ionosphere2000, Radio Science, 36 (2), 261-275.
BRADLEY, P.A. and J.R. DUDENEY (1973): A simple modelof the vertical distribution of electron concentration inthe ionosphere, Journal of Atmospheric and TerrestrialPhysics, 35, 2131-2146.
BUCHAU, J., B.W. RENISCH, E.J. WEBER and J.G. MOORE
(1983): Structure and dynamics of the winter polar capF region, Radio Science, 18, 995-1010.
CARLSON, H.C. JR., V.B. WICKWAR, E.J. WEBER, J.BUCHAU, J.G. MOORE and W. WHITING (1984): Plas-ma characteristics of polar cap F layer arcs, Geophysi-
cal Research Letters, 11, 895-898.CANNON, P.S., M.J. ANGLING and N.J. DAVIES (2000):
DAMSON HF Channel Characterisation - A review,21st Century Military Communications ConferenceProceedings, 1 (2), 59-64.
CCIR (1966): Atlas of ionospheric characteristics, Report340-1, ITU, (Geneva, Switzerland).
COLEMAN, C.J. (1998): A ray-tracing formulation and itsapplication to some problems in over-the-horizonradar, Radio Science, 33 (4), 1187-1197.
DYSON, P.L. and P.A. BENNETT (1988): A model of verticaldistribution of the electron concentration in the iono-sphere and its application to oblique propagation stud-ies, Journal of Atmospheric and Terrestrial Physics, 50(3), 251-262.
GOLDBERG, D.E. (1989): Genetic algorithms in search, op-timization and machine learning, edited by Addison-Wesley Publishing Company.
HALCROW, B.W. and J.S. NISBET (1977): A model of the F2peak electron densities in the main trough region of theionosphere, Radio Science, 12, 815-820.
HAYDON, G.W. and D.L. LUCAS (1968): Predicting iono-sphere electron density profiles, Radio Science, 3 (13),111-119.
ITU (INTERNATIONAL TELECOMMUNICATIONS UNION) (1997):Standardized procedure for comparing predicted andobserved HF sky-wave signal intensities and the pres-entation of such comparisons, ITU-R Recommenda-tion P1148-1.
JODALEN, V., T. BERGSVIK, P.S. CANNON and P.C. ARTHUR
(2001): Performance of HF modems on high-latitudepaths using multiple frequencies, Radio Science, 36(6), 1687-1698.
JONES, R.M. and J.J. STEPHENSON (1975): A VersatileThree-Dimensional Ray Tracing Computer Programfor Radio Waves in the Ionosphere, Office of Telecom-munications, OT 75-76, (U.S Department of Com-merce, Washington, USA).
KIRKPATRICK, S., C.D. GELATT, Jr. and M.P. VECCHI (1983):Optimisation by Simulated Annealing, Science, 220(4598), 671-680.
LANDEAU, T., F. GAUTHIER and N. RUELLE (1997): Furtherimprovements to the inversion of elevation-scanbackscatter sounding data, Journal of Atmospheric andSolar-Terrestrial Physics, 59 (1), 125-138.
NATO (2000): STANAG 4538 Technical Standards for anAutomatic Radio Control System (ARCS) for HF com-munication links, (NATO Military Agency for Stan-dardisation).
NGDC (2008): National Geophysical Data Centre, Boulder,Colorado USA, ftp://ftp.ngdc.noaa.gov/STP/SO-LAR_DATA/SUNSPOT_NUMBERS/2008
NORMAN, R.J., J.A. BENNETT, P.L. DYSON and J.A.NGUYEN (1994): HIRT: homing-in ray tracing pro-gram, research report, School of Physics., (La TrobeUniversity, Bundoora, Victoria, Australia).
NORMAN, R.J. and P.S. CANNON (1997): A two-dimension-al analytic ray tracing technique accommodating hori-zontal gradients, Radio Science, 32 (2), 387-396.
NORMAN, R.J. and P.S. CANNON (1999): An evaluation of anew two-dimensional analytic ionospheric ray-tracingtechnique: Segmented method for analytic ray tracing(SMART), Radio Science, 34 (2), 489-499.
Vol52,3,2009 20-09-2009 19:06 Pagina 320
321
Aspects of HF radio propagation
PIETRELLA, M., E.M. WARRINGTON, A.J. STOCKER and C.BIANCHI (2009): Time of flight measurements over aradio-link from Uppsala to Bruntingthorpe and theirapplication to testing predictions methods that approx-imate the ray tracing technique, Advances in Space Re-search, doi:10.1016/j.asr.2008.09.038.
ROGERS, N.C., E.M. WARRINGTON and T.B. JONES (1997):Large HF bearing errors for propagation paths tangen-tial to the auroral oval, IEE Proceedings on Mi-crowaves, Antennas and Propagation, 144 (2), 91-96.
SARI, M.O. (2006): A New Approach For The Assessmentof HF Channel Availability Under Ionospheric Distur-bances, MS Thesis, Electrical and Electronics Eng.,(Middle East Technical Univ., Ankara, Turkey).
SIDDLE, D.R., A.J. STOCKER and E.M. WARRINGTON
(2004a): The time-of-flight and direction of arrival ofHF radio signals received over a path along the mid-lat-itude trough: observations, Radio Science, 39 (4),RS4008, doi:10.1029/2004RS003049.
SIDDLE, D.R., A.J. STOCKER and E.M. WARRINGTON
(2004b): The time-of-flight and direction of arrival ofHF radio signals received over a path along the mid-lat-itude trough: theoretical considerations, Radio Science,39 (4), RS4009, doi:10.1029/2004RS003052.
STOCKER, A.J., E.M. WARRINGTON and T.B. JONES (2003):A comparison of observed and modelled deviations fromthe great circle direction for a 4490 km HF propagationpath along the mid-latitude ionospheric trough, RadioScience, 38 (3), 1045, doi:10.1029/2002RS002781.
STOCKER, A.J., N.Y. ZAALOV, E.M. WARRINGTON andD.R. SIDDLE (2009): Observations of HF propagationon a path aligned along the mid-latitude trough, Ad-vances in Space Research, 44 (1), 64-71,doi:10.1016/j.asr.2009.03.07.
STEWART, F.G (undated): ICEPAC (Ionospheric Communi-cations Enhanced Profile Analysis and Circuit analysisprogram) Technical Manual, (available for download athttp://www.greg-hand.com/manuals/icepac_tech_man-ual.pdf).
TARANTOLA, A. (1987): Inverse Problem Theory, Methodsfor data fitting and model parameter estimation, editedby Elsevier Science.
WARRINGTON, E.M. and A.J. STOCKER (2003): Measure-ments of the Doppler and multipath spread of HF sig-nals received over a path oriented along the mid-lati-tude trough, Radio Science, 38 (5), 1080,doi:10.1029/2002RS002815.
WEBER, E.J., J. BUCHAU, J.G. MOORE, J.R. SHARBER, J.D.LIVINGSTON, J.D. WINNINGHAM and B.W. REINISCH
(1984): F layer ionization patches in the polar cap,Journal of Geophysical Research, 89, 1683-1694.
ZAALOV, N.Y., E.M. WARRINGTON and A.J. STOCKER (2003):The simulation of off-great circle HF propagation effectsdue to the presence of patches and arcs of enhanced elec-tron density within the polar cap ionosphere, Radio Sci-ence, 38 (3), 1052, doi:10.1029/2002RS002798.
ZAALOV, N.Y., E.M. WARRINGTON and A.J. STOCKER
(2005): A ray-tracing model to account for off-greatcircle HF propagation over northerly paths, Radio Sci-ence, 40 (4), RS4006, doi:10.1029/2004RS003183.
ZOLESI, B., L.R. CANDER and G. DE FRANCESCHI (1993):Simplified ionospheric regional model for telecommu-nication application, Radio Science, 28 (4), 603-612.
ZOLESI, B., L.R. CANDER and G. DE FRANCESCHI (1996):On the potential applicability of the simplified ionos-pheric regional model to different mid-latitude areas,Radio Science, 31 (3), 547-552.