Aspects of the Fracture Toughness of Carbon Nanotube Modified Epoxy Polymer Composites Vahid Mirjalili Doctor of Philosophy Department of Mechanical Engineering, Facutly of Engineering McGill University Montreal, Quebec, Canada Nov. 25, 2010 A thesis submitted to McGill University in partial fulfillment of the requirements for a doctoral degree Copyright 2010 All rights reserved.
Transcript
Aspects of the Fracture Toughness of Carbon Nanotube Modified
Epoxy Polymer Composites
Vahid Mirjalili
Doctor of Philosophy
Department of Mechanical Engineering, Facutly of Engineering
McGill University
Montreal, Quebec, Canada
Nov. 25, 2010
A thesis submitted to McGill University in partial fulfillment of the requirements for a
doctoral degree
Copyright 2010 All rights reserved.
DEDICATION
To my family who always supported my dreams
iii
ABSTRACT
Epoxy resins used in fibre reinforced composites exhibit a brittle fracture behaviour,
because they show no sign of damage prior to a catastrophic failure. Rubbery materials
and micro-particles have been added to epoxy resins to improve their fracture toughness,
which reduces strength and elastic properties. In this research, carbon nanotubes (CNTs)
are investigated as a potential toughening agent for epoxy resins and carbon fibre
reinforced composites, which can also enhance strength and elastic properties. More
specifically, the toughening mechanisms of CNTs are investigated theoretically and
experimentally. The effect of aligned and randomly oriented carbon nanotubes (CNTs) on
the fracture toughness of polymers was modelled using Elastic Plastic Fracture Mechanics.
Toughening from CNT pull-out and rupture were considered, depending on the CNTs
critical length. The model was used to identify the effect of CNTs geometrical and
mechanical properties on the fracture toughness of CNT-modified epoxies. The modelling
results showed that a uniform dispersion and alignment of a high volume fraction of CNTs
normal to the crack growth plane would lead to the maximum fracture toughness
enhancement. To achieve a uniform dispersion, the effect of processing on the dispersion
of single walled and multi walled CNTs in epoxy resins was investigated. An instrumented
optical microscope with a hot stage was used to quantify the evolution of the CNT
dispersion during cure. The results showed that the reduction of the resin viscosity at
temperatures greater than 100 °C caused an irreversible re-agglomeration of the CNTs in
the matrix. The dispersion quality was then directly correlated to the fracture toughness
of the modified resin. It was shown that the fine tuning of the ratio of epoxy resin, curing
agent and CNT content was paramount to the improvement of the base resin fracture
toughness. For the epoxy resin (MY0510 from Hexcel), an improvement of 38% was
achieved with 0.3 wt.% of Single Walled CNT (SWNT). Finally, the CNT-modified epoxy
resin was used to manufacture carbon fibre laminates by resin film infusion and prepreg
technologies. The Mode I and Mode II delamination properties of the CNT-modified
composite increased by 140% and 127%, respectively. In contrast, this improvement was
not observed for the base CNT-modified polymers, used to manufacture the composite
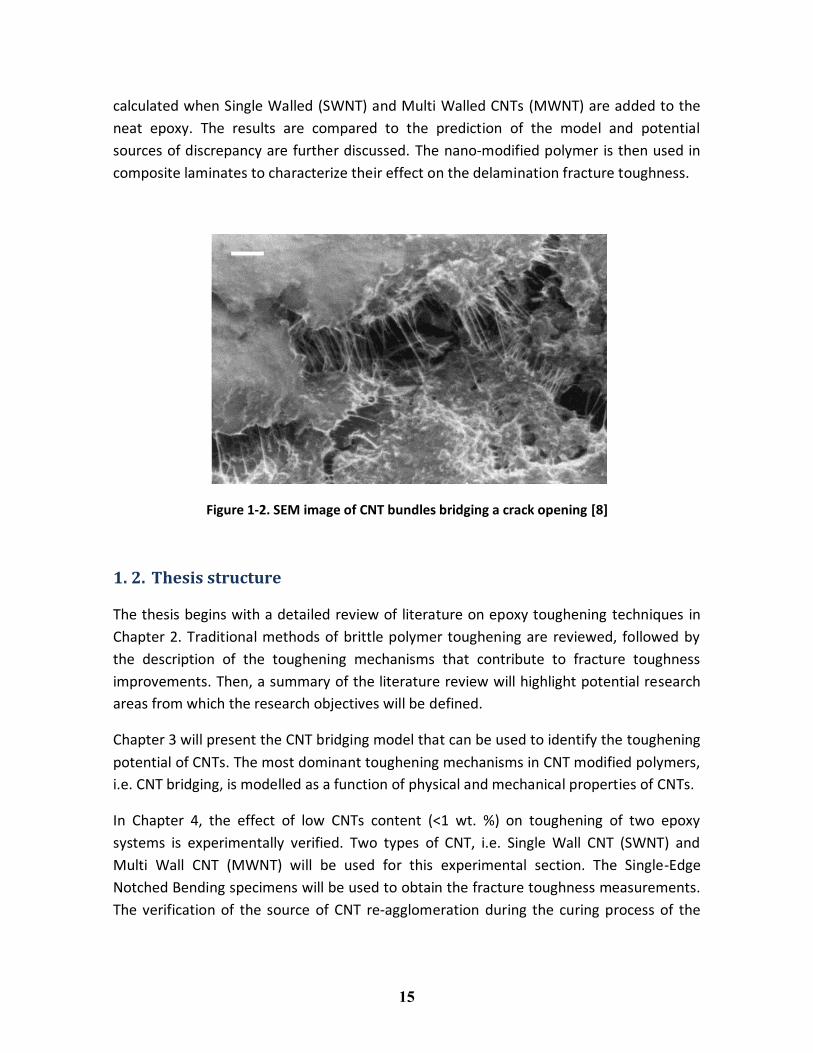
laminates. A qualitative analysis of the fractured surface using a Scanning Electron
Microscope revealed a good dispersion in the composites samples, confirming the
importance of processing to harness the full potential of carbon nanotubes for toughening
polymer composites.
iv
RÉSUMÉ
Les résines époxy utilisées dans des composites à renforts fibreux ont en général un
comportement à rupture fragile qui peut conduire à une rupture catastrophique des
composites. Afin d’améliorer leur ténacité à la rupture, des matériaux caoutchouteux et
des microparticules sont ajoutés, au dépend de leurs propriétés mécaniques. Dans cette
recherche, des nanotubes de carbone (CNTs) ont été ajoutés à la résine époxy pour
améliorer sa ténacité. Plus spécifiquement, les mécanismes de résistance à la rupture des
nanotubes de carbone ont été étudiés de façon expérimentale et numérique. Tout
d’abord, l’effet de l’alignement des nanotubes de carbone (aligné ou aléatoire) sur la
résistance à la rupture a été modélisé en utilisant les lois de mécanique de la rupture
élastique et plastique. L’influence de la longueur critique des CNT sur les conditions de
rupture et sur les mécanismes de résistance à la rupture par arrachement des nanotubes à
été considérée. Le modèle développé a été ensuite utilisé pour identifier l’effet des
propriétés géométriques et mécaniques des nanotubes de carbone sur la ténacité à la
rupture des résines époxy modifiées. Les résultats montrent qu’une dispersion uniforme
ainsi qu’une orientation des nanotubes de carbone perpendiculairement à la direction de
propagation de la fissure conduisent à une amélioration de la ténacité de la résine. L’effet
du procédé de fabrication sur la dispersion des nanotubes de carbone à paroi simple et à
parois multiples a été également étudié expérimentalement. Une plaque chauffante
instrumentée avec un microscope optique a été utilisée pour quantifier la dispersion des
CNT pendant la polymérisation de la résine. Les résultats montrent qu’une réduction de la
viscosité de la résine à des températures supérieures à 100ºC cause une ré-agglomération
irréversible des CNT dans la matrice. La qualité de la dispersion a été ensuite corrélée à la
ténacité de la résine modifiée. La détermination d’un ratio optimum entre la résine époxy,
le catalyseur et la concentration de CNT est primordiale pour améliorer la ténacité de base
de la résine. Pour la résine époxy étudiée (MY0510 de Hexcel), une amélioration de 38% a
été obtenue avec 0.3% de CNT à paroi simple. Finalement, la résine modifiée avec les CNT
a été utilisée pour fabriquer des laminés avec des renforts de fibres de carbone par les
procédés d’infusion de résine et de préimprégnés. Les propriétés de délamination du
composite ont été augmentées d’un maximum de 140% (mode I) et 127% (mode II) par
rapport aux propriétés de base du composite. Cette amélioration n’a pas été observée
pour les échantillons de résine modifiée sans renfort. Une analyse qualitative de la surface
de cassure par microscope électronique à balayage (SEM) révèle une bonne dispersion des
CNT dans le composite. Ceci reconfirme l’importance du procédé de fabrication et de la
dispersion afin d’utiliser les nanotubes de carbone au maximum de leur potentiel pour
renforcer les composites à matrice polymère.
v
ACKNOWLEDGMENTS
I am grateful to my research supervisor Prof. Pascal Hubert, Associate Professor in the
Mechanical Engineering Department, for his support and guidance throughout my work.
His inspiring advice and criticism guided this thesis all the way to the end. This work would
have never been done without his great vision, experience, and insight.
I want to express my high gratitude to Dr. Benoit Simard and Dr. Yakienda Martinez-Rubi
from the Steacie Institute for Molecular Studies and Dr. Behnam Ashrafi, and Dr. Andrew
Johnston from the Institute for Aerospace Research of the National Research Council of
Canada in Ottawa for their valuable input and collaboration in the success of this project.
Also, our collaborators at Bombardier Aerospace, Dr. Abdelatif Atarsia, and at Nanoledge
Inc., Dr. Patrice Lucas, greatly contributed to the success of this project.
Many thanks and appreciation goes to my friends at Structures and Composite Materials
Laboratory who have helped, supported and made my time enjoyable during my PhD
studies at McGill University, specially Dr. Mousavand T., Mr. Lallemand M., Mr.
Ramachandramoorthy R., and Mr. Yourdkhani M. for their contribution in different parts
of the experimental work. My sincere gratitude goes to Ms. Khoun L. and Mr. Kratz J. for
their valuable inputs to the thesis. I am also thankful to Profs. Musa Kamal, Francois
Barthelat and Raynald Gauvin for giving me access to their laboratories at McGill
University.
Financial support from Fonds québécois de la recherche sur la nature et les technologies
and the Natural Sciences and Engineering Research Council is greatly appreciated.
Last, but not least, I am sincerely thankful to my family for their incredible support. I am
lucky to have a wonderful, loving, and supportive family; I want to thank them all.
vi
TABLE OF CONTENTS
DEDICATION .................................................................................................................................. ii
TABLE OF CONTENTS ................................................................................................................. vi
LIST OF TABLES .......................................................................................................................... viii
LIST OF FIGURES......................................................................................................................... ix
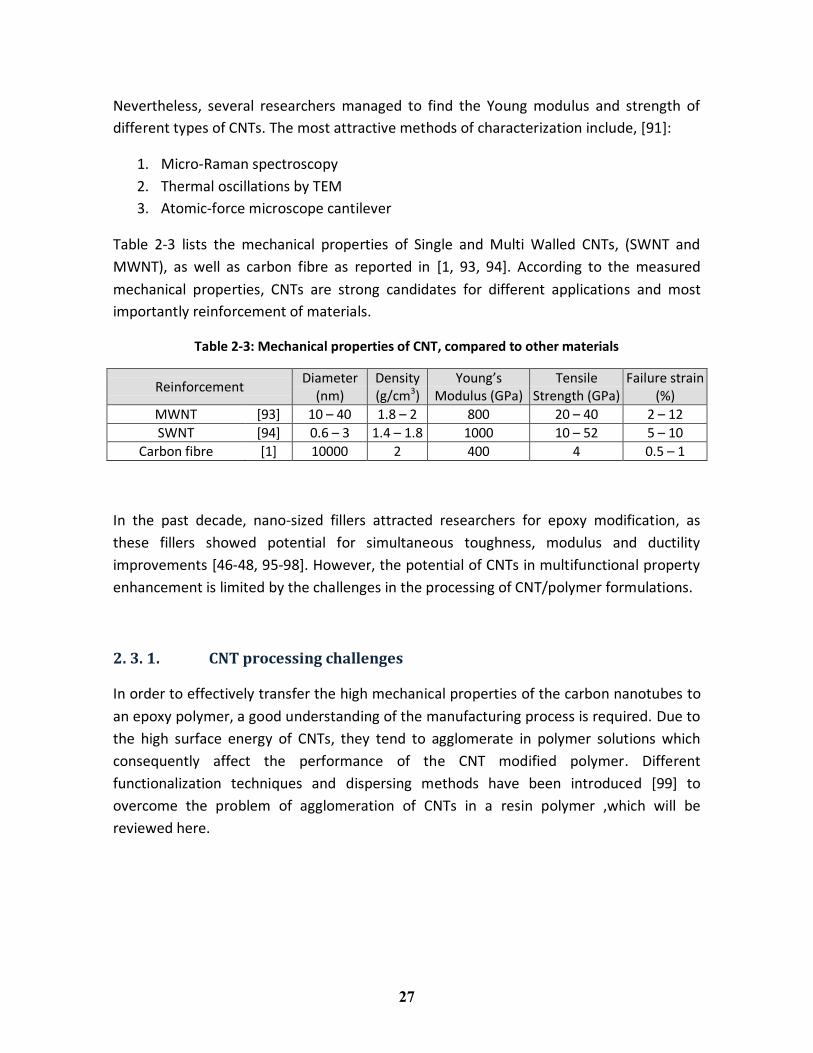
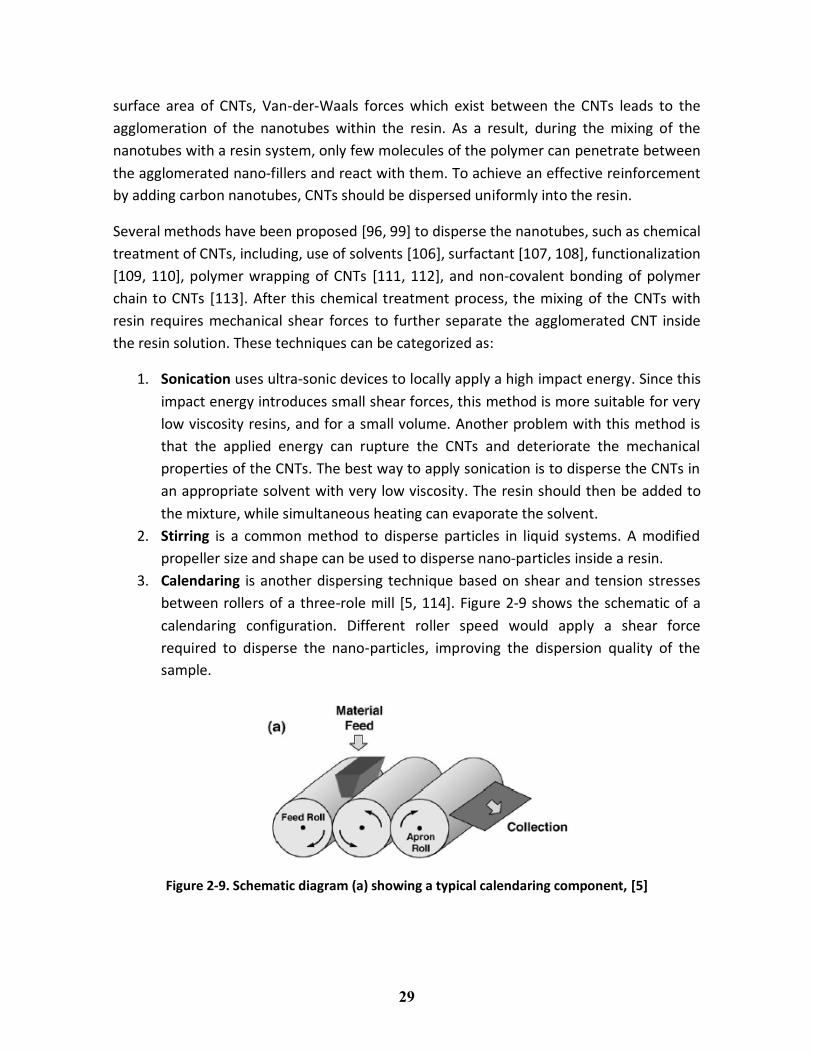
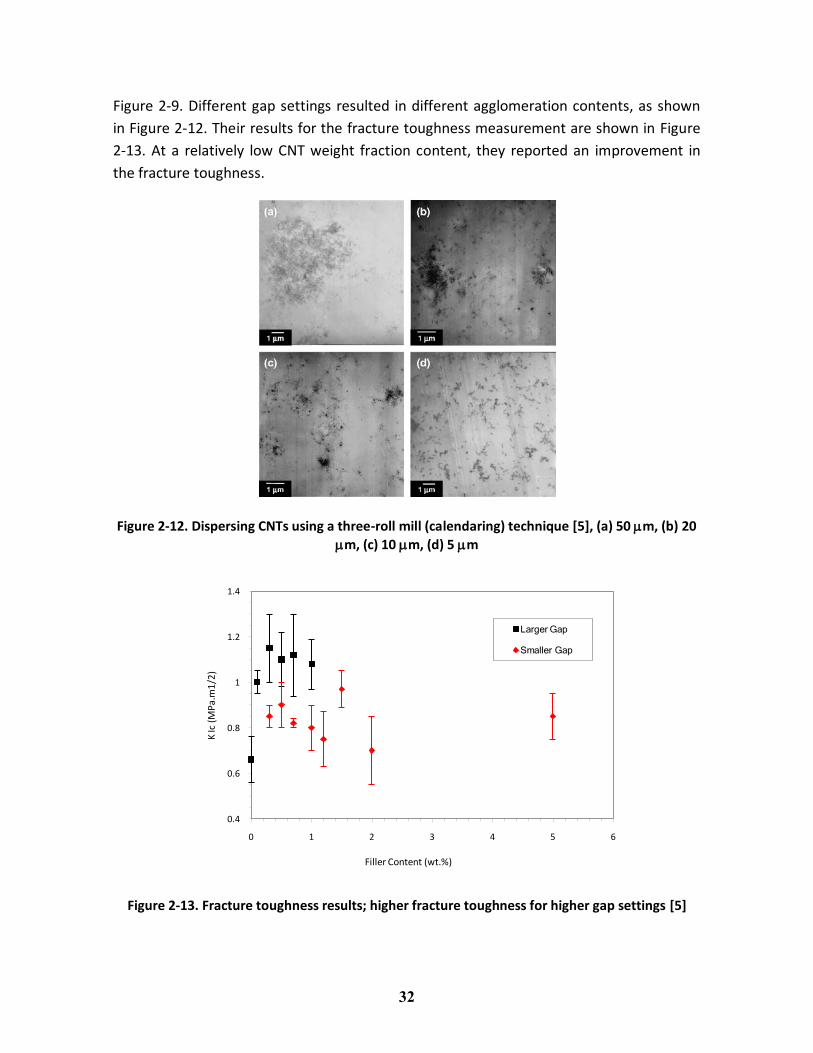
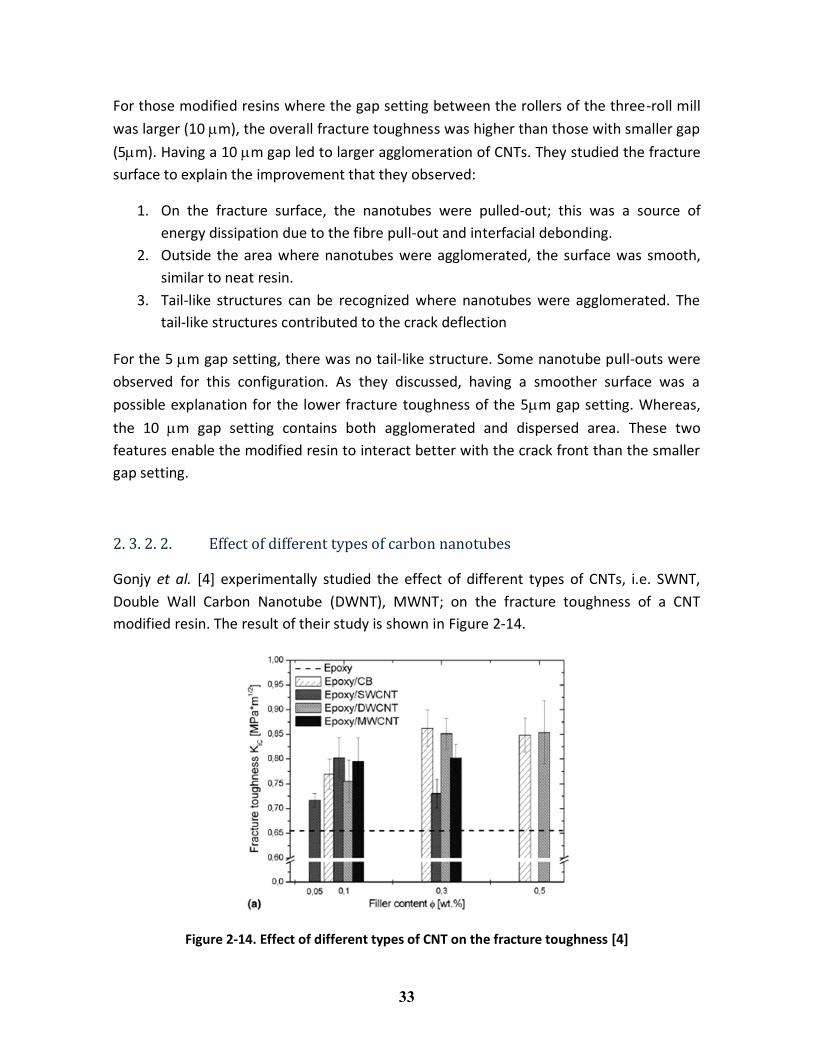
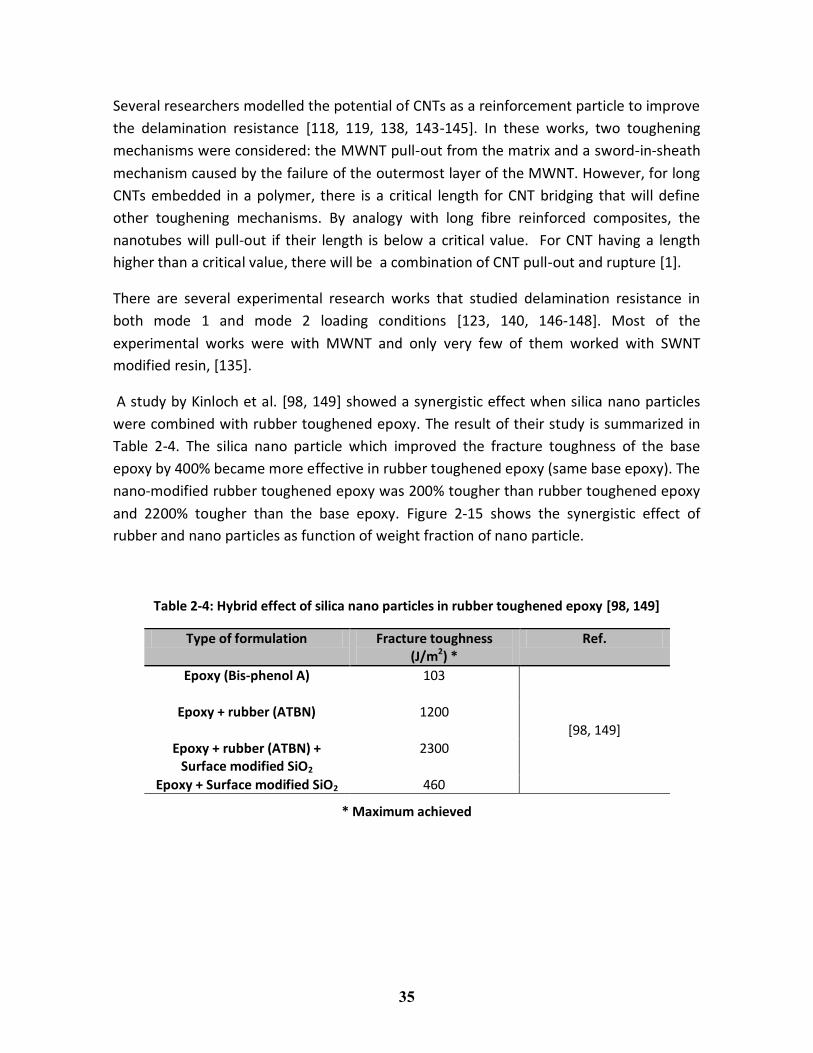
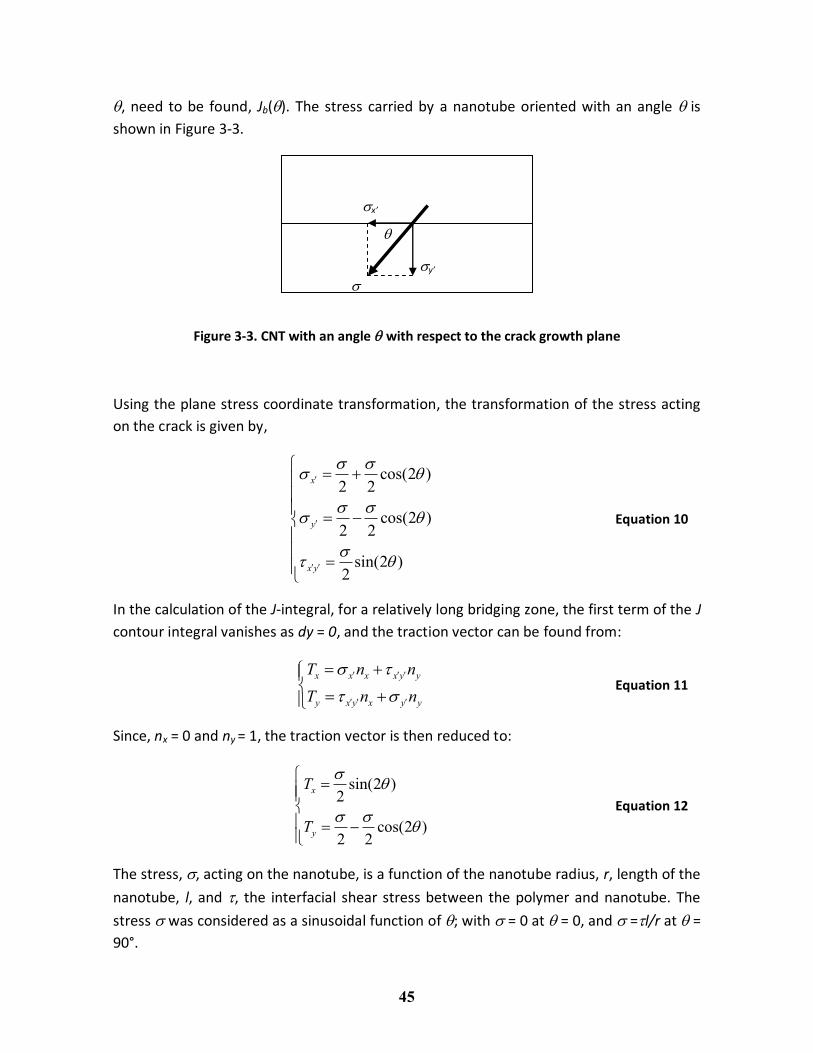
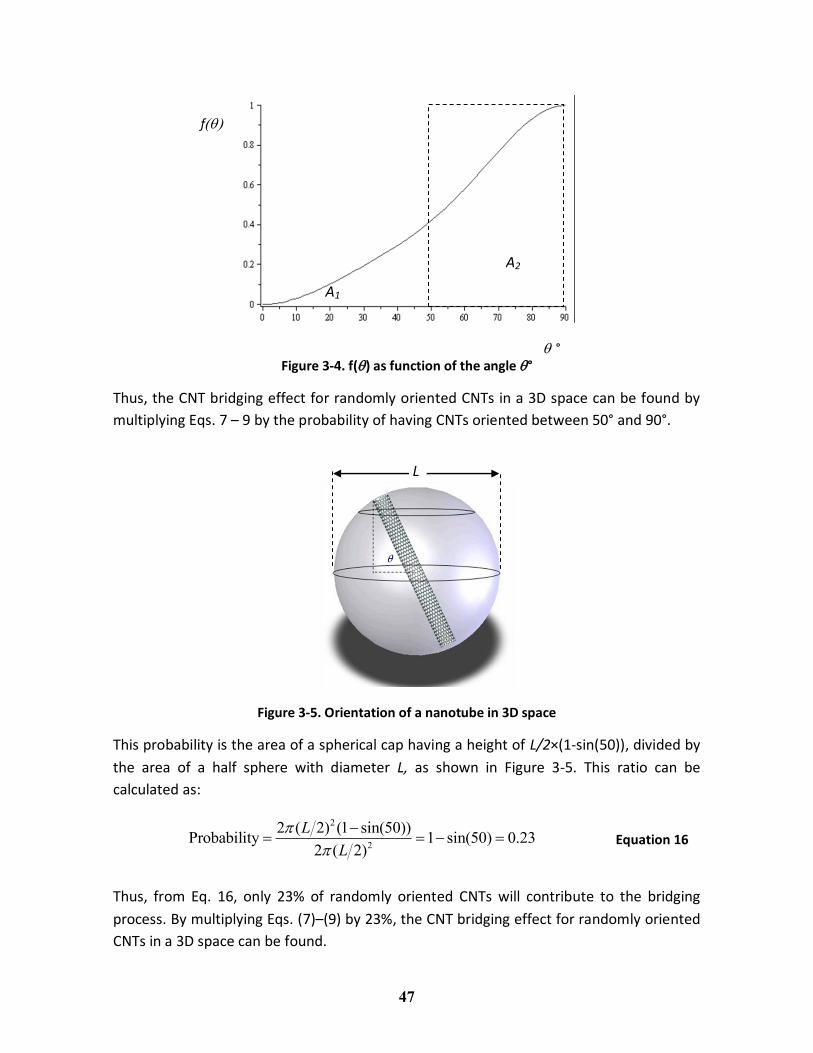
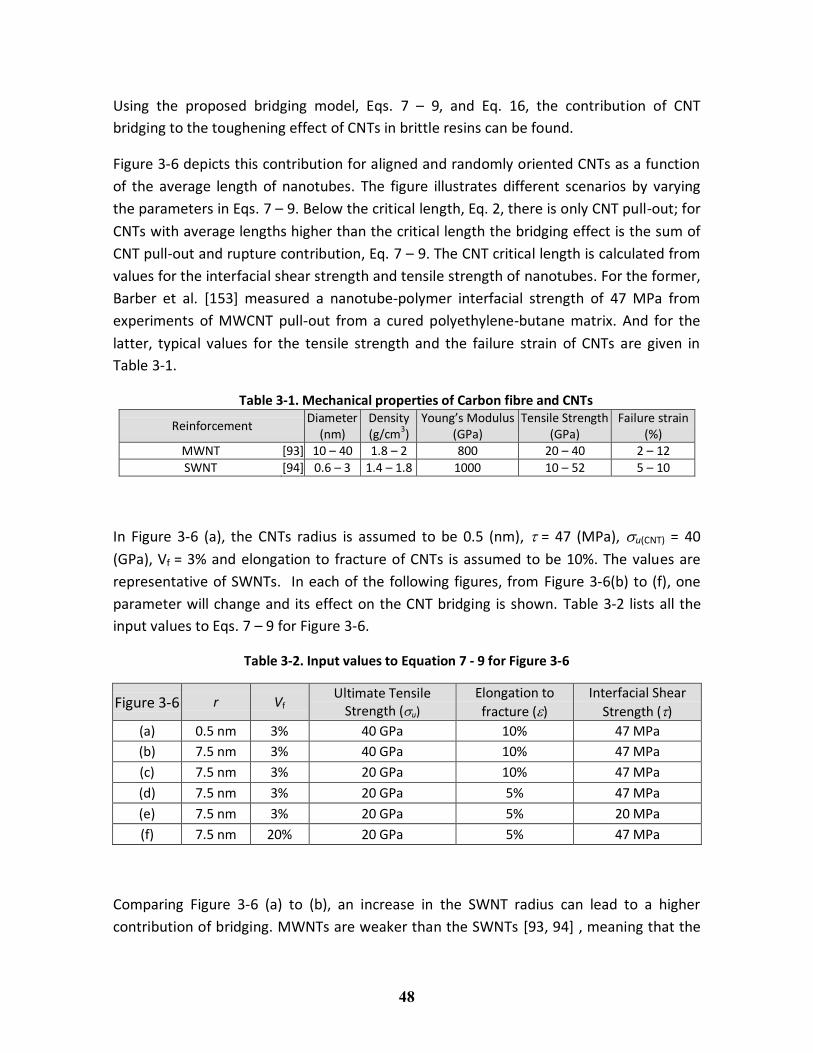
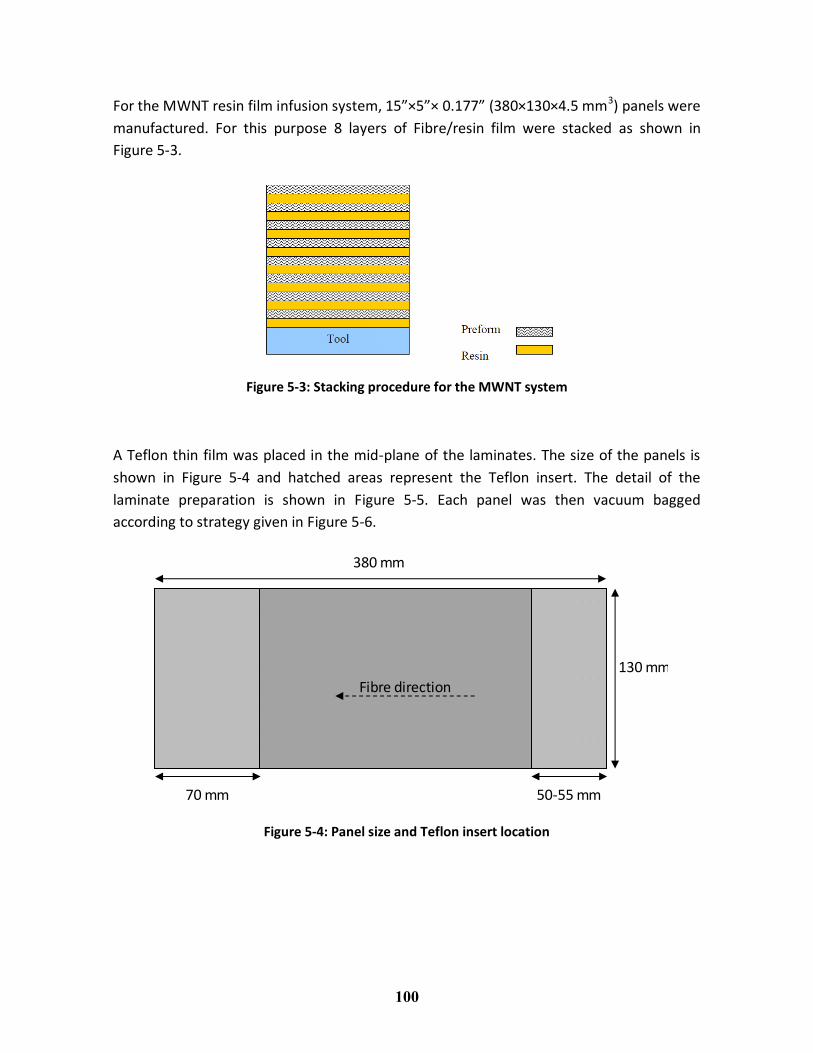
The specimen dimensions were chosen according to the standard test methods for plain-
strain fracture toughness of plastic materials, ASTM D5045 – 91. The dimensions of the
samples were of special importance to measure geometry-independent values for fracture
toughness. To minimize material use, Single Edge Notch Bending (SENB) test was chosen
56
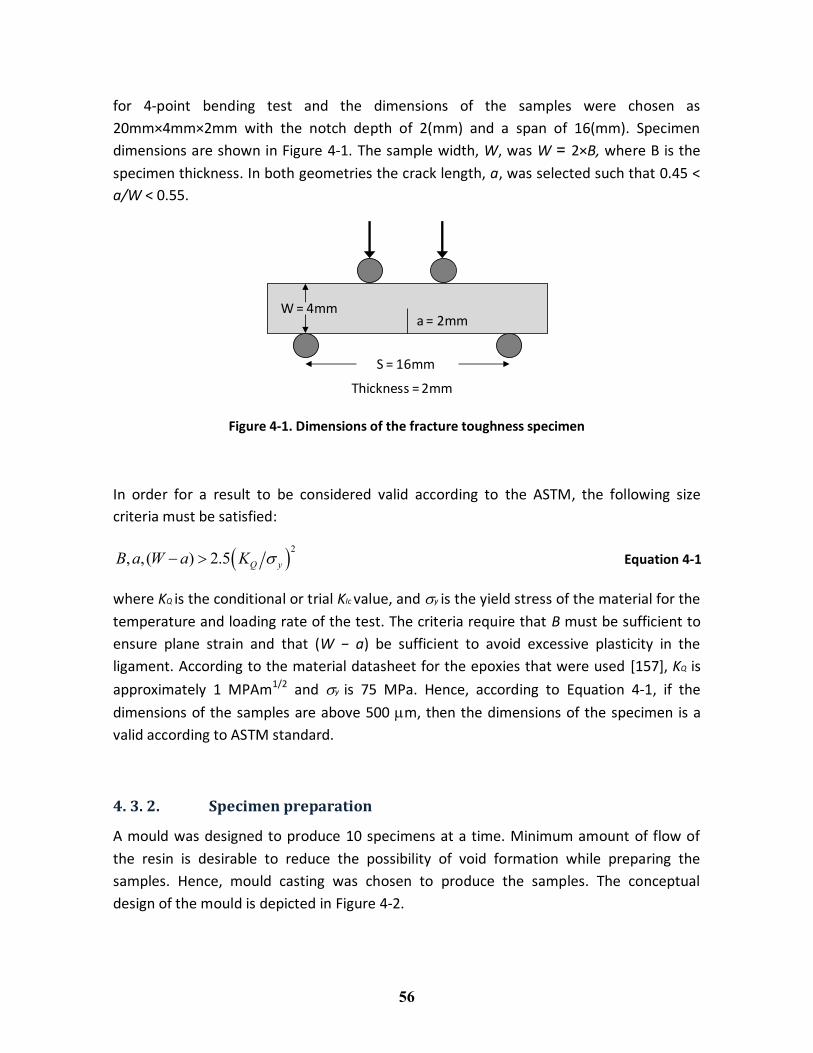
for 4-point bending test and the dimensions of the samples were chosen as
20mm×4mm×2mm with the notch depth of 2(mm) and a span of 16(mm). Specimen
dimensions are shown in Figure 4-1. The sample width, W, was W = 2×B, where B is the
specimen thickness. In both geometries the crack length, a, was selected such that 0.45 <
a/W < 0.55.
Figure 4-1. Dimensions of the fracture toughness specimen
In order for a result to be considered valid according to the ASTM, the following size
criteria must be satisfied:
2
, , ( ) 2.5 Q yB a W a K Equation 4-1
where KQ is the conditional or trial KIc value, and y is the yield stress of the material for the
temperature and loading rate of the test. The criteria require that B must be sufficient to
ensure plane strain and that (W − a) be sufficient to avoid excessive plasticity in the
ligament. According to the material datasheet for the epoxies that were used [157], KQ is
approximately 1 MPAm1/2 and y is 75 MPa. Hence, according to Equation 4-1, if the
dimensions of the samples are above 500 m, then the dimensions of the specimen is a
valid according to ASTM standard.
4. 3. 2. Specimen preparation
A mould was designed to produce 10 specimens at a time. Minimum amount of flow of
the resin is desirable to reduce the possibility of void formation while preparing the
samples. Hence, mould casting was chosen to produce the samples. The conceptual
design of the mould is depicted in Figure 4-2.
Thickness = 2mm
a = 2mm
S = 16mm
W = 4mm
57
(a) Conceptual design of the mould (b) Top Teflon insert (dimensions in mm)
(c) The picture of the mould in use
Figure 4-2. Casting mould for fracture toughness specimen preparation
The mould contained two Teflon inserts (shown in white color in Figure 4-2(a)) where the
resin was poured. Having channels on the top Teflon insert allowed easier sample
removal. The aluminum components (shown in grey) were used to close and seal the
mould. After the mould was closed, a 5 bar pressure was applied on one end of the
channels. The pressure forced the resin into the channels and minimized the size of any
possible voids. The mould was then heated according to the recommended cure cycle of
the resin (Table 4-2 and Table 4-3). The actual picture of the closed mould with applied
pressure is shown in Figure 4-2(c).
After removing the samples from the mould, the samples were notched to create the
initial crack, a. A sharp notch was first prepared with depth of 1.7 mm and width of 300
m using the Accutom model of Struers precision diamond saw. Subsequently, a natural
58
crack was initiated by sliding a fresh razor blade across the notch root with depth of
around 300 m.
4. 3. 3. Fracture toughness measurement test setup
A 100lb Fullam tensile fixture (Figure 4-3) was used to perform the tests under an Optical
Microscope (Olympus BX-51M). The samples were tested at room temperature ranging
from 23 – 26 °C.
Metrology was conducted for measuring specimen thickness at two locations and
specimen width at three locations using a micrometer. The crack length was measured
under the optical microscope prior to the fracture test on both ends of the crack front.
The specimen was installed in the test fixture and aligned visually such that the loading pin
was at the centre of specimen thickness and the specimen was not twisted. Also to ensure
a constant moment during the crack propagation, a 4-point bending fixture was used to
apply the load, and an equivalent 3-point bending force was used in the data reduction.
The data acquisition system was zeroed and started. A very slow loading rate of 0.005
mm/s was chosen to ensure a slow crack growth. The load-displacement curve for each
test was recorded for data reduction to find the fracture toughness values.
Figure 4-3. Fullam tensile test fixture and the initial crack under optical microscope
The plane-strain fracture toughness, KIC was calculated from the maximum load, Pmax as
follows:
1/2
max ( )ICK P BW f x Equation 4-2
59
where,
2
3/2
(1.99 (1 )(2.15 3.93 2.72 ))( ) 6
(1 2 )(1 )
x x x xf x x
x x
Equation 4-3
and,
Wx
a Equation 4-4
where W is the specimen width and B is the specimen thickness and a is the crack length.
The detail of the data reduction is given in [158]. In this thesis, all the polymer fracture
tests were performed under 4-point bending loading condition and an equivalent 3-point
bending load was used to calculate the stress intensity fracture toughness values.
4. 3. 4. Hot stage: dispersion analysis
One of the key parameters that affect the mechanical properties of CNT modified
polymers is the dispersion quality of the samples; not only at room temperature and
during the mixing of the CNTs with resin, but also after casting the samples prior to the
gelation point of the resin. A well dispersed sample is highly desirable to achieve proper
load transfer from the structure to its nano structure. Poor dispersion may deteriorate the
strength and the fracture toughness values of CNT modified resins compared with the
neat resin.
The effect of elevated temperature on the deterioration of the CNT dispersion quality was
noticed during the sample preparation. To verify the effect of temperature on dispersion
degradation prior to the gelation point of the resin mixtures, a systematic series of tests
was performed. The main focus of these tests was to understand the effect of the curing
process on the dispersion quality of a CNT-modified polymer.
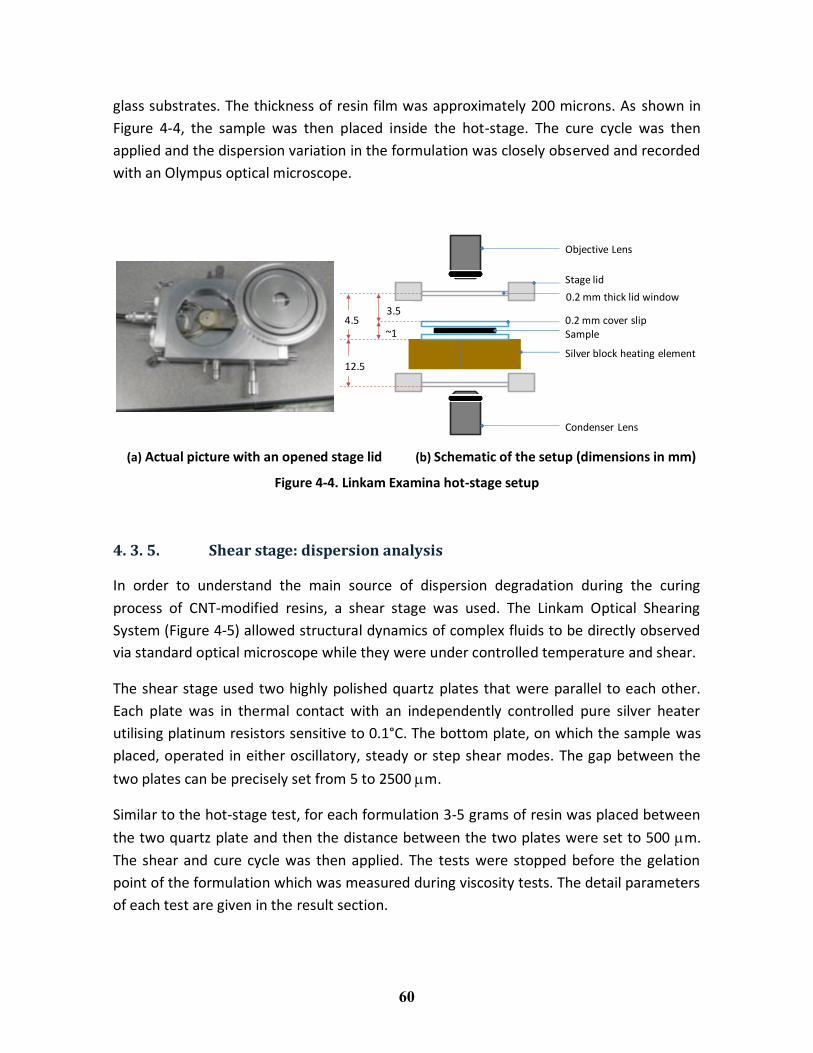
A Linkam Examina Dynamic hot-stage was used (Figure 4-4) to monitor the changes in
dispersion quality during the curing process of CNT-modified polymers. The hot-stage is
designed to be used with an upright microscope, where the objective lens is above the
sample. The objective lens is isolated from the sample by the stage lid window which is a
fixed distance from the heating/cooling element. A magnification of 250× was used for all
the images.
For each test, 1 gram from the same formulation that was prepared for fracture toughness
specimens was used for the hot-stage test. A drop of formulation was placed between two
60
glass substrates. The thickness of resin film was approximately 200 microns. As shown in
Figure 4-4, the sample was then placed inside the hot-stage. The cure cycle was then
applied and the dispersion variation in the formulation was closely observed and recorded
with an Olympus optical microscope.
(a) Actual picture with an opened stage lid (b) Schematic of the setup (dimensions in mm)
Figure 4-4. Linkam Examina hot-stage setup
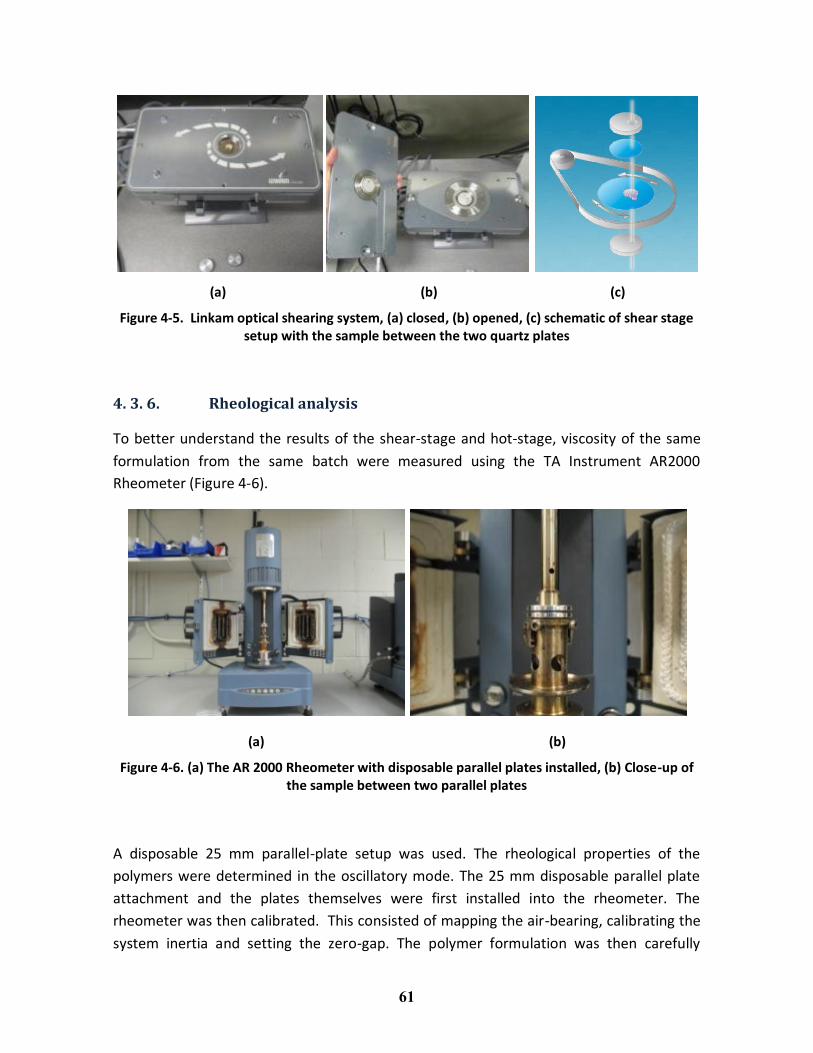
4. 3. 5. Shear stage: dispersion analysis
In order to understand the main source of dispersion degradation during the curing
process of CNT-modified resins, a shear stage was used. The Linkam Optical Shearing
System (Figure 4-5) allowed structural dynamics of complex fluids to be directly observed
via standard optical microscope while they were under controlled temperature and shear.
The shear stage used two highly polished quartz plates that were parallel to each other.
Each plate was in thermal contact with an independently controlled pure silver heater
utilising platinum resistors sensitive to 0.1°C. The bottom plate, on which the sample was
placed, operated in either oscillatory, steady or step shear modes. The gap between the
two plates can be precisely set from 5 to 2500 m.
Similar to the hot-stage test, for each formulation 3-5 grams of resin was placed between
the two quartz plate and then the distance between the two plates were set to 500 m.
The shear and cure cycle was then applied. The tests were stopped before the gelation
point of the formulation which was measured during viscosity tests. The detail parameters
of each test are given in the result section.
4.5
12.5
~1
3.5
Objective Lens
Stage lid insert0.2 mm thick lid window
Sample0.2 mm cover slip
Silver block heating element
Condenser Lens
61
(a) (b) (c)
Figure 4-5. Linkam optical shearing system, (a) closed, (b) opened, (c) schematic of shear stage setup with the sample between the two quartz plates
4. 3. 6. Rheological analysis
To better understand the results of the shear-stage and hot-stage, viscosity of the same
formulation from the same batch were measured using the TA Instrument AR2000
Rheometer (Figure 4-6).
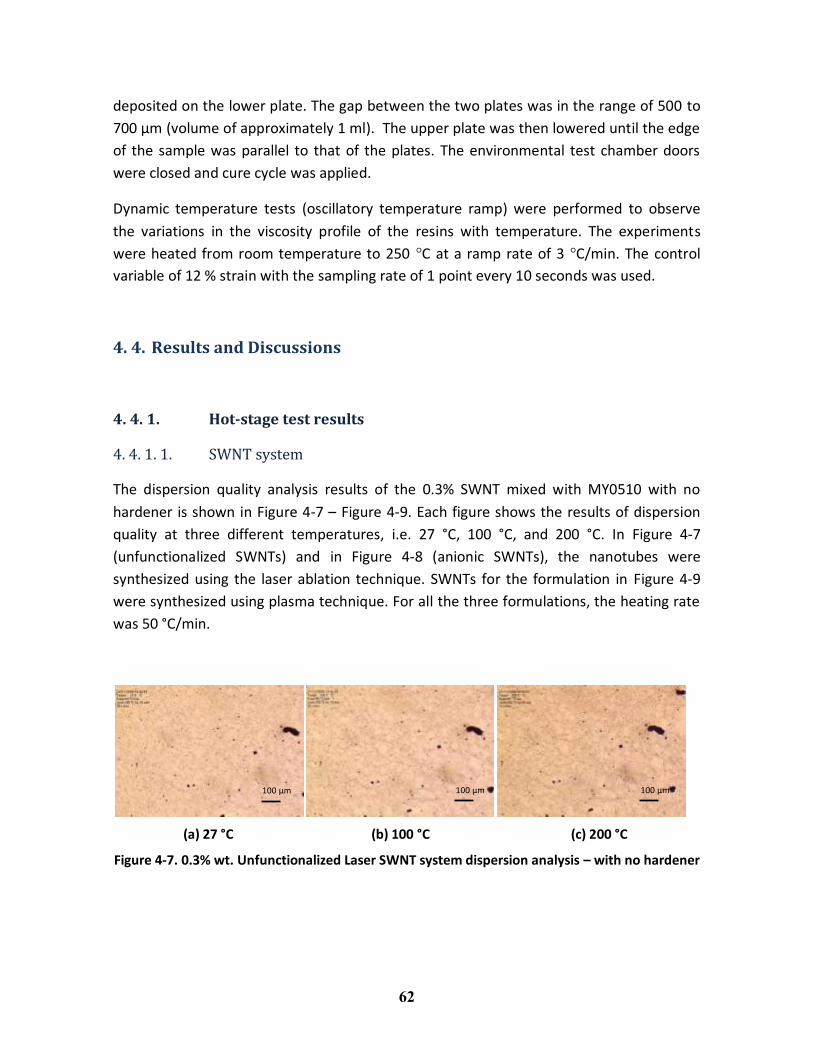
(a) (b)
Figure 4-6. (a) The AR 2000 Rheometer with disposable parallel plates installed, (b) Close-up of the sample between two parallel plates
A disposable 25 mm parallel-plate setup was used. The rheological properties of the
polymers were determined in the oscillatory mode. The 25 mm disposable parallel plate
attachment and the plates themselves were first installed into the rheometer. The
rheometer was then calibrated. This consisted of mapping the air-bearing, calibrating the
system inertia and setting the zero-gap. The polymer formulation was then carefully
62
deposited on the lower plate. The gap between the two plates was in the range of 500 to
700 µm (volume of approximately 1 ml). The upper plate was then lowered until the edge
of the sample was parallel to that of the plates. The environmental test chamber doors
were closed and cure cycle was applied.
Dynamic temperature tests (oscillatory temperature ramp) were performed to observe
the variations in the viscosity profile of the resins with temperature. The experiments
were heated from room temperature to 250 °C at a ramp rate of 3 °C/min. The control
variable of 12 % strain with the sampling rate of 1 point every 10 seconds was used.
4. 4. Results and Discussions
4. 4. 1. Hot-stage test results
4. 4. 1. 1. SWNT system
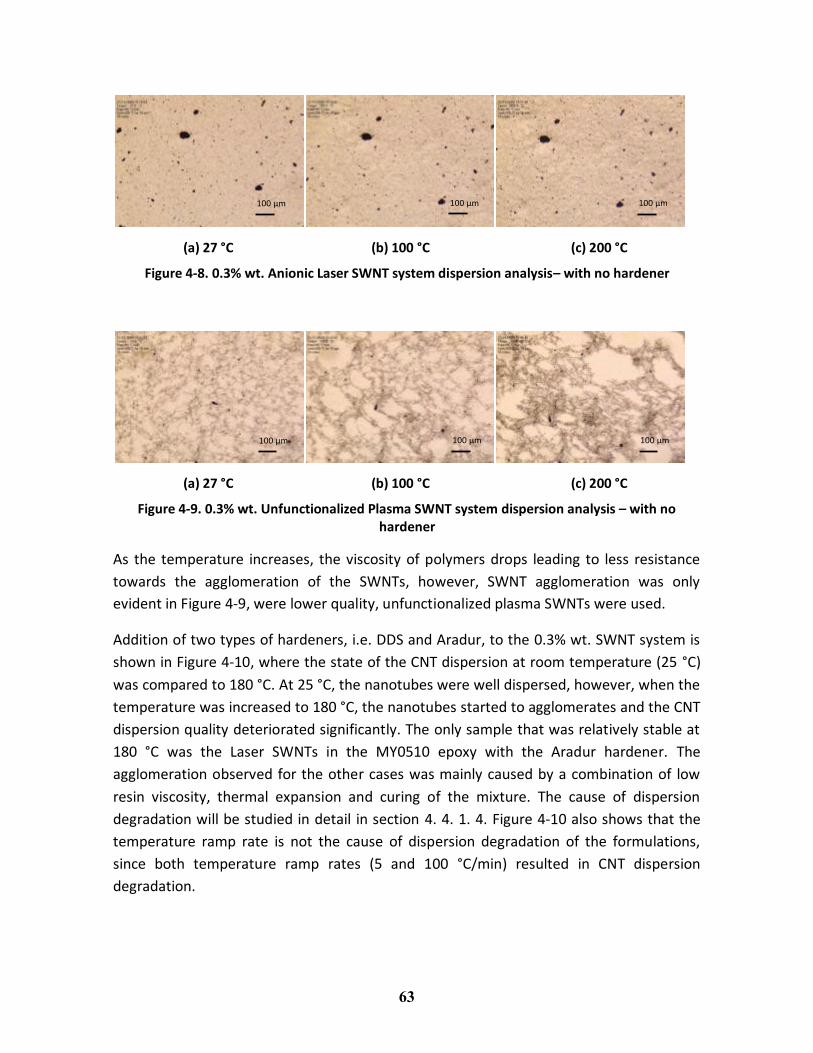
The dispersion quality analysis results of the 0.3% SWNT mixed with MY0510 with no
hardener is shown in Figure 4-7 – Figure 4-9. Each figure shows the results of dispersion
quality at three different temperatures, i.e. 27 °C, 100 °C, and 200 °C. In Figure 4-7
(unfunctionalized SWNTs) and in Figure 4-8 (anionic SWNTs), the nanotubes were
synthesized using the laser ablation technique. SWNTs for the formulation in Figure 4-9
were synthesized using plasma technique. For all the three formulations, the heating rate
was 50 °C/min.
(a) 27 °C (b) 100 °C (c) 200 °C
Figure 4-7. 0.3% wt. Unfunctionalized Laser SWNT system dispersion analysis – with no hardener
100 μm 100 μm 100 μm
63
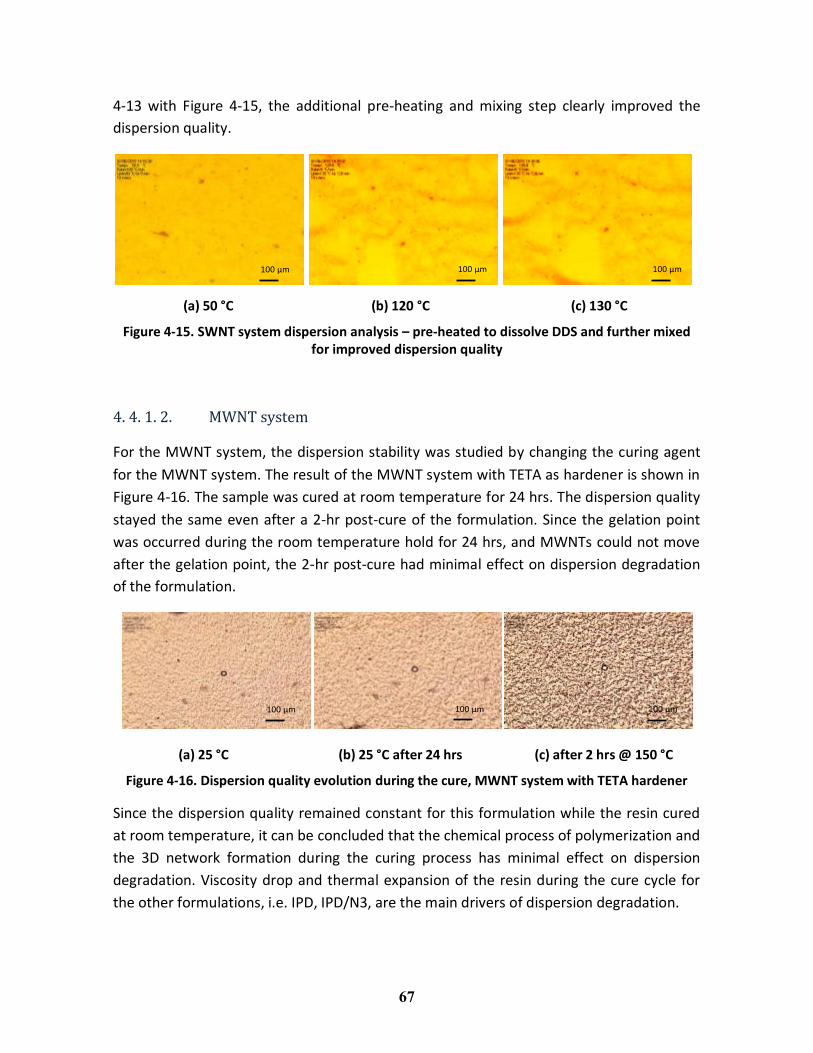
(a) 27 °C (b) 100 °C (c) 200 °C
Figure 4-8. 0.3% wt. Anionic Laser SWNT system dispersion analysis– with no hardener
(a) 27 °C (b) 100 °C (c) 200 °C
Figure 4-9. 0.3% wt. Unfunctionalized Plasma SWNT system dispersion analysis – with no hardener
As the temperature increases, the viscosity of polymers drops leading to less resistance
towards the agglomeration of the SWNTs, however, SWNT agglomeration was only
evident in Figure 4-9, were lower quality, unfunctionalized plasma SWNTs were used.
Addition of two types of hardeners, i.e. DDS and Aradur, to the 0.3% wt. SWNT system is
shown in Figure 4-10, where the state of the CNT dispersion at room temperature (25 °C)
was compared to 180 °C. At 25 °C, the nanotubes were well dispersed, however, when the
temperature was increased to 180 °C, the nanotubes started to agglomerates and the CNT
dispersion quality deteriorated significantly. The only sample that was relatively stable at
180 °C was the Laser SWNTs in the MY0510 epoxy with the Aradur hardener. The
agglomeration observed for the other cases was mainly caused by a combination of low
resin viscosity, thermal expansion and curing of the mixture. The cause of dispersion
degradation will be studied in detail in section 4. 4. 1. 4. Figure 4-10 also shows that the
temperature ramp rate is not the cause of dispersion degradation of the formulations,
since both temperature ramp rates (5 and 100 °C/min) resulted in CNT dispersion
degradation.
100 μm 100 μm 100 μm
100 μm 100 μm 100 μm
64
25 °C 180 °C
Unfunc. 0.3 % Laser DDS 5 °C/min
Unfunc. 0.3 % Laser DDS 100 °C/min
Unfunc. 0.3 % Laser Aradur 20 °C/min
Unfunc. 0.3 % Plasma Aradur 20 °C/min
Figure 4-10. SWNT dispersion stability analysis for two types of hardener: DDS and Aradur
The hot-stage results of different DDS to SWNT formulations are shown in Figure 4-11 to
Figure 4-14. The loading of the SWNT was 0.1 % wt. and they were negatively charged
(Anionic). Cure cycle # 1 (Table 4-2) was used to cure the samples.
An interesting observation of Figure 4-11 to Figure 4-14 was the dissolution of DDS in the
formulation. DDS is a solid aromatic amine hardener at room temperature which dissolved
in the MY0510 mixture at around 110 °C. Even though, the SWNTs and DDS were well
dispersed at room temperature, after the dissolution of DDS, the areas occupied by DDS
were replaced by resin only. An example of such area is highlighted in Figure 4-11 (c).
These regions would further grow as the temperature increased, resulting in further
degradation of the dispersion quality.
100 μm 100 μm
100 μm 100 μm
100 μm 100 μm
100 μm 100 μm
65
(a) 30 °C (b) 80 °C (c) 105 °C
(d) 109 °C (e) 111 °C (f) 130 °C
Figure 4-11. SWNT system dispersion analysis – 100:49 Resin to DDS ratio
(a) 30 °C (b) 80 °C (c) 105 °C
(d) 106 °C (e) 108 °C (f) 111 °C
Figure 4-12. SWNT system dispersion analysis – 100: 55 Resin to DDS ratio
100 μm 100 μm 100 μm
100 μm 100 μm 100 μm
100 μm 100 μm 100 μm
100 μm 100 μm 100 μm
66
(a) 30 °C (b) 80 °C (c) 100 °C
(d) 104 °C (e) 110 °C (f) 115 °C
Figure 4-13. SWNT system dispersion analysis – 100: 60 Resin to DDS ratio
(a) 25 °C (b) 70 °C (c) 100 °C
(d) 130 °C
Figure 4-14. SWNT system dispersion analysis – 100: 67 Resin to DDS ratio
As a solution to this problem, the DDS based SWNT systems were pre- heated to 100 °C to
dissolve the DDS particles. The pre-heated sample was then cooled down to 50 °C. An
additional 5-minute shear mixing was then applied to the sample with dissolved DDS to
improve the dispersion quality of the formulation. Cure cycle # 2 (Table 4-2) was then
applied. The results for pre-heated 0.1% SWNT / MY0510 with 100:60 resin to DDS ratio
with the additional shear mixing is shown in Figure 4-15. Comparing the results of Figure
100 μm 100 μm 100 μm
100 μm 100 μm 100 μm
100 μm 100 μm 100 μm
100 μm
67
4-13 with Figure 4-15, the additional pre-heating and mixing step clearly improved the
dispersion quality.
(a) 50 °C (b) 120 °C (c) 130 °C
Figure 4-15. SWNT system dispersion analysis – pre-heated to dissolve DDS and further mixed for improved dispersion quality
4. 4. 1. 2. MWNT system
For the MWNT system, the dispersion stability was studied by changing the curing agent
for the MWNT system. The result of the MWNT system with TETA as hardener is shown in
Figure 4-16. The sample was cured at room temperature for 24 hrs. The dispersion quality
stayed the same even after a 2-hr post-cure of the formulation. Since the gelation point
was occurred during the room temperature hold for 24 hrs, and MWNTs could not move
after the gelation point, the 2-hr post-cure had minimal effect on dispersion degradation
of the formulation.
(a) 25 °C (b) 25 °C after 24 hrs (c) after 2 hrs @ 150 °C
Figure 4-16. Dispersion quality evolution during the cure, MWNT system with TETA hardener
Since the dispersion quality remained constant for this formulation while the resin cured
at room temperature, it can be concluded that the chemical process of polymerization and
the 3D network formation during the curing process has minimal effect on dispersion
degradation. Viscosity drop and thermal expansion of the resin during the cure cycle for
the other formulations, i.e. IPD, IPD/N3, are the main drivers of dispersion degradation.
100 μm 100 μm 100 μm
100 μm 100 μm 100 μm
68
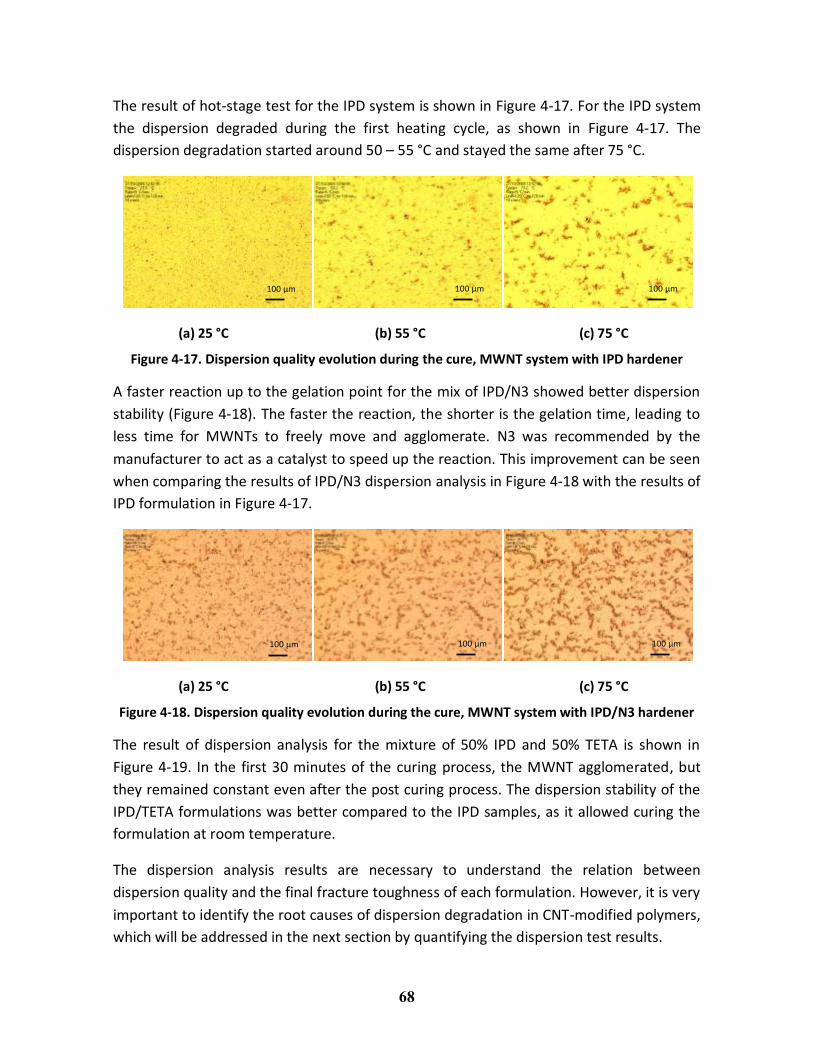
The result of hot-stage test for the IPD system is shown in Figure 4-17. For the IPD system
the dispersion degraded during the first heating cycle, as shown in Figure 4-17. The
dispersion degradation started around 50 – 55 °C and stayed the same after 75 °C.
(a) 25 °C (b) 55 °C (c) 75 °C
Figure 4-17. Dispersion quality evolution during the cure, MWNT system with IPD hardener
A faster reaction up to the gelation point for the mix of IPD/N3 showed better dispersion
stability (Figure 4-18). The faster the reaction, the shorter is the gelation time, leading to
less time for MWNTs to freely move and agglomerate. N3 was recommended by the
manufacturer to act as a catalyst to speed up the reaction. This improvement can be seen
when comparing the results of IPD/N3 dispersion analysis in Figure 4-18 with the results of
IPD formulation in Figure 4-17.
(a) 25 °C (b) 55 °C (c) 75 °C
Figure 4-18. Dispersion quality evolution during the cure, MWNT system with IPD/N3 hardener
The result of dispersion analysis for the mixture of 50% IPD and 50% TETA is shown in
Figure 4-19. In the first 30 minutes of the curing process, the MWNT agglomerated, but
they remained constant even after the post curing process. The dispersion stability of the
IPD/TETA formulations was better compared to the IPD samples, as it allowed curing the
formulation at room temperature.
The dispersion analysis results are necessary to understand the relation between
dispersion quality and the final fracture toughness of each formulation. However, it is very
important to identify the root causes of dispersion degradation in CNT-modified polymers,
which will be addressed in the next section by quantifying the dispersion test results.
100 μm 100 μm 100 μm
100 μm 100 μm 100 μm
69
(a) 25 °C (b) 25 °C after 30 min (c) 25 °C after 24 hours
Figure 4-19. Dispersion quality evolution during the cure, MWNT system with IPD/TETA hardener
4. 4. 1. 3. Quantifying dispersion: using Image Analysis
To quantify the dispersion analysis results, presented in the previous subsection, a Matlab
code was developed to process the Linkam hot-stage images (Appendix A.1. Matlab code
for image analysis). The quantification will help correlate the dispersion analysis with the
viscosity profile of the resin from the rheological analysis.
Figure 4-20 illustrates the steps of image processing. Figure 4-20 (a) and (d) show the
typical output images from the hot-stage experiments at room temperature and at an
elevated temperature.
(a) 25 °C (b) Grey scale image (c) BW, MWNT area 0.9
(d) 120 °C (e) Grey scale image (f) BW, MWNT area 0.41
Figure 4-20. Image processing steps, RGB to Grey to Black & White, for IPD/N3 system
100 μm 100 μm 100 μm
70
The Matlab code first converted the images to grey scale images (Figure 4-20 (b) and (e)),
and then the images were converted to a black and white format (Figure 4-20 (c) and (f));
black regions represented the CNT agglomerations, and white regions represented regions
that contains only resin. A fractional area, Af, was then calculated as:
f
Area of CNT agglomerates (black area)A
Total Area (black area + white area) Equation 4-5
The areas were calculated using “bwarea” function of Matlab.
Figure 4-21 and Figure 4-23 illustrate the sequences of images taken from the MWNT
system with IPD and IPD/N3 as hardener, respectively. The corresponding dispersion curve
(Af – Time) is shown in Figure 4-22 and Figure 4-24, respectively. In these figures, each
point on the curve corresponds to an image taken from the hot-stage setup. In Figure
4-22, images 2_01, 2_04, and 2_07 of Figure 4-21 are highlighted. The drop in the
dispersion curve is consistent with the dispersion degradation seen on the images. Similar
pattern is seen In Figure 4-24, where the drop in the dispersion curve captured the
dispersion degradation shown in image N_07 to N_11 in Figure 4-23.
Figure 4-21. Image sequences from the hot-stage test setup for MWNT system with IPD
71
Figure 4-22. Dispersion quantification results for the MWNT system with IPD, Af calculated from Eq. 4-5
Figure 4-23. Image sequences from the hot-stage test setup for MWNT system with IPD/N3
0 500 1000 1500 2000 2500 3000 35000
0.2
0.4
0.6
0.8
1
Af
Time(sec)
Dispersion & Temp vs. Time
0 500 1000 1500 2000 2500 3000 35000
20
40
60
80
100
120
140
T(
C)
2_01
2_04
2_07
72
Figure 4-24. Dispersion quantification results for the MWNT system with IPD/N3, Af calculated from Eq. 4-5
The increase in the dispersion curve after the first drop (Figure 4-24) is due to the curing
of the resin and correspondingly darkening of the resin layer. The importance of the
dispersion curve can be noticed when compared to the rheology curve for the same
material system.
The dispersion quantification curves for other formulations are presented in the
Appendix.A.2.
4. 4. 1. 4. Sources of dispersion degradation
According to the results of the dispersion stability analysis for both SWNT and MWNT
system, dispersion has degraded in all the formulation that required a curing cycle at an
elevated temperature, whereas those that were cured at room temperature were the only
formulations with stable dispersion. These facts together with the results of samples with
no hardener (Figure 4-9) demonstrate that the reaction of the hardener with the polymer
formulation is not the major driver of dispersion degradation, but rather an elevated
temperature is the key factor in dispersion degradation.
0 500 1000 1500 2000 2500 3000 35000
0.2
0.4
0.6
0.8
1
Af
Time(sec)
Dispersion & Temp vs. Time
0 500 1000 1500 2000 2500 3000 35000
20
40
60
80
100
120
140
T(
C)
73
As temperature increases the viscosity of the resin drops and the CNTs can move freely. At
the same time, due to the thermal expansion of the resin, internal shear forces apply. The
combinational effects of these physical phenomena are studied in this section through
series of rheological and shear tests.
Viscosity drop during the cure cycle. As shown in the dispersion degradation analysis for
the SWNT system (Figure 4-10), the dispersion degradation started as the temperature
increased and then stabilized when the minimum viscosity reached. This result is
consistent with the viscosity profile of the SWNT system (Figure 4-25).
As can be seen in Figure 4-10, in the DDS system all the formulations became unstable at
around 105 °C to 110 °C, and then stabilized; this is the temperature range that the
minimum viscosity of the formulations were reached and stayed constant up to the
gelation point.
Figure 4-25. Typical rheology curve for MY0510/DDS/SWNT formulation. From room temperature ramp (3 °C/min) to 250 °C with control variable of 12 % strain
In Figure 4-26, the rheological behaviour of the DDS system is compared with the Aradur
system. As can been clearly seen, the formulations containing DDS had higher viscosity
values at room temperature compared to the Aradur formulations. The main difference
0.1
1
10
100
1000
10000
20 40 60 80 100 120 140 160 180 200
Vis
cosi
ty (P
a.s)
Temperature °C
MY0510/DDS SWNT/MY0510/DDS
Minimum Viscosity Region
74
was at elevated temperatures, where there was a noticeable drop in the viscosity of the
DDS system. In contrast, the viscosity of Aradur formulations remained relatively
unchanged. This difference in viscosity drop can explain the higher dispersion degradation
of the DDS formulations.
Figure 4-26. Rheology results, comparing DDS vs. Aradur hardener. From room temperature ramp (3 °C/min) to 140 °C hold up to gelation
Similar to the SWNT system, for the MWNT formulations the results of the TETA and IPD
dispersion quality analysis can be correlated to the rheological analysis of each
formulation. Comparing the temperature at which that dispersion quality starts to
degrade with the viscosity profile demonstrates the relation between the viscosity drop
and dispersion degradation as temperature increases.
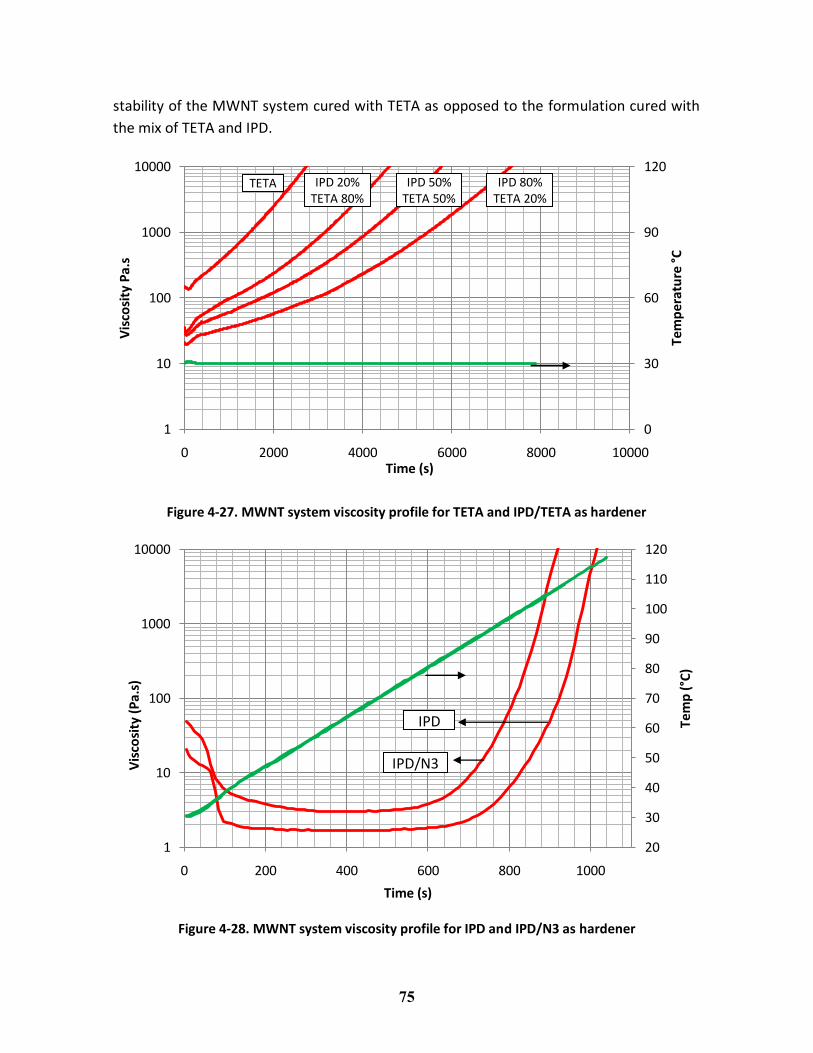
The results of the rheology tests on the MWNT system are shown in Figure 4-27 and
Figure 4-28. The sample for each rheology test was taken from the same batch that was
prepared for the dispersion test. In the case of TETA and IPD/TETA there is no drop in the
viscosity profile, and consistently the dispersion remained stable during the gelation and
curing of the formulation. Also, as shown in Figure 4-27, TETA had a higher viscosity
compared to the mix of IPD/TETA. The dispersion analysis also confirms the higher
0.1
1
10
100
1000
20 40 60 80 100 120 140
Vis
cosi
ty (P
a.s)
Temperature °C
DDS_Plasma Aradur_Laser Aradur_Plasma
75
stability of the MWNT system cured with TETA as opposed to the formulation cured with
the mix of TETA and IPD.
Figure 4-27. MWNT system viscosity profile for TETA and IPD/TETA as hardener
Figure 4-28. MWNT system viscosity profile for IPD and IPD/N3 as hardener
0
30
60
90
120
1
10
100
1000
10000
0 2000 4000 6000 8000 10000
Tem
per
atu
re °
C
Vis
cosi
ty P
a.s
Time (s)
20
30
40
50
60
70
80
90
100
110
120
1
10
100
1000
10000
0 200 400 600 800 1000
Tem
p (
°C)
Vis
cosi
ty (
Pa.
s)
Time (s)
IPD
IPD/N3
TETA IPD 20% TETA 80%
IPD 50% TETA 50%
IPD 80% TETA 20%
76
On the other hand, for the MWNT formulation with IPD as the hardener, where the curing
process started at room temperature with a temperature ramp to 120 °C, the dispersion
degraded during the first 500 seconds of the experiment (Figure 4-22). According to Figure
4-28 for the IPD sample, this period corresponded to the portion of the viscosity curve
where the viscosity dropped and stabilized before the gelation started. A similar pattern
was observed for the IPD/N3 sample. However, since the viscosity of the MWNT
formulation for the IPD/N3 hardener was higher than the IPD hardener, a more stable
dispersion was observed from the hot-stage test. It should be noted that all the test
parameters for the dispersion and rheology tests were exactly the same.
Applied shear
As discussed earlier, applied shear due to the thermal expansion of the resin is another
key driver of dispersion degradation. In order to understand the relation between applied
shear and dispersion degradation, a series of shear-stage tests were performed. The setup
for these tests was kept the same as for the rheology and hot-stage tests.
SWNT system. The results of the shear stage test for the 0.3 % plasma synthesized Aradur
system are shown in Figure 4-29. The tests were performed under oscillatory mode of the
shear stage (freq.= 0.1 Hz). The gap between the two glass substrates of the shear stage
was set to be 500 μm. Two different types of tests were performed: 1. shear only, at a
constant temperature, and, 2. combined shear and temperature ramp.
The results showed that when there was only shear acting on the thin film and no
temperature profile was applied, no major dispersion degradation appeared. On the other
hand, at an elevated temperature the dispersion quality deteriorated, as expected from
the hot-stage test results. The comparison between the hot-stage results (Figure 4-10) and
the shear-stage results of Figure 4-29, shows that applied shear at an elevated
temperature worsens the dispersion deterioration caused by elevated temperature.
MWNT system. Four main formulations were studied for the MWNT system, including
MWNT system with no hardener, with IPD, IPD/N3, and IPD/TETA as hardener. The gap
between the parallel plates was set to 700 m similar to the rheology test on the MWNT
system. Also, the frequency was set to 1 Hz.
77
Only Shear at 25 °C Shear and Temperature 20 °C/min, hold at 100 °C
0.3 % Plasma Aradur Oscillation 0.1 Hz, Gap 500 μm
0.3 % Plasma Aradur Oscillation 0.1 Hz, Gap 500 μm
Figure 4-29. CNT dispersion stability analysis using the Linkam shear-stage setup
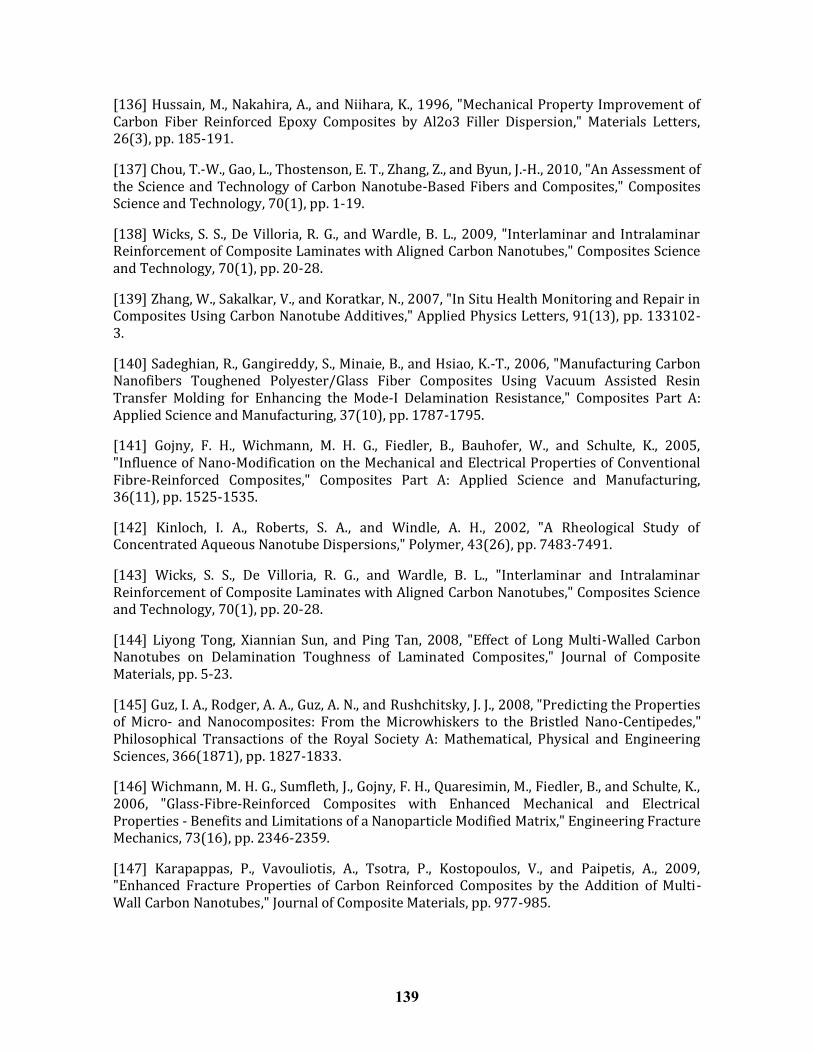
The result of the shear stage test for the MWNT system with no hardener is shown in
Figure 4-30. From image (a) to (c) the formulation was held at 30 °C for 30 min, after
which a temperature ramp at 5 °C/min was followed. Even though, the dispersion
degraded after 30 min at 30 °C, the degradation was very minimal. As soon as the
temperature increased, i.e. viscosity dropped and resin started to expand, the degradation
became more noticeable. It can be concluded that an elevated temperature (reduced
viscosity) played a more dominant role on the degradation of the MWNT dispersion, while
the applied shear helped.
25 °C
50 °C
75 °C
100 °C
t=0
t=45 s
t=90 s
t=135 s
100 μm 100 μm
100 μm 100 μm
100 μm 100 μm
100 μm 100 μm
78
(a) 30 °C (b) at 30 °C after 15 min (c) at 30 °C after 30 min
(d) 60 °C (e) 90 °C (f) 120 °C
Figure 4-30. Shear stage test result for MWNT system with no hardener, 5% strain
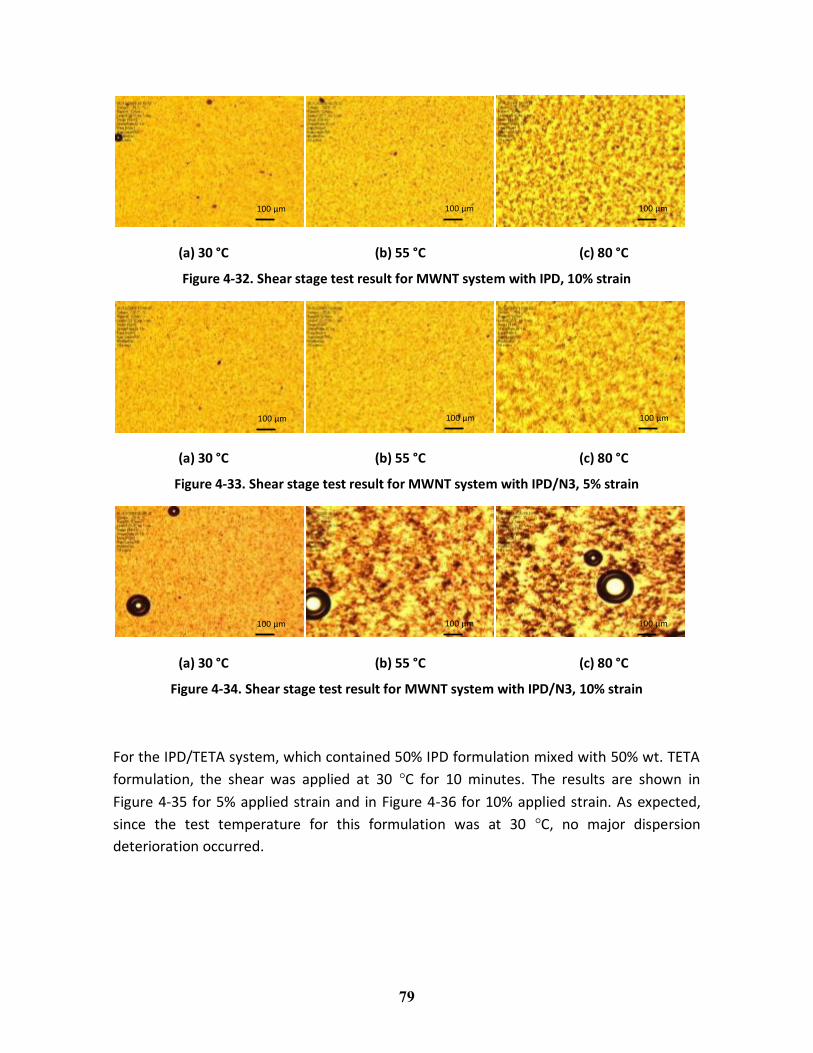
The shear stage results for the MWNT system with hardener are shown in Figure 4-31 to
Figure 4-36. For the formulations with hardener, two strain rates were tested, i.e. 5% and
10%.
Since the shear stage needed to be operated at low-viscosity to ensure the safety of the
equipment, for the IPD and IPD/N3 systems, the sample were heated up to 80 °C and then
kept at that temperature for 5 min to maintain the formulation at its lowest viscosity. For
these two formulations, the results show that an increase in the strain rate worsen the
dispersion stability at higher temperature. For the IPD/N3 system, the effect of strain rate
was more noticeable; at 10% strain rate the quality of dispersion dramatically degraded.
(a) 30 °C (b) 55 °C (c) 80 °C
Figure 4-31. Shear stage test result for MWNT system with IPD, 5% strain
100 μm 100 μm 100 μm
100 μm 100 μm 100 μm
100 μm 100 μm 100 μm
79
(a) 30 °C (b) 55 °C (c) 80 °C
Figure 4-32. Shear stage test result for MWNT system with IPD, 10% strain
(a) 30 °C (b) 55 °C (c) 80 °C
Figure 4-33. Shear stage test result for MWNT system with IPD/N3, 5% strain
(a) 30 °C (b) 55 °C (c) 80 °C
Figure 4-34. Shear stage test result for MWNT system with IPD/N3, 10% strain
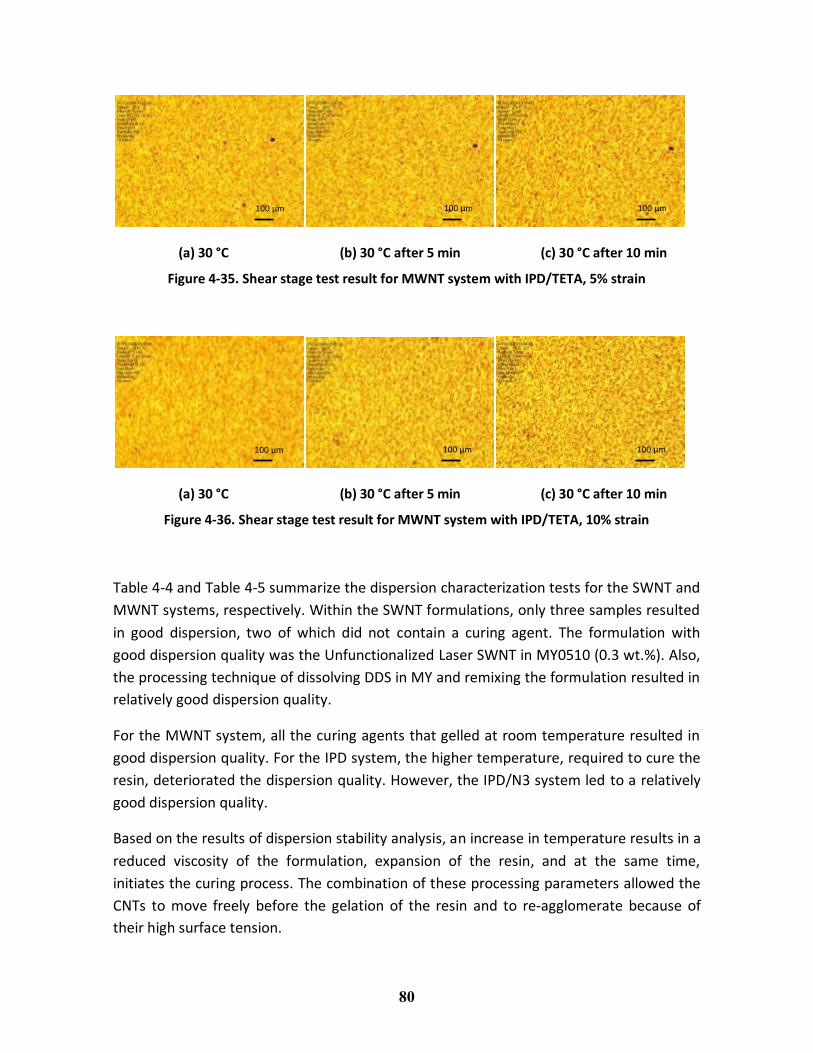
For the IPD/TETA system, which contained 50% IPD formulation mixed with 50% wt. TETA
formulation, the shear was applied at 30 °C for 10 minutes. The results are shown in
Figure 4-35 for 5% applied strain and in Figure 4-36 for 10% applied strain. As expected,
since the test temperature for this formulation was at 30 °C, no major dispersion
deterioration occurred.
100 μm 100 μm 100 μm
100 μm 100 μm 100 μm
100 μm 100 μm 100 μm
80
(a) 30 °C (b) 30 °C after 5 min (c) 30 °C after 10 min
Figure 4-35. Shear stage test result for MWNT system with IPD/TETA, 5% strain
(a) 30 °C (b) 30 °C after 5 min (c) 30 °C after 10 min
Figure 4-36. Shear stage test result for MWNT system with IPD/TETA, 10% strain
Table 4-4 and Table 4-5 summarize the dispersion characterization tests for the SWNT and
MWNT systems, respectively. Within the SWNT formulations, only three samples resulted
in good dispersion, two of which did not contain a curing agent. The formulation with
good dispersion quality was the Unfunctionalized Laser SWNT in MY0510 (0.3 wt.%). Also,
the processing technique of dissolving DDS in MY and remixing the formulation resulted in
relatively good dispersion quality.
For the MWNT system, all the curing agents that gelled at room temperature resulted in
good dispersion quality. For the IPD system, the higher temperature, required to cure the
resin, deteriorated the dispersion quality. However, the IPD/N3 system led to a relatively
good dispersion quality.
Based on the results of dispersion stability analysis, an increase in temperature results in a
reduced viscosity of the formulation, expansion of the resin, and at the same time,
initiates the curing process. The combination of these processing parameters allowed the
CNTs to move freely before the gelation of the resin and to re-agglomerate because of
their high surface tension.
100 μm 100 μm 100 μm
100 μm 100 μm 100 μm
81
According to the shear stage test results, applied shear during the curing process can
further deteriorate the dispersion quality; however, the drop in the viscosity as
temperature increased during the cure, proved to be the dominant processing parameter
that caused dispersion degradation.
Table 4-4: Summary of dispersion characterization tests for the SWNT system
Fixed parameters Variable parameters Temperature
Cycle Viscosity
drop Cure Dispersion
No hardener 0.3% wt.
50 °C/min to 200°C
Unfunctionalized Laser
Yes Yes No Good
Anionic Laser Yes Yes No Good Unfunctionalized
Plasma Yes Yes No Poor
DDS 0.3% wt.
Unfunctionalized Laser
5 °C/min to 180 °C Yes Yes Yes Poor
100 °C/min to 180 °C Yes Yes Yes Poor
Aradur 0.3% wt.
5 °C/min to 180 °C
Unfunctionalized Laser
Yes Yes Yes Good
Unfunctionalized Plasma
Yes Yes Yes Poor
DDS 0.1% wt. Anionic
MY0510:DDS 100:49, 55, 60, 67
Yes Yes Yes
Poor (The higher the DDS ratio, the
better the dispersion)
0.1% wt. Anionic
MY0510:DDS 100: 60
DDS dissolved and remixed at high
temperature Yes Yes Yes Average
Table 4-5: Summary of dispersion characterization tests for the MWNT system (0.3 wt.%)
Variable parameters
Characteristics Temperature
Cycle Viscosity
drop Cure Dispersion
TETA Cure at room No No Yes Good IPD Cure at high temp Yes Yes Yes Poor
IPD/N3 Fast Cure at High
temperature Yes Yes Yes OK
IPD/TETA Cure at room No No Yes Good
82
4. 4. 2. Fracture toughness test results
An example of a typical load versus displacement curve is shown in Figure 4-37. All
samples including CNT-modified polymers showed a brittle fracture with no improvement
in the ductility of the samples. Therefore, according to ASTM D 5045, the maximum load
was used to find KIc.
Figure 4-37: Typical load-displacement curve for epoxy resin
In Subsections 4. 4. 2. 1. and 4. 4. 2. 2. , the fracture toughness values of the SWNT and
MWNT polymer systems are presented.
4. 4. 2. 1. SWNT system
Effect of different SWNT weight fraction and different types of hardener
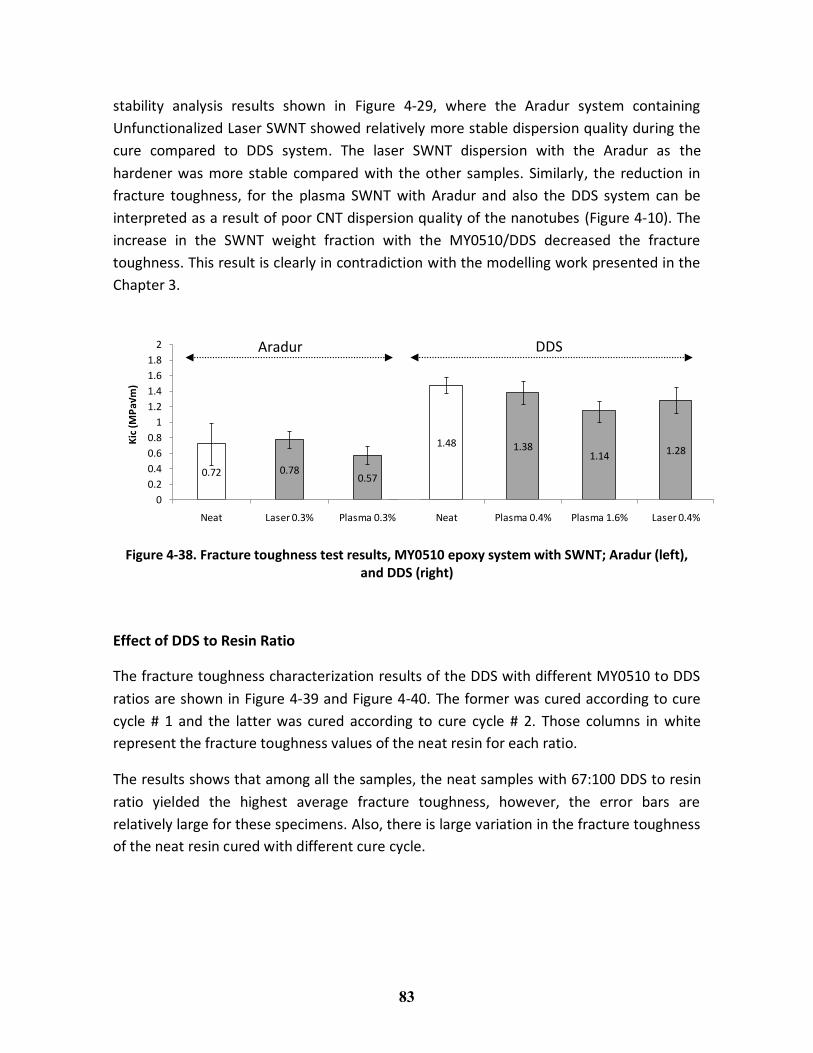
Figure 4-38 shows the KIc for two types of hardeners, i.e. Aradur and DDS with different
types and loading of SWNTs with cure cycle # 1 (Table 4-2). The results of the fracture
tests show that the DDS hardener led to higher fracture toughness compared to Aradur.
This was expected as DDS was specifically recommended by the manufacturer as the
optimum curing agent to achieve a toughened MY0510 epoxy system. In general, the
addition of carbon nanotube to the MY0510/DDS system deteriorated the fracture
toughness values. However, for the MY0510/Aradur, the addition of the laser SWNTs
slightly improved toughness by 8%. This result is consistent with the CNT dispersion
0
5
10
15
20
25
0 0.05 0.1 0.15 0.2 0.25 0.3
Loa
d (
N)
Crosshead displacement (mm)
83
stability analysis results shown in Figure 4-29, where the Aradur system containing
Unfunctionalized Laser SWNT showed relatively more stable dispersion quality during the
cure compared to DDS system. The laser SWNT dispersion with the Aradur as the
hardener was more stable compared with the other samples. Similarly, the reduction in
fracture toughness, for the plasma SWNT with Aradur and also the DDS system can be
interpreted as a result of poor CNT dispersion quality of the nanotubes (Figure 4-10). The
increase in the SWNT weight fraction with the MY0510/DDS decreased the fracture
toughness. This result is clearly in contradiction with the modelling work presented in the
Chapter 3.
Figure 4-38. Fracture toughness test results, MY0510 epoxy system with SWNT; Aradur (left), and DDS (right)
Effect of DDS to Resin Ratio
The fracture toughness characterization results of the DDS with different MY0510 to DDS
ratios are shown in Figure 4-39 and Figure 4-40. The former was cured according to cure
cycle # 1 and the latter was cured according to cure cycle # 2. Those columns in white
represent the fracture toughness values of the neat resin for each ratio.
The results shows that among all the samples, the neat samples with 67:100 DDS to resin
ratio yielded the highest average fracture toughness, however, the error bars are
relatively large for these specimens. Also, there is large variation in the fracture toughness
of the neat resin cured with different cure cycle.
1.48 1.381.14 1.28
0
0.2
0.4
0.6
0.8
1
1.2
1.4
1.6
1.8
2
Neat Plasma 0.4% Plasma 1.6% Laser 0.4%
0.72 0.780.57
0
0.2
0.4
0.6
0.8
1
1.2
1.4
1.6
1.8
2
Neat Laser 0.3% Plasma 0.3%
Kic
(M
Pa√
m)
DDS Aradur
84
Figure 4-39. Fracture toughness test results for MY0510 / 0.1% Anionic SWNT with different DDS: MY0510 ratios, cure cycle # 1
Figure 4-40. Fracture toughness test results for MY0510 / 0.1% Anionic SWNT with different DDS: MY0510 ratios, cure cycle # 2
1.19 1.10 1.031.24
1.091.31
1.51 1.42
0
0.2
0.4
0.6
0.8
1
1.2
1.4
1.6
1.8
2
Kic
(M
Pa(
m0.
5))
49:100 55:100 60:100 67:100
NEAT MY0510 SWNT
0.981.19
0.83 0.891.01
1.28
0.991.19 1.13 1.18
0
0.2
0.4
0.6
0.8
1
1.2
1.4
1.6
1.8
2
Kic
(M
Pa(
m0.
5))
49:100 55:100 60:100 (1) 67:100
NEAT MY0510 SWNT
60:100 (2)
85
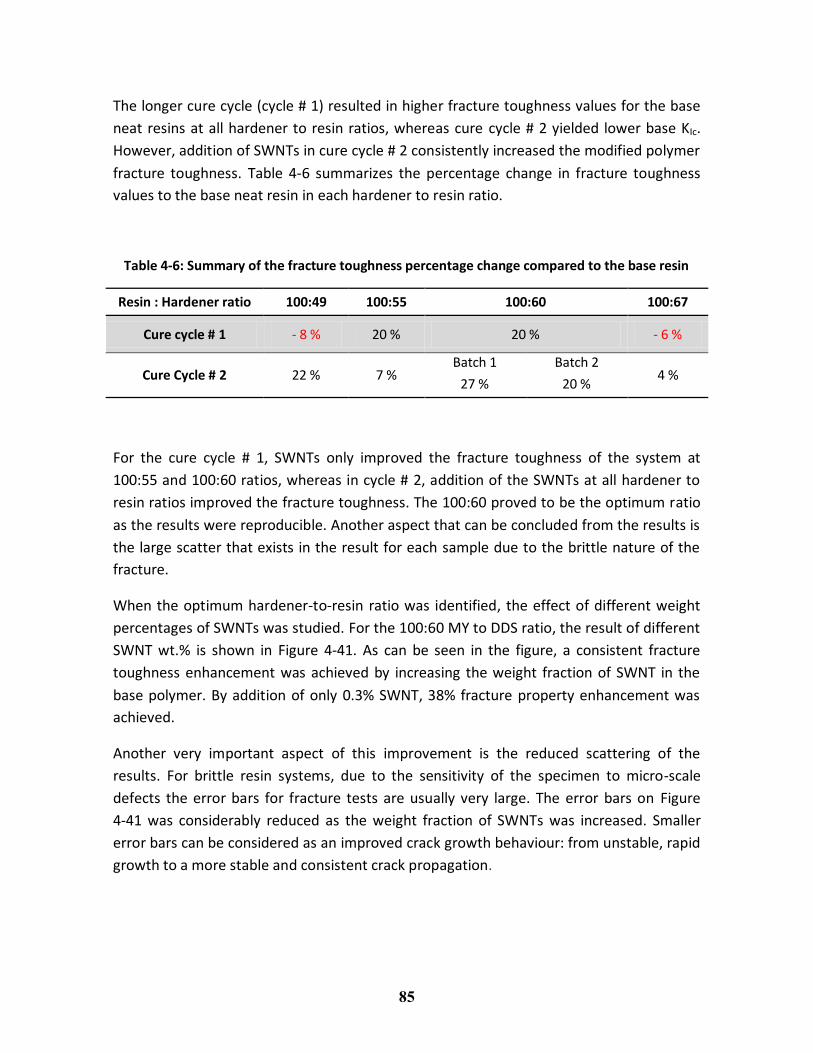
The longer cure cycle (cycle # 1) resulted in higher fracture toughness values for the base
neat resins at all hardener to resin ratios, whereas cure cycle # 2 yielded lower base KIc.
However, addition of SWNTs in cure cycle # 2 consistently increased the modified polymer
fracture toughness. Table 4-6 summarizes the percentage change in fracture toughness
values to the base neat resin in each hardener to resin ratio.
Table 4-6: Summary of the fracture toughness percentage change compared to the base resin
Resin : Hardener ratio 100:49 100:55 100:60 100:67
Cure cycle # 1 - 8 % 20 % 20 % - 6 %
Cure Cycle # 2 22 % 7 % Batch 1 Batch 2
4 % 27 % 20 %
For the cure cycle # 1, SWNTs only improved the fracture toughness of the system at
100:55 and 100:60 ratios, whereas in cycle # 2, addition of the SWNTs at all hardener to
resin ratios improved the fracture toughness. The 100:60 proved to be the optimum ratio
as the results were reproducible. Another aspect that can be concluded from the results is
the large scatter that exists in the result for each sample due to the brittle nature of the
fracture.
When the optimum hardener-to-resin ratio was identified, the effect of different weight
percentages of SWNTs was studied. For the 100:60 MY to DDS ratio, the result of different
SWNT wt.% is shown in Figure 4-41. As can be seen in the figure, a consistent fracture
toughness enhancement was achieved by increasing the weight fraction of SWNT in the
base polymer. By addition of only 0.3% SWNT, 38% fracture property enhancement was
achieved.
Another very important aspect of this improvement is the reduced scattering of the
results. For brittle resin systems, due to the sensitivity of the specimen to micro-scale
defects the error bars for fracture tests are usually very large. The error bars on Figure
4-41 was considerably reduced as the weight fraction of SWNTs was increased. Smaller
error bars can be considered as an improved crack growth behaviour: from unstable, rapid
growth to a more stable and consistent crack propagation.
86
Figure 4-41. Fracture toughness test results for MY0510 / SWNT system with different Anionic SWNT wt.% (100:60 DDS ratio), Cure cycle # 1
4. 4. 2. 2. MWNT system
Effect of hardener type
The results of the fracture toughness test for the MWNT system is shown in Figure 4-42
and Figure 4-43. The former includes the results of IPD, TETA, and the mix of IPD/N3, and
the latter shows the result of the mix of IPD and TETA comprising of IPD:TETA ratios of
20/80, and 50/50, and 80/20 wt%.
Addition of the MWNTs to all the base formulation slightly improved the fracture
toughness values, except for the case of the manufacturer’s recommended hardener, IPD.
The percentage changes in the fracture toughness values of MWNT modified polymer
compared to the base formulation are summarized in Table 4-7.
Table 4-7. MWNT system fracture toughness percentage change compared to the base resin
Hardener IPD TETA IPD/N3 IPD(20)
TETA(80) IPD(50)
TETA(50) IPD(80)
TETA(20)
Fracture toughness % change
- 11 % 12 % 17 % 4 % 5 % 9 %
1.091.31 1.38
1.51
0
0.2
0.4
0.6
0.8
1
1.2
1.4
1.6
1.8
2
Neat 0.1% 0.2% 0.3%
Kic
(M
Pa(
m0.
5))
87
Figure 4-42. Fracture toughness test results, bisphenol-A with 0.3% wt. MWNT and different types of hardener
Figure 4-43. Fracture toughness test results, bisphenol-A with 0.3% wt. MWNT with different IPD:TETA ratio
1.020.91
0.76 0.85
1.131.32
0
0.2
0.4
0.6
0.8
1
1.2
1.4
1.6
1.8
2
Kic
(M
Pa(
m0.
5))
IPD TETA IPD/N3
NEAT bisphenol A MWNT
0.76 0.79 0.79 0.83 0.79 0.86
0
0.2
0.4
0.6
0.8
1
1.2
1.4
1.6
1.8
2
Kic
(M
Pa(
m0.
5))
20:80 50:50 80:20
NEAT bisphenol A MWNT
88
The idea behind using a room temperature cure was to maintain the dispersion quality at
room temperature and to lock the MWNTs up to the gelation point of the resin. For the
samples containing TETA as the curing agent, the dispersion quality during the curing
process is shown in Figure 4-16. The dispersion quality remained constant leading to
improved fracture toughness values. Whereas in the IPD system, the dispersion degraded
during the first heating cycle, as shown in Figure 4-17, and consequently resulted in
reduced fracture toughness for MWNT-modified formulations. The dispersion degradation
started around 50 – 55 °C and stayed the same after 75 °C.
Nevertheless the improvement in the fracture toughness values of the MWNT system with
TETA as hardener, the toughness values for the base formulation is 25% lower than the
fracture toughness of the MWNT system with IPD. Therefore, a mix of IPD with TETA was
considered to evaluate the potential of mixing two hardeners. As shown in Figure 4-43,
none of these formulations resulted in a higher fracture toughness improvement when
compared with the MWNT system with TETA.
Even though, there is an improvement for most of the samples in the average fracture
toughness values, the high error bars should be noted for each set. The high variation in
the fracture toughness values can be related to the brittleness of the resin.
The results clearly showed that the CNT-modified resins should be regarded as a new
material formulation. These formulations should be optimized regardless of the
recommended hardener and curing procedure by the manufacturer.
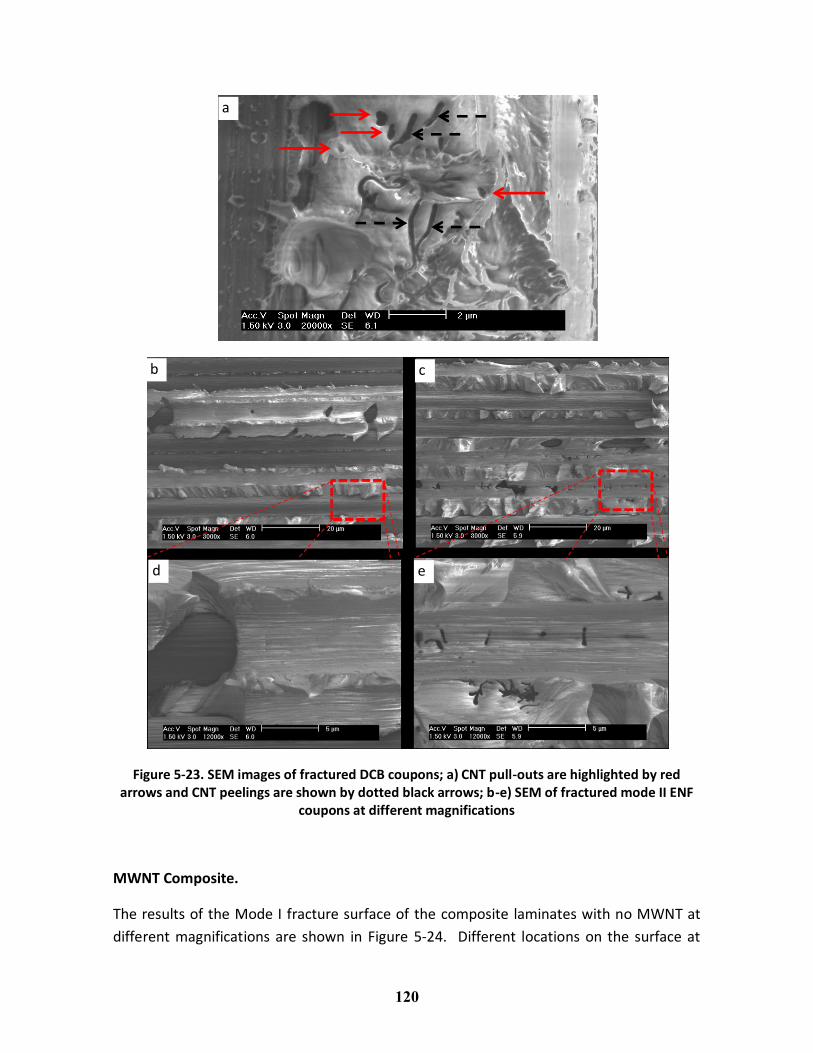
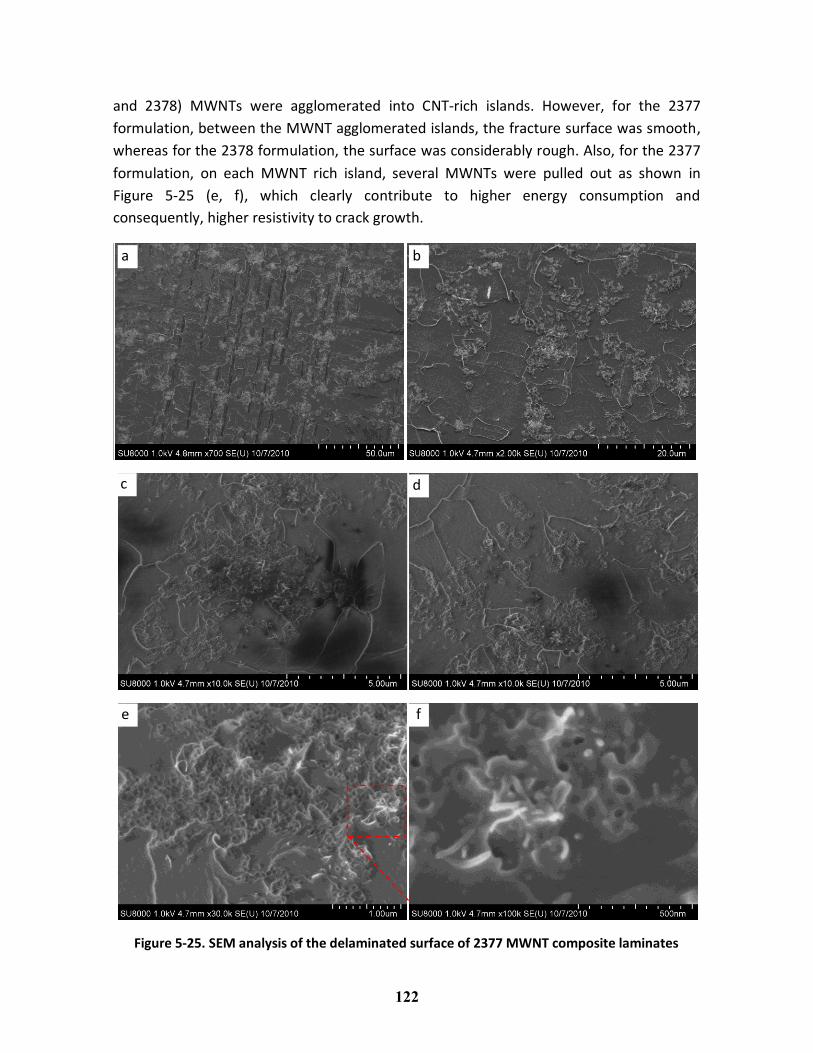
4. 4. 2. 3. SEM analysis of the fractured surfaces for nano-modified polymers
SWNT modified polymer.
The SEM images of the fractured surface, taken by a Hitachi SU-8000 Cold Field Emission
SEM, are shown in Figure 4-44 for the neat MY0510. This is the base sample that yielded
highest fracture toughness improvement with MY to DDS ratio of 100:60 (Table 4-6). As
can be seen in the SEM images, the fracture surface was very smooth and showed no
toughening feature. There were only on very few cavities (Figure 4-44 (c, d)) that could be
due to the impurities that entered the mould during the sample preparation.
89
Figure 4-44. SEM analysis of the fractured surface of neat polymer (SWNT system) (MY: DDS ratio 100: 60)
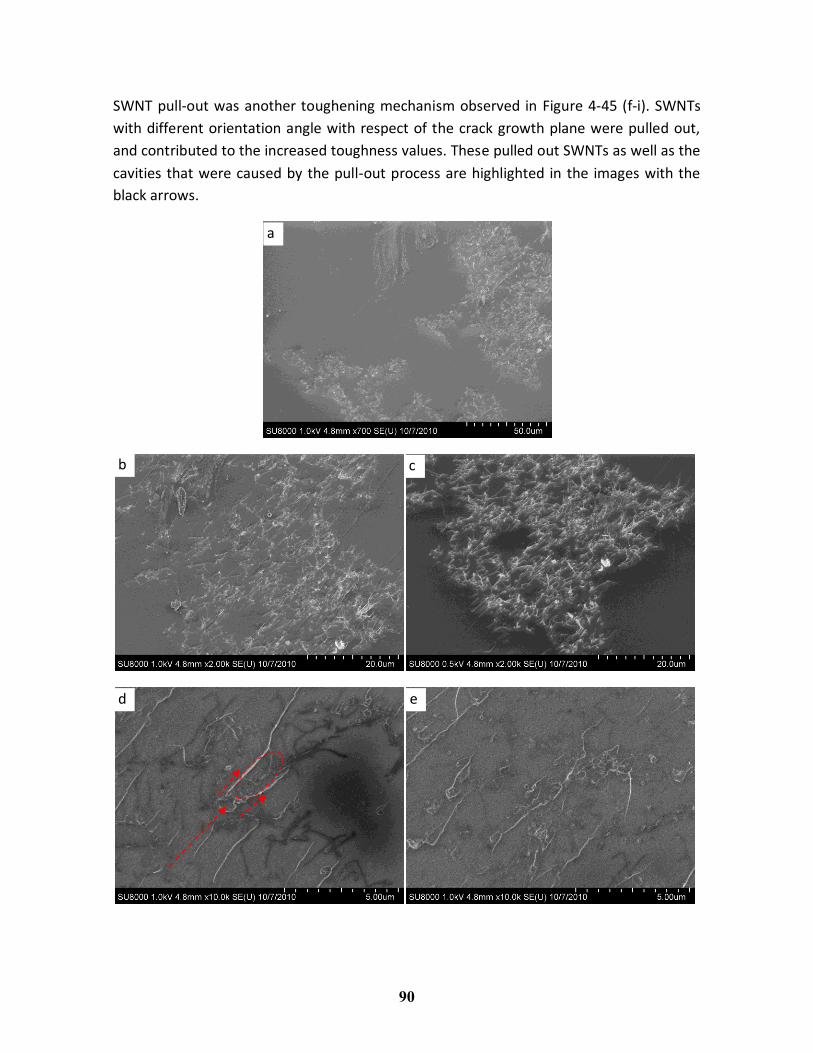
However, when 0.1 wt.% of SWNTs were added to the neat sample, the morphology of
the surface changed, which resulted in fracture toughness improvement. This change of
morphology is shown in SEM images of the fracture surface at different magnifications in
Figure 4-45. The major difference between the neat and SWNT modified specimens was
the roughness of the surface. The roughness of the SWNT modified samples were
considerably increased leading to higher energy consumption to grow the crack.
Another observation from the lower magnifications images (Figure 4-45(a-c)) was a
relatively good dispersion of the SWNTs on the fracture surface. Even though there were
agglomerations of the SWNTs (SWNT islands), the islands were well dispersed.
Also, there were several toughening mechanisms observable at higher magnifications
(Figure 4-45 (d-i)) such as crack pinning and crack deviation (highlighted on Figure 4-45
(d)). The crack was pinned when reached a SWNT island, and then deviated to the two
sides of the SWNT island.
b a
c d
90
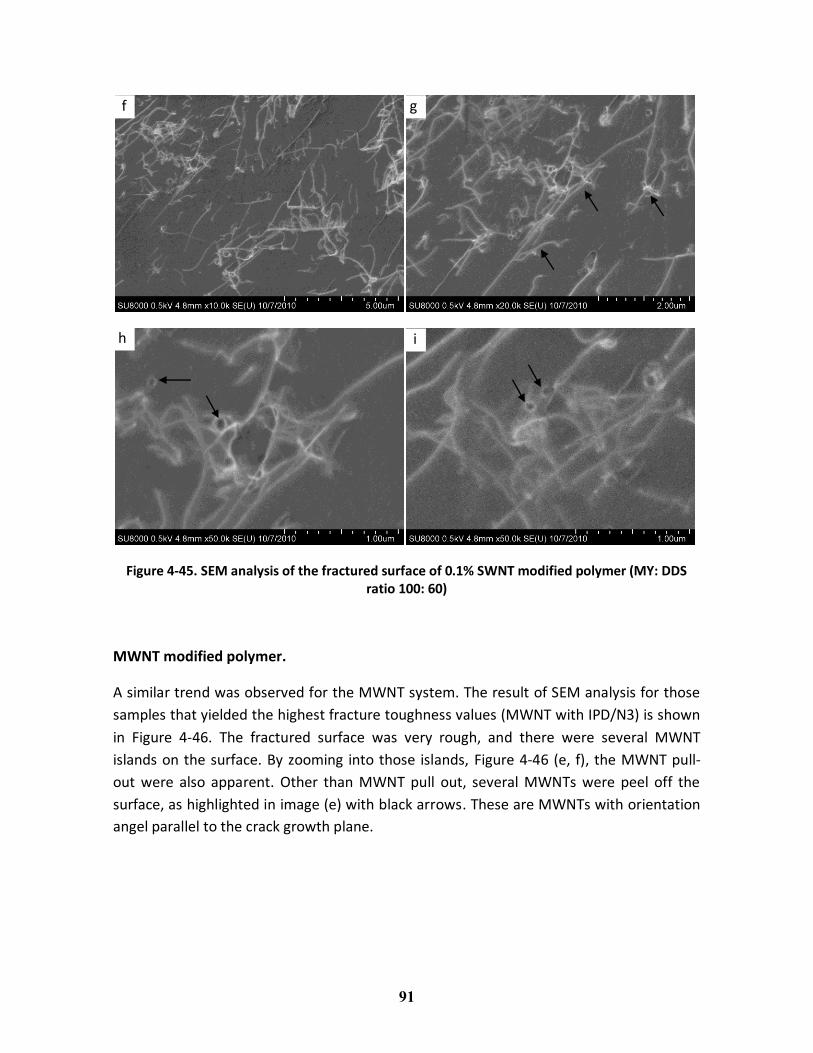
SWNT pull-out was another toughening mechanism observed in Figure 4-45 (f-i). SWNTs
with different orientation angle with respect of the crack growth plane were pulled out,
and contributed to the increased toughness values. These pulled out SWNTs as well as the
cavities that were caused by the pull-out process are highlighted in the images with the
black arrows.
a
b c
d e
91
Figure 4-45. SEM analysis of the fractured surface of 0.1% SWNT modified polymer (MY: DDS ratio 100: 60)
MWNT modified polymer.
A similar trend was observed for the MWNT system. The result of SEM analysis for those
samples that yielded the highest fracture toughness values (MWNT with IPD/N3) is shown
in Figure 4-46. The fractured surface was very rough, and there were several MWNT
islands on the surface. By zooming into those islands, Figure 4-46 (e, f), the MWNT pull-
out were also apparent. Other than MWNT pull out, several MWNTs were peel off the
surface, as highlighted in image (e) with black arrows. These are MWNTs with orientation
angel parallel to the crack growth plane.
f g
h i
92
Figure 4-46. SEM analysis of the fractured surface of 0.3% MWNT modified polymer (Hardener IPD/N3)
c
a
d
b
e f
93
4. 5. Correlation between the model and the experimental results
In this section, the experimental fracture toughness values are compared to the modelling
predictions. This comparison was done for the MY0510 / SWNT system with different wt.
% of Anionic SWNT with 100:60 DDS ratio, Figure 4-41. Since the model predicts the
increased energy resulted from bridging contribution, the stress intensity factor, K ic is
transferred into the critical strain energy release rate, Gic using [158],
2 2(1 ) icic
KG
E
Equation 4-6
where = 0.3 and is the passion ratio, and E = 3.4 GPa and is the elastic modulus. Figure
4-47 shows the results of the critical strain energy release rate, Gic, for the specimens in
Figure 4-41. By subtracting the GIc values for the SWNT modified specimens from the neat
resin sample in Figure 4-47, the toughening contribution of SWNTs can be estimated
(Figure 4-48(a)).
Figure 4-47. The critical strain energy release rate for the results of Figure 4-41
Figure 4-48(a) illustrates the change in the strain energy release rate, Gic, after the
addition of SWNTs predicted by the model and verified experimentally. The predicted CNT
bridging from the model is shown in Figure 4-48(b). The figure shows the bridging
contribution estimated based on the model for randomly dispersed CNTs. As the input for
the model, the interfacial bonding of 47 (MPa) [153], and u(CNT) = 40 (GPa) was used.
The elongation to fracture of SWNTs was assumed to be 10%. The dashed line represents
373.73
524.66 564.05671.25
0
200
400
600
800
Neat 0.1% 0.2% 0.3%
Neat SWNT modified
GIc
(J/m
2)
94
0.1% volume fraction of CNTs, and the solid line represents a higher volume fraction of Vf
= 0.3%. Also, the solid line represent a larger SWNT radius, r=10 nm, whereas for the
dashed line, r=1 nm.
The model (Figure 4-48(b)) predicts potential of up to 250 J/m2 fracture toughness
enhancement via CNT bridging for an average SWNT length of 200 m. On the other hand,
the maximum enhancement from the experiment was approximately 300(J/m2). The
difference can be explained by considering that the model only predicted the contribution
of CNT bridging. However, other toughening mechanisms such as crack pinning and crack
deviation exist due to the addition of CNTs. Also, it should be noted that to achieve more
accurate prediction from the model, each of the input parameters should be measured for
the SWNT and the epoxy system that was used in this study.
(a) Toughening contribution of SWNTs experimental versus modelling predictions
(b) Effect of bridging based on modelling
Figure 4-48. Bridging contribution, model vs. experiment
4. 6. Summary and Discussions
This chapter presented the effect of processing parameter, such as temperature and cure
cycle on the dispersion quality of CNT modified epoxies. The fracture toughness
characterization of SWNT and MWNT modified epoxies were then presented and
correlated to the dispersion quality of the formulations. The results showed the
importance of good dispersion quality on the fracture toughness improvement. Also,
curing at elevated temperatures resulted in viscosity drop and caused dispersion quality
degradation, and consequently lowered the fracture toughness values. The results also
150.92190.32
297.52
90
250
0
100
200
300
400
500
0.1% 0.2% 0.3% 0.1% 0.3%
Experimnet Model
0
50
100
150
200
250
300
0 50 100 150 200
G
Ic (J
/m2)
J bri
dg
ing (
J/m
2)
=47 MPa u = 40 GPa
= 10 %
r = 1 nm, Vf = 0.1%
r = 10 nm Vf = 0.3%
L (m)
95
showed that CNT modified systems should be regarded as a new system and optimized
accordingly.
For the SWNT system, the results showed that the curing process played a key role in the
effectiveness of the SWNTs. Curing cycle was a major source of complexity in CNT-
modified polymers [159, 160], as it affects nano-scale polymerization of the monomers.
Future research on nano-scale curing process monitoring can lighten up potential source
of dispersion degradation. Both type of curing agent and hardener to resin ratios were
studied. Comparing a solid powder hardener, i.e. DDS, with the liquid curing agent, i.e.
Aradur, DDS dissolved in the resin system at 100 °C and consequently resulted in resin rich
locations (locally no CNTs) that affected the dispersion quality. As the DDS hardener to
resin ratio increased, the effect of SWNTs on fracture toughness improved. However,
addition of more hardener above the 100:60 ratio had a negative effect.
For the MWNT system, different types of hardener were studied. It can be concluded that
the chemical process of polymerization during the curing process is not the main driver of
dispersion degradation since the dispersion quality remained constant when the resin was
cured at room temperature. Viscosity drop and thermal expansion of the resin were the
drivers of dispersion degradation. The most effective solution to solve the problem of
dispersion degradation during the cure was proved to be curing at low temperature up to
the gelation point. This process improved the CNT dispersion stability, however, on the
downside, this strategy resulted in an overall low fracture toughness values. According to
the fracture toughness characterization, even though we achieved up to 27%
improvement by addition of CNTs to the base polymer, due to the large variation in the
fracture toughness values of the formulations, extensive research is still required to
achieve major improvement.
Finally, the SEM analysis of the fractured surfaces showed several toughening mechanisms
that were contributing to the increased fracture toughness. These mechanisms, include
CNT pull-out, CNT peel-off, and crack pinning and deviation when reaching agglomerated
Figure 5-13. Mode II fracture test fixture on MTS Insight setup
The first fracture test was performed considering the end of the Teflon insert as the
delamination tip (non-precracked fracture test). The initial delamination length was set to
30 mm (a0) from the crack tip. Displacement was applied to the specimen until a drop in
load occurred, and the specimen was then unloaded. The end of this delamination
became the new tip. The specimen was then repositioned such that the distance between
the new tip and the center of the support roller on the delaminated end was equal to the
original initial delamination length of 30 mm. The test was restarted with this new
configuration (precracked fracture test). Through data reduction, two candidate values
for initiation toughness were obtained in both configurations, for a total of four. The
lowest value that passed a qualification process was conserved and used as the GIIc.
Typical load-displacement curves for non-precracked and precracked fracture test are
shown in Figure 5-14.
The two fracture tests (non-precracked and precracked fracture tests) were both
preceded by two compliance calibration tests. The objective was to quantify the
compliance of each configuration which is used to find the Mode II interlaminar fracture
toughness. The detail of data reduction to find the mode II interlaminar fracture
toughness is given in Appendix B.
107
Figure 5-14. Typical Load-displacement curve for NPC and PC Mode II tests
5. 3. 8. SEM Image Analysis
The SEM images of the fractured surface were taken with a Hitachi SU-8000 Cold Field
Emission SEM. For low volume fraction CNT-modified polymers that are non-conductive, a
low accelerating voltage is required to eliminate surface charging of the samples that
distort the SEM images. This ultra-high-resolution SEM is optimized for nanostructure
characterization at low accelerating voltage (< 1kV). Low-kV SEM allows imaging of
insulating samples without coating the samples with conductive metal (e.g. Gold) that can
deteriorate surface morphology.
5. 4. Results and Discussions
In this section, the results of resin characterization are presented, followed by results of
composite samples characterization. It is important to understand the effect of CNTs on
the two resin systems and then correlate the results to the hybrid composite systems.
5. 4. 1. Resin Characterization
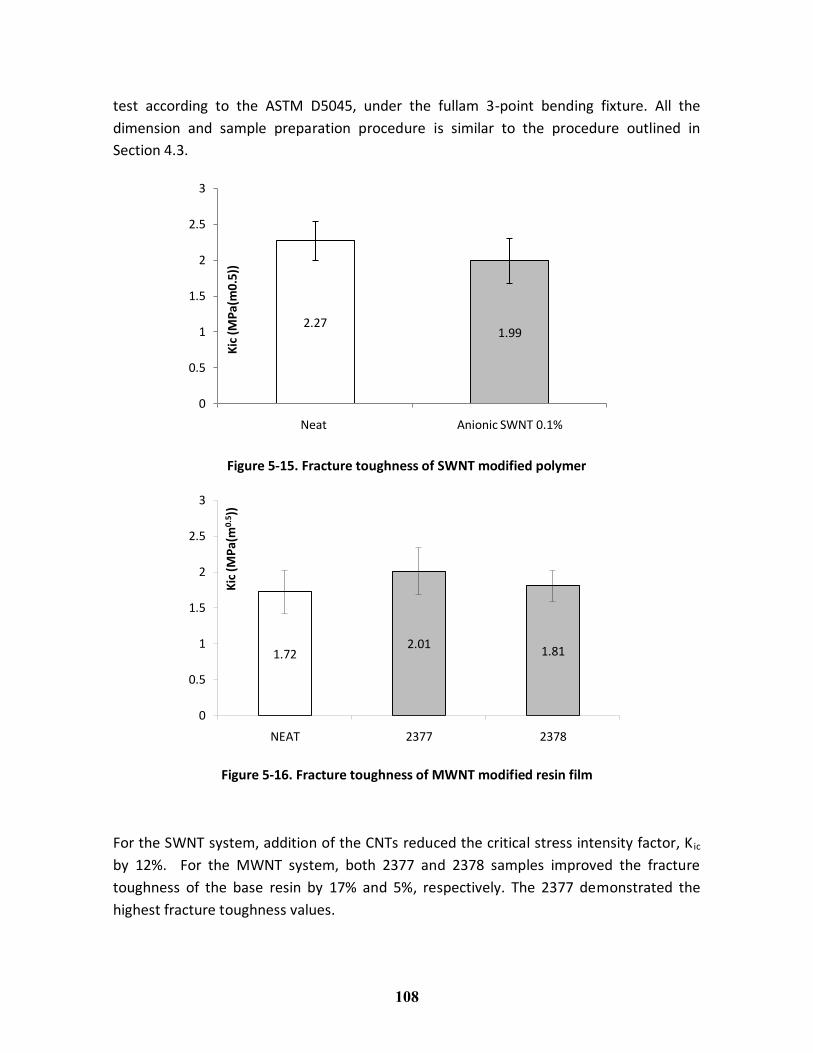
5. 4. 1. 1. Fracture toughness
The results of mode I fracture toughness test for the two polymer systems are shown in
Figure 5-15 and Figure 5-16. These tests are the results of plain strain fracture toughness
0
50
100
150
200
250
300
350
400
450
0 0.5 1 1.5 2 2.5
Load
(N)
Displacement (mm)
NPC
108
test according to the ASTM D5045, under the fullam 3-point bending fixture. All the
dimension and sample preparation procedure is similar to the procedure outlined in
Section 4.3.
Figure 5-15. Fracture toughness of SWNT modified polymer
Figure 5-16. Fracture toughness of MWNT modified resin film
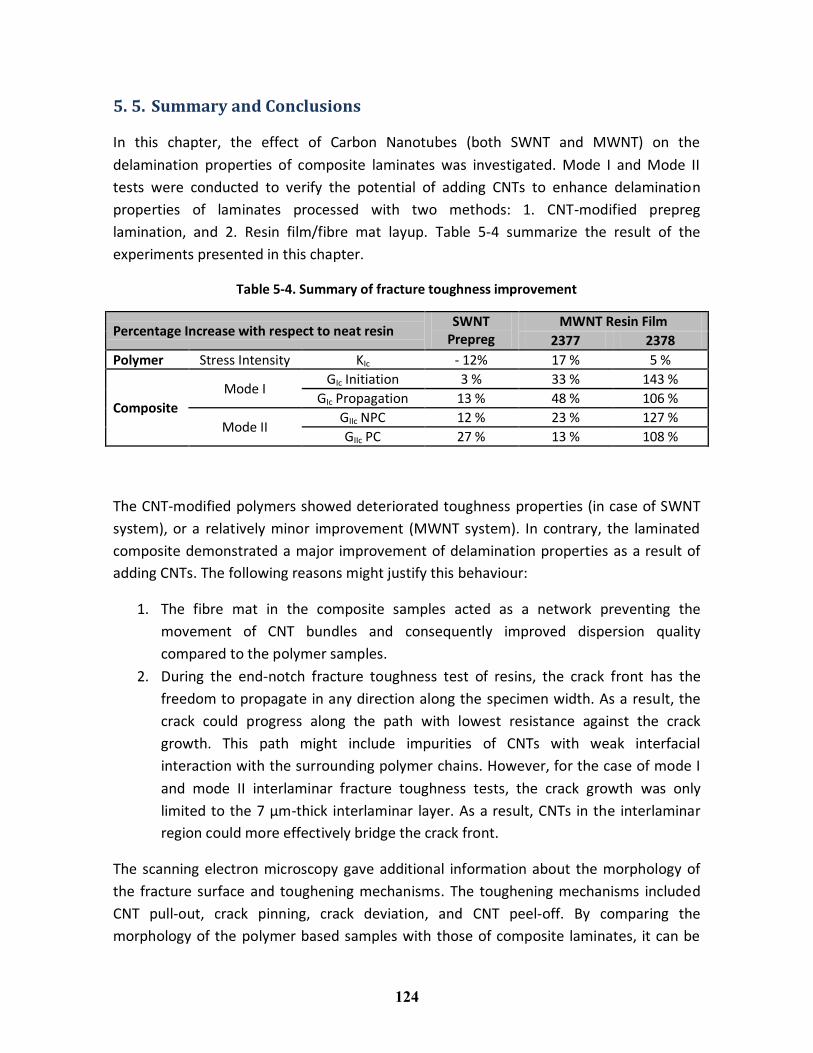
For the SWNT system, addition of the CNTs reduced the critical stress intensity factor, K ic
by 12%. For the MWNT system, both 2377 and 2378 samples improved the fracture
toughness of the base resin by 17% and 5%, respectively. The 2377 demonstrated the
highest fracture toughness values.
2.271.99
0
0.5
1
1.5
2
2.5
3
Neat Anionic SWNT 0.1%
Kic
(M
Pa(
m0.
5))
1.722.01
1.81
0
0.5
1
1.5
2
2.5
3
NEAT 2377 2378
Kic
(M
Pa
(m0
.5))
109
In order to understand better the results, the fractured surfaces of the samples were
studied under the SEM, to identify potential toughening mechanisms.
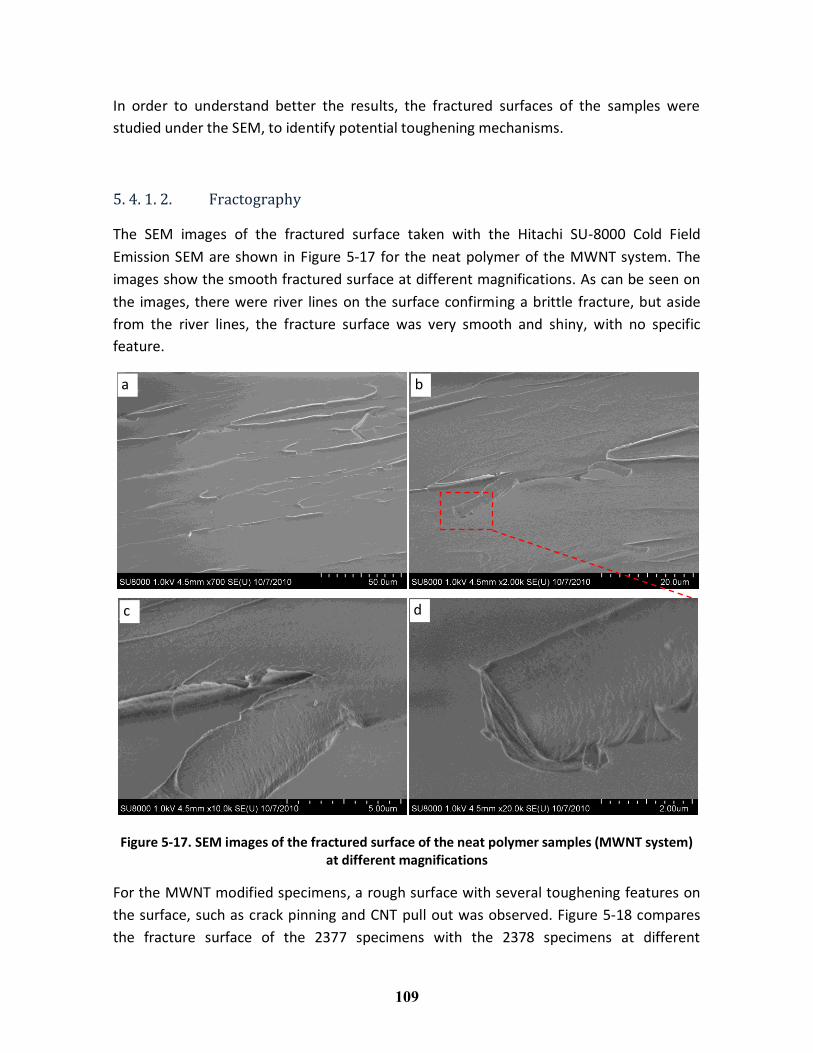
5. 4. 1. 2. Fractography
The SEM images of the fractured surface taken with the Hitachi SU-8000 Cold Field
Emission SEM are shown in Figure 5-17 for the neat polymer of the MWNT system. The
images show the smooth fractured surface at different magnifications. As can be seen on
the images, there were river lines on the surface confirming a brittle fracture, but aside
from the river lines, the fracture surface was very smooth and shiny, with no specific
feature.
Figure 5-17. SEM images of the fractured surface of the neat polymer samples (MWNT system) at different magnifications
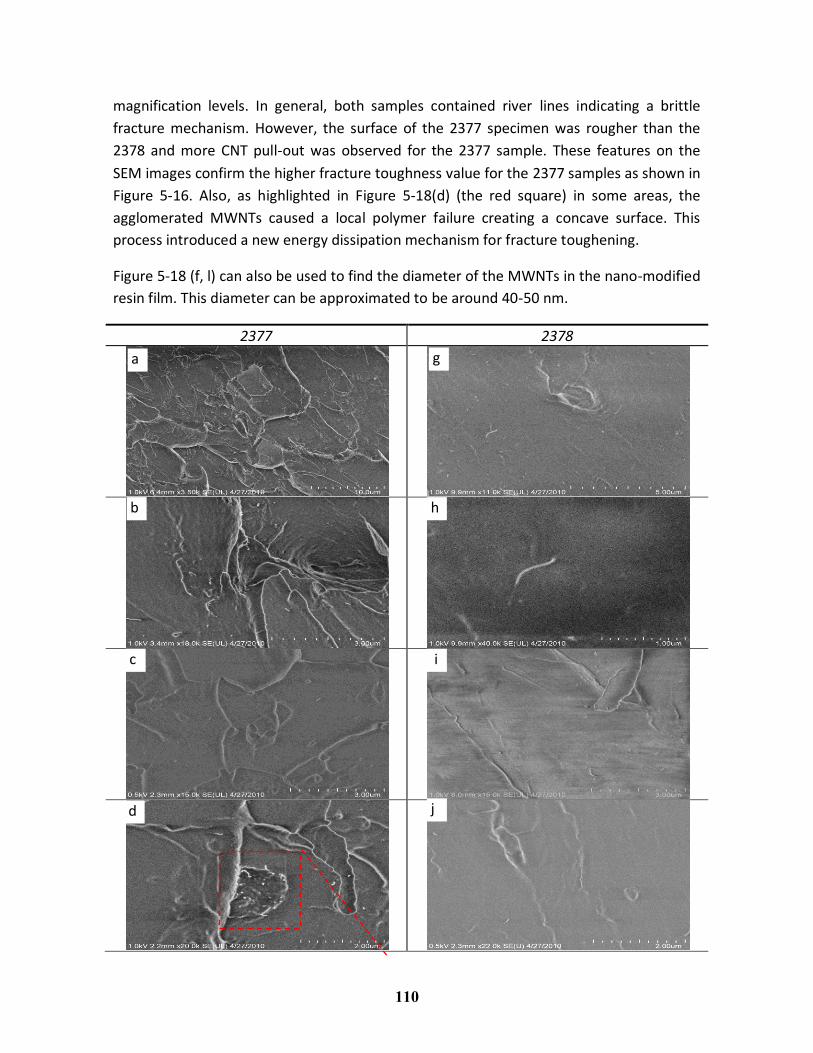
For the MWNT modified specimens, a rough surface with several toughening features on
the surface, such as crack pinning and CNT pull out was observed. Figure 5-18 compares
the fracture surface of the 2377 specimens with the 2378 specimens at different
a b
c d
110
magnification levels. In general, both samples contained river lines indicating a brittle
fracture mechanism. However, the surface of the 2377 specimen was rougher than the
2378 and more CNT pull-out was observed for the 2377 sample. These features on the
SEM images confirm the higher fracture toughness value for the 2377 samples as shown in
Figure 5-16. Also, as highlighted in Figure 5-18(d) (the red square) in some areas, the
agglomerated MWNTs caused a local polymer failure creating a concave surface. This
process introduced a new energy dissipation mechanism for fracture toughening.
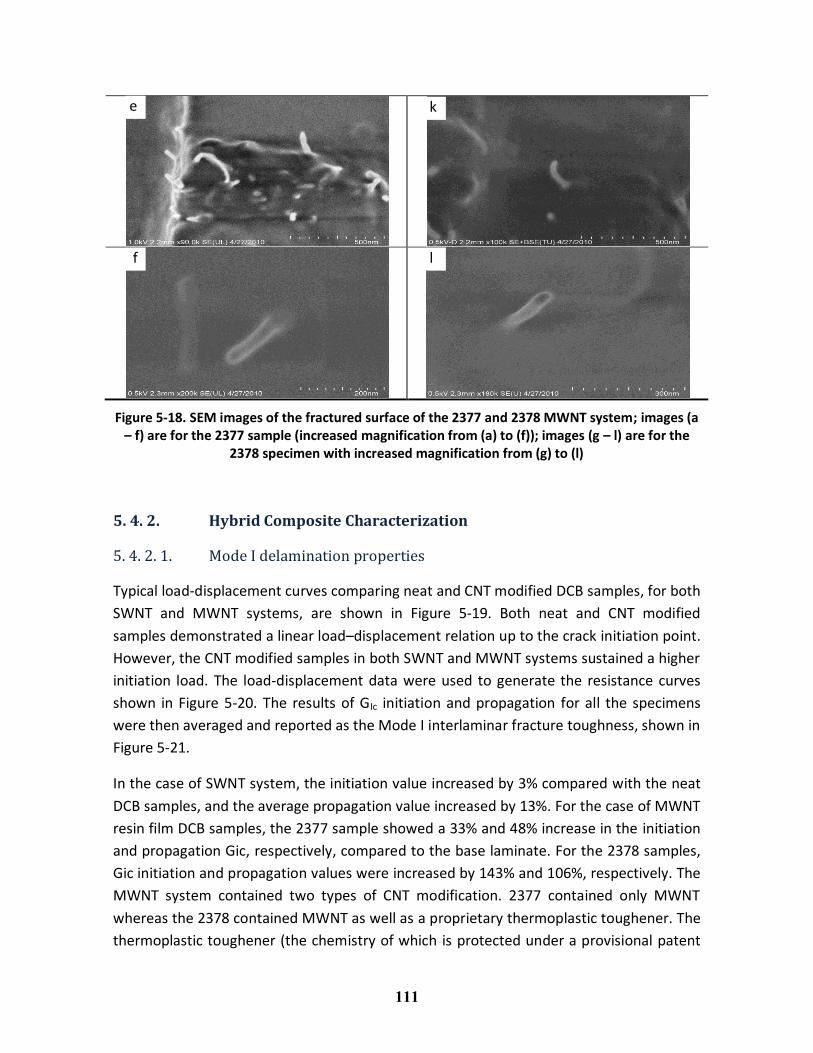
Figure 5-18 (f, l) can also be used to find the diameter of the MWNTs in the nano-modified
resin film. This diameter can be approximated to be around 40-50 nm.
2377 2378
a g
b h
c i
d j
111
Figure 5-18. SEM images of the fractured surface of the 2377 and 2378 MWNT system; images (a – f) are for the 2377 sample (increased magnification from (a) to (f)); images (g – l) are for the
2378 specimen with increased magnification from (g) to (l)
5. 4. 2. Hybrid Composite Characterization
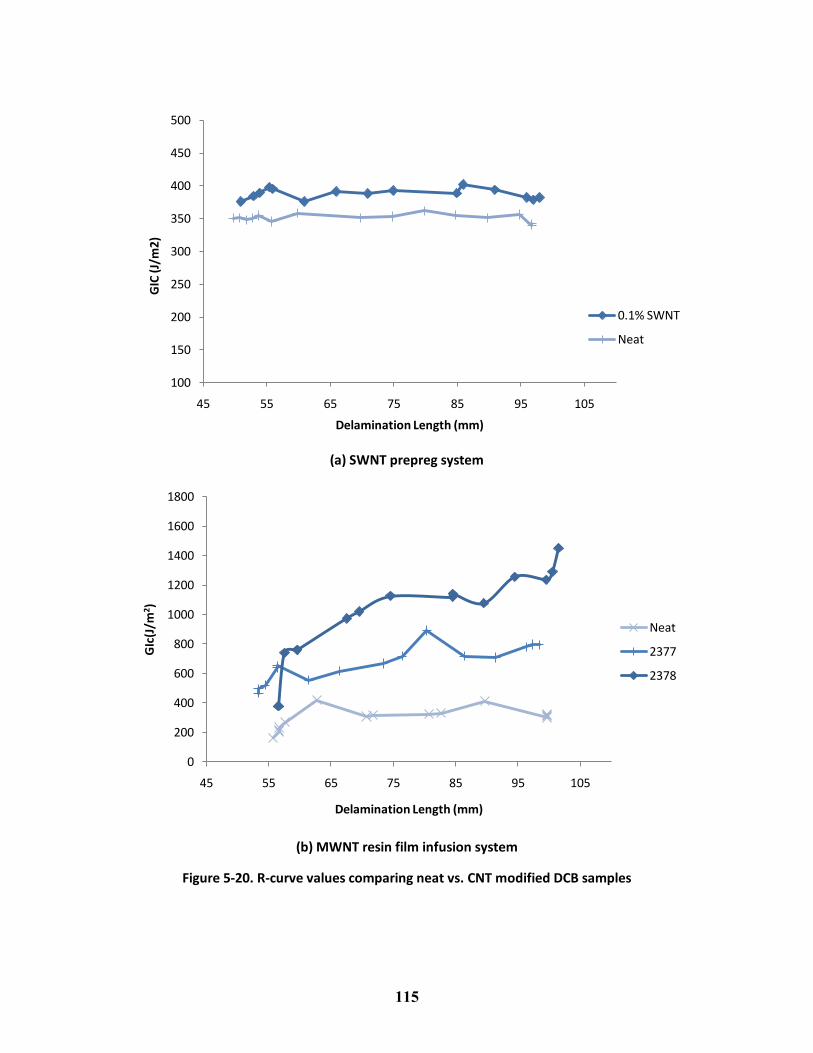
5. 4. 2. 1. Mode I delamination properties
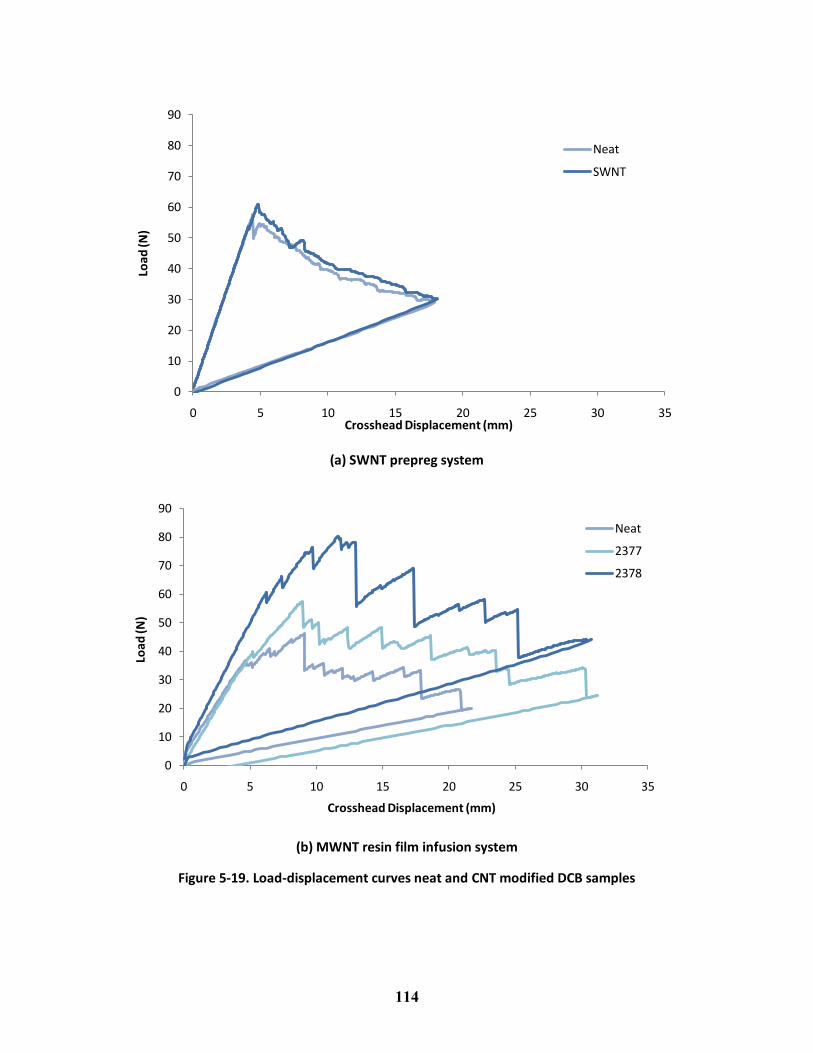
Typical load-displacement curves comparing neat and CNT modified DCB samples, for both
SWNT and MWNT systems, are shown in Figure 5-19. Both neat and CNT modified
samples demonstrated a linear load–displacement relation up to the crack initiation point.
However, the CNT modified samples in both SWNT and MWNT systems sustained a higher
initiation load. The load-displacement data were used to generate the resistance curves
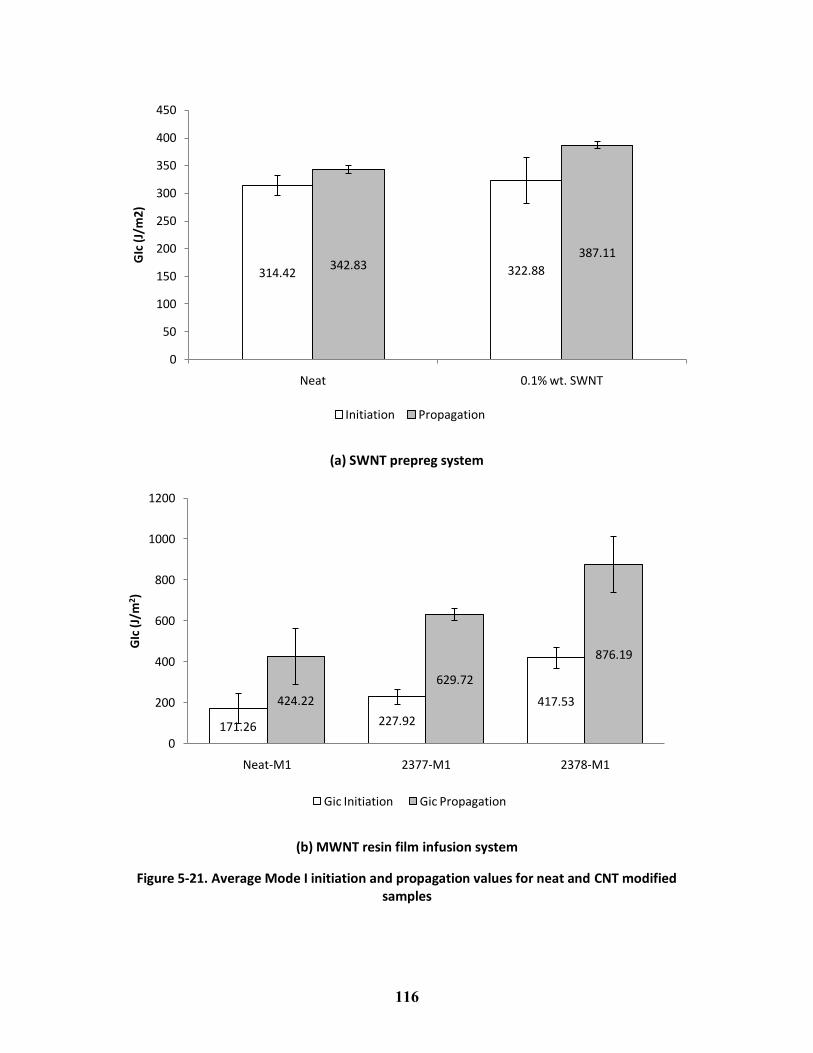
shown in Figure 5-20. The results of GIc initiation and propagation for all the specimens
were then averaged and reported as the Mode I interlaminar fracture toughness, shown in
Figure 5-21.
In the case of SWNT system, the initiation value increased by 3% compared with the neat
DCB samples, and the average propagation value increased by 13%. For the case of MWNT
resin film DCB samples, the 2377 sample showed a 33% and 48% increase in the initiation
and propagation Gic, respectively, compared to the base laminate. For the 2378 samples,
Gic initiation and propagation values were increased by 143% and 106%, respectively. The
MWNT system contained two types of CNT modification. 2377 contained only MWNT
whereas the 2378 contained MWNT as well as a proprietary thermoplastic toughener. The
thermoplastic toughener (the chemistry of which is protected under a provisional patent
e k
f l
112
by Nanoledge Inc) was chemically treated to improve the fracture toughness. For the
MWNT system, these improvements clearly showed major toughening contributions. A
similar increase of 13% in mode I fracture toughness was reported by Romhany and
Szebenyi [164] for a MWNT loading of 0.3 wt%. In another work, Karapappas et al. [147]
demonstrated that 1 wt% loading of MWNT can result in 60% improvement; however, for
small loading of 0.1 wt.% a slight reduction in both mode I and mode II fracture toughness
values was reported.
An important observation from the Mode I delamination results (Gic) is in the
effectiveness of CNTs when compared to the fracture toughness of the CNT-modified resin
(SENB samples). Addition of the SWNT to the base resin decreased the fracture toughness
of the polymer by 10%. In contrast, the addition of SWNT increased the initiation Gic by
3%. In the case of MWNT system, the polymer toughness for the 2377 and 2378 increased
by 17% and 5%, whereas for the composite DCB samples, the initiation Gic increased by
33% and 143%, respectively. This trend can be explained by looking at the source of
energy dissipation as the crack grows, i.e. fibre/matrix debonding [152]. In the DCB
samples, the nature of the interaction among the CNTs, the polymer and the fibre is
different from the interaction between the resin and CNTs in the SENB samples [165, 166].
Also, the carbon fabric acts as a network that limits the movement of CNTs during the cure
process leading to a more uniform CNT dispersion in DCB specimens.
Based on the fracture toughness values of the polymers (SENB tests, (Figure 5-15 and
Figure 5-16)), the higher the base polymer fracture toughness values, the higher was the
initiation Gic values of the DCB specimen. The base epoxy polymer in the SWNT was
tougher when compared with the MWNT system. Consequently, the initiation Gic for the
SWNT system was higher than the initiation Gic for the MWNT system as shown in Figure
5-21. Bradley and Cohen showed that the composite fracture toughness is a function of
the base resin fracture toughness [167]. Therefore, for the initiation Gic when there were
no active toughening mechanisms, the resin properties were dominant in the fracture
toughness of the DCB samples [12, 167]. It should also be noted that the standard loading
rates and the crack tip geometry are different between the SENB sample and DCB samples
[168, 169]. The crack tip geometry influences GIc results particularly for crack initiation.
The SENB specimens contained a sharp, natural pre-crack whereas DCB specimens
contained a Teflon insert (crack initiator) which may have a blunting effect which may
raise GIc for crack initiation.
For both SWNT and MWNT modified composites, the average mode I interlaminar
initiation toughness values were lower than the propagation values. The reason for the
higher propagation values was that the first incremental delamination started from the
113
end of the Teflon insert (crack initiator), whereas, when the crack propagated, toughening
mechanisms such as fibre/CNT bridging kicked in requiring higher energy to further grow
the crack [170, 171]. These toughening mechanisms gave rise to the apparent fracture
toughness values [172]. Also, since the percentage increase in the propagation values was
larger than the initiation values, it can be concluded that there were toughening
mechanisms due to the addition of CNTs.
Unlike the SWNT system, the MWNT system exhibited a rising r-curve which was a sign of
CNT-bridging and other toughening mechanisms such as crack pinning and bowing. The
MWNT system demonstrated higher delamination toughness improvement compared
with the SWNT system. This behaviour could be explained by differences in the
manufacturing process leading to variations in part quality. Also, the base epoxy resin and
the fabric used in the manufacturing of the DCB samples were different between the two
systems. The results imply better interaction between the fibre and the resin in the
MWNT system. Also, in the SWNT prepreg system, the crack propagation within the
laminates was incremental with no sharp decrease in the load values, whereas, the MWNT
system demonstrated a saw-tooth load-displacement curve.
It should be noted that even though other toughening mechanisms such as crack
deviation exists in the CNT-modified polymer composites, CNT bridging is the main
mechanism that benefits from the mechanical properties of CNTs. Other types of
toughening, e.g. crack deviation, is a function of shape of the nano-particles [10, 84-86],
and does not benefit from the high mechanical properties of CNTs and exist with other
types of nano-reinforcements, such as nanoclays.
In summary, for Mode I delamination results, addition of the CNTs in both SWNT and
MWNT systems improved the initiation and propagation GIc. CNTs were pulled out from
the matrix polymer and contributed to the toughening mechanisms, resulting in the
higher interlaminar propagation toughness values. Other CNT toughening mechanisms
may also contribute to the increase of the fracture toughness, such as, crack deviation and
crack pinning which will be discussed in the Fractography section (Section 5.4.2.3).
114
(a) SWNT prepreg system
(b) MWNT resin film infusion system
Figure 5-19. Load-displacement curves neat and CNT modified DCB samples
Figure 5-21. Average Mode I initiation and propagation values for neat and CNT modified samples
314.42 322.88342.83387.11
0
50
100
150
200
250
300
350
400
450
Neat 0.1% wt. SWNT
GIc
(J/
m2)
Initiation Propagation
171.26 227.92
417.53424.22
629.72
876.19
0
200
400
600
800
1000
1200
Neat-M1 2377-M1 2378-M1
GIc
(J/
m2 )
Gic Initiation Gic Propagation
117
Table 5-2 summarizes the percentage change in the mode I values after addition of CNTs.
Table 5-2. Percentage change of fracture toughness values in mode I after addition of CNTs
Percentage Increase with respect to neat resin
SWNT Prepreg MWNT Resin Film
2377 2378
KIc - 12% 17 % 5 %
GIc Initiation 3 % 33 % 143 %
GIc Propagation 13 % 48 % 106 %
5. 4. 2. 2. Mode II delamination properties
The objective of the non-precracked (NPC) and the precracked (PC) fracture tests was to
capture delamination initiation, since delamination growth was highly unstable in Mode II
[173]. According to Appendix B data analysis procedure, precracked and non-precracked
Mode II delamination results were calculated for both SWNT and MWNT systems. The
results of 3 specimens for each system are averaged and shown in Figure 5-22.
As seen in Figure 5-22, in both systems addition of CNTs increased the mode II
interlaminar fracture toughness. This increased release rate energy may be attributed to
CNTs bridging at the delamination site. The SWNT system demonstrated higher NPC
values compared to PC values, whereas for the MWNT system, the PC values were 2% –
12% higher than the NPC values. This can be explained by different thickness of the Teflon
inserts as well as different processing parameter that has been used to manufacture
samples. Table 5-3 summarizes the percentage change in mode II interlaminar fracture
toughness for both systems after adding CNTs.
Table 5-3. Percentage change of fracture toughness values in mode II after addition of CNTs
Percentage increase with respect to neat resin
SWNT Prepreg MWNT Resin Film
2377 2378
GIIc NPC 12 % 23 % 127 %
GIIc PC 27 % 13 % 108 %
For the MWNT system, it is inferred that the 2378 sample with the CNT and the nanofiller,
performs better than the 2377 samples. Even though the 2378 samples with CNT and
nanofiller performed better than the 2377 samples, it should also be noted that the
standard deviations from the average results was larger.
118
(a) SWNT prepreg system
(b) MWNT resin film infusion system
Figure 5-22. Average mode II interlaminar fracture toughness values
1794.992017.55
1104.131407.05
0
500
1000
1500
2000
2500
Neat 0.1% SWNT
G II
c (J
/m2)
Non Precracked Precracked
486598
1102
542 614
1127
0
200
400
600
800
1000
1200
1400
Neat 2377 2378
G II
c (J
/m2 )
Non Precracked Precracked
119
5. 4. 2. 3. Fractography
The Hitachi SU-8000 Cold Field Emission SEM was used to further study the fracture
surface of the composite laminates after delamination tests.
SWNT Composite.
Figure 5-23 (a) shows an SEM image of a fractured DCB coupon failed under the mode I
delamination test. The bridging effects can be seen for larger bundles of SWNTs.
According to this image, the nanotubes contributed to the increase of fracture toughness
failure by crack bridging through two main mechanisms: 1. SWNT pull-out for CNTs
oriented with an angle with respect to the crack growth plane, (red arrows), 2. SWNT peel-
off for CNTs parallel to the crack plane.
In Figure 5-23 (b, c), SEM images of the Mode II fracture surfaces for neat and SWNT-
modified samples are shown, respectively. A comparison between the two SEM images
demonstrated that there were more hackles (the dominant toughening mechanisms in
Mode II) for the nanocomposites. Figure 5-23 (d, e) shows higher magnification SEM
images of fractured samples.
According to the literature, Mode II delaminations are caused by two dominant
toughening mechanisms; micro-cracks and hackles which are both microscopic matrix
failure modes [23, 39, 45, 174-176]. Also, under mode II loadings, fibre bridging is less
dominant. Unlike DCB specimens that exhibited continuous crack growth along the
fibre/matrix interface, ENF specimens showed discontinuous crack growth by micro-crack
coalescence leading to the creation of hackles. According to the SEM image analysis
(Figure 5-23 (b, c)), SWNT bundles acted as rigid fillers arresting the crack propagation.
The arrested cracks created more hackles in the matrix rich interface areas. So, it is
realistic to anticipate a higher amount of hackles present at the fracture surface of the
SWNT modified composite laminates as compared to that of the base composite
laminates.
120
Figure 5-23. SEM images of fractured DCB coupons; a) CNT pull-outs are highlighted by red arrows and CNT peelings are shown by dotted black arrows; b-e) SEM of fractured mode II ENF
coupons at different magnifications
MWNT Composite.
The results of the Mode I fracture surface of the composite laminates with no MWNT at
different magnifications are shown in Figure 5-24. Different locations on the surface at
a
b c
d e
121
x2k magnification are shown in Figure 5-24 (a, b). The former was taken at a location
where the resin was detached from the fibres, and the later was caused by crack growth in
a resin-rich region. Also, in images (a) and (b), there were signs of brittle fracture (river
lines). Also, the fractured surfaces between two river lines were very smooth with no
roughness. This smoothness of the surface was explored by further zooming into the
regions as shown in images (c) with x10K and (d) with x50k magnifications.
Figure 5-24. SEM analysis of the delaminated surface of neat composite laminates
For the MWNT-modified composites, the fracture surface was considerably rougher
compared with the neat resin laminates. The results for the 2377 and 2378 MWNT
laminates are shown in Figure 5-25 and Figure 5-26, respectively. For both formulations,
an important observation was the interaction of the resin film with the fibre fabric. As can
be seen in Figure 5-25(a) and Figure 5-26(a), the fibres were covered with a layer of
modified resin, with relatively well-dispersed MWNTs. This stronger interaction was the
major difference between the neat composite laminates and the MWNT modified ones,
leading to higher delamination resistance. For both MWNT modified formulations (2377
a b
c d
122
and 2378) MWNTs were agglomerated into CNT-rich islands. However, for the 2377
formulation, between the MWNT agglomerated islands, the fracture surface was smooth,
whereas for the 2378 formulation, the surface was considerably rough. Also, for the 2377
formulation, on each MWNT rich island, several MWNTs were pulled out as shown in
Figure 5-25 (e, f), which clearly contribute to higher energy consumption and
consequently, higher resistivity to crack growth.
Figure 5-25. SEM analysis of the delaminated surface of 2377 MWNT composite laminates
a b
c d
e f
123
Figure 5-26. SEM analysis of the delaminated surface of 2378 MWNT composite laminates at different magnification (magnified areas are highlighted by red squares)
For the 2378 formulation, on the other hand, the areas between the MWNT islands were
rough, due to the plasticizer added to improve the delamination properties, Figure 5-26 (c,
d). Otherwise, the same toughening mechanisms existed as the 2377 formulation.
a b
c d
e f
124
5. 5. Summary and Conclusions
In this chapter, the effect of Carbon Nanotubes (both SWNT and MWNT) on the
delamination properties of composite laminates was investigated. Mode I and Mode II
tests were conducted to verify the potential of adding CNTs to enhance delamination
properties of laminates processed with two methods: 1. CNT-modified prepreg
lamination, and 2. Resin film/fibre mat layup. Table 5-4 summarize the result of the
experiments presented in this chapter.
Table 5-4. Summary of fracture toughness improvement
Percentage Increase with respect to neat resin SWNT
Prepreg MWNT Resin Film
2377 2378
Polymer Stress Intensity KIc - 12% 17 % 5 %
Composite
Mode I GIc Initiation 3 % 33 % 143 %
GIc Propagation 13 % 48 % 106 %
Mode II GIIc NPC 12 % 23 % 127 %
GIIc PC 27 % 13 % 108 %
The CNT-modified polymers showed deteriorated toughness properties (in case of SWNT
system), or a relatively minor improvement (MWNT system). In contrary, the laminated
composite demonstrated a major improvement of delamination properties as a result of
adding CNTs. The following reasons might justify this behaviour:
1. The fibre mat in the composite samples acted as a network preventing the
movement of CNT bundles and consequently improved dispersion quality
compared to the polymer samples.
2. During the end-notch fracture toughness test of resins, the crack front has the
freedom to propagate in any direction along the specimen width. As a result, the
crack could progress along the path with lowest resistance against the crack
growth. This path might include impurities of CNTs with weak interfacial
interaction with the surrounding polymer chains. However, for the case of mode I
and mode II interlaminar fracture toughness tests, the crack growth was only
limited to the 7 μm-thick interlaminar layer. As a result, CNTs in the interlaminar
region could more effectively bridge the crack front.
The scanning electron microscopy gave additional information about the morphology of
the fracture surface and toughening mechanisms. The toughening mechanisms included
CNT pull-out, crack pinning, crack deviation, and CNT peel-off. By comparing the
morphology of the polymer based samples with those of composite laminates, it can be
125
concluded that there were more toughening features on the surface of delaminated
composites.
Finally, as stated in Chapter 4, manufacturing processes plays a key role in the
effectiveness of CNT modification of polymers. The results of this chapter also confirm the
same dependence for composites laminate processing.
126
Chapter 6. Conclusions and Contribution of the Thesis
In this thesis, the effect of CNTs as a toughening agent on polymer based composite was
modelled and experimentally investigated. The contributions of this work are summarized
as follows:
1) An analytical CNT-bridging model identified the key CNT physical and mechanical
properties that affect the toughness of a brittle matrix. Adding CNTs to polymers results
in several toughening mechanisms that enhances fracture toughness, i.e. CNT bridging,
crack pinning, and crack deviation. However, only the Carbon Nanotube bridging
mechanism benefits from the extraordinary strength of CNTs, whereas other toughening
mechanisms are only a function of the geometry of the toughening agent.
By analogy with long fibre reinforced composites, the nanotubes will pull-out if their
length is below a critical length. For CNT having a length higher than a critical value, there
will be a combination of CNT pull-out and rupture, [1]. Modelling of both the CNT pull-out
and the CNT rupture was presented. The proposed model also addressed the effect of
random CNT orientation in the polymer matrix for the first time, whereas previous
modelling studies focused on perfectly aligned CNTs, [118, 119].
The model is useful in identifying the effect of different geometrical and mechanical
properties of CNTs on the final fracture toughness of CNT-modified formulations. Based
on the CNT bridging model, aligning relatively long (>10μm) carbon nanotubes
perpendicular to the crack growth plane has great potential to enhance the toughness of
brittle polymers. Also, toughness enhancement with CNTs requires increasing the volume
fraction and length of CNTs, and aligning them normal to the crack growth plane. The
model also shows that in most cases, SWNTs were the better choice for polymer
toughening compared to MWNTs. Figure 6-1 summarizes the conclusions of the modelling
work. The proposed steps to improve the toughness are bounded by the limitations and
challenges in the processing of the CNT polymer mixtures. A very important assumption of
this modelling work is the perfect dispersion of CNTs inside the polymer solution.
However, in reality CNTs create bundles and agglomerate inside the CNT modified
solutions. CNT bundles and agglomerates have lower mechanical properties, when
127
compared with the individual CNTs. Therefore, it is critical to understand the effect of
processing on the fracture toughness of CNT-modified polymers.
Randomly oriented Alignment of CNTs Higher Vf Incorporation of longer
CNTs
Figure 6-1. Steps to improve the toughness of brittle polymers by incorporating CNTs
2) The evolution of CNT dispersion during the curing process was observed and
investigated. Even though the CNTs were well dispersed at room temperature, when the
curing process occurred at high temperature (>100 °C), the dispersion quality
deteriorated. An image analysis tool was used to quantify the dispersion deterioration to
identify the root cause of dispersion degradation. The results of dispersion analyses were
correlated to the viscosity curves obtained from rheological analyses. It was shown that
the chemical process of polymerization (curing process) was not the main driver of
dispersion degradation, since the dispersion quality remained constant when polymer
systems were cured at room temperature. However, a drop in viscosity and the thermal
expansion of the resin at high temperature (>100 °C) proved to be the main drivers of
dispersion degradation. Also, the dispersion analysis showed a direct correlation between
dispersion quality and the fracture toughness enhancement of CNTs in modified polymers.
This was a major contribution, as this approach resulted in identifying the optimized
SWNT formulation. The research started with a 23% reduction in the fracture toughness
when a low CNT content was added to the polymer matrix, and through a systematic
series of dispersion and fracture tests, we achieved 38% improvement in stress intensity
fracture toughness values.
3) The addition of very low CNT content (<1 wt.%) to epoxy was systematically studied
and resulted in the improvement of fracture toughness (up to 38%). This was done by
fine- tuning the formulations to achieve uniform dispersion of CNTs in the polymer. The
fine tuning process included changing of the type of curing agent or the ratio of polymer
to curing agent. Two types of CNTs were considered: SWNT (in MY0510 Epoxy) and MWNT
(in bisphenol-A epoxy).
128
For the SWNT system, the effect of the type of curing agent and the hardener – to – resin
ratio were studied. A solid powder hardener, i.e. DDS, was compared to a liquid curing
agent, i.e. Aradur. DDS resulted in higher fracture toughness values compared to Aradur.
DDS dissolved in the resin system at 100 °C and consequently resulted in resin-rich
locations (locally no CNTs), which affected the dispersion quality. As the DDS hardener to
resin ratio increased, the effect of SWNTs on fracture toughness improved. However,
addition of more hardener above the 100:60 ratio had a negative effect. For this system, a
maximum of 38% improvement of fracture toughness was achieved. For the MWNT
system, different types of hardener were studied. The most effective solution to solve the
problem of dispersion degradation during the cure was to gel the resins at low
temperatures. This process improved the CNT dispersion stability.
The SEM analysis of the fracture surfaces showed several toughening mechanisms that
contributed to the increased fracture toughness. These mechanisms include CNT pull-out,
CNT peel-off, crack pinning, and crack deviation from the agglomerated CNTs (CNT
islands).
4) The CNTs were incorporated into the polymer matrix of two types of Carbon Fibre
Composite Laminates and up to 140% improvement in delamination properties was
achieved. Both Mode I and Mode II tests were conducted to verify the potential of adding
CNTs to enhance delamination properties of laminated composites. Two manufacturing
techniques were considered: 1. CNT-modified prepreg lamination, and 2. Resin film/fibre
fabric layup. The CNT-modified polymers showed deteriorated toughness properties in
case of SWNT system (-12%), and a relatively minor improvement for the MWNT system
(17%). On the other hand, the laminated composites demonstrated a major improvement
of delamination properties as a result of adding CNTs (up to 140%).
This different behaviour in the fracture toughness properties of polymers vs. composite
laminates was explained by studying the fracture surface through Scanning Electron
Microscopy. The morphology of the fracture surface demonstrated a better dispersion
quality and more toughening features on the surface of the delaminated composites
compared with that of the polymer. Carbon fibres seem to act as a network, preventing
CNTs to move freely and re-agglomerate, leading to uniform dispersion of CNTs in
laminated composites.
129
Future works
The following subjects could be potential topics for further research in the future:
1. Effect of CNT bundles and aggregates should be modelled to understand the actual
effect of the CNTs, since in reality, CNTs agglomerated due to their high surface
tension. Most of the current modelling work on CNT-modified polymers in terms of
structural/property relation considered CNTs as a single high performance
material, however, CNTs agglomerated and created bundles, as confirmed by the
SEM images. These bundles or agglomerated CNTs have different physical and
mechanical properties than individual CNTs.
2. The dispersion degradation analysis presented in this work was performed under
optical microscope. This level of magnification is essential for understanding of
CNT agglomeration at micro-level. CNT dispersion analysis at nano-scale (using
SEM) would help clarify nano-scale behaviour of these formulations during the
curing process. A major challenge however is the design of a robust test setup that
can perform the test under SEM.
3. An important downside of CNT-modified polymers is the large variation in the
mechanical characterization results of different batches with the same
formulation. The results of the fracture toughness characterization were very
sensitive to the sample preparation procedure. More detailed research on the root
causes of such variations can be used to develop standards for material processing
and to pave the way for the industrial application of these material systems.
4. Investigating other base polymer materials as well as other types of nano-fillers
can help better understand the mechanisms leading to improved properties. As an
example, the choice of a very ductile polymer (such as a thermoplastic polymer), in
which cracks propagate at a very stable manner, will allow observation of the
toughening mechanism during the crack growth. This crack growth monitoring will
be important to identify novel toughening mechanisms.
According to the results of this research for the CNT-modified composites, further
research is required to effectively manufacture composite laminates with mechanical and
multifunctional properties that harness the full potential of Carbon Nanotubes as polymer
reinforcement.
130
Chapter 7. References
[1] Hull, D., 1981, An Introduction to Composite Materials, Cambridge University Press.
[2] Bauhofer, W., and Kovacs, J. Z., 2009, "A Review and Analysis of Electrical Percolation in Carbon Nanotube Polymer Composites," Composites Science and Technology, 69(10), pp. 1486-1498.
[3] Potschke, P., Fornes, T. D., and Paul, D. R., 2002, "Rheological Behavior of Multiwalled Carbon Nanotube/Polycarbonate Composites," Polymer, 43(11), pp. 3247-3255.
[4] Gojny, F. H., Wichmann, M. H. G., Fiedler, B., and Schulte, K., 2005, "Influence of Different Carbon Nanotubes on the Mechanical Properties of Epoxy Matrix Composites - a Comparative Study," Composites Science and Technology, 65(15-16), pp. 2300-2313.
[5] Thostenson, E. T., and Chou, T.-W., 2006, "Processing-Structure-Multi-Functional Property Relationship in Carbon Nanotube/Epoxy Composites," Carbon, 44(14), pp. 3022-3029.
[6] Seyhan, A. T., Tanoglu, M., and Schulte, K., 2009, "Tensile Mechanical Behavior and Fracture Toughness of Mwcnt and Dwcnt Modified Vinyl-Ester/Polyester Hybrid Nanocomposites Produced by 3-Roll Milling," Materials Science and Engineering: A, 523(1-2), pp. 85-92.
[7] Ashby, M. F., Shercliff, H., Cebon, D., and Books24x, I., 2007, Materials Engineering, Science, Processing and Design,
[8] Ajayan, P. M., Schadler, L. S., Giannaris, C., and Rubio, A., 2000, "Single-Walled Carbon Nanotube–Polymer Composites: Strength and Weakness," Advanced Materials, 12(10), pp. 750-753.
[9] Lange, F. F., 1970 "Interaction of a Crack Front with a Second-Phase Dispersion " PHIL MAG., 22(179), pp. 983-992.
[10] Evans, A. G., 1972, "Strength of Brittle Materials Containing Second Phase Dispersions," Philosophical Magazine, 26(6), pp. 1327-1344.
[11] Kunz-Douglass, S., Beaumont, P. W. R., and Ashby, M. F., 1980, "A Model for the Toughness of Epoxy-Rubber Particulate Composites," Journal of Materials Science, 15(5), pp. 1109-1123.
[12] Garg, A. C., and Mai, Y.-W., 1988, "Failure Mechanisms in Toughened Epoxy Resins--a Review," Composites Science and Technology, 31(3), pp. 179-223.
[13] Garg, A., 1985, "Fracture Behavior of Cross-Ply Graphite/ Epoxy Laminates," Engineering Fracture Mechanics, 22(6), pp. 1035-1048.
[14] Lammerant, L., and Verpoest, I., 1996, "Modelling of the Interaction between Matrix Cracks and Delaminations During Impact of Composite Plates," Composites Science and Technology, 56(10), pp. 1171-1178.
131
[15] Khashaba, U. A., "Delamination in Drilling Gfr-Thermoset Composites," Composite Structures, 63(3-4), pp. 313-327.
[16] Green, D. J., Nicholson, P. S., and Embury, J. D., 1979, "Fracture of a Brittle Particulate Composite," Journal of Materials Science, 14(7), pp. 1657-1661.
[17] Kinloch, A. J., Shaw, S. J., and Hunston, D. L., 1982, "Crack Propagation in a Rubber-Toughened Epoxy," Cambridge, MA, Engl, pp. 29-1.
[18] Kinloch, A. J., Young, R. J., Spanoudakis, J., and Maxwell, D., 1982, "Failure Mechanisms in Brittle Particle-Filled Epoxy Resins," Cambridge, England.
[19] Mcmeeking, R. M., and Evans, A. G., 1982, "Mechanics of Transformation-Toughening in Brittle Materials," Proc. Journal of the American Ceramic Society, 65, pp. 242-246.
[20] Moloney, A. C., Kausch, H. H., Kaiser, T., and Beer, H. R., 1987, "Parameters Determining the Strength and Toughness of Particulate Filled Epoxide Resins," Journal of Materials Science, 22(2), pp. 381-393.
[21] Bandyopadhyay, S., 1990, "Review of the Microscopic and Macroscopic Aspects of Fracture of Unmodified and Modified Epoxy Resins," Materials Science and Engineering A, 125(2), pp. 157-184.
[22] Kim, J.-K., and Mai, Y.-W., 1991, "High Strength, High Fracture Toughness Fibre Composites with Interface Control--a Review," Composites Science and Technology, 41(4), pp. 333-378.
[23] Sue, H. J., Jones, R. E., and Garcia-Meitin, E. I., 1993, "Fracture Behaviour of Model Toughened Composites under Mode I and Mode Ii Delaminations," Journal of Materials Science, 28(23), pp. 6381-6391.
[24] Johnston, N. J., 1984, "Synthesis and Toughness Properties of Resins and Composites," Proc. NASA Conference Publication, pp. 75-95.
[25] Bascom, W. D., Cottington, R. L., Jones, R. L., and Peyser, P., 1975, "The Fracture of Epoxy- and Elastomer-Modified Epoxy Polymers in Bulk and as Adhesives," Journal of Applied Polymer Science, 19(9), pp. 2545-2562.
[26] Bascom, W., Ting, R., Moulton, R., Riew, C., and Siebert, A., 1981, "The Fracture of an Epoxy Polymer Containing Elastomeric Modifiers," Journal of Materials Science, 16(10), pp. 2657-2664.
[27] Mai, Y. W., Atkins, A. G., Selby, K., and Miller, L. E., 1975, "On the Velocity-Dependent Fracture Toughness of Epoxy Resins," Journal of Materials Science, 10(11), pp. 2000-2003.
[28] Koutsky, J., River, B., Ebewele, R., Luce, M., and Han, K. S., 1983, "Evaluation of Fracture Energies of Composites Using Cantilever Beam Techniques," Proc. Organic Coatings and Applied Polymer Science Proceedings, 48, pp. 822-825.
[29] Garg, A., and Ishai, O., 1985, "Hygrothermal Influence on Delamination Behavior of Graphite/Epoxy Laminates," Engineering Fracture Mechanics, 22(3), pp. 413-427.
132
[30] Keary, P. E., Ilcewicz, L. B., Shaar, C., and Trostle, J., 1985, "Mode I Interlaminar Fracture Toughness of Composites Using Slender Double Cantilevered Beam Specimens," Journal of Composite Materials, pp. 154-177.
[31] Whitney, J. M., Browning, C. E., and Hoogsteden, W., 1982, "A Double Cantilever Beam Test for Characterizing Mode I Delamination of Composite Materials," Journal of Reinforced Plastics and Composites, pp. 297-313.
[32] Gledhill, R. A., Kinloch, A. J., Yamini, S., and Young, R. J., 1978, "Relationship between Mechanical Properties of and Crack Progogation in Epoxy Resin Adhesives," Polymer, 19(5), pp. 574-582.
[33] Gledhill, R. A., and Kinloch, A. J., 1976, "Failure Criterion for the Fracture of Structural Adhesive Joints," Polymer, 17(8), pp. 727-731.
[34] Mai, Y. W., 1975, "Quasi-Static Adhesive Fracture," The Journal of Adhesion, 7(2), pp. 141 - 153.
[35] Rhodes, M. D., 1980, "Damage Tolerance Research on Composite Compression Panel," NASA-CP 2142 ), pp. 107–143.
[36] Lhymn, C., and Schultz, J. M., 1987, "Strength and Toughness of Fibre-Reinforced Thermoplastics: Effect of Temperature and Loading Rate," Composites, 18(4), pp. 287-292.
[37] Green, D. J., Nicholson, P. S., and Embury, J. D., 1978, "Crack Shape Study in a Brittle, Non-Bonded, Particulate Composite," Solid Wastes Management Refuse Removal Journal, 3B(pp. 941-948.
[38] Pearson, R. A., and Yee, A. F., 1983, "Effect on Crosslink Density on the Toughening Mechanism of Elastomer Modified Epoxies," Washington, DC, USA, 49, pp. 316-320.
[39] Lee, J. J., Lim, J. O., and Huh, J. S., 2000, "Mode Ii Interlaminar Fracture Behavior of Carbon Bead-Filled Epoxy/Glass Fiber Hybrid Composite," Polymer Composites, 21(2), pp. 343-352.
[40] Mimura, K., Ito, H., and Fujioka, H., 2001, "Toughening of Epoxy Resin Modified with in Situ Polymerized Thermoplastic Polymers," Polymer, 42(22), pp. 9223-9233.
[41] Baughman, R. H., Zakhidov, A. A., and De Heer, W. A., 2002, "Carbon Nanotubes - the Route toward Applications," Science, 297(5582), pp. 787-792.
[42] Qiao, Y., 2003, "Fracture Toughness of Composite Materials Reinforced by Debondable Particulates," Scripta Materialia, 49(6), pp. 491-496.
[43] Gorga, R. E., and Cohen, R. E., 2004, "Toughness Enhancements in Poly(Methyl Methacrylate) by Addition of Oriented Multiwall Carbon Nanotubes," Journal of Polymer Science, Part B: Polymer Physics, 42(14), pp. 2690-2702.
[44] Morgan, R., 1985, Epoxy Resins and Composites I.
[45] Wetzel, B., Rosso, P., Haupert, F., and Friedrich, K., 2006, "Epoxy Nanocomposites - Fracture and Toughening Mechanisms," Engineering Fracture Mechanics, 73(16), pp. 2375-2398.
133
[46] Zhao, Q., and Hoa, S. V., 2007, "Toughening Mechanism of Epoxy Resins with Micro/Nano Particles," Journal of Composite Materials, 41(2), pp. 201-219.
[47] Zhao, S., Schadler, L. S., Duncan, R., Hillborg, H., and Auletta, T., 2008, "Mechanisms Leading to Improved Mechanical Performance in Nanoscale Alumina Filled Epoxy," Composites Science and Technology, 68(14), pp. 2965-2975.
[48] Zhao, S., Schadler, L. S., Hillborg, H., and Auletta, T., 2008, "Improvements and Mechanisms of Fracture and Fatigue Properties of Well-Dispersed Alumina/Epoxy Nanocomposites," Composites Science and Technology, 68(14), pp. 2976-2982.
[49] Mcgarry, F. J., 1970, "Building Design with Fibre Reinforced Materials," Proceedings of the Royal Society of London. A. Mathematical and Physical Sciences, 319(1536), pp. 59-68.
[50] Kinloch, A. J., Shaw, S. J., Tod, D. A., and Hunston, D. L., 1983, "Deformation and Fracture Behaviour of a Rubber-Toughened Epoxy: 1. Microstructure and Fracture Studies," Polymer, 24(10), pp. 1341-1354.
[51] Bandyopadhyay, S., 1984, "Crack Propagation Studies of Bulk Polymeric Materials in the Scanning Electron Microscope," Journal of Materials Science Letters, 3(1), pp. 39-43.
[52] Drake, R., and Siebert, A. R., 1975, "Elastomer-Modified Epoxy Resins for Structural Applications," SAMPE Q, 6(4), pp. 11-21.
[53] Kinloch, A. J., Shaw, S. J., and Hunston, D. L., 1983, "Deformation and Fracture Behaviour of a Rubber-Toughened Epoxy: 2. Failure Criteria," Polymer, 24(10), pp. 1355-1363.
[54] Scott, J. M., and Phillips, D. C., 1975, "Carbon Fibre Composites with Rubber Toughened Matrices," Journal of Materials Science, 10(4), pp. 551-562.
[55] Liu, L., and Wagner, H. D., 2005, "Rubbery and Glassy Epoxy Resins Reinforced with Carbon Nanotubes," Composites Science and Technology, 65(11-12), pp. 1861-1868.
[56] González, I., Eguiazábal, J. I., and Nazábal, J., 2006, "Rubber-Toughened Polyamide 6/Clay Nanocomposites," Composites Science and Technology, 66(11-12), pp. 1833-1843.
[57] Kunz, S. C., Sayre, J. A., and Assink, R. A., 1982, "Morphology and Toughness Characterization of Epoxy Resins Modified with Amine and Carboxyl Terminated Rubbers," Polymer, 23(13), pp. 1897-1906.
[58] Maxwell, D., Young, R. J., and Kinloch, A. J., 1984, "Hybrid Particulate-Filled Epoxy-Polymers," Journal of Materials Science Letters, 3(1), pp. 9-12.
[59] Kinloch, A. J., Maxwell, D., and Young, R. J., 1985, "Micromechanisms of Crack Propagation in Hybrid-Particulate Composites," Journal of Materials Science Letters, 4(10), pp. 1276-1279.
[60] Kinloch, A. J., Maxwell, D. L., and Young, R. J., 1985, "The Fracture of Hybrid-Particulate Composites," Journal of Materials Science, 20(11), pp. 4169-4184.
[61] Young, R. J., Maxwell, D. L., and Kinloch, A. J., 1986, "The Deformation of Hybrid-Particulate Composites," Journal of Materials Science, 21(2), pp. 380-388.
134
[62] Tse, M.-F., 1985, "Physical Properties of Barium Titanate-Filled Rubber-Modified Epoxies," Journal of Applied Polymer Science, 30(9), pp. 3625-3647.
[63] Moloney, A. C., Kausch, H. H., and Stieger, H. R., 1983, "The Fracture of Particulate-Filled Epoxide Resins," Journal of Materials Science, 18(1), pp. 208-216.
[64] Young, R. J., and Beaumont, P. W. R., 1975, "Failure of Brittle Polymers by Slow Crack Growth," Journal of Materials Science, 10(8), pp. 1343-1350.
[65] Norman, D. A., and Robertson, R. E., 2003, "Rigid-Particle Toughening of Glassy Polymers," Polymer, 44(8), pp. 2351-2362.
[66] Gadkaree, K. P., and Salee, G., 1983, "Fatigue Crack Propagation in Composites with Spherical Fillers - 1," Polymer Composites, 4(1), pp. 19-25.
[67] Griffiths, R., and Holloway, D., 1970, "The Fracture Energy of Some Epoxy Resin Materials," Journal of Materials Science, 5(4), pp. 302-307.
[68] Spanoudakis, J., and Young, R., 1984, "Crack Propagation in a Glass Particle-Filled Epoxy Resin," Journal of Materials Science, 19(2), pp. 473-486.
[69] Spanoudakis, J., and Young, R., 1984, "Crack Propagation in a Glass Particle-Filled Epoxy Resin," Journal of Materials Science, 19(2), pp. 487-496.
[70] Moloney, A. C., and Kausch, H. H., 1985, "Direct Observations of Fracture Mechanisms in Epoxide Resins," Journal of Materials Science Letters, 4(3), pp. 289-292.
[71] Evans, A. G., 1972, "The Strength of Brittle Materials Containing Second Phase Dispersions," Philosophical Magazine, 26(6), pp. 1327 - 1344.
[72] Moloney, A. C., Kausch, H. H., and Stieger, H. R., 1984, "The Fracture of Particulate-Filled Epoxide Resins," Journal of Materials Science, 19(4), pp. 1125-1130.
[73] Broutman, L. J., and Sahu, S., 1971, "The Effect of Interfacial Bonding on the Toughness of Glass Filled Polymers," Materials Science and Engineering, 8(2), pp. 98-107.
[74] Spanoudakis, J., and Young, R. J., 1984, "Crack Propagation in a Glass Particle-Filled Epoxy Resin," Journal of Materials Science, 19(2), pp. 487-496.
[75] Fu, S.-Y., Feng, X.-Q., Lauke, B., and Mai, Y.-W., 2008, "Effects of Particle Size, Particle/Matrix Interface Adhesion and Particle Loading on Mechanical Properties of Particulate-Polymer Composites," Composites Part B: Engineering, 39(6), pp. 933-961.
[76] Kelly, A., 1970, "Interface Effects and the Work of Fracture of a Vibrous Composite," Proceedings of the Royal Society of London. Series A, Mathematical and Physical Sciences, 319(1536), pp. 95-116.
[77] Spanoudakis, J., and Young, R. J., 1984, "Crack Propagation in a Glass Particle-Filled Epoxy Resin," Journal of Materials Science, 19(2), pp. 473-486.
[78] Yamini, S., and Young, R. J., 1980, "Mechanical Properties of Epoxy Resins Em Dash 1. Mechanisms of Plastic Deformation," Journal of Materials Science, 15(7), pp. 1814-1822.
135
[79] Pearson, R. A., and Yee, A. F., 1993, "Toughening Mechanisms in Thermoplastic-Modified Epoxies: 1. Modification Using Poly(Phenylene Oxide)," Polymer, 34(17), pp. 3658-3670.
[80] Evans, A. G., 1972, "The Strength of Brittle Materials Containing Second Phase Dispersions," Philosophical Magazine, 26(6), pp. 1327-1344.
[81] Lange, F. F., 1970, "The Interaction of a Crack Front with a Second-Phase Dispersion," Philosophical Magazine, 22(179), pp. 983-992.
[82] Rose, L. R. F., 1987, "Toughening Due to Crack-Front Interaction with a Second-Phase Dispersion," Mechanics of Materials, 6(1), pp. 11-15.
[83] Ahlquist, C. N., 1975, "On the Interaction of Cleavage Cracks with Second Phase Particles," Acta Metallurgica, 23(2), pp. 239-243.
[84] Faber, K. T., and Evans, A. G., 1983, "Crack Deflection Processes--I. Theory," Acta Metallurgica, 31(4), pp. 565-576.
[85] Faber, K. T., and Evans, A. G., 1983, "Crack Deflection Processes--Ii. Experiment," Acta Metallurgica, 31(4), pp. 577-584.
[86] Evans, A. G., Williams, S., and Beaumont, P. W. R., 1985, "On the Toughness of Particulate Filled Polymers," Journal of Materials Science, 20(10), pp. 3668-3674.
[87] Hutchinson, J. W., and Jensen, H. M., 1990, "Models of Fiber Debonding and Pullout in Brittle Composites with Friction," Mechanics of Materials, 9(2), pp. 139-163.
[88] Huang, Y., and Kinloch, A. J., 1992, "Modelling of the Toughening Mechanisms in Rubber-Modified Epoxy Polymers," Journal of Materials Science, 27(10), pp. 2763-2769.
[89] Johnsen, B. B., Kinloch, A. J., Mohammed, R. D., Taylor, A. C., and Sprenger, S., 2007, "Toughening Mechanisms of Nanoparticle-Modified Epoxy Polymers," Polymer, 48(2), pp. 530-541.
[90] Iijima, S., 1991, "Helical Microtubules of Graphitic Carbon," Nature, 354(6348), pp. 56.
[91] Hussain, F., Hojjati, M., Okamoto, M., and Gorga, R. E., 2006, "Review Article: Polymer-Matrix Nanocomposites, Processing, Manufacturing, and Application: An Overview," Journal of Composite Materials, 40(17), pp. 1511-1575.
[92] Yokozeki, T., Iwahori, Y., and Ishiwata, S., 2007, "Matrix Cracking Behaviors in Carbon Fiber/Epoxy Laminates Filled with Cup-Stacked Carbon Nanotubes (Cscnts)," Composites Part A: Applied Science and Manufacturing, 38(3), pp. 917-924.
[93] Yu, M.-F., Lourie, O., Dyer, M. J., Moloni, K., Kelly, T. F., and Ruoff, R. S., 2000, "Strength and Breaking Mechanism of Multiwalled Carbon Nanotubes under Tensile Load," Science, 287(5453), pp. 637-640.
[94] Coleman, J. N., Khan, U., Blau, W. J., and Gun'ko, Y. K., 2006, "Small but Strong: A Review of the Mechanical Properties of Carbon Nanotube-Polymer Composites," Carbon, 44(9), pp. 1624-1652.
136
[95] Zhao, Q., Wood, J. R., and Wagner, H. D., 2001, "Stress Fields around Defects and Fibers in a Polymer Using Carbon Nanotubes as Sensors," Applied Physics Letters, 78(12), pp. 1748-1750.
[96] Rana, S., Alagirusamy, R., and Joshi, M., 2009, "A Review on Carbon Epoxy Nanocomposites," Journal of Reinforced Plastics and Composites, 28(4), pp. 461-487.
[97] Naous, W., Yu, X.-Y., Zhang, Q.-X., Naito, K., and Kagawa, Y., 2006, "Morphology, Tensile Properties, and Fracture Toughness of Epoxy/Al2o3 Nanocomposites," Journal of Polymer Science Part B: Polymer Physics, 44(10), pp. 1466-1473.
[98] Kinloch, A., Mohammed, R., Taylor, A., Eger, C., Sprenger, S., and Egan, D., 2005, "The Effect of Silica Nano Particles and Rubber Particles on the Toughness of Multiphase Thermosetting Epoxy Polymers," Journal of Materials Science, 40(18), pp. 5083-5086.
[99] Fiedler, B., Gojny, F. H., Wichmann, M. H. G., Nolte, M. C. M., and Schulte, K., 2006, "Fundamental Aspects of Nano-Reinforced Composites," Composites Science and Technology, 66(16), pp. 3115-3125.
[100] Frankland, S. J. V., Caglar, A., Brenner, D. W., and Griebel, M., 2002, "Molecular Simulation of the Influence of Chemical Cross-Links on the Shear Strength of Carbon Nanotube-Polymer Interfaces," Journal of Physical Chemistry B, 106(12), pp. 3046-3048.
[101] Suhr, J., and Koratkar, N., 2008, "Energy Dissipation in Carbon Nanotube Composites: A Review," Journal of Materials Science, 43(13), pp. 4370-4382.
[102] Ma, P.-C., Siddiqui, N. A., Marom, G., and Kim, J.-K., "Dispersion and Functionalization of Carbon Nanotubes for Polymer-Based Nanocomposites: A Review," Composites Part A: Applied Science and Manufacturing, In Press, Accepted Manuscript(
[103] Hamming, L. M., Qiao, R., Messersmith, P. B., and Catherine Brinson, L., 2009, "Effects of Dispersion and Interfacial Modification on the Macroscale Properties of Tio2 Polymer-Matrix Nanocomposites," Composites Science and Technology, 69(11-12), pp. 1880-1886.
[104] Andrews, R., Jacques, D., Minot, M., and Rantell, T., 2002, "Fabrication of Carbon Multiwall Nanotube/Polymer Composites by Shear Mixing," Macromolecular Materials and Engineering, 287(6), pp. 395-403.
[105] Prashantha, K., Soulestin, J., Lacrampe, M. F., and Krawczak, P., 2009, "Present Status and Key Challenges of Carbon Nanotubes Reinforced Polyolefins: A Review on Nanocomposites Manufacturing and Performance Issues," Polymers and Polymer Composites, 17(4), pp. 205-245.
[106] Ausman, K. D., Piner, R., Lourie, O., Ruoff, R. S., and Korobov, M., 2000, "Organic Solvent Dispersions of Single-Walled Carbon Nanotubes: Toward Solutions of Pristine Nanotubes," Journal of Physical Chemistry B, 104(38), pp. 8911-8915.
[107] Gong, X., Liu, J., Baskaran, S., Voise, R. D., and Young, J. S., 2000, "Surfactant-Assisted Processing of Carbon Nanotube/Polymer Composites," Chemistry of Materials, 12(4), pp. 1049-1052.
[108] Paredes, J. I., and Burghard, M., 2004, "Dispersions of Individual Single-Walled Carbon Nanotubes of High Length," Langmuir, 20(12), pp. 5149-5152.
137
[109] Felten, A., Bittencourt, C., Pireaux, J. J., Van Lier, G., and Charlier, J. C., 2005, "Radio-Frequency Plasma Functionalization of Carbon Nanotubes Surface O2, Nh3, and Cf4 Treatments," Journal of Applied Physics, 98(7), pp. 1-9.
[110] Utegulov, Z. N., Mast, D. B., He, P., Shi, D., and Gilland, R. F., 2005, "Functionalization of Single-Walled Carbon Nanotubes Using Isotropic Plasma Treatment: Resonant Raman Spectroscopy Study," Journal of Applied Physics, 97(10), pp. 1-4.
[111] Riggs, J. E., Guo, Z., Carroll, D. L., and Sun, Y. P., 2000, "Strong Luminescence of Solubilized Carbon Nanotubes [2]," Journal of the American Chemical Society, 122(24), pp. 5879-5880.
[112] Star, A., Stoddart, J. F., Steuerman, D., Diehl, M., Boukai, A., Wong, E. W., Yang, X., Chung, S. W., Choi, H., and Heath, J. R., 2001, "Preparation and Properties of Polymer- Wrapped Single-Walled Carbon Nanotubes," Angewandte Chemie - International Edition, 40(9), pp. 1721-1725.
[113] Chen, R. J., Zhang, Y., Wang, D., and Dai, H., 2001, "Noncovalent Sidewall Functionalization of Single-Walled Carbon Nanotubes for Protein Immobilization [11]," Journal of the American Chemical Society, 123(16), pp. 3838-3839.
[114] Gojny, F. H., Wichmann, M. H. G., Kopke, U., Fiedler, B., and Schulte, K., 2004, "Carbon Nanotube-Reinforced Epoxy-Composites: Enhanced Stiffness and Fracture Toughness at Low Nanotube Content," Composites Science and Technology, 64(15), pp. 2363-2371.
[115] Fan, Z., Hsiao, K.-T., and Advani, S. G., 2004, "Experimental Investigation of Dispersion During Flow of Multi-Walled Carbon Nanotube/Polymer Suspension in Fibrous Porous Media," Carbon, 42(4), pp. 871-876.
[116] Mirjalili, V., and Hubert, P., 2009, "Effect of Carbon Nanotube Dispersion on the Fracture Toughness of Polymers," Proc. ICCM 17, Edinburgh.
[117] Ma, P.-C., Mo, S.-Y., Tang, B.-Z., and Kim, J.-K., 2010, "Dispersion, Interfacial Interaction and Re-Agglomeration of Functionalized Carbon Nanotubes in Epoxy Composites," Carbon, 48(6), pp. 1824-1834.
[118] Blanco, J., Garcia, E. J., Guzman De Villoria, R., and Wardle, B. L., 2009, "Limiting Mechanisms of Mode I Interlaminar Toughening of Composites Reinforced with Aligned Carbon Nanotubes," Journal of Composite Materials, 43(8), pp. 825-841.
[119] Liyong Tong, Xiannian Sun, and Ping Tan, 2008, "Effect of Long Multi-Walled Carbon Nanotubes on Delamination Toughness of Laminated Composites," Journal of Composite Materials, 42(1), pp. 5-23.
[120] Satapathy, B. K., Weidisch, R., Po?Tschke, P., and Janke, A., 2007, "Tough-to-Brittle Transition in Multiwalled Carbon Nanotube (Mwnt)/Polycarbonate Nanocomposites," Composites Science and Technology, 67(5), pp. 867-879.
[121] Satyanarayana, N., Rajan, K., Sinha, S., and Shen, L., 2007, "Carbon Nanotube Reinforced Polyimide Thin-Film for High Wear Durability," Tribology Letters, 27(2), pp. 181-188.
138
[122] Li, C., Thostenson, E. T., and Chou, T.-W., 2008, "Sensors and Actuators Based on Carbon Nanotubes and Their Composites: A Review," Composites Science and Technology, 68(6), pp. 1227-1249.
[123] Godara, A., Mezzo, L., Luizi, F., Warrier, A., Lomov, S. V., Van Vuure, A. W., Gorbatikh, L., Moldenaers, P., and Verpoest, I., 2009, "Influence of Carbon Nanotube Reinforcement on the Processing and the Mechanical Behaviour of Carbon Fiber/Epoxy Composites," Carbon, 47(12), pp. 2914-2923.
[124] Hubert, P., Ashrafi, B., Adhikari, K., Meredith, J., Vengallatore, S., Guan, J., and Simard, B., 2009, "Synthesis and Characterization of Carbon Nanotube-Reinforced Epoxy: Correlation between Viscosity and Elastic Modulus," Composites Science and Technology, 69(14), pp. 2274-2280.
[125] Haggenmueller, R., Gommans, H. H., Rinzler, A. G., Fischer, J. E., and Winey, K. I., 2000, "Aligned Single-Wall Carbon Nanotubes in Composites by Melt Processing Methods," Chemical Physics Letters, 330(3-4), pp. 219-225.
[126] Ramanathan, T., Liu, H., and Brinson, L. C., 2005, "Functionalized Swnt/Polymer Nanocomposites for Dramatic Property Improvement," Journal of Polymer Science, Part B: Polymer Physics, 43(17), pp. 2269-2279.
[127] Tjong, S. C., 2006, "Structural and Mechanical Properties of Polymer Nanocomposites," Materials Science and Engineering: R: Reports, 53(3-4), pp. 73-197.
[128] Krishnamoorti, R., 2007, "Strategies for Dispersing Nanoparticles in Polymers," MRS Bulletin, 32(4), pp. 341-347.
[129] Balazs, A. C., Emrick, T., and Russell, T. P., 2006, "Nanoparticle Polymer Composites: Where Two Small Worlds Meet," Science, 314(5802), pp. 1107-1110.
[130] Schadler, L. S., Kumar, S. K., Benicewicz, B. C., Lewis, S. L., and Harton, S. E., 2007, "Designed Interfaces in Polymer Nanocomposites: A Fundamental Viewpoint," MRS Bulletin, 32(4), pp. 335-340.
[131] Eitan, A., Fisher, F. T., Andrews, R., Brinson, L. C., and Schadler, L. S., 2006, "Reinforcement Mechanisms in Mwcnt-Filled Polycarbonate," Composites Science and Technology, 66(9), pp. 1162-1173.
[132] Smith, N. A., Antoun, G. G., Ellis, A. B., and Crone, W. C., 2004, "Improved Adhesion between Nickel-Titanium Shape Memory Alloy and a Polymer Matrix Via Silane Coupling Agents," Composites Part A: Applied Science and Manufacturing, 35(11), pp. 1307-1312.
[133] Pukanszky, B., 2005, "Interfaces and Interphases in Multicomponent Materials: Past, Present, Future," European Polymer Journal, 41(4), pp. 645-662.
[134] Rong, M. Z., Zhang, M. Q., and Ruan, W. H., 2006, "Surface Modification of Nanoscale Fillers for Improving Properties of Polymer Nanocomposites: A Review," Materials Science and Technology, 22(pp. 787-796.
[135] Qian, H., Greenhalgh, E. S., Shaffer, M. S. P., and Bismarck, A., 2010, "Carbon Nanotube-Based Hierarchical Composites: A Review," Journal of Materials Chemistry, 20(23), pp. 4751-4762.
139
[136] Hussain, M., Nakahira, A., and Niihara, K., 1996, "Mechanical Property Improvement of Carbon Fiber Reinforced Epoxy Composites by Al2o3 Filler Dispersion," Materials Letters, 26(3), pp. 185-191.
[137] Chou, T.-W., Gao, L., Thostenson, E. T., Zhang, Z., and Byun, J.-H., 2010, "An Assessment of the Science and Technology of Carbon Nanotube-Based Fibers and Composites," Composites Science and Technology, 70(1), pp. 1-19.
[138] Wicks, S. S., De Villoria, R. G., and Wardle, B. L., 2009, "Interlaminar and Intralaminar Reinforcement of Composite Laminates with Aligned Carbon Nanotubes," Composites Science and Technology, 70(1), pp. 20-28.
[139] Zhang, W., Sakalkar, V., and Koratkar, N., 2007, "In Situ Health Monitoring and Repair in Composites Using Carbon Nanotube Additives," Applied Physics Letters, 91(13), pp. 133102-3.
[140] Sadeghian, R., Gangireddy, S., Minaie, B., and Hsiao, K.-T., 2006, "Manufacturing Carbon Nanofibers Toughened Polyester/Glass Fiber Composites Using Vacuum Assisted Resin Transfer Molding for Enhancing the Mode-I Delamination Resistance," Composites Part A: Applied Science and Manufacturing, 37(10), pp. 1787-1795.
[141] Gojny, F. H., Wichmann, M. H. G., Fiedler, B., Bauhofer, W., and Schulte, K., 2005, "Influence of Nano-Modification on the Mechanical and Electrical Properties of Conventional Fibre-Reinforced Composites," Composites Part A: Applied Science and Manufacturing, 36(11), pp. 1525-1535.
[142] Kinloch, I. A., Roberts, S. A., and Windle, A. H., 2002, "A Rheological Study of Concentrated Aqueous Nanotube Dispersions," Polymer, 43(26), pp. 7483-7491.
[143] Wicks, S. S., De Villoria, R. G., and Wardle, B. L., "Interlaminar and Intralaminar Reinforcement of Composite Laminates with Aligned Carbon Nanotubes," Composites Science and Technology, 70(1), pp. 20-28.
[144] Liyong Tong, Xiannian Sun, and Ping Tan, 2008, "Effect of Long Multi-Walled Carbon Nanotubes on Delamination Toughness of Laminated Composites," Journal of Composite Materials, pp. 5-23.
[145] Guz, I. A., Rodger, A. A., Guz, A. N., and Rushchitsky, J. J., 2008, "Predicting the Properties of Micro- and Nanocomposites: From the Microwhiskers to the Bristled Nano-Centipedes," Philosophical Transactions of the Royal Society A: Mathematical, Physical and Engineering Sciences, 366(1871), pp. 1827-1833.
[146] Wichmann, M. H. G., Sumfleth, J., Gojny, F. H., Quaresimin, M., Fiedler, B., and Schulte, K., 2006, "Glass-Fibre-Reinforced Composites with Enhanced Mechanical and Electrical Properties - Benefits and Limitations of a Nanoparticle Modified Matrix," Engineering Fracture Mechanics, 73(16), pp. 2346-2359.
[147] Karapappas, P., Vavouliotis, A., Tsotra, P., Kostopoulos, V., and Paipetis, A., 2009, "Enhanced Fracture Properties of Carbon Reinforced Composites by the Addition of Multi-Wall Carbon Nanotubes," Journal of Composite Materials, pp. 977-985.
140
[148] Yokozeki, T., Iwahori, Y., Ishiwata, S., and Enomoto, K., 2007, "Mechanical Properties of Cfrp Laminates Manufactured from Unidirectional Prepregs Using Cscnt-Dispersed Epoxy," Composites Part A: Applied Science and Manufacturing, 38(10), pp. 2121-2130.
[149] Kinloch, A. J., Lee, J. H., Taylor, A. C., Sprenger, S., Eger, C., and Egan, D., 2003, "Toughening Structural Adhesives Via Nano- and Micro-Phase Inclusions," The Journal of Adhesion, 79(8), pp. 867-873.
[150] Ashrafi, B., and Hubert, P., 2006, "Modeling the Elastic Properties of Carbon Nanotube Array/Polymer Composites," Composites Science and Technology, 66(3-4), pp. 387-396.
[151] Saxena, A., 1998, Nonlinear Fracture Mechanics for Engineers CRC Press.
[152] Anderson, T. L., 1994, Fracture Mechanics: Fundamentals and Applications, CRC Press, Florida.
[153] Barber, A. H., Cohen, S. R., and Wagner, H. D., 2003, "Measurement of Carbon Nanotube-Polymer Interfacial Strength," Applied Physics Letters, 82(23), pp. 4140-4142.
[154] Guo, T., Nikolaev, P., Thess, A., Colbert, D. T., and Smalley, R. E., 1995, "Catalytic Growth of Single-Walled Manotubes by Laser Vaporization," Chemical Physics Letters, 243(1-2), pp. 49-54.
[155] Ren, Z. F., Huang, Z. P., Xu, J. W., Wang, J. H., Bush, P., Siegal, M. P., and Provencio, P. N., 1998, "Synthesis of Large Arrays of Well-Aligned Carbon Nanotubes on Glass," Science, 282(5391), pp. 1105-1107.
[156] Nanoledge, 2010, "Processing Methods for A1d1 Bisphenol a Epoxy Resin Filled with Carbon Nanotubes."
[157] Huntsman, C., 2003, Araldite® My0510 Material Data Sheet.
[158] Astm, 2007, "Astm D5045 - 99: Standard Test Methods for Plane-Strain Fracture Toughness and Strain Energy Release Rate of Plastic Materials."
[159] Qiu, J., and Wang, S., "Reaction Kinetics of Functionalized Carbon Nanotubes Reinforced Polymer Composites," Materials Chemistry and Physics, 121(1-2), pp. 295-301.
[160] Xie, H., Liu, B., Yuan, Z., Shen, J., and Cheng, R., 2004, "Cure Kinetics of Carbon Nanotube/Tetrafunctional Epoxy Nanocomposites by Isothermal Differential Scanning Calorimetry," Journal of Polymer Science Part B: Polymer Physics, 42(20), pp. 3701-3712.
[161] Kingston, C. T., Jakubek, Z. J., Denommee, S., and Simard, B., 2004, "Efficient Laser Synthesis of Single-Walled Carbon Nanotubes through Laser Heating of the Condensing Vaporization Plume," Carbon, 42(8-9), pp. 1657-1664.
[162] Bayer, M., 2006, Baytubes Development Product C150 P.
[163] Astm, 2007, "Astm D5528 - 01 Standard Test Method for Mode I Interlaminar Fracture Toughness of Unidirectional Fiber-Reinforced Polymer Matrix Composites."
[164] Romhany, G., and Szebanyi, G., 2009, "Interlaminar Crack Propagation in Mwcnt/Fiber Reinforced Hybrid Composites," Express Polymer Letters, 3(3), pp. 145-151.
141
[165] Jordan, W. M., and Bradley, W. L., 1988, "The Relationship between Resin Mechanical Properties and Mode I Delamination Fracture Toughness," Journal of Materials Science Letters, 7(12), pp. 1362-1364.
[166] Siddiqui, N. A., Woo, R. S. C., Kim, J.-K., Leung, C. C. K., and Munir, A., 2007, "Mode I Interlaminar Fracture Behavior and Mechanical Properties of Cfrps with Nanoclay-Filled Epoxy Matrix," Composites Part A: Applied Science and Manufacturing, 38(2), pp. 449-460.
[167] Bradley, W. L., and Cohen, R. N., 1985, "Matrix Deformation and Fracture in Graphite-Reinforced Epoxies," Proc. ASTM Special Technical Publication, W. S. Johnson, ed. Pittsburgh, PA, USA, pp. 389-410.
[168] Compston, P., Jar, P. Y. B., and Takahashi, K., 2000, "The Use of Crack Opening Displacement Rate to Assess Matrix-to-Composite Mode I Toughness Transfer," Journal of Materials Science Letters, 19(1), pp. 17-19.
[169] Compston, P., Jar, P. Y. B., Burchill, P. J., and Takahashi, K., 2002, "The Transfer of Matrix Toughness to Composite Mode I Interlaminar Fracture Toughness in Glass-Fibre/Vinyl Ester Composites," Applied Composite Materials, 9(5), pp. 291-314.
[170] Karger-Kocsis, J., 2001, "Stick-Slip Type Crack Growth During Instrumented High-Speed Impact of Hdpe and Hdpe/Selar Discontinuous Laminar Microlayer Composites," Journal of Macromolecular Science, Part B: Physics, 40(3), pp. 343 - 353.
[171] Webb, T. W., and Aifantis, E. C., "Crack Growth Resistance Curves and Stick-Slip Fracture Instabilities," Mechanics Research Communications, 24(2), pp. 123-130.
[172] Tugrul Seyhan, A., Tanoglu, M., and Schulte, K., 2008, "Mode I and Mode Ii Fracture Toughness of E-Glass Non-Crimp Fabric/Carbon Nanotube (Cnt) Modified Polymer Based Composites," Engineering Fracture Mechanics, 75(18), pp. 5151-5162.
[173] Cowley, K. D., and Beaumont, P. W. R., 1997, "The Interlaminar and Intralaminar Fracture Toughness of Carbon-Fibre/Polymer Composites: The Effect of Temperature," Composites Science and Technology, 57(11), pp. 1433-1444.
[174] Russell, A. J., 1987, "Micromechanisms of Interlaminar Fracture and Fatigue," Polymer Composites, 8(5), pp. 342-351.
[175] Kim, H. S., and Ma, P., 1998, "Mode Ii Fracture Mechanisms of Pbt-Modified Brittle Epoxies," Journal of Applied Polymer Science, 69(2), pp. 405-415.
[176] Lee, S., 1997, "Mode Ii Delamination Failure Mechanisms of Polymer Matrix Composites," Journal of Materials Science, 32(5), pp. 1287-1295.
[177] Davidson, B. D., and Sun, X., 2006, "Geometry and Data Reductions for a Standardized End Notched Flexure Test for Unidirectional Composites," Journal of ASTM International, 3(9).
142
Appendix A
The Matlab code for image analysis is presented in Appendix A. 1. In Appendix A. 2. the
results of dispersion quantification curves are given for all the formulations used in
Chapter 4.
A. 1. Matlab code for image analysis
p = which('N_01.JPG'); filelist = dir([fileparts(p) filesep 'N_**.JPG']); fileNames = filelistname'; loop=size(fileNames); fprintf('\n') fprintf('This program quantifies the dispersion degradation. Please enter
information about the cure cycle.\n\n') start_temp = input('Please input initial temperature in degree C: '); end_temp = input('Please input final temperature in degree C: '); ramp_rate = input('Please input ramp rate in degree C/min: '); image_interval = input('Please input imaging interval in seconds: ');
time(1) = 0; temp(1)= start_temp;
for j= 1:(loop(1)-1) time(j+1)=time(j)+image_interval; if temp(j)>= end_temp; temp(j+1)= end_temp; else temp(j+1)= temp(j)+ (ramp_rate)*image_interval/60; if temp(j+1)>= end_temp; temp(j+1)= end_temp; else temp(j+1); end end %if end