23
Asphalt Institute DSR-PAV TF Outcomes & Recommendation June 18, 2019 Pavel Kriz (Imperial Oil/ExxonMobil) Gerry Reinke (Mathy) Mike Anderson (Asphalt Institute)
Asphalt Institute DSR-PAV TFOutcomes & Recommendation
June 18, 2019
Pavel Kriz (Imperial Oil/ExxonMobil)
Gerry Reinke (Mathy)
Mike Anderson (Asphalt Institute)
Background & Case for Action
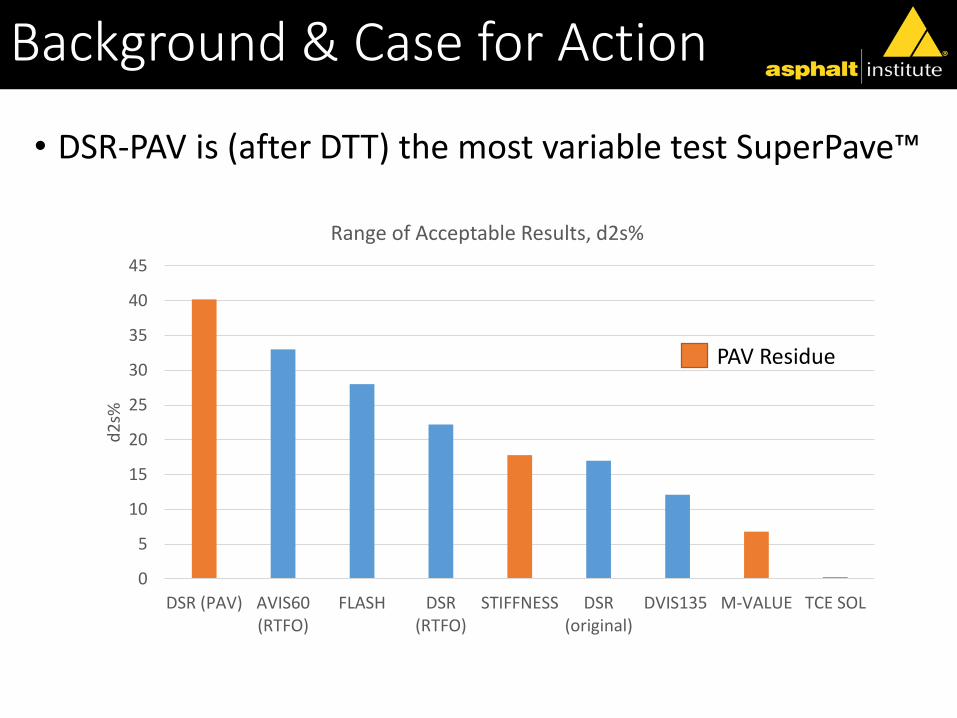
• DSR-PAV is (after DTT) the most variable test SuperPave™
0
5
10
15
20
25
30
35
40
45
DSR (PAV) AVIS60(RTFO)
FLASH DSR(RTFO)
STIFFNESS DSR(original)
DVIS135 M-VALUE TCE SOL
d2
s%
Range of Acceptable Results, d2s%
PAV Residue
Background & Case for Action
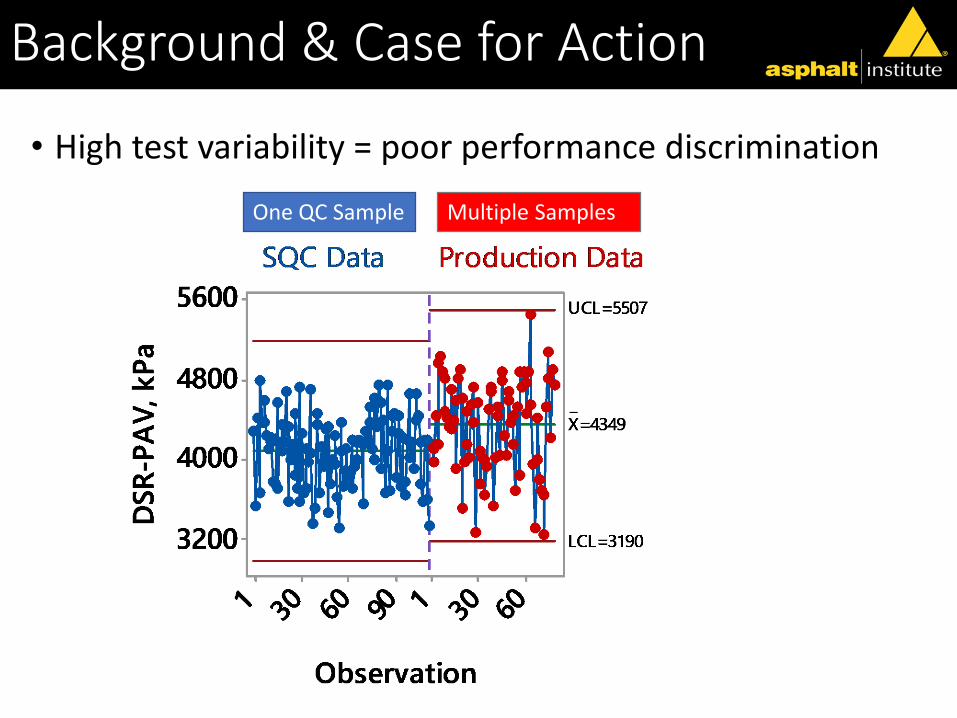
• High test variability = poor performance discrimination
Multiple SamplesOne QC Sample
Background & Case for Action
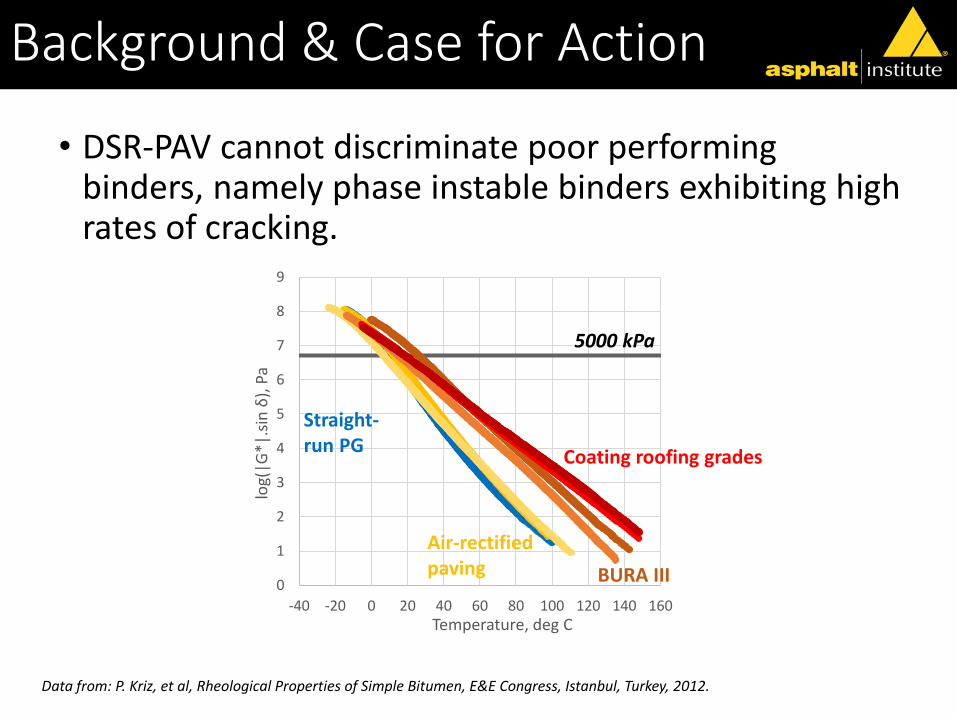
• DSR-PAV cannot discriminate poor performing binders, namely phase instable binders exhibiting high rates of cracking.
0
1
2
3
4
5
6
7
8
9
-40 -20 0 20 40 60 80 100 120 140 160
log(
|G*|
.sin
δ),
Pa
Temperature, deg C
Coating roofing grades
BURA III
Air-rectified paving
Straight-run PG
5000 kPa
Data from: P. Kriz, et al, Rheological Properties of Simple Bitumen, E&E Congress, Istanbul, Turkey, 2012.
TF Objectives
1. Modify T315 test protocol to reduce the test variability to acceptable level
2. Review scientific validity of DSR-PAV parameter |G*|sin δ to assess binder performance
3. Review ability of DSR-PAV test to discriminate poor performers
TF Approaches
1. Two round robins conducted• Stage 1 – thermal equilibrium time
• Stage 2 – optimal plate size & strain level
2. |G*|sin δ was analyzed for scientific validity
3. Ability of DSR-PAV parameter to discriminate poor performers was tested on 40 binders covering wide range of properties & compositions
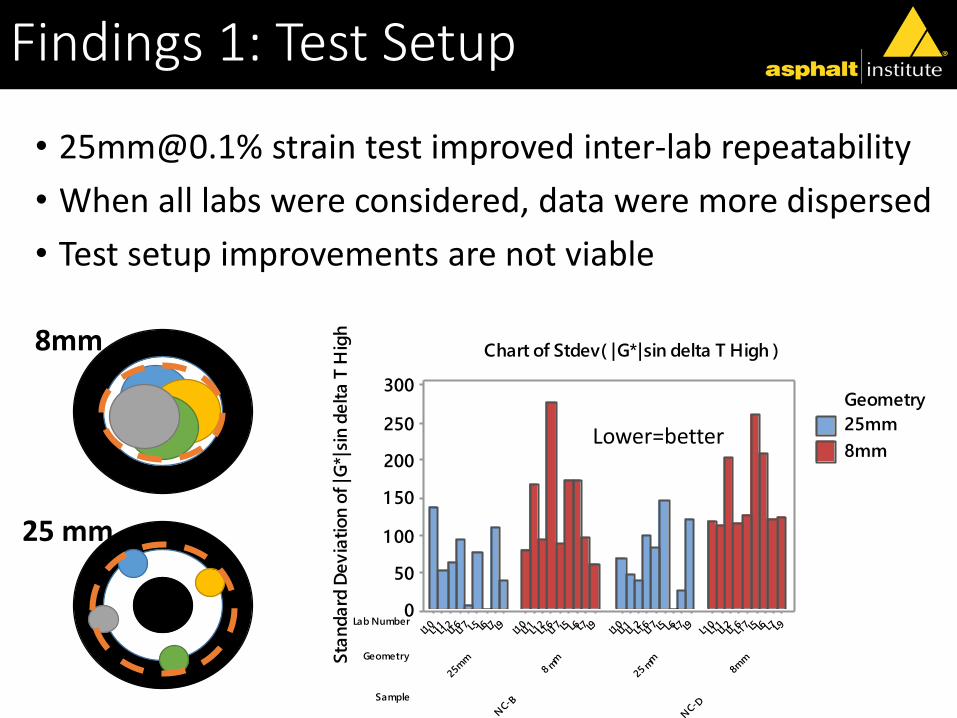
Findings 1: Test Setup
• [email protected]% strain test improved inter-lab repeatability
• When all labs were considered, data were more dispersed
• Test setup improvements are not viable
Sample
Geometry
Lab Number
NC-
DN
C-B
8mm
25mm
8 mm
25m
m
L9L7L6L5L17
L16
L12
L11
L10L9L7L6L5L1
7L1
6L1
2L1
1L1
0L9L7L6L5L17
L16
L12
L11
L10L9L7L6L5L1
7L1
6L1
2L1
1L1
0
300
250
200
1 50
1 00
50
0
Sta
nd
ard
De
via
tio
n o
f |G
*|si
n d
elt
a T
Hig
h
25mm
8mm
Geometry
Chart of Stdev( |G*|sin delta T High )
25 mm
8mm
Lower=better
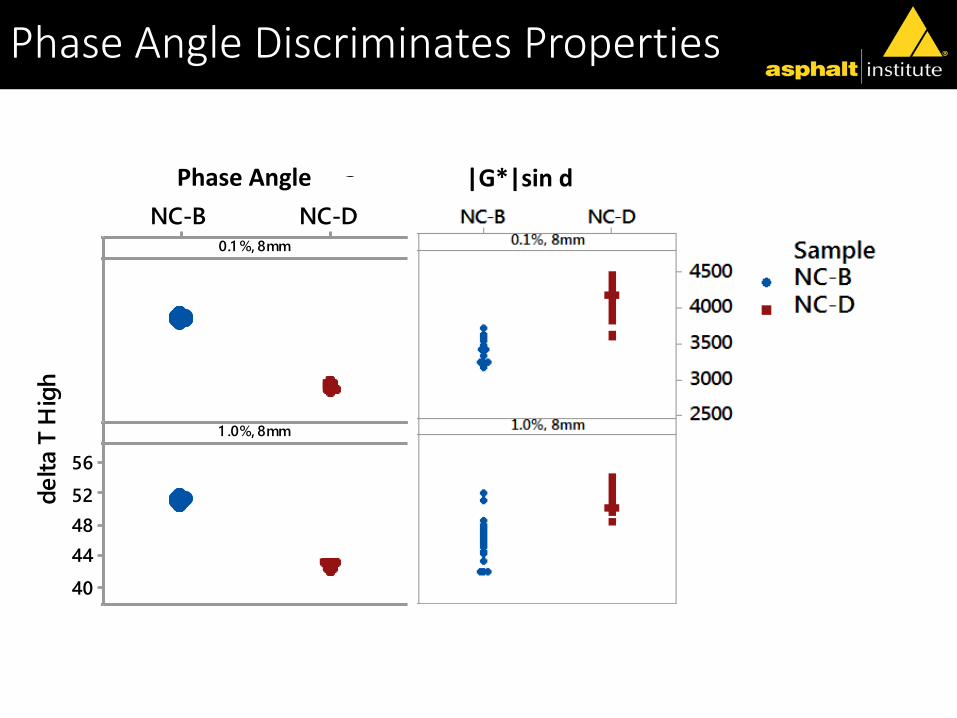
Phase Angle Discriminates Properties
NC-DNC-B
56
52
48
44
40
NC-DNC-B
56
52
48
44
40
0.1 %, 25mm
Sample
de
lta
T H
igh
0.1 %, 8mm
1 .0%, 25mm 1 .0%, 8mm
NC-B
NC-D
Sample
Individual Value Plot of delta T High
Panel variables: Strain, Geometry
NC-DNC-B
56
52
48
44
40
NC-DNC-B
56
52
48
44
40
0.1 %, 25mm
Sample
de
lta
T H
igh
0.1 %, 8mm
1 .0%, 25mm 1 .0%, 8mm
NC-B
NC-D
Sample
Individual Value Plot of delta T High
Panel variables: Strain, Geometry
Phase Angle |G*|sin d
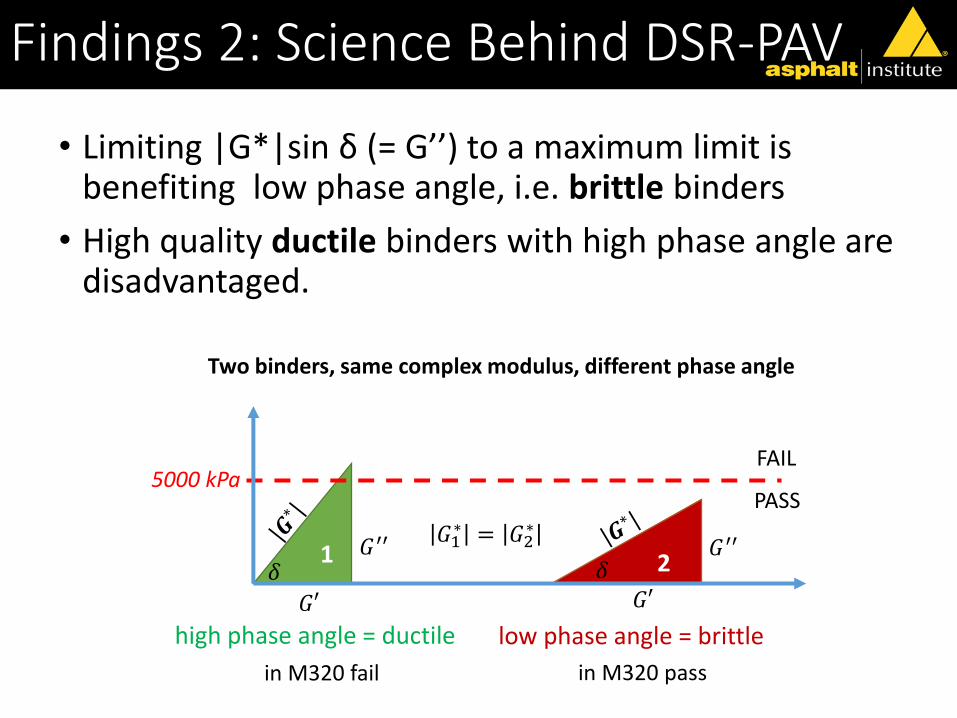
Findings 2: Science Behind DSR-PAV
• Limiting |G*|sin δ (= G’’) to a maximum limit is benefiting low phase angle, i.e. brittle binders
• High quality ductile binders with high phase angle are disadvantaged.
1 2
low phase angle = brittlehigh phase angle = ductile
𝐺1∗ = 𝐺2
∗𝐺′′ 𝐺′′
𝐺′ 𝐺′
5000 kPa
Two binders, same complex modulus, different phase angle
PASS
FAIL
in M320 fail in M320 pass
𝛿 𝛿
Findings 3: DSR-PAV vs. Binder Performance
• Phase instability is demonstrated in more negative delta Tc, higher aging index & lower phase angle
• These parameters are directly correlated to performance as they represent aging & relaxation rates; critical parameters when cracking is considered
• |G*|sin δ parameter was found not to correlate with any of these parameters, in contrary all samples passed |G*|sin δ limit of 5000 kPa
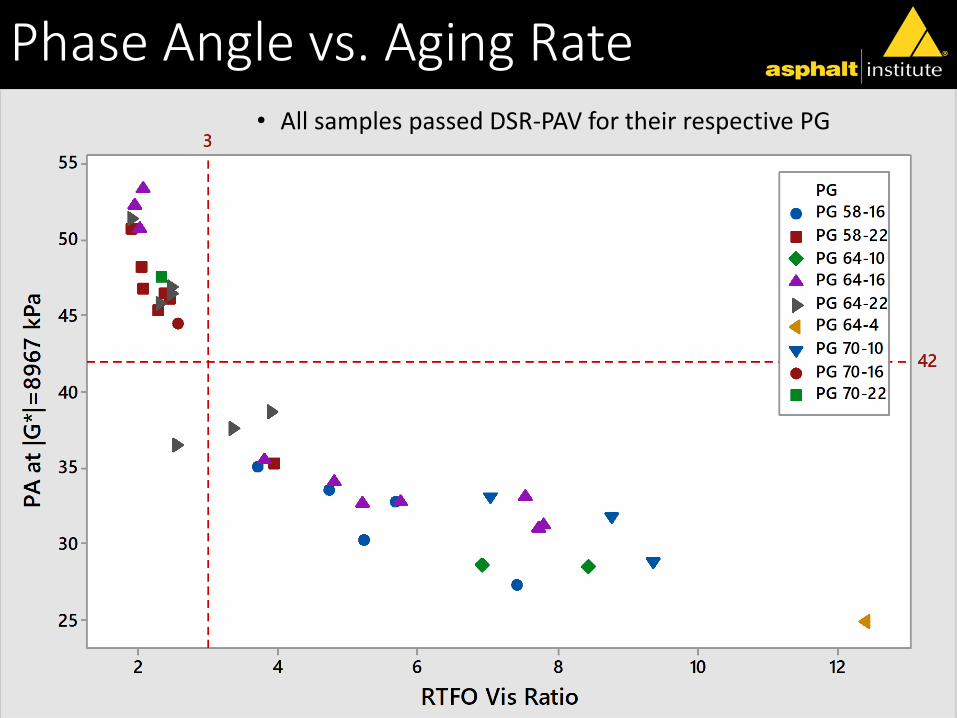
Phase Angle vs. Aging Rate• All samples passed DSR-PAV for their respective PG
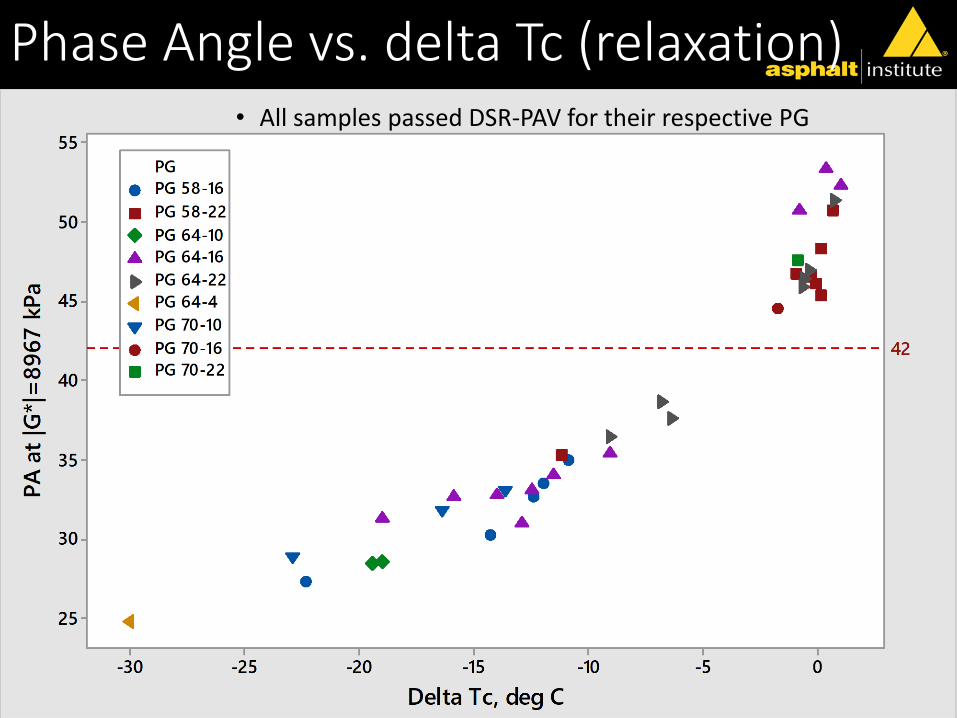
Phase Angle vs. delta Tc (relaxation)• All samples passed DSR-PAV for their respective PG
DSR-PAV TF Recommendations
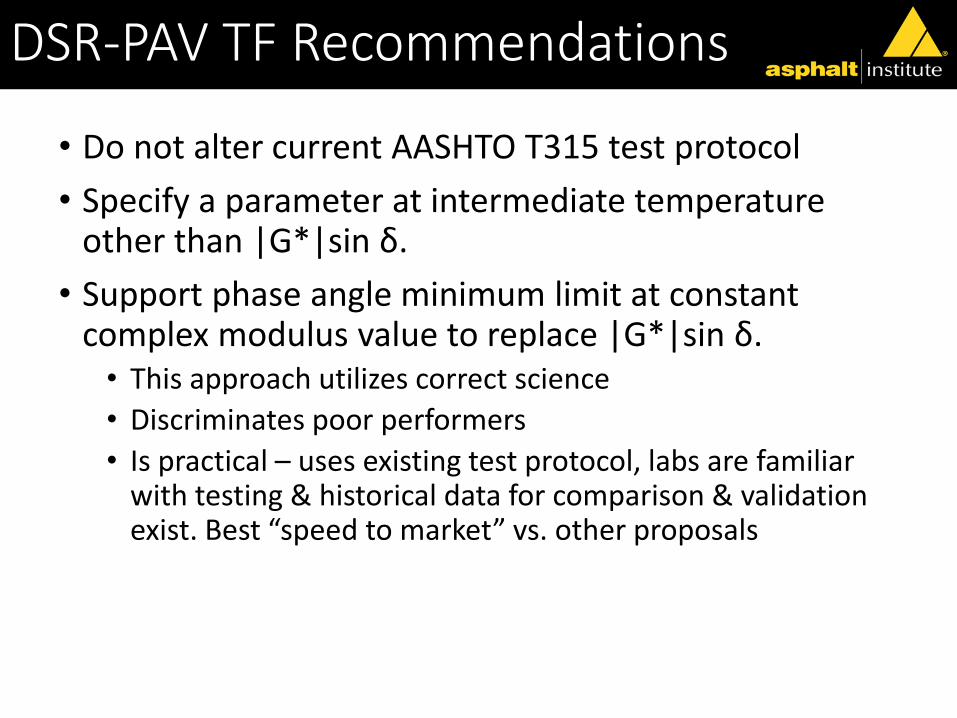
• Do not alter current AASHTO T315 test protocol
• Specify a parameter at intermediate temperature other than |G*|sin δ.
• Support phase angle minimum limit at constant complex modulus value to replace |G*|sin δ. • This approach utilizes correct science
• Discriminates poor performers
• Is practical – uses existing test protocol, labs are familiar with testing & historical data for comparison & validation exist. Best “speed to market” vs. other proposals
AI TAC Recommendation
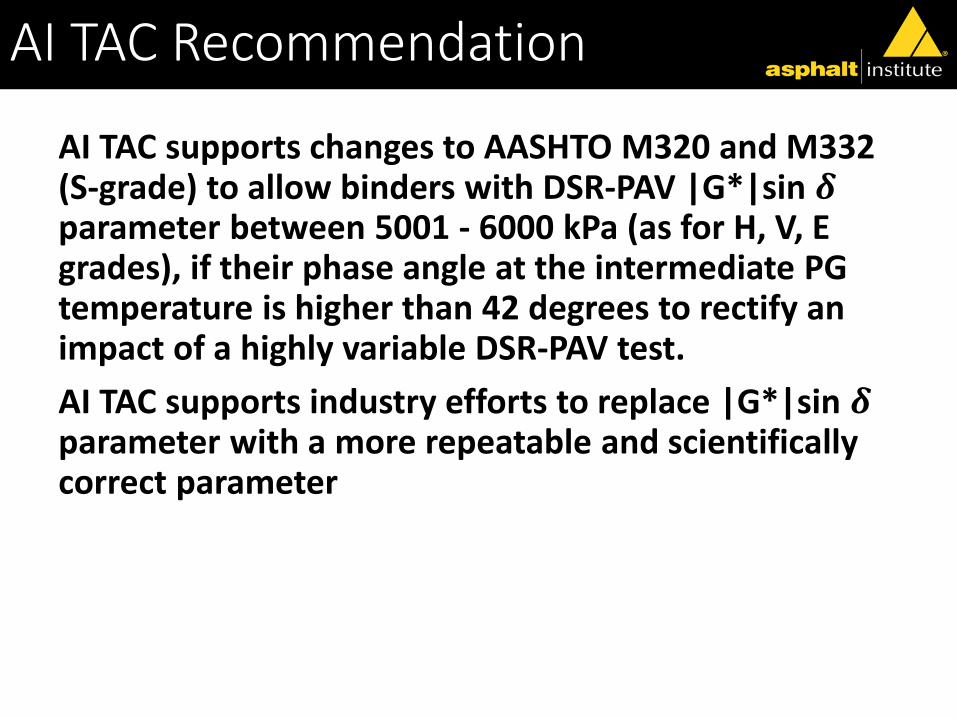
AI TAC supports changes to AASHTO M320 and M332 (S-grade) to allow binders with DSR-PAV |G*|sin 𝜹parameter between 5001 - 6000 kPa (as for H, V, E grades), if their phase angle at the intermediate PG temperature is higher than 42 degrees to rectify an impact of a highly variable DSR-PAV test.
AI TAC supports industry efforts to replace |G*|sin 𝜹parameter with a more repeatable and scientifically correct parameter

Appendix

Supporting Data Objective 1
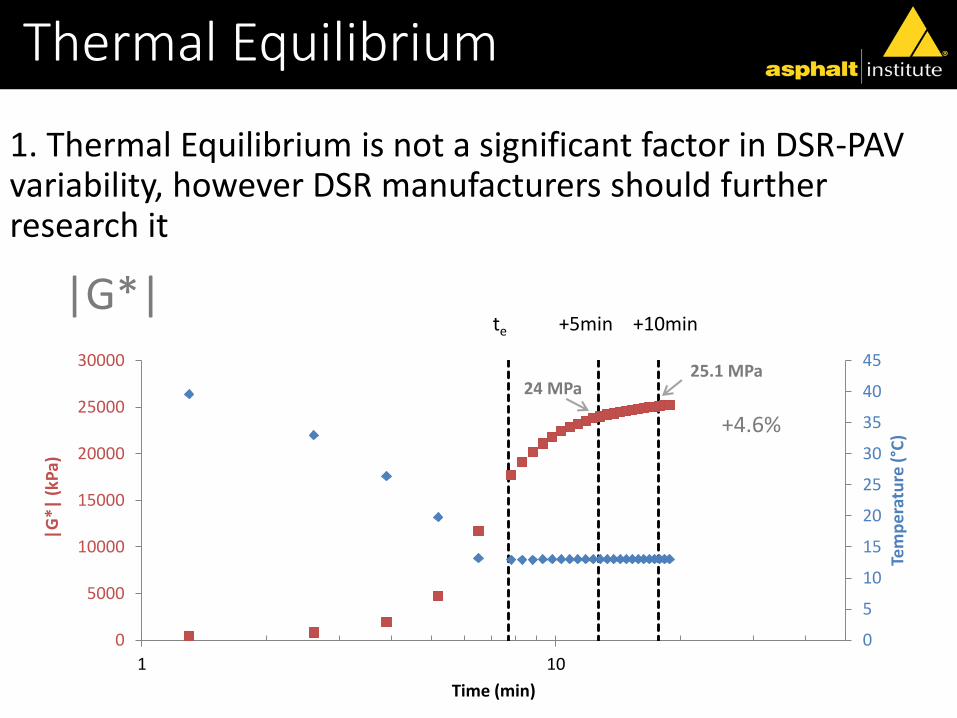
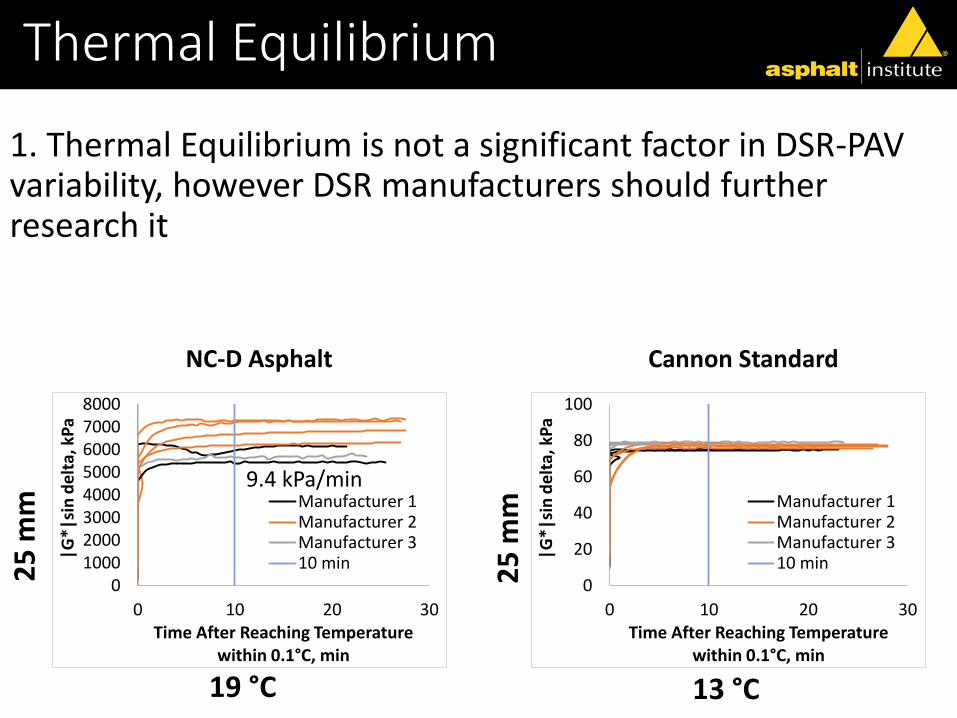
1. Thermal Equilibrium is not a significant factor in DSR-PAV variability, however DSR manufacturers should further research it
Thermal Equilibrium
0
5
10
15
20
25
30
35
40
45
0
5000
10000
15000
20000
25000
30000
1 10
Tem
pe
ratu
re (
°C)
|G*|
(kP
a)
Time (min)
te +5min +10min
24 MPa25.1 MPa
+4.6%
|G*|
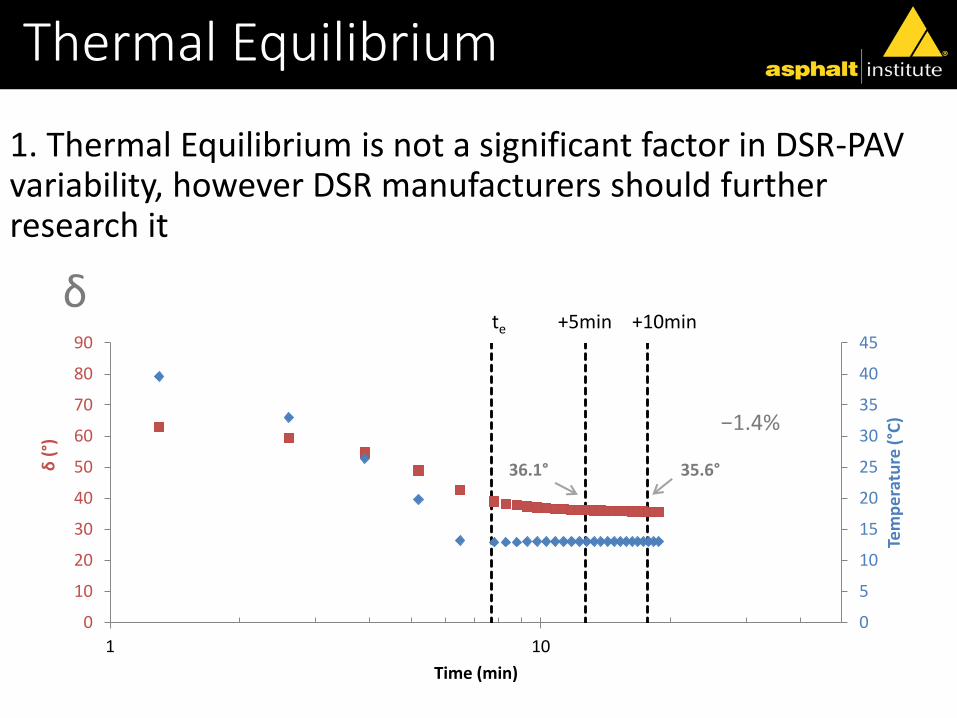
1. Thermal Equilibrium is not a significant factor in DSR-PAV variability, however DSR manufacturers should further research it
Thermal Equilibrium
0
5
10
15
20
25
30
35
40
45
0
10
20
30
40
50
60
70
80
90
1 10
Tem
pe
ratu
re (
°C)
δ(°
)
Time (min)
te +5min +10min
36.1° 35.6°
−1.4%
δ
1. Thermal Equilibrium is not a significant factor in DSR-PAV variability, however DSR manufacturers should further research it
Thermal Equilibrium2
5 m
m
19 °C
010002000300040005000600070008000
0 10 20 30
|G*|
sin
de
lta,
kP
a
Time After Reaching Temperature within 0.1°C, min
Manufacturer 1Manufacturer 2Manufacturer 310 min
9.4 kPa/min
0
20
40
60
80
100
0 10 20 30
|G*|
sin
de
lta,
kP
a
Time After Reaching Temperature within 0.1°C, min
Manufacturer 1Manufacturer 2Manufacturer 310 min2
5 m
m
13 °C
NC-D Asphalt Cannon Standard

Supporting Data Objective 2
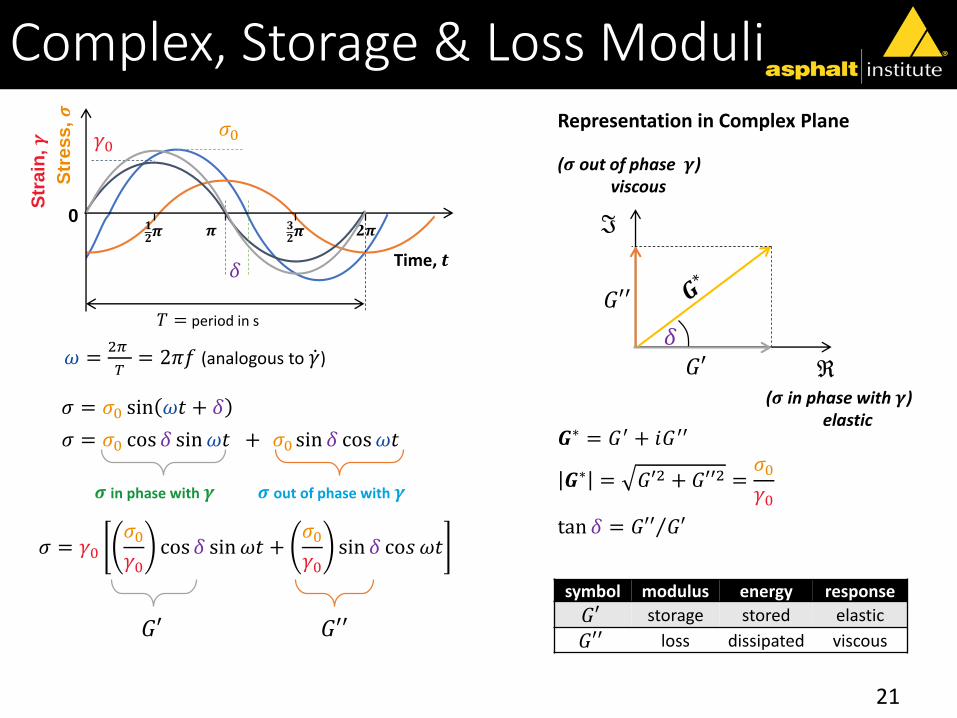
Complex, Storage & Loss Moduli
21
0
Str
ain
, 𝜸
𝝅 𝟐𝝅𝟑𝟐𝝅𝟏
𝟐𝝅
Str
es
s, 𝝈
𝜎 = 𝜎0 sin 𝜔𝑡 + 𝛿
𝛿
𝜎0𝛾0
𝑇 = period in s
Time, 𝒕
𝜔 =2𝜋
𝑇= 2𝜋𝑓 (analogous to 𝛾)
ℜ
ℑ
𝛿
𝐺′′
𝐺′
symbol modulus energy response
𝐺′ storage stored elastic
𝐺′′ loss dissipated viscous
(𝝈 in phase with 𝜸)elastic
(𝝈 out of phase 𝜸)viscous
𝑮∗ = 𝐺′ + 𝑖𝐺′′
𝑮∗ = 𝐺′2 + 𝐺′′2 =𝜎0𝛾0
tan 𝛿 = 𝐺′′ 𝐺′
𝜎 = 𝜎0 cos 𝛿 sin𝜔𝑡 + 𝜎0 sin 𝛿 cos𝜔𝑡
𝝈 in phase with 𝜸 𝝈 out of phase with 𝜸
𝜎 = 𝛾0𝜎0𝛾0
cos 𝛿 sin𝜔𝑡 +𝜎0𝛾0
sin 𝛿 co𝑠 𝜔𝑡
𝐺′ 𝐺′′
Representation in Complex Plane
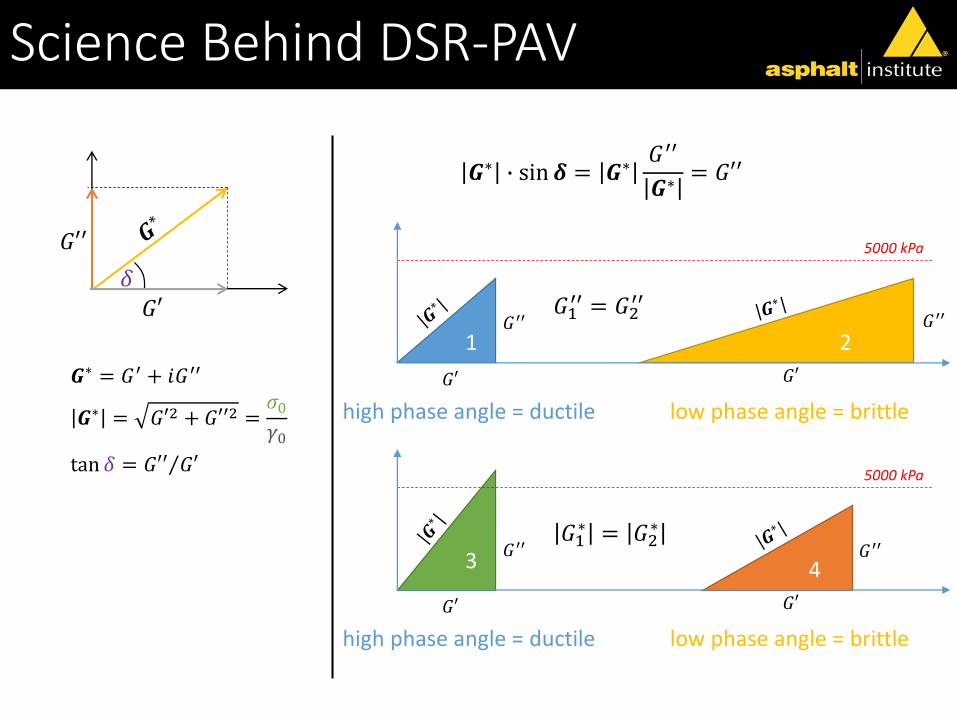
Science Behind DSR-PAV
𝛿
𝐺′′
𝐺′
𝑮∗ = 𝐺′ + 𝑖𝐺′′
𝑮∗ = 𝐺′2 + 𝐺′′2 =𝜎0𝛾0
tan 𝛿 = 𝐺′′ 𝐺′
𝑮∗ ∙ sin 𝜹 = 𝑮∗𝐺′′
𝑮∗ = 𝐺′′
1 2
low phase angle = brittlehigh phase angle = ductile
𝐺1′′ = 𝐺2
′′
𝐺′′ 𝐺′′
𝐺′ 𝐺′
5000 kPa
3 4
low phase angle = brittlehigh phase angle = ductile
𝐺1∗ = 𝐺2
∗
𝐺′′ 𝐺′′
𝐺′ 𝐺′
5000 kPa
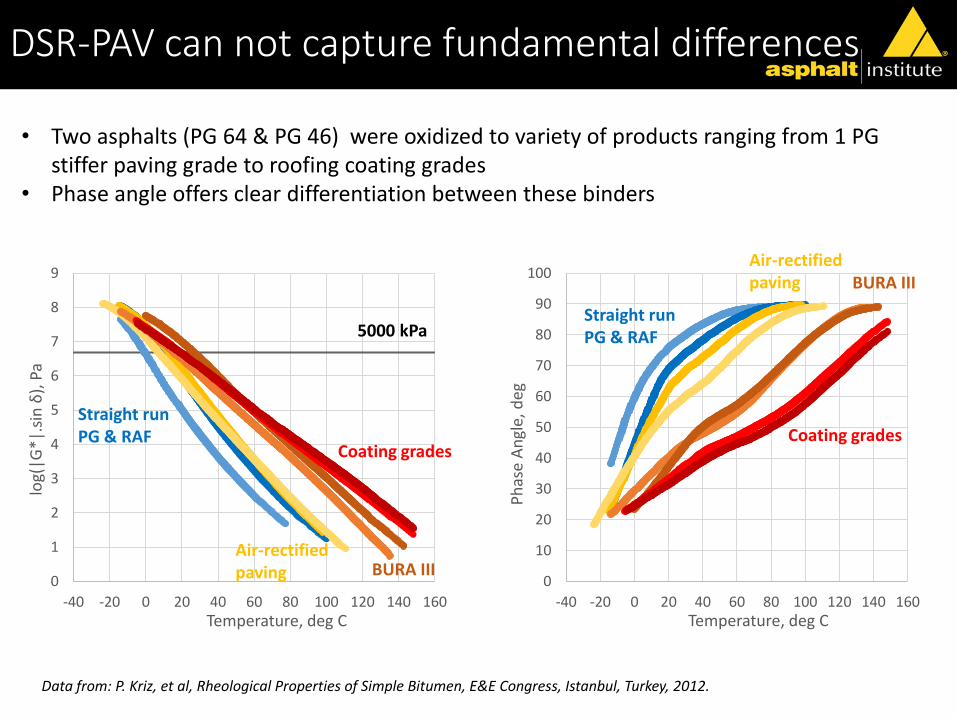
DSR-PAV can not capture fundamental differences
0
1
2
3
4
5
6
7
8
9
-40 -20 0 20 40 60 80 100 120 140 160
log(
|G*|
.sin
δ),
Pa
Temperature, deg C
0
10
20
30
40
50
60
70
80
90
100
-40 -20 0 20 40 60 80 100 120 140 160
Ph
ase
An
gle,
deg
Temperature, deg C
Coating grades
BURA IIIAir-rectified paving
Straight run PG & RAF Coating grades
BURA IIIAir-rectified paving
Straight run PG & RAF5000 kPa
• Two asphalts (PG 64 & PG 46) were oxidized to variety of products ranging from 1 PG stiffer paving grade to roofing coating grades
• Phase angle offers clear differentiation between these binders
Data from: P. Kriz, et al, Rheological Properties of Simple Bitumen, E&E Congress, Istanbul, Turkey, 2012.


