Asphalt Rubber Chip Seal Evaluation and Comparison of Other Binder Types J. Shawn Rizzutto, P.E. California Department of Transportation, USA, [email protected]DingXin Cheng, Ph.D., P.E. Director, California Pavement Preservation Center, USA, [email protected]Lerose Lane, P.E. Senior Pavement Preservation Engineer, California Pavement Preservation Center, [email protected]R. Gary Hicks, Ph.D., P.E. Program Manager, California Pavement Preservation Center, USA, [email protected]ABSTRACT: Asphalt Rubber Chip Seals (ARCS) have been used as an effective Preventative Maintenance strategy by the California Department of Transportation (CALTRANS) for over 35 years, not only on minor projects but also on major roadways where both high truck traffic, high ambient and pavement temperatures have been prevalent. Due to flushing/bleeding in the wheel paths on one particular project in Imperial County, California, Caltrans placed nine test sections using two different asphalt rubber (AR) binders, modified binders designated as a PG 70-22TR, and a polymer modified asphalt rubber binder. Various ½ inch (12.5 mm) coarse aggregate gradings were utilized, with one ½ inch (12.5 mm) gradation providing a more uniform one size aggregate. Various binder spread rates and aggregate spread rates were also evaluated. The asphalt rubber binders were designed to use 22% crumb rubber modifier (CRM) content (17 % scrap tire crumb rubber, 5 % high natural crumb rubber), asphalt modifier, and two base stock asphalts, AR 4000 and PG 70-10. The PG 70-22TR binders were designed utilizing 8% and 5.5% scrap tire crumb rubber and the polymer modified asphalt rubber binder was designed to use 16 % scrap tire crumb rubber with 2 % polymer. Key concepts that were developed and evaluated included the use of polymers, low and high percentages of CRM content, and the performance of the binders under extreme climatic conditions and traffic loading. This paper
Transcript
Asphalt Rubber Chip Seal Evaluation and
Comparison of Other Binder Types
J. Shawn Rizzutto, P.E.California Department of Transportation, USA, [email protected]
DingXin Cheng, Ph.D., P.E.Director, California Pavement Preservation Center, USA, [email protected]
Asphalt rubber chip seals have been used by Caltrans since the 1970s. Theyhave the advantage of resisting reflective cracking over conventional chip seals.However, it is very challenging to apply asphalt rubber chip seal under extremeweather and heavy traffic conditions. For example, an ARCS warranty projectplaced on State Route 86 in Imperial County (PM 37.3 to 43.3) on September 16-17, 2003. The truck lane of this project experienced flushing and rutting in thenorthbound number 2 lane within 6 months after construction [1]. A field reviewof the Imperial SR 86 project was performed along with other projects on I-8 inImperial County and Kern SR 58 in District 6 during March 2005. The purpose ofthese field reviews was to assess the type and extent of the distress on theseprojects. A final report titled “Review and Evaluation of Asphalt Rubber ChipSeals” was issued on October 17, 2005 [1]. The results of this studyrecommended that the current specifications used for asphalt rubber chip seals inhot climates, placed on significant grades or under heavy truck traffic, needed to bemodified to prevent bleeding and flushing.
In order to improve the chip seal applications under extreme conditions, nine testsections were placed on northbound SR 86 in Imperial County in high traffic areaswith extreme temperature variations. The average high temperature for a threeyear period in the summer is 40.6oC (105oF) with an average low of 5oC (41oF) atnight in the winter. The average daily traffic is in excess of 9,500 vehicles, withover 3,350 of the vehicles being heavy trucks. A two phase test was conducted byCaltrans. Phase 1 constructed six test sections from PM 28.4 to 30.7 on SR 86 inthe northbound direction and in lane number 2. Phase 1 test sections were placedin May of 2005 with different base binder types for asphalt rubber, binderapplication rates, and gradations. Phase 2 constructed another six test sections (7– 12) with different modified binders in September 2007. Only test sections 7through 9 will be compared to test sections 1 through 6, as all were placed in thenorthbound direction under the same traffic loading conditions.
Evaluation and Comparison of Binder Types 3
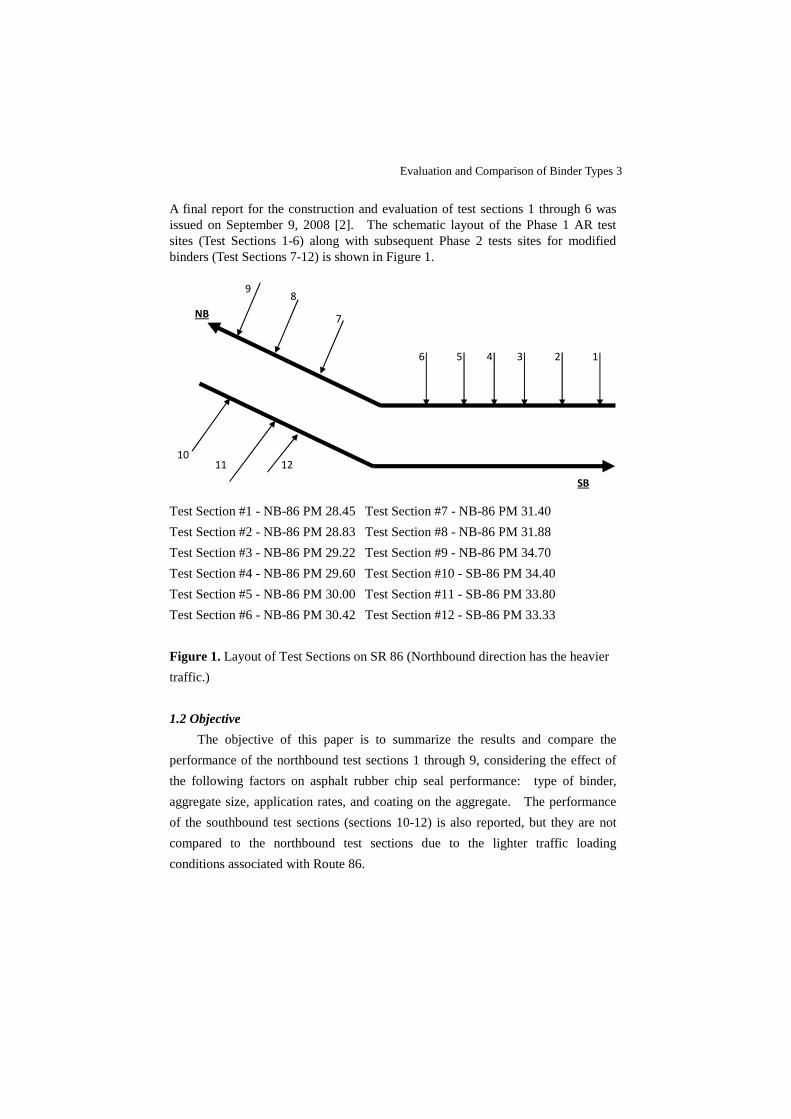
A final report for the construction and evaluation of test sections 1 through 6 wasissued on September 9, 2008 [2]. The schematic layout of the Phase 1 AR testsites (Test Sections 1-6) along with subsequent Phase 2 tests sites for modifiedbinders (Test Sections 7-12) is shown in Figure 1.
Test Section #1 - NB-86 PM 28.45 Test Section #7 - NB-86 PM 31.40
Test Section #2 - NB-86 PM 28.83 Test Section #8 - NB-86 PM 31.88
Test Section #3 - NB-86 PM 29.22 Test Section #9 - NB-86 PM 34.70
Test Section #4 - NB-86 PM 29.60 Test Section #10 - SB-86 PM 34.40
Test Section #5 - NB-86 PM 30.00 Test Section #11 - SB-86 PM 33.80
Test Section #6 - NB-86 PM 30.42 Test Section #12 - SB-86 PM 33.33
Figure 1. Layout of Test Sections on SR 86 (Northbound direction has the heavier
traffic.)
1.2 Objective
The objective of this paper is to summarize the results and compare the
performance of the northbound test sections 1 through 9, considering the effect of
the following factors on asphalt rubber chip seal performance: type of binder,
aggregate size, application rates, and coating on the aggregate. The performance
of the southbound test sections (sections 10-12) is also reported, but they are not
compared to the northbound test sections due to the lighter traffic loading
conditions associated with Route 86.
SB
NB
1110
98
7
126 5 4 3
12
4 Asphalt Rubber 2012
2. Materials and Application Rates
The types of binders used in the two phase test sites include:
Asphalt rubber. These are field blends and were used in the first test or in
test sections 1-6. This is the traditional asphalt rubber that has been used
in California since the 1980’s and contains at least 18% CRM, which waslater revised to contain a minimum of 20% CRM. The product used in
the asphalt rubber test site contained a minimum of 22% CRM.
Modified binder (PG-PM). Initially, the modified binders required less
than 10% CRM, but now the PG 76-22 TR requires a minimum of 10%
CRM; while the PG 76-22 PM has no minimum CRM content. The
Paramount Petroleum product used on the project was graded out to be a
(8) Last 25% of aggregate placed at north end of test section utilized uncoated aggregate
3. Phase 1 Studies-Asphalt Rubber Products
3.1 Construction
The purpose of the phase 1 test sections (1 through 6) was to evaluate theeffects of the following factors:
Binder type. The base stock asphalt used in the production of asphalt
rubber binder is as follows; Test Sections 1 and 2 used AR 4000 for
the base stock. Test Sections 3, 4 and 6 used a PG 70-10 base stock
for the asphalt rubber binder. Test section 5 used the PG 70-10 base
stock for the asphalt rubber binder without extender oil. The asphalt
modifier was eliminated to determine if this would reduce or
eliminate the flushing and bleeding experienced on prior projects.
Aggregate gradation. The aggregate gradation of the chip seal was
also a variable. In Test Section 1 (Control Section), the 12.5 mm (½
inch) max gradation used in prior projects was used. Test Sections 2
through 6 used a coarser more one size 12.5 mm (½ inch) max
gradation in an attempt to minimize the flushing.
Binder application rate. The previous asphalt rubber seal coat
specification required that the binder application rate ranged from
2.48 to 2.94 l/m2 (0.55 to 0.65 gal/yd2). Test sections 1 through 3
utilized a lower application rate of 2.26 l/m2 (0.50 gal/yd2). A rate of
2.48 l/m2 (0.55 gal/yd2) was used on test sections 4 and 5 while test
section 6 utilized an application rate of 2.27 l /m2 (0.60 gal/yd2).
Evaluation and Comparison of Binder Types 7
Aggregate spread rates. The aggregate spread rate specified and
used in prior projects ranged between 14.7 to 21.7 kg/m2 (27 to 40
lbs/yd2). A target of 21.7 kg/m2 (40 lbs/yd2) was used for all test
sections and the actual spread rates were between 20.6 to 21.6 kg/m2
(38.0 to 39.9lbs/yd2).
Construction of test sections 1-6 took place on May 12, 2005. The contractor,
Manhole Adjusting Inc., supplied and placed both the asphalt rubber binder and the
aggregate. The paving grade asphalt (AR4000) for test sections 1 and 2 was
purchased from Paramount Petroleum. The paving grade asphalt (PG 70-10) for
test sections 3 through 6 was purchased from Valero. The aggregate was supplied
from Aggregate Products Inc. Salton Sea Beach. Upon completion of the chip
seal, a flush coat was applied using a CSS-1 emulsion at an application rate of 0.36
l/m2 (0.08 gal/yd2) (diluted 1:1). The maximum air temperature during
construction was 33.9oC (93oF). Details for the project can be found in the technical
reports on this project [1][2] [3][4].
3.2 Performance Evaluations
After the initial construction of test sections 1 through 6, there was no loss of
aggregate due to raveling or stripping on the chip seal. The performance of the
test sections were evaluated several times after construction, 1 and 2 year surveys
were conducted as a part of the Caltrans Asphalt Rubber Chip Seal (ARCS) study.
The following pavement conditions were observed during the first survey which
was performed after one year from the initial date of construction.
Bleeding/flushing. The ARCS task force rated the pavements for the
presence of flushing. They rated the pavements in terms of light,
medium and heavy flushing. This can result in reduction in the
coefficient of friction for pavements.
Streaking/Roping. The task force also rated the pavements for the
presence of lean longitudinal application rates of binder which results in
aggregate loss in the lean bands.
Crack mitigation. One of the main reasons to use ARCS is to mitigate
cracks in the existing pavement from reflecting upward through the chip
8 Asphalt Rubber 2012
seal. This was rated by the presence of reflection cracks through the chip
seal.
Based on the review, it was considered by the task group that Test Section 3 rated
the highest in terms of aesthetics, test section 4 rated the highest in terms of crack
mitigation, and test section 5 had the most flushing.
Test sections 1 through 6 were rated again during a second survey preformed 2
years after the initial construction date. The test sections were also evaluated for
flushing, rutting and skid resistance using both the California Test Method (CTM)
342 and the ASTM method E 274. All sections exceeded the minimum
requirements for CTM 342, except test section 5 (most flushing) which failed to
meet the minimum requirements. Based on this review, it was determined by the
task force that Test Section 3 was again rated the highest in terms of aesthetics; test
section 4 rated the highest in terms of crack mitigation and was the best overall.
Test section 5 which was placed without asphalt modifier, exhibited heavy flushing
and bleeding.
On November 3, 2010, several of the ARCS task force members conducted another
survey to evaluate the condition of the test sections. Also evaluating the projects
during this inspection were Dr. Gary Hicks of the CP2 Center and representatives
of Paramount Petroleum. This was after five and one half years of heavy truck
traffic and climatic loading.
Table 2 provides a summary of the test section evaluations. As it can be seen most
of the sections are still performing, but with various signs of flushing. The best
performance from the standpoint of flushing is still in test section 3 while the worst
performance is in test section 5. The best performing section overall continues to
be test section 4. Photos from these tests sections are shown in Figure 2.
Evaluation and Comparison of Binder Types 9
Table 2. Summary of Pavement Observations, November 3, 2010
Section Description Current Condition
1 AR (AR-4000). Binder rate = 2.26 l/m2
(0.50 gal/yd2) Original aggregate
gradation
Moderate Bleeding
2 AR (AR-4000). Binder rate = 2.26 l/m2
(0.50 gal/yd2). Coarse gradation.
Light to Moderate
bleeding
3 AR (PG 70-10). Binder rate = 2.26 l/m2
(0.50 gal/yd2). Coarse gradation
Best overall combined
performance in
aesthetics and crack
resistance
4 AR (PG 70-10). Binder rate = 2.49 l/m2
(0.55 gal/yd2). Coarse gradation
Moderate bleeding.
Best performance
overall due to crack
resistance
5 AR (PG 70-10). Binder rate = 2.49 l/m2
(0.55 gal/yd2). No extender oil. Coarse
gradation
2nd Heaviest Bleeding
6 AR (PG 70-10). Binder rate = 2.63 l/m2
(0.58 gal/yd2). Coarse aggregate gradation.
Heaviest bleeding
10 Asphalt Rubber 2012
a. Test Section 1 NB 86 AR 4000
b. Test Section 2 NB 86 AR 4000
c. Test Section 3 NB 86 PG 70-10
d. Test Section 4 NB 86 PG 70-10
e. Test Section 5 NB 86 PG 70-10
w/o asphalt modifier
f. Test Section 6 NB 86 PG 70-10
Figure 2. Photos of Phase 1 Test Sections 1 -6
Evaluation and Comparison of Binder Types 11
4. Phase 2 Studies- Field and Terminal Blended Rubberized Asphalt
The construction of test sections 7 through 12 consisted of a combination of
field blended and terminal blended products. The main purpose was to validate
the Caltrans NSSP specification that was written without specifying a process, and
which is based on end-result specifications used by Caltrans. Variations in
aggregate size, with or without pre-coating, were included to check for construction
variability and effect of aggregates on performance of the section based traffic
loading. It should also be noted that the NSSP was changed after the test sections
were constructed to require the use of PG 76-22 PM and PG 76-22 TR (min 10%
CRM).
4.1 Binders
Several types of crumb rubber modified binders were used as a part of this
study. The details of the binder usage are as follows:
Rubberized asphalt binder (RAB). This binder was field blended. The
PG 70-22 (PG 79-22 Actual, 100 PAV) was used in the northbound #2
lane test section 7, while the PG 70-22 (PG 86-16 Actual, 100 PAV) was
used in the southbound #2 lane test section 10. The asphalt base was a
PG 70-10 supplied by Paramount Petroleum and was field blended by
International Surfacing Systems (ISS), Inc., utilizing 8% CRM with 3%
SBS polymer.
Terminal blend binder. These products were supplied by Paramount
Petroleum, utilizing 5.5% CRM with 3% SBS polymer. This binder was
graded at PG 70-22 (PG 73-22 Actual, 110 PAV). Test section 8 was
placed in the northbound #2 lane, while test sections 11 and 12 were
placed in the southbound #2 lane. Test section 8, 11 and 12 all utilized the
PG 73-22 Actual, 110 PAV binder.
Polymer modified asphalt rubber (PMAR). This product was used in
the northbound #2 lane in test section 9. The asphalt base (PG 70-10) was
supplied by Paramount Petroleum and was field blended by International
Surfacing Systems (ISS), Inc., utilizing 16% CRM with 2% SBS polymer.
12 Asphalt Rubber 2012
4.2 Aggregates
All aggregates used on test sections 7 through 12 were supplied from
Coachella Valley Aggregates, Indio, Ca. The 9.5 mm (3/8 inch) chip was used
only in test section 12, while the 12.5 mm (½ inch) chip was used in all other
sections. All aggregates were pre-coated with a PG 70-10 binder at 1% binder
content; except for the aggregate used in part of test section 8 used an uncoated
aggregate.
4.3 Construction and Early Performance
The contractors for phase 2 were International Surfacing Systems (ISS) and
Windsor Fuel. Windsor Fuel placed the terminal blends, while ISS placed the
field blended RAB binders and the PMAR during October and November 2007.
Significant aggregate loss occurred in test sections 7 through 12; however this
subsided within 6 to 8 weeks after completion of the test sections. The amount of
aggregate loss exhibited over the first 6 to 8 weeks after initial construction of test
sections 7 through 12 is not acceptable to an owner, due to the excessive exposure
to vehicle damage and public relations. The following exceptions were noted:
test sections 7 and 8 exhibited excessive aggregate loss, bleeding or flushing;
test section 9 never exhibited bleeding or flushing of any type; test sections 10
and 11 exhibited bleeding or flushing in the wheel paths occurred within a few
months, but healed up by the end of the third year under the lighter southbound
traffic loading; and test section 12 with the smaller 9.5 mm (3/8 inch) chip
continued to bleed and flush even under the lighter traffic loading in the
southbound direction. It should be noted that since the edges were not knifed,
more raveling was experienced along the longitudinal joints for all of the test
sections. When the temperature of the Paramount Petroleum terminally blended
modified binder material dropped below 170oC (340oF) during application, the
material became friable; which was concerning due to the liability for vehicle
damage and public relations issues. However, there was no reported property
damage during the placement of any of the test sections.
The weather during construction for the test sections was warm and clear. The
Evaluation and Comparison of Binder Types 13
average high temperature during construction was 27 to 34oC (81 to 94oF), with a
surface temperature up to 46oC (115o F) while the lows at night were 11.1 to 13.9oC
(52 to 57 o F). The details of the construction can be found from the report of the
project [5].
4.4 Performance Evaluations
Two site visits of these test sections were conducted for the phase 2 test
sections 7 through 12. The first was in February 2010 and the second was
completed in November 2010, over 3 years after construction.
4.4.1 Feb 2010 Evaluation
Test section 7 was constructed in the northbound direction, which has a
heavier traffic loading using the ISS RAB field blended modified binder (PG 79-22
actual). This section exhibited early aggregate loss and moderate to heavy
aggregate loss throughout the test section. The start of the section had less
embedment of the aggregate (light flushing) than toward the end (moderate
flushing). This test section demonstrated the second poorest performance of all
the test sections (1 through 9) placed.
Test section 8 was constructed in the north bound direction, which has heavier
traffic loading; using the Paramount Petroleum terminally blended modified binder
(PG 73-22 actual). This section exhibited significant aggregate loss and heavy
flushing. The aggregate loss and flushing was throughout the tests section. For
test section 8, approximately 25% of the test section used uncoated aggregate.
The uncoated material was at the end of test section 8 and the material carried over
to test section 10, which did not exhibit the same aggregate loss. The aggregate
loss cannot be attributed to the uncoated aggregate, as the aggregate loss was
prevalent throughout the entire length of test section 8. The pre-coating of the
aggregate has demonstrated the ability to provide for better adhesion between the
aggregate and the binder, due to the paving grade asphalts incorporation with the
heated aggregate. This process allows for a longer window for the seating of the
aggregate during the chip seal placement operations; this emphasizes the
14 Asphalt Rubber 2012
requirement for aggregates to be pre-coated in the NSSP. This section
demonstrated the poorest performance of all of the test sections 1 through 9 placed.
Test section 9 was constructed in the north bound direction, which has heavier
traffic loading using the ISS polymer modified asphalt rubber (PMAR) binder.
The test section was constructed to evaluate the performance of a material that is in
the developmental stage (PMAR) binder and is currently being considered by the
Caltrans binder committee. This section exhibited early aggregate loss similar to
sections 7 to 12; however this material exhibited exceptional performance with
regard to resistance to flushing (None). It is noted that test section 9 was placed in
the northbound direction under heavy traffic loading and test sections 10 and 11
were placed in the southbound direction which is under lighter traffic loading.
Test section 9 exhibited the best performance of all of the test sections 1 through 12,
from an aesthetics point of view and performed well for crack mitigation when
placed over a suitable pavement.
Test section 10 was constructed on the south bound under lighter traffic loading;
using the ISS RAB field blended modified binder (PG 86-16 actual). Though this
section exhibited early aggregate loss, it exhibited good performance in long term
aggregate retention and in embedment and reflective cracking.
Test section 11 was constructed on the south bound lane under lighter traffic
loading; using the Paramount Petroleum terminally blended modified binder (PG
73-22 actual). This section exhibited early aggregate loss and bleeding in the
wheel paths during the first few years, but healed up by the third year.
Test section 12 was constructed on the south bound under lighter traffic loading;
using the Paramount Petroleum terminally blended modified binder (PG 73-22
actual). In this test section, the aggregate was changed to a 9.5 mm (3/8 inch) pre-
coated aggregates. This was done to evaluate the performance of the 12.5 mm
(3/8 inch) compared to the 9.5mm (3/8 inch) aggregate. Under the same climatic
and traffic loading the 12.5 mm (1/2 inch) aggregate clearly outperformed the
9.5mm (3/8 inch) aggregate. This section exhibited early aggregate loss and
moderate to heavy flushing throughout the test section in the wheel paths. Based
Evaluation and Comparison of Binder Types 15
upon the observations and performance of test section 11 and 12, specification
language was added to the standard special provisions (SSP) for asphalt rubber chip
seals and the non-standard special provision for modified binders to only allow the
uses of the 9.5mm (3/8inch) for interlayers. The 12.5mm (1/2 inch) medium
aggregate gradations will be the primary aggregate utilized for chip seals for the
State of California.
After a review of the PG grading of the supplied binders for the modified binder
test sections, the NSSP specification was revised to include an upper limit on DSR
in addition to the minimum value to ensure that the binders are not too stiff or too
soft for the climatic region.
4.4.2 Nov 2010 Evaluation
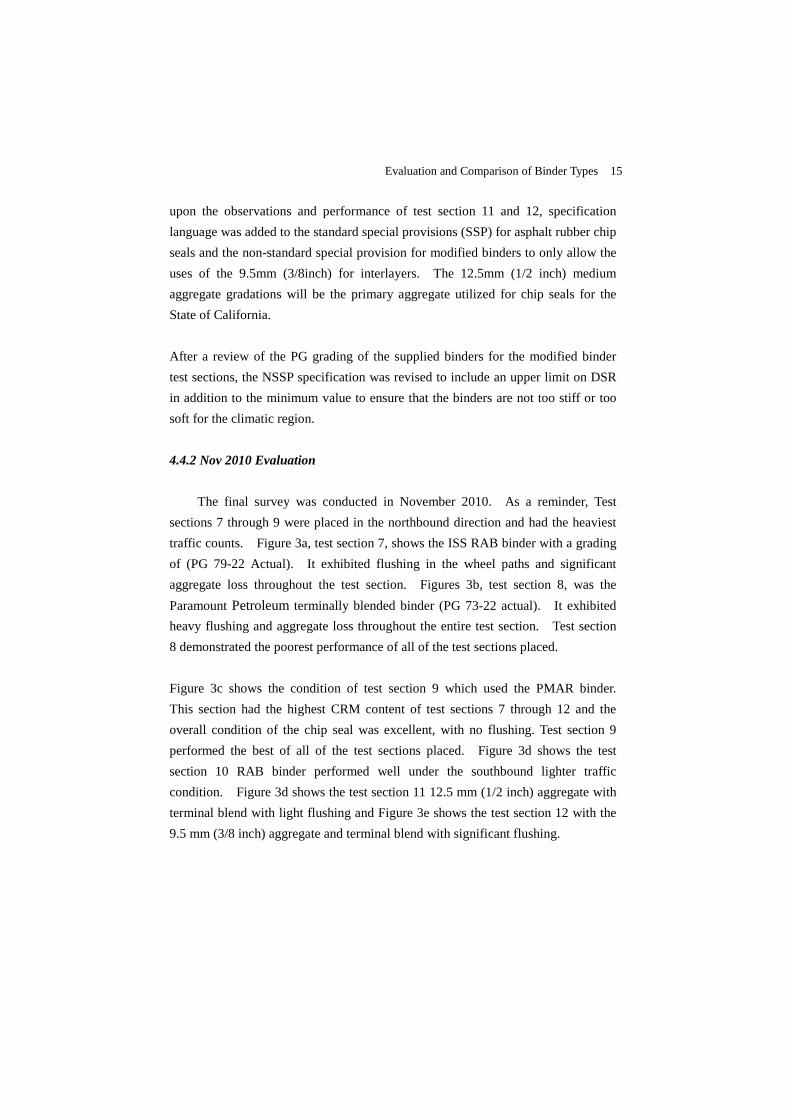
The final survey was conducted in November 2010. As a reminder, Test
sections 7 through 9 were placed in the northbound direction and had the heaviest
traffic counts. Figure 3a, test section 7, shows the ISS RAB binder with a grading
of (PG 79-22 Actual). It exhibited flushing in the wheel paths and significant
aggregate loss throughout the test section. Figures 3b, test section 8, was the
Paramount Petroleum terminally blended binder (PG 73-22 actual). It exhibited
heavy flushing and aggregate loss throughout the entire test section. Test section
8 demonstrated the poorest performance of all of the test sections placed.
Figure 3c shows the condition of test section 9 which used the PMAR binder.
This section had the highest CRM content of test sections 7 through 12 and the
overall condition of the chip seal was excellent, with no flushing. Test section 9
performed the best of all of the test sections placed. Figure 3d shows the test
section 10 RAB binder performed well under the southbound lighter traffic
condition. Figure 3d shows the test section 11 12.5 mm (1/2 inch) aggregate with
terminal blend with light flushing and Figure 3e shows the test section 12 with the
9.5 mm (3/8 inch) aggregate and terminal blend with significant flushing.
16 Asphalt Rubber 2012
a. Test Sect. 7, NB RTE 86 ISS RAB
Binder(PG 79-22 actual)
b. Test Sect. 8, NB RTE 86 Paramount
Petroleum TB (PG73-22 actual)
c. Test Sect. 9, NB RTE 86 ISS PMAR
using 16% CRM and 2% SBS polymer
d. Test Section 10, SB RTE 86 ISS
RAB binder (PG 86-16 actual)
e. Test Sect. 11,SB RTE 86 Paramount
Petroleum TB (PG 73-22 actual)
f. Test Section 12 SB RTE 86
Paramount Petroleum TB (PG 73-22
actual) with 9.5 mm (3/8 inch)
gradation
Figure 3. Photos of the Phase 2 test sections 7-12 during the November 2010 field
visit
Evaluation and Comparison of Binder Types 17
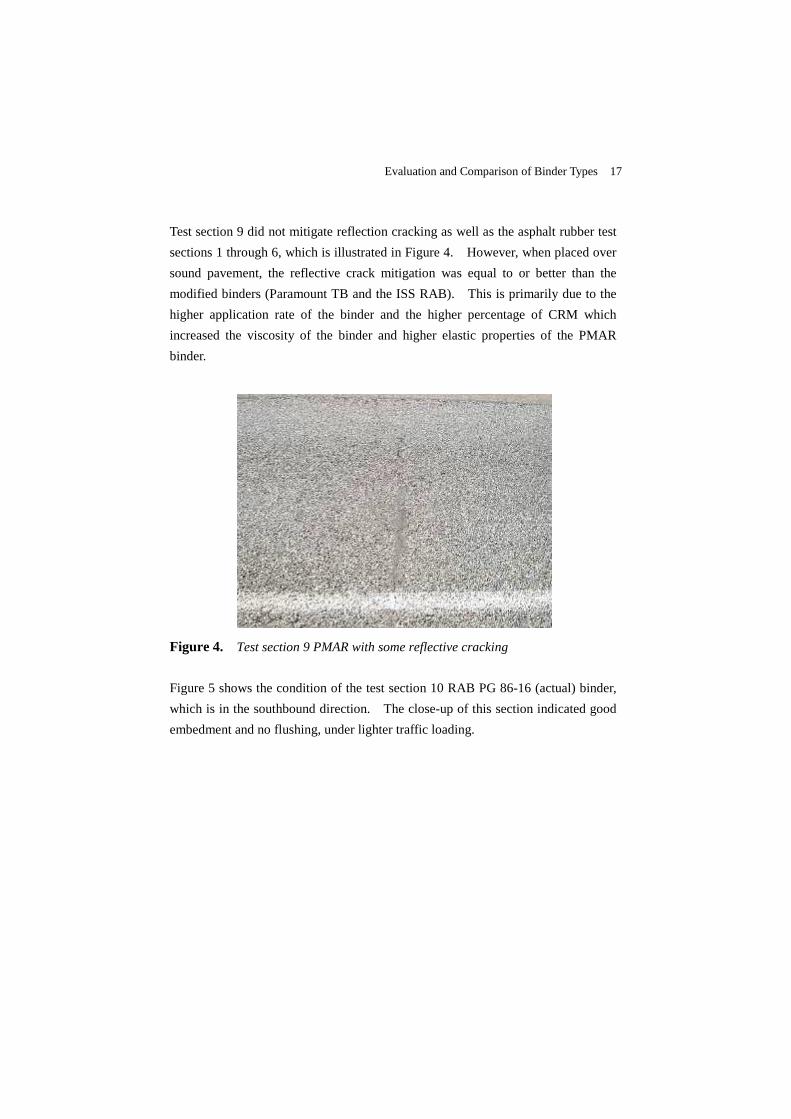
Test section 9 did not mitigate reflection cracking as well as the asphalt rubber test
sections 1 through 6, which is illustrated in Figure 4. However, when placed over
sound pavement, the reflective crack mitigation was equal to or better than the
modified binders (Paramount TB and the ISS RAB). This is primarily due to the
higher application rate of the binder and the higher percentage of CRM which
increased the viscosity of the binder and higher elastic properties of the PMAR
binder.
Figure 4. Test section 9 PMAR with some reflective cracking
Figure 5 shows the condition of the test section 10 RAB PG 86-16 (actual) binder,
which is in the southbound direction. The close-up of this section indicated good
embedment and no flushing, under lighter traffic loading.
18 Asphalt Rubber 2012
Figure 5. Test Section 10, RAB binder PG 86-16 (actual)
Test sections 11 and 12 were both the modified binders prepared by Paramount
Petroleum at the terminal. The binder was prepared to meet a graded of PG 70-22,
and the actual grade was (PG 73-22 actual). Test section 11 contained the 12.5
mm (½ inch) pre-coated aggregate while Test Section 12 contained the 9.5 mm (3/8
inch) pre-coated aggregate. As can be seen in Figure 6 there was aggregate loss that
occurred shortly after construction for 4 to 6 weeks. The aggregate loss on the
edge is due to not knifing the edge and a plugged tip.
Figure 6. Test Section 11 showing aggregate loss
Evaluation and Comparison of Binder Types 19
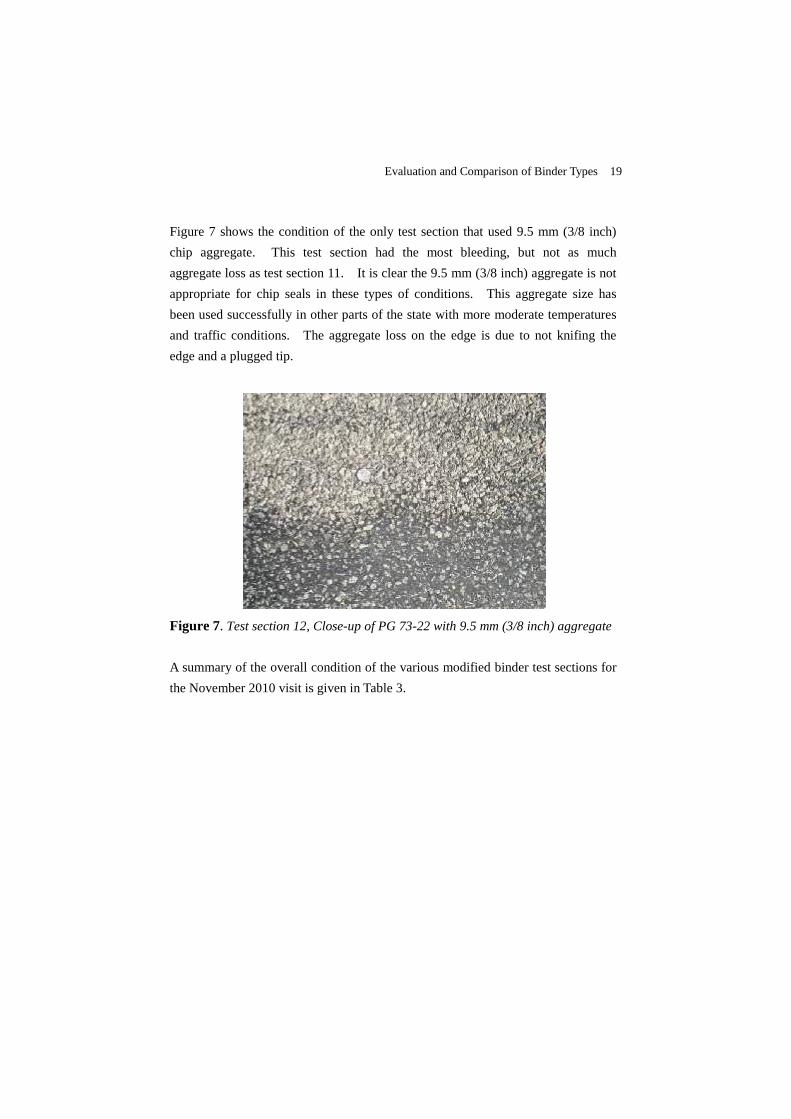
Figure 7 shows the condition of the only test section that used 9.5 mm (3/8 inch)
chip aggregate. This test section had the most bleeding, but not as much
aggregate loss as test section 11. It is clear the 9.5 mm (3/8 inch) aggregate is not
appropriate for chip seals in these types of conditions. This aggregate size has
been used successfully in other parts of the state with more moderate temperatures
and traffic conditions. The aggregate loss on the edge is due to not knifing the
edge and a plugged tip.
Figure 7. Test section 12, Close-up of PG 73-22 with 9.5 mm (3/8 inch) aggregate
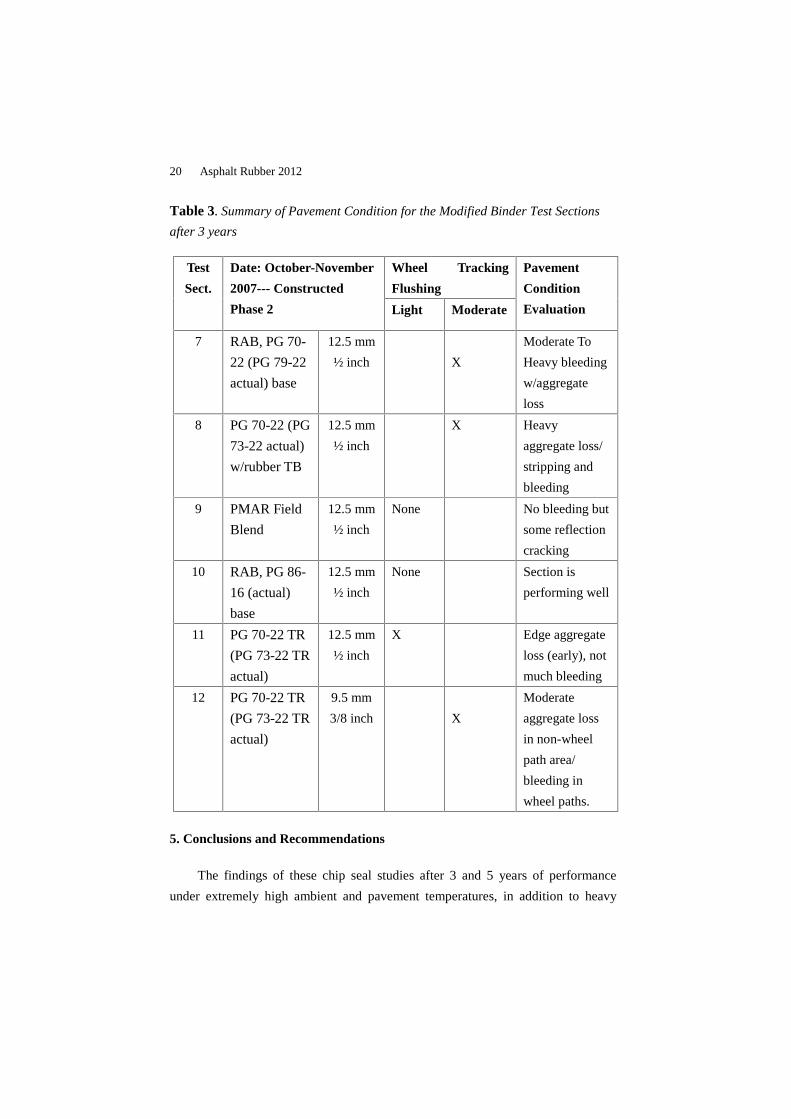
A summary of the overall condition of the various modified binder test sections for
the November 2010 visit is given in Table 3.
20 Asphalt Rubber 2012
Table 3. Summary of Pavement Condition for the Modified Binder Test Sections
after 3 years
5. Conclusions and Recommendations
The findings of these chip seal studies after 3 and 5 years of performance
under extremely high ambient and pavement temperatures, in addition to heavy
Test
Sect.
Date: October-November
2007--- Constructed
Phase 2
Wheel Tracking
Flushing
Pavement
Condition
EvaluationLight Moderate
7 RAB, PG 70-
22 (PG 79-22
actual) base
12.5 mm
½ inch X
Moderate To
Heavy bleeding
w/aggregate
loss
8 PG 70-22 (PG
73-22 actual)
w/rubber TB
12.5 mm
½ inch
X Heavy
aggregate loss/
stripping and
bleeding
9 PMAR Field
Blend
12.5 mm
½ inch
None No bleeding but
some reflection
cracking
10 RAB, PG 86-
16 (actual)
base
12.5 mm
½ inch
None Section is
performing well
11 PG 70-22 TR
(PG 73-22 TR
actual)
12.5 mm
½ inch
X Edge aggregate
loss (early), not
much bleeding
12 PG 70-22 TR
(PG 73-22 TR
actual)
9.5 mm
3/8 inch X
Moderate
aggregate loss
in non-wheel
path area/
bleeding in
wheel paths.
Evaluation and Comparison of Binder Types 21
traffic loading in the northbound direction are as follows:
Phase 1 study resulted in a number of conclusions to mitigate flushing
and bleeding in ARCS throughout the State of California and specifically
in the desert climate of District 11.
o The findings from the study suggested; that using a stiffer PG
graded base stock asphalts are beneficial in the production of
asphalt rubber binder, a coarser more one size 12.5mm (1/2 inch)
aggregate gradation and lower binder application rates in the
wheel paths can mitigate flushing. . The use of the stiffer PG
graded base stock asphalt has a detrimental impact in preventing
reflective crack mitigation.
o The recommendations of the study are applicable to very hot
climates and where the ARCS are subjected to heavy traffic.
However, some of the recommendations may also be applicable
to the different climatic zones and the various traffic loadings in
California.
o Reducing the application rate in the wheel paths through the use
of a variable rate spreader bar can also help reduce the amount of
flushing and bleeding in the wheel paths. The use of the
variable rate spreader bar also allows for the application rate to be
higher in the non-wheel path which helps mitigate aggregate loss
outside of the wheel paths.
The Phase 2 study resulted in the following conclusion:
o The modified binders placed in test section 7, 8, 10, 11 and 12,
exhibited aggregate loss during the first 4 to 6 weeks after
construction. This exposure to vehicle liability and public
relations is not considered acceptable.
o Test sections 7 and 8 exhibited varying degrees of flushing from
light to heavy and aggregate loss from light to heavy. Test
section 8 exhibited the poorest performance with heavy aggregate
loss and flushing throughout the test section. The distress
exhibited in these test sections would not be acceptable and
would be deemed a failure when subjected to this climate and
traffic loading.
22 Asphalt Rubber 2012
o Test section 9 preformed the best of all of the test sections placed
under phase 2. This section exhibited excellent performance,
aesthetically the chip seal had no flushing at all throughout the
entire length of the test section. The crack mitigation properties
were excellent when placed over suitable existing pavement.
o Test sections 10 and 11 performed well under the same climatic
condition, but under a lighter traffic loading. However, early
aggregate retention is a serious concern and needs to be
addressed.
o Field and terminal blend modified binders had very similar
performance rated as unacceptable in test sections 7 and 8 placed
the northbound direction (heavy traffic) and acceptable in test
sections 10 and11 placed in the southbound direction (lighter
traffic) even with the differences in the actual PG grading of the
binder.
o The binder application rate is important across the pavement with
similar distress levels to achieve good results. Excess binder in
the wheel tracks will lead to flushing.
o Calibration and verification of application rates are essential to
obtaining a quality chip seal. Though everyone knows this to be
true, it is not always checked.
o It is clear that the modified binders caused a problem with
aggregate retention early in the life of the modified binder chip
seal. This was evident in the aggregate loss during the first 4 to
6 weeks of the chip seal performance, but the products are still
performing in the southbound direction.
o For chip seal applications, an upper appropriate stiffness is
needed to mitigate reflective cracking and embedment level, so
maximum and minimum DSR’s have been set in the NSSP. Thestiffer binders are not expected to perform as well to mitigate
reflection cracking.
o Hot pre-coated aggregates enhance the performance of the chip
seal. The hot pre-coated aggregates promote a better bonding and
aggregate retention throughout the life of the seal coat.
Evaluation and Comparison of Binder Types 23
o The 12.5 mm (½ inch) medium one size pre-coated chip is
needed in hot climates for the best performance under heavy
traffic. The 9.5mm (3/8 inch) chip did not perform well and
exhibited moderate to heavy wheel path flushing in test section
12. For hot applied chip seals in California it is recommended
that the minimum aggregate gradation be 12.5mm (1/2 inch)
medium. The 9.5mm (3/8 inch) aggregate gradation is only
recommended for interlayer’s.o QC/QA testing frequencies have been included in the NSSP to
insure materials such as the binders and aggregates materials are
in compliance with the specification.
o Lack of binder in the non-wheel path led to raveling of the
aggregate, while too much binder in the wheel path led to the
flushing/bleeding. The use of a variable rate spreader bar is a
solution when the chip seal is under heavy traffic loading as the
rate can be varied between the wheel path and the non-wheel
path, in order to mitigate the flushing in the wheel paths and the
aggregate loss in the non-wheel path.
An overall evaluation of test sections 1 through 9 placed in the northbound
direction under the same traffic and climatic loading yielded the following
conclusions:
o Aesthetics are by far the overriding factor when evaluating the
success of a chip seal. Crack mitigation performance also
factors into the performance equation.
o Test section 9 PMAR preformed the best overall with regard to
combined aesthetics, and crack mitigation.
o The asphalt rubber test sections 1 through 6 outperformed the
modified binder test sections 7 and 8, with regard to aggregate
retention, flushing, crack mitigation and aesthetics.
o The asphalt rubber test sections 1 through 6 outperformed the
PMAR test section 9 PMAR with regard to crack mitigation.
This is primarily due to the higher application rate of the asphalt
rubber binder and the higher elasticity of the asphalt rubber
24 Asphalt Rubber 2012
binder. The crack mitigation properties of the asphalt rubber
test sections were affected by the lower application rates and base
stock PG grade asphalt used in the various test sections.
o It is essential that the spreader bar be calibrated and verified prior
to placement of binder in order to place the correct binder
application rate both in the wheel path and the non-wheel path
areas of the pavement. This will prevent flushing in the wheel
path area and loss of aggregate in the non-wheel path areas.
o The use of a variable rate spreader bar for binder application has
proven to be successful in placement of asphalt rubber chip
seals subjected to the same climate and higher truck traffic
loading conditions. This yielded a similar aesthetic result to the
PMAR test section with superior crack mitigation abilities.
6. Bibliography
[1] ARCS Task Force, “Review and Evaluation of Asphalt Rubber Chip Seals”,October 17, 2005
[2] ARCS Task Force, “Test Section Review and final report”, September 9, 2008[3] J. Shawn Rizzutto, “Asphalt Rubber Chip Seal Evaluation”, Proceedings,
Asphalt Rubber 2009, Nanjing China, November 2009
[4] R. G. Hicks and J. Shawn Rizzutto, “Evaluation of Asphalt Rubber TestSection in District 11”, CP2 2011-106 TB, California Pavement Preservation
Center, Sept. 2011
[5] R. Gary Hicks, Dingxin Cheng, and Shawn Rizzutto, “Modified Binder ChipSeals in Hot Climates with High Truck Volumes”, CP2 2011-02, Sept. 2011