197 Aspirin, Angioplasty and Proton Beam Therapy: The Economics of Smarter Health-Care Spending Katherine Baicker and Amitabh Chandra I. Introduction Health-care spending in the United States now represents one- sixth of gross domestic product (GDP) and is projected to comprise more than a quarter within 25 years (Congressional Budget Office 2011). Spending a large and increasing share of GDP on health care in and of itself is not necessarily troubling: as societies grow richer, it would seem natural that an increasing share of their resources should be devoted to “purchasing” health and longevity. After all, living an extra year in good health may be worth more on the margin than an additional home, a longer vacation, or a more sumptuous meal. Some studies suggest that, given the relative productivity of health spending, we might optimally spend as much as a third of GDP on health by midcentury (Fogel 2008; Hall and Jones 2007), and that the improvements in health outcomes driven by health-care spend- ing outweigh the costs of care (Murphy and Topel 2006). If the ag- gregate health benefits of care truly outweigh the total social costs, there is no a priori reason to be concerned about devoting a quarter of GDP—or more—to living longer and healthier lives. Why, then, is there such distress over rising health expenditures? There are two reasons to be less than sanguine about health-care
Transcript
197
Aspirin, Angioplasty and Proton Beam Therapy: The Economics of
Smarter Health-Care Spending
Katherine Baicker and Amitabh Chandra
I. Introduction
Health-care spending in the United States now represents one-sixth of gross domestic product (GDP) and is projected to comprise more than a quarter within 25 years (Congressional Budget Office 2011). Spending a large and increasing share of GDP on health care in and of itself is not necessarily troubling: as societies grow richer, it would seem natural that an increasing share of their resources should be devoted to “purchasing” health and longevity. After all, living an extra year in good health may be worth more on the margin than an additional home, a longer vacation, or a more sumptuous meal. Some studies suggest that, given the relative productivity of health spending, we might optimally spend as much as a third of GDP on health by midcentury (Fogel 2008; Hall and Jones 2007), and that the improvements in health outcomes driven by health-care spend-ing outweigh the costs of care (Murphy and Topel 2006). If the ag-gregate health benefits of care truly outweigh the total social costs, there is no a priori reason to be concerned about devoting a quarter of GDP—or more—to living longer and healthier lives.
Why, then, is there such distress over rising health expenditures? There are two reasons to be less than sanguine about health-care
198 Katherine Baicker and Amitabh Chandra
spending in the United States—and indeed in most developed coun-tries (Table 1). First, public expenditures account for almost half of U.S. health-care spending (Centers for Medicare and Medicaid Ser-vices 2010). Federal spending on public programs (including public insurance programs for the poor and elderly and newly enacted subsi-dies for the poor to purchase private insurance) is anticipated to grow from 5.5 percent of GDP now to almost 14 percent or more in 2060 (Congressional Budget Office 2011). The economic distortions asso-ciated with raising revenues to finance the public share come with a sizable macroeconomic cost (Baicker and Skinner 2011; Congressional Budget Office 2007). Unchecked, increases in entitlement spending would double the federal budget (as a share of GDP), necessitating some combination of tax increases, the elimination of other public spending, or public debt levels that far exceed those currently observed in Greece (Chernew, Baicker, and Hsu 2010). Second, there is growing consensus that health-care resources are not being spent efficiently (and may not even be the primary driver of improved outcomes): we are neither allocating resources efficiently between health and other uses, nor getting as much health as we could for every dollar spent—making it difficult to evaluate how much we “should” be spending on health care.1 Such inefficiencies clearly are of first-order importance as health-care spending encompasses a larger and larger share of total resources.
We begin by describing the landscape of spending in the United States in the context of the macroeconomy, how it has evolved over time, and how it compares to spending patterns and trends in other developed countries. The U.S. health-care system may, on first ex-amination, appear to be an intractable morass of regulations and ac-ronyms, and it is tempting to view its failures as the sum of disparate inefficiencies. But such a viewpoint motivates piecemeal modifica-tions that may, in fact, perpetuate the deeper inefficiencies. To help avoid this trap, we outline a simple framework through which we interpret the principle impediments to a well-functioning health-care system. Such a system should exhibit productive efficiency, meaning that health-care resources are put to the best use possible and pro-duce as much health as they can, and allocative efficiency, meaning that the right share of resources is being devoted to health care versus other goods in the economy. The peculiar financing of health care in
Aspirin, Angioplasty and Proton Beam Therapy: The Economics of Smarter Health-Care Spending 199
the United States fosters both allocative and productive inefficien-cies, and different policies are needed to address each. Some have suggested that with system-level improvements, it would be possible to achieve the same level of health with 30 percent less spending (Fisher and others 2003, 2003).
Table 1Health-Care Share of GDP for OECD Countries
1980 and 2008
Health-Care Share of GDP
Annual Growth Rate (1980-2008)
Public Share of Health Spending
Country1980 2008
Health-Care Spending
GDP Per Capita
2008
Spain 5.3 9.0 4.5 2.5 72.6
Portugal 5.3 9.9* 4.4 2.4 65.1
United Kingdom 5.6 8.7 3.8 2.2 82.4
Greece 5.9 9.7 3.1 1.5
New Zealand 5.9 9.8 3.0 1.1 80.3
Australia 6.1 8.5 2.9 1.8 68.0
Belgium 6.3 10.2 3.3 1.4 75.0
Finland 6.3 8.4 3.0 1.9 74.4
Iceland 6.3 9.1 2.4 1.0 82.6
Japan 6.5 8.1 2.5 1.8 80.8
Canada 7.0 10.4 2.9 1.5 70.5
France 7.0 11.2 3.1 1.4 77.7
Norway 7.0 8.5 4.3 3.5 84.3
Switzerland 7.3 10.7 2.4 1.0 59.5
Austria 7.4 10.5 2.8 1.6 77.2
Netherlands 7.4 9.9 3.1 2.1
Ireland 8.2 8.7 4.2 3.8 76.7
Germany 8.4 10.5 1.8 1.6 76.6
Denmark 8.9 9.7 1.9 1.7 84.7
Sweden 8.9 9.4 1.6 1.4 81.5
United States 9.0 16.0 4.0 1.8 46.0
Notes: For Germany, the 1980 values are for West Germany. Alternatively, one can calculate growth in health-care spending relative to GDP for 1980-1990 and for 1992-2008 (thereby avoiding the transition). This yields an increase of 0.8 percentage point of GDP in health-care expenditures. Share of health-care spending comprised of public dollars does not include tax exclusion of employer sponsored insurance.Source: Chandra and Skinner, 2008, drawing on OECD, 2010. Data for either 2008, 2007, or 2006(*)
200 Katherine Baicker and Amitabh Chandra
In an efficient system, more spending on health care would be a sign of prosperity and a harbinger of improved health and longev-ity, not a cause for concern. Achieving this means improving the incentives and infrastructure for providers to deliver—and patients to consume—high-value care, as well as wrestling with the difficult question of whom to cover versus what to cover in public insurance programs.
II. The U.S. Health-Care Spending Landscape
In order to gauge the causes, consequences, and potential remedies for rising health-care spending, it is important to understand the drivers of spending in the current system (and how they do or do not align with incentives for efficient use) as well as the implications of that spending for overall economic welfare.
A. Health spending in the economy
Chart 1a shows the growth of health-care spending in the United States. Real health-care spending (measured in 2009 dollars) has in-creased from $330 billion in 1966 to an estimated $2.5 trillion in 2009, and from 6 percent of GDP to 16 percent. Hospital spend-ing is the largest category, although spending on prescription drugs has been growing more quickly. It may be tempting to explain this growth as being a consequence of “Baumol’s cost disease,” where labor-intensive sectors exhibit less productivity growth than other industries. But this should have happened all over the world, and Table 1 demonstrates that growth in U.S. health-care spending has been exceptionally high. Nor can these facts be explained by a model of increasing incomes leading to higher spending on health—other countries had similar income growth but did not expand health-care spending as rapidly.
Health care is different from other goods in many ways that may interfere with the efficient allocation of resources based on marginal costs and marginal benefits: patients have limited information about the benefits associated with the care that they purchase (relying on the suppliers of that care for advice), and often need to make decisions in difficult circumstances; both insurers and providers often operate with limited competition. The way we finance health care adds an
Aspirin, Angioplasty and Proton Beam Therapy: The Economics of Smarter Health-Care Spending 201
Chart 1U.S. National Health Expenditures
0
500,000
1,000,000
1,500,000
2,000,000
2,500,000
3,000,000
1964 1969 1974 1979 1984 1989 1994 1999 2004 2009
Rea
l 200
9 $
Mill
ions
National Health Expenditures by Type
Other Administration
Nursing Care
Prescription Drugs Home Health Care
Dental
Physician/Clinical Services Hospital
0
500,000
1,000,000
1,500,000
2,000,000
2,500,000
3,000,000
1964 1969 1974 1979 1984 1989 1994 1999 2004 2009
Rea
l 200
9 $
Mill
ions
National Health Expenditures By Source
Other Private Out of pocket
Private HI Other Public
Medicaid Medicare
Note: Figures are in real 2009 millions of dollars, calculated from national health expenditures from CMSdeflated by CPI.Source: Centers for Medicare and Medicaid Services, 2011
202 Katherine Baicker and Amitabh Chandra
important additional set of wedges between the marginal cost of care and the marginal health benefit that care produces. Chart 1b shows how health spending in the United States is financed. Most care in the United States is purchased through private insurance (largely ob-tained through employment) or public insurance programs (largely Medicare and Medicaid, introduced in 1965).2 Each mechanism has particular implications for the economy overall and for the efficiency with which health-care resources are deployed, introducing ineffi-ciencies in the use of health-care resources that are not seen in the markets for most other goods and services.
B. Private health spending
The majority of private health insurance in the United States today is obtained through employer-sponsored plans, which cover more than 170 million lives (compared with less than 20 million non-el-derly covered through private non-group insurance plans) (DeNavas-Walt, Proctor, and Smith 2010). The dominance of employer-based health insurance in the private market has historical roots: during a period of wartime price controls, it was determined that such plans were not subject to wage controls and were not taxable, making them a favored form of compensation. At more than $250 billion annually, this tax subsidization of employment-based private health insurance, through its exclusion from payroll and income tax bases, is as large as federal spending on Medicaid (Kleinbard 2008) and larger than the mortgage interest deduction. It disproportionately favors those with higher incomes and jobs that offer generous health insurance benefits, and comes with the deadweight loss associated with the tax expenditures that finance the subsidy (discussed more below). Em-ployer plans, however, form the primary mechanism for pooling of risk among the privately insured: the tax subsidy drives participation in health insurance by healthy as well as sick at pooled premiums. One consequence of this is that it makes changing jobs costly for those in poor health who would be unable to obtain insurance at favorable rates if they lost their employer plan (Madrian 1994).
Chart 2 shows the increase in premiums for family insurance plans purchased through employers. There is much public discussion of how the rise in health-insurance costs affects U.S. businesses’ international
Aspirin, Angioplasty and Proton Beam Therapy: The Economics of Smarter Health-Care Spending 203
Chart 2Health Insurance Premiums and Wages
Notes: Premiums on left axis, household income on right axis, both in real 2009 dollars. Health insurance premiums for the following years were interpolated: 1989-1992; 1994-1995; 1997-1998.Sources: Kaiser Family Foundation/Health Research and Eductaion Trust; U.S. Census Bureau
42,000
44,000
46,000
48,000
50,000
52,000
54,000
$0
$2,000
$4,000
$6,000
$8,000
$10,000
$12,000
$14,000
1988
1989
1990
1991
1992
1993
1994
1995
1996
1997
1998
1999
2000
2001
2002
2003
2004
2005
2006
2007
2008
2009
Employee Share
Employer Share
Median Household Income
Employer-Sponsored Health Insurance Premiums for Family Plans (1988-2009, adjusted for inflation)
competitiveness, but simple economic theory notes that in the long run the cost of these benefits is borne entirely by workers (as long as they value the benefits) (Summers 1989). Similarly, the share of pre-miums nominally paid by workers is not indicative of the true burden (and although the dollar cost paid by workers has increased over time, the share actually has remained relatively flat).
In the short run, however, there are constraints that affect the ability of firms to shift costs to workers, and thus rising costs can result in fewer people covered by group policies (Baicker and Chandra 2006; Currie and Madrian 2000; Cutler and Madrian 1998). While the vast majority of large employers offer health benefits, over the last 10 years the share of small firms offering health benefits has dropped from 69 percent to 61 percent. Rising costs are cited as one of the main factors influencing firms’ decisions to discontinue offering benefits (Kaiser Family Foundation and Health Research and Educational Trust 2008)—meaning that rising health-care costs can erode the risk-pooling in the private market and exacerbate adverse selection. While most of the burden of rising private health-care spending is borne in slower or stagnant wage growth (as an increasing
204 Katherine Baicker and Amitabh Chandra
share of compensation is devoted to health insurance benefits), the consequences of rising premiums can be particularly severe for low-income populations at greatest risk of losing jobs when the costs of benefits rise (Baicker and Levy 2008).
In addition to the labor market consequences of employer-spon-sored health insurance, the tax preference for this insurance relative to out-of-pocket spending promotes first-dollar coverage plans that exacerbate moral hazard. There is always a trade-off between insur-ance protection and incentives: insurance protects against the bad state of the world in which individuals have bad health and need more medical care, but it lowers the marginal cost of that care, there-by promoting consumption of care whose marginal benefit is above the patient’s marginal copay but below the true marginal cost of the resources. The tax preference for insurance moves enrollees toward plans with even lower cost-sharing. Furthermore, while the cost of the employer-sponsored insurance is ultimately borne by workers, in the intermediate term that trade-off is not dollar-for-dollar for any individual worker, obscuring the trade-off and limiting the market discipline that would foster high-value insurance design and the op-timal division of compensation among health insurance, wages, and other benefits.
There are additional constraints on insurance contracts that limit the availability of lower-cost, higher-value plans. In a world of evolv-ing medical technology and complex care management, is impossible to fully specify contingent contracts outlining all of the care that individuals can receive in every state of the world, and private insurers have limited ability to deny coverage for procedures with unproven benefits when Medicare covers these technologies (Ferguson, Dubinsky, and Kirsch 1993). U.S. corporate laws also make it difficult for individual insurers and hospitals to reduce the use of technologies with variable payments: insurers and hospitals are not permitted to interfere with the medical judgment of physicians. State laws also require insurers to pay for any service deemed medically neces-sary by a physician. Because enrollees eventually leave private insurers (either for other plans or to enroll in Medicare), insurers face a dulled incentive to invest in care with health benefits that accrue only in the
Aspirin, Angioplasty and Proton Beam Therapy: The Economics of Smarter Health-Care Spending 205
future. Together, these undermine the incentive for insurers to act as a residual claimant, leaving insurers to rely more heavily on negotiat-ing lower prices with providers rather than restraining utilization to control spending.
C. Public health insurance
The landscape of health-insurance coverage in the United States is largely shaped by the creation of Medicare, the federal program for the elderly and disabled (covering 49 million and costing more than $500 billion in 2009), and Medicaid, the joint federal-state program for the poor and other medically needy groups. Medicaid has de-mographic eligibility requirements that vary (covering more than 60 million—some of whom are also on Medicare—and costing about $375 billion annually, $250 billion from federal revenues and $125 billion from states and localities). The State Children’s Health Insur-ance Program (SCHIP) expanded coverage for low-income children above the poverty level beginning in 1997 (covering 8 million and costing about $11 billion). There are numerous smaller programs covering, for example, military personnel and veterans, as well as the direct provision of care through community health centers. All told, public dollars account for about half of national health expenditures, even before accounting for the tax subsidy for private insurance de-scribed above. The Affordable Care Act expands Medicaid coverage and introduces additional subsidies for low-income adults to pur-chase private insurance—adding substantially to public spending on insurance (offset, at least in part, by additional revenue sources).
While Medicaid poses an enormous fiscal challenge for state gov-ernments, Medicare poses the greater challenge for the federal gov-ernment. Medicare expenditures account for 15 percent of federal spending and 3.6 percent of GDP (Boards of Trustees of the Federal Hospital Insurance and Federal Supplemental Medical Insurance Trust Funds 2011). Medicare spending grew 2.5 percentage points faster than GDP from 1975 through 2008 (Congressional Budget Office 2011). The health care used by Medicare beneficiaries is fi-nanced by a combination of dedicated taxes and general revenues (as well as supplemental plans and the 25 percent of care beneficiaries pay for through premiums or out-of-pocket). The payroll taxes dedicated
206 Katherine Baicker and Amitabh Chandra
to financing hospital spending are paid into a trust fund, but since 2009, spending has grown more quickly than the tax stream, with the trust fund forecast to be exhausted in 2024. Program costs for physicians and other outpatient care and drugs are financed mostly through general revenues and beneficiaries’ premiums. Rapid spend-ing growth on these components means that general revenues are an increasingly important component of Medicare financing. While the aging of the population is clearly one driver of higher spending, the majority of rising expenditures can be attributed to higher spending per beneficiary (Congressional Budget Office 2011). Public health insurance programs thus comprise a rising share of both GDP and federal revenues (see Chart 3a).
Public insurance programs provide benefits that are extremely valuable to beneficiaries. Medicaid redistributes resources toward low-income and sick populations, and Medicare pools risk in a re-tiree population without access to employer pools. Finkelstein esti-mates that in 1963 only 25 percent of seniors had comprehensive insurance, but shortly after the advent of Medicare virtually all did (Finkelstein 2007). This redistribution—from healthy to sick and from wealthy to poor—is a key feature of social insurance that is not achievable through private insurance.
These social benefits must be balanced, however, against the costs associated with the programs’ financing. Raising taxes to pay for pub-lic insurance exerts a structural drag on the economy (deadweight loss). The health sector jobs created by low-value health-care spend-ing divert resources from higher-value uses. Deficit spending on health care also carries an economic cost: taxes are required to pay interest and principal on any borrowed money, and rising debt-to-GDP ratios eventually have serious adverse effects on the country’s future ability to borrow. Projections of growing federal debt largely reflect anticipated increases in health-care spending (see Chart 3b). Even if policy could halve the gap between the growth in health-care spending and the growth in GDP, some estimates suggest that our debt-to-GDP ratio would drop only from 280 percent to 200 per-cent by 2050 (Kogan, Cox, and Horney 2008).
Aspirin, Angioplasty and Proton Beam Therapy: The Economics of Smarter Health-Care Spending 207
Chart 3Health-Care Spending and the Economy
Projected Spending on Health Care as a Percentage of GDP
Federal Spending for Medicare and Medicaid as a Percentage of GDP Under Different Assumptions About Excess Cost Growth
There is a substantial body of research exploring the magnitude of the deadweight loss created on the margin in current U.S. tax struc-ture—with many estimates around 0.3, meaning that every dollar of public spending comes with an additional cost of lowering economic activity by 30 cents (Gahvari 2006; Feldstein 2006, 1999, 1973; Ful-lerton and Henderson 1989). These tax distortions are not just static in nature (lowering economic activity at a point in time), but can also affect economic growth by distorting investment decisions (Engen and Skinner 1996).
Financing current trends in public program costs would necessi-tate dramatic increases in tax rates. The Congressional Budget Of-fice (CBO) estimated (before the Affordable Care Act) that income tax rates would have to increase by more than 70 percent to finance health-care spending that grew 1 percentage point faster than GDP, and would have to increase by more than 160 percent by 2050 to finance growth at the historical rate of 2.5 percentage points faster than GDP growth. Even with just 1 percentage point excess growth in health-care spending, the CBO estimates that the tax increase would reduce GDP by 3 percent to 14 percent (Congressional Budget Of-fice 2007). This additional cost of public health insurance must be included in any cost-benefit analysis of the program.
Most forecasts of growth in health-care spending assume that there must be a break in current trends—health-care spending simply can-not continue to grow at historic rates—but it is not clear what will cause that slow-down. Getzen postulates that health-care spending at the country level is driven in large part by the ability to finance health care, and this hypothesis is consistent with evidence present-ed in Baicker and Skinner that countries with a higher tax-to-GDP ratio in 1979 experienced significantly slower growth in health-care spending between 1980 and 2008 (Baicker and Skinner 2011; Getzen 1992). Rising costs of taxation (and debt) may thus ulti-mately serve as a brake on health-care spending growth—creating the impetus to overcome stakeholder resistance to policies that improve the efficiency of spending.
The deadweight loss associated with the public financing of programs such as Medicare is not the only inefficiency they generate.
Aspirin, Angioplasty and Proton Beam Therapy: The Economics of Smarter Health-Care Spending 209
Medicare performs no evaluation of the benefits associated with new medical technologies, and in its fee-for-service incarnation does not ask if care could be better managed. Both features discourage cost-saving innovation and efficient insurance offerings. As an example, consider that traditional Medicare does not coordinate hospital, out-patient, ambulatory, and prescription drug care. This means that care is often “siloed,” with little attempt made to choose modes or sites of delivery that work best and with provider reimbursements not informed by their broader effects on care. It also means that if a pri-vate insurer providing prescription drug coverage changes program features in a way that reduces prescription drug use but results in patients requiring more hospital care, the Medicare program bears that cost. Chandra, Gruber and McKnight (2010) find evidence of exactly these offsets.
Other inefficiencies are not restricted to the Medicare program, affecting physician practice style in the non-Medicare population. When Medicare covers Provenge for prostate cancer (at a cost of more than $90,000 for a few weeks of survival) or the latest cyclo-tron-based proton beam therapy (an unproven treatment with a $120 million price tag requiring a football field-sized accelerator), private insurers are likely to follow the coverage decision to avoid litigation in which their patients claim that insurers are withholding valuable care. Medicare regulatory boards evaluating new technol-ogy focus on whether drugs or procedures provide positive benefits, rather than costs.3
There is also substantial literature at the provider level showing that practice pattern norms drive similar care for all of the patients that a provider sees, regardless of individual insurance status—so that changes in the incentives applying to a large share of patients (say, Medicare beneficiaries) can drive changes in the care received by all patients (Glied and Zivin 2002; Baker and Corts 1996; Baker 1999; Frank and Zeckhauser 2007). Medicare’s administered pricing scheme is frequently out of step with real resource costs and subject to political manipulation (as witnessed by the regular override over the “sustainable growth rate” formula intended to cut physician fees when total Medicare spending rises too quickly).
210 Katherine Baicker and Amitabh Chandra
On the patient side, in an attempt to control the overuse of care, the basic Medicare benefit requires beneficiaries to pay substantial cost-sharing—almost 20 percent coinsurance for outpatient care. But almost all beneficiaries buy additional Medigap wrap-around plans, eliminating most copayments and leading to greater moral hazard (which imposes additional costs on the Medicare program itself ). The Medicare Advantage program was intended to promote innovation in insurance coverage and provision of care, but there has been limited evidence of success to date; the proposals for “premium support” (in essence an insurance voucher) have similar goals.
Thus, neither the patient side nor the provider side of the system fosters decision-making that weighs costs against benefits. Nor is there an evaluation of the benefits of additional spending through one program against the benefits of additional spending through an-other. The spending on care of questionable marginal benefit fostered by the Medicare program, for example, might come at the expense of covering more people in the Medicaid program who would consume inframarginal care of high value (Baicker and Chandra 2010). Re-cent research suggests that Medicaid coverage substantially expands the use of preventive care in low-income adult populations, but such populations are not covered by Medicaid in most states (Finkelstein and others 2011).
III. Assessing the Efficiency of Health Spending
The above discussion has focused on specific inefficiencies in the design and financing of public and private health insurance plans. The tax-preferred nature of financing private plans, the limited use of cost-effectiveness analysis, and the overly generous public reimburse-ment of care with questionable health benefit might suggest that the United States spends too much on health care relative to other goods. At the same time, we have seen dramatic increases in life expectancy and reductions in disease burden over the last century (Cutler, Dea-ton, and Lleras-Muney 2006). Some new interventions are cheap (antibiotics, statins, beta blockers, vaccines—many of which are even underused) and others are more expensive but still remain cost-effec-tive (HAART therapy, primary PCI after heart attacks), but medical
Aspirin, Angioplasty and Proton Beam Therapy: The Economics of Smarter Health-Care Spending 211
technology has high health returns on average (Cutler, Rosen, and Vijan 2006). These facts might suggest that U.S. spending on health care has been worth it, and may even be too low in some areas.
How can we reconcile these facts? Drawing on Chandra and Skinner, we develop a framework for understanding the sometimes conflicting evidence and the drivers of differential productivity of health spending (Chandra and Skinner 2011; Weinstein and Skinner 2010). We make the key distinction between productive efficiency, meaning that health-care resources are put to the best use possible and produce as much health as they can, and allocative efficiency, meaning that the right amount of resources are being devoted to health care, versus other goods in the economy. When the evidence on the value of health-care spending is evaluated in light of this framework, we see that what might at first appear to suggest that we are spending too little on health care actually may be evidence only that we have suboptimally deployed what we are already spending. It is in fact impossible to evaluate allocative inefficiency in the presence of productive inefficiency.
A. Two kinds of efficiency
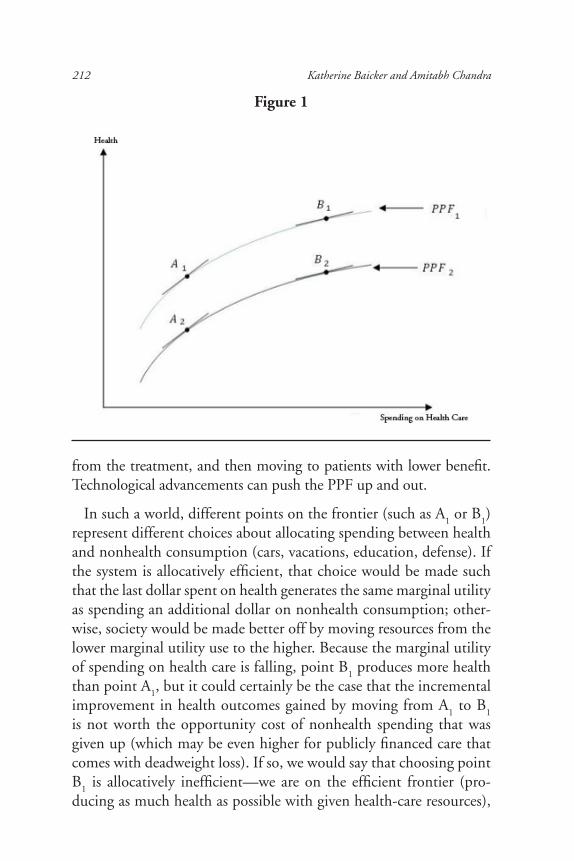
We begin with the world of productive efficiency, in which health-care resources are put to the best use possible. Figure 1 illustrates the association between spending on factor inputs (health resources such as physicians, scans, hospitals) on the horizontal axis and survival/qual-ity of life on the vertical axis. A concave production possibility frontier (PPF
1) illustrates the aggregate health that is achievable for a given level
of inputs for the United States, or any particular delivery system, which could be the United Kingdom, or the Mayo Clinic. This is the rela-tionship between health and spending in a world where we have solved all of the problems that interfere with efficient production, described below. The PPF assumes diminishing returns to spending: higher levels of spending are associated with inputs that generate smaller and small-er health benefits; CT scanners, proton-beam accelerators, and chemo-therapy will have lower benefit per dollar spent relative to aspirin, beta blockers, and hospital care for pneumonia. Under diminishing returns, physicians are first giving treatments to the patients who benefit most
212 Katherine Baicker and Amitabh Chandra
from the treatment, and then moving to patients with lower benefit. Technological advancements can push the PPF up and out.
In such a world, different points on the frontier (such as A1 or B
1)
represent different choices about allocating spending between health and nonhealth consumption (cars, vacations, education, defense). If the system is allocatively efficient, that choice would be made such that the last dollar spent on health generates the same marginal utility as spending an additional dollar on nonhealth consumption; other-wise, society would be made better off by moving resources from the lower marginal utility use to the higher. Because the marginal utility of spending on health care is falling, point B
1 produces more health
than point A1, but it could certainly be the case that the incremental
improvement in health outcomes gained by moving from A1 to B
1
is not worth the opportunity cost of nonhealth spending that was given up (which may be even higher for publicly financed care that comes with deadweight loss). If so, we would say that choosing point B
1 is allocatively inefficient—we are on the efficient frontier (pro-
ducing as much health as possible with given health-care resources),
Figure 1
Aspirin, Angioplasty and Proton Beam Therapy: The Economics of Smarter Health-Care Spending 213
but have spent too much on health care. Why might a system al-locate at B
1 rather than A
1? The previous section describes reasons
that health-care markets do not resemble efficient markets for other goods and services. Several of these factors, from the tax-preference for employer-sponsored insurance and the moral hazard it generates to fee-for-service nature of Medicare coverage, push toward a greater allotment of resources to health care.
Evidence suggests, however, that we are likely in a world in which we are not on the health-care frontier, but in its interior (see line la-beled PPF
2 in Figure 1). This could happen for a variety of reasons.
Fee-for-service reimbursement combined with low levels of competi-tion (most health care is consumed locally) encourages providers to deliver care that they can bill for and underinvest in keeping patients healthy. They fail to do very simple things like hand-washing, pre-scribing prophylactic antibiotics before surgery, or using beta block-ers for heart-attack patients (Skinner and Staiger 2009). Much (but by no means all) investment in prevention would yield high returns in future health. Similarly, inadequate health IT reduces the produc-tivity of all resources used by increasing fragmentation, errors, and duplication. These sins of omission coexist with sins of commission; estimates suggest that the overuse of CT scans and MRIs cause 1.5 percent to 2 percent of total cancers (Brenner and Hall 2007).
A particularly insidious form of productive inefficiency arises if medical technologies are adopted in the wrong sequence or deployed on patients in the wrong order—potentially even creating a convex production function (Figure 2). Adopting angioplasty, CT scanners, proton beam therapy, and Provenge for prostate cancer patients be-fore patients with heart attacks receive aspirin would result in this type of productive inefficiency. This could result from insurers pay-ing for these intensive technologies more generously than other more therapeutic interventions (care management, reduced errors, lower readmissions, aspirin). With these jumbled adoption decisions, it will not be the case that the marginal dollar spent on health care is purchasing the marginal (most intensive) technology—if low-value technologies are adopted before ones with higher values, then an empirical analysis of the relationship between spending and health
214 Katherine Baicker and Amitabh Chandra
outcomes would find that increases in spending lead to improve-ments in health, but this would be entirely a consequence of pro-ductive inefficiency in how health-care technologies are utilized. In this case, higher spending could even exhibit increasing marginal re-turns (compare the slopes at points A and B). At the patient level, some may have generous insurance that covers every new technology regardless of effectiveness (Medicare), leaving less money to cover others who would benefit from prevention or low-cost treatments for chronic disease (Medicaid).4 In the presence of these productive inefficiencies, analysts might conclude that marginal spending was incredibly valuable and that health spending should be higher. But such an interpretation would miss the tremendous opportunities to improve productivity by reallocating existing spending.
Figure 2
Aspirin, Angioplasty and Proton Beam Therapy: The Economics of Smarter Health-Care Spending 215
B. Interpreting the evidence
What is the evidence on the extent of these inefficiencies? The sim-plest way to evaluate the presence of allocative inefficiencies would be to measure the spending required to save an additional (quality-adjusted) year of life, and to evaluate whether the gain was “worth” the cost. The key idea is that spending on health care may be ex-pensive, but may produce gains that are more than commensurate with the additional spending. Garber and Skinner report that the average cost per life year gained has risen substantially over the de-cades, from $64,000 during the 1970s to $247,000 in the 1990s (assuming that half of the gains in life expectancy are attributable to health-care spending) (Cutler, Rosen, and Vijan 2006; Garber and Skinner 2008; Cutler and Madrian 1998). This cost is substantially higher than the threshold of $100,000 per quality-adjusted life year often used to evaluate policy, suggesting that we may be spending too much on health relative to other goods.5 And even this number likely underestimates what it costs to produce a year of life, as it is based on averages, and does not measure the benefits from marginal spending where allocative efficiency should be judged.
Chandra and Skinner (2011) provide another cautionary tale about how allocative efficiency can be measured, arguing that improve-ments in health are often generated because of relatively low-tech technological progress. One recent study provides direct evidence of this theory to explain the decline in mortality from coronary dis-ease during 1980-2000 due to specific factors (Ford et al. 2007). More than 40 percent of the decline can be attributed to changes in smoking, physical activity, blood pressure, and cholesterol (and offsets from rising obesity and diabetes). Thirty-five percent of the decline is attributed to inexpensive but highly effective treatments: aspirin, beta blockers, blood-thinning drugs, antihypertensives, di-uretics, and pharmaceuticals such as ACE inhibitors, statins, and thrombolytics (“clot busters”). Many of these treatments represent movements from A
2 to A
1 in Figure 1. Expensive treatments, such as
angioplasty (stents), bypass surgery, and cardiopulmonary resuscita-tion (such as automated defibrillators) explain 11 percent of the im-provement, but almost all of the spending increase (movement from
216 Katherine Baicker and Amitabh Chandra
A1 to B
1). These facts caution against attributing the improvement
in health to concomitant spending increases—the bulk of the health improvement may not have been caused by spending.
An alternative way to measure allocative efficiency would be to compare spending and outcomes in different geographic areas to see the size of the gains in outcomes that accrue to higher spending, and then to compare those to productivity in other sectors. These stud-ies have had mixed findings: some characterize productivity as high (Ong and others 2009; Romley, Jena, and Goldman 2011; Silber and others 2010; Bach 2010). But similar study designs have also pointed to low productivity (Skinner, Staiger, and Fisher 2006; Yasaitis and others. 2009). With these conflicting facts, it is not surprising that some analysts say spending more would improve health by enough to warrant the cost, while others say it would not.
We conclude, however, that both of these methods are flawed. In other work we have demonstrated that much of the regional varia-tions literature implicitly assumes that all regions are on the same production function, while in reality they are on different production functions (Chandra and Staiger 2007). This would happen if deliv-ery systems specialize in how they deliver care. Some may specialize in technologically intensive treatments while others may specialize in less-expensive treatments. Because of this specialization, even though two systems or countries may have similar health outcomes with one achieved at substantially lower cost, simply cutting spending in the high-cost system will not allow it to achieve the results of a low-cost system, but will almost certainly harm patient health in the process. Finding that two systems have similar outcomes at dissimilar spend-ing levels is therefore not informative about whether we should spend more or less on health care: this question cannot be answered in the presence of productive inefficiency.
What then, do we know about productive efficiency—could the same health gains be achieved for less? Chandra and Skinner argue that the peculiar financing of the health-care system results in many high-tech treatments being adopted ahead of lower tech (but cheap-er) ones. This suggests productive inefficiencies of the type illustrated in Chart 5. Many expensive technologies are used more extensively
Aspirin, Angioplasty and Proton Beam Therapy: The Economics of Smarter Health-Care Spending 217
in the United States than in other countries, such as cardiovascular procedures, at 587 per 100,000 in the United States compared with 207 in Denmark (Peterson and Burton 2007). Simultaneously, there are many cases of underuse of effective treatments in the United States compared with other nations (Cutler and Ly 2011).
We interpret the geographic variations literature as providing fur-ther evidence of productive inefficiency. There is evidence that each of these regions is on its own production function, where places that spend less have comparable health outcomes to higher-spending areas because they have adopted all the right low-cost technologies (comparing point A
1 to B
2 in Figure 1). Chart 4 shows the variability
in spending on Medicare fee-for-service beneficiaries across different states, as well as the fact that higher-spending areas are not those in which beneficiaries receive the highest quality of care. Chart 5 shows that there is more variability across states in physician and outpatient care than in inpatient care. That there is a negative correlation be-tween the use of relatively low-tech treatments and expensive high-tech treatments of dubious value further suggests inefficient adop-tion (Yasaitis and others 2009; Baicker and Chandra 2004). It also suggests the tremendous scope for increasing productive efficiency through policies that foster higher-value use without encouraging low-value use. Once we move closer to productive efficiency, issues of allocative efficiency can then be addressed more effectively.
IV. Policy Levers for Improving the Efficiency of Health- Care Spending
The distinction between productive and allocative efficiency can help guide analysis of policy levers. Different policy levers operate on different sources of inefficiency, and allocative efficiency cannot be evaluated when productive inefficiency persists. We separate our discussion of policy levers into those that operate on the patient side, provider side, and the environment in which care and insur-ance are purchased.
A. Provider-side incentives
Reforming the way public insurance programs pay providers could promote both productive and allocative efficiency. Medicare-
218 Katherine Baicker and Amitabh Chandra
Chart 4Medicare Spending and the Quality of Care
Chart 5Medicare Reimbursements per Enrollee by State, 2008
AK
AL
AR
AZ
CA
COCT
DE
FL
GA
HI
IA
ID
IL
INKS
KY
LA
MA
MD
ME
MI
MN
MO
MS
MT
NC
ND
NE
NH
NJ
NM NV
NY
OH
OK
OR
PA
RI
SC
SD
TN
TX
UT
VA
VT
WA
WI
WV
WY
Hig
hest
1020
3040
Low
est
$3000 $4000 $5000 $6000 $7000 $8000
Annual Medicare Spending per Beneficiary(inflation adjusted to year 2000 dollars)
Ove
rall
Qua
lity
Ran
king
in 2
000-
01(s
mal
ler
valu
es in
dica
te h
ighe
r qu
alit
y)
Source: Baicker and Chandra (Health Affairs, 2004), based on state-level use of care such as aspirin post-heart-attack, blood level monitoring for diabetics, flu vaccination, etc, for Medicare fee-for-service beneficiaries.
Source: Dartmouth Atlas of Health Care (Wennberg, Cooper, and Dartmouth Atlas of Health Care Working Group 2011)
0
2,000
4,000
6,000
8,000
10,000
12,000
Ala
ska
Haw
aii
Ore
gon
Ver
mon
t So
uth
Dak
ota
Wyo
min
g N
ew M
exic
o W
ashi
ngto
n M
inne
sota
Id
aho
Mon
tana
N
orth
Dak
ota
Iow
a D
istr
ict o
f Col
umbi
a W
isco
nsin
C
olor
ado
Mai
ne
New
Ham
pshi
re
Vir
gini
a U
tah
Neb
rask
a N
orth
Car
olin
a R
hode
Isl
and
Ari
zona
C
alifo
rnia
M
aryl
and
Sout
h C
arol
ina
Geo
rgia
C
onne
ctic
ut
Kan
sas
New
Yor
k D
elaw
are
Ark
ansa
s M
isso
uri
Uni
ted
Stat
es
Mas
sach
uset
ts
Indi
ana
Wes
t Vir
gini
a Il
linoi
s N
evad
a Pe
nnsy
lvan
ia
New
Jer
sey
Ohi
o Te
nnes
see
Mic
higa
n A
laba
ma
Ken
tuck
y O
klah
oma
Mis
siss
ippi
Te
xas
Flor
ida
Loui
sian
a
Rei
mbu
rsem
ents
/ E
nrol
lee,
Dol
lars
Medicare Reimbursements Per Enrollee By State, 2008
Other Outpatient Physician Hospital
Aspirin, Angioplasty and Proton Beam Therapy: The Economics of Smarter Health-Care Spending 219
administered prices play a particularly large role in creating fragmented patterns of care, and moving away from fee-for-service payments could provide much better incentives for efficient allocation of resources. Cur-rent payment structures provide little incentive for cost-saving innova-tion (Cutler 2010) or for providing lower-cost care. For example, a back pain clinic loses revenues by steering patients to low-cost rehabilitation rather than equally effective but costlier diagnostic tests and back surgery (Fuhrmans 2007). A change in payment incentives away from tradition-al fee-for-service thus has the potential to improve health and moderate spending growth. Similarly, system efficiency would be improved by cre-ating incentives not only to adopt cost-effective treatments, but to adopt the most cost-effective treatments first and to apply them first to the patients for whom they produce the greatest value. The imperfect incen-tives created by current payments reduce productive efficiency by mak-ing relatively high payments for care that is not necessarily of the highest value, and interfere with allocative efficiency by committing (uncapped) resources to care that may have lower value than alternative uses of funds.
Rewarding more efficient delivery is a logical strategy for increas-ing the productivity of health-care spending.6 Medicare has in fact experimented with alternative payment systems. Hospitalizations are reimbursed by bundled payments based on DRGs (diagnosis-related groups). These prospective payments are imperfect, but can limit the incentives to provide excess hospital care. Perhaps as a result, since 1992 there has been limited per capita real growth in Medicare spend-ing on these types of DRG categories (Weisbrod 1991). Weisbrod cap-tured the dynamics between reimbursement systems and R&D and optimistically described the new prospective payment system:
With a hospital’s revenue being exogenous for a given pa-tient once admitted … , the organization’s financial health depends on its ability to control costs of treatment. Thus, under a prospective payment finance mechanism, the health care delivery system sends a vastly different signal to R&D sector, with priorities the reverse of those under ret-rospective payment. The new signal is as follows: Develop new technologies that reduce costs, provided that quality does not suffer “too much.” (p. 537)
220 Katherine Baicker and Amitabh Chandra
Weisbrod was too sanguine about this system: it created DRGs for new procedures (as opposed to illnesses), which unravels the “prospective” part of the payment and leaves the incentives for innovation largely unchanged. There are incentives to “unbun-dle” outpatient and post-acute care, and exempting certain capi-tal costs from the expenditure cap continues to encourage capital spending. Weisbrod’s fundamental insight is still valid: only when health care is reimbursed based on value will innovations be fo-cused on cost-effective treatments. The greatest saving could arise not so much from new cost-saving devices, but instead from reduc-ing the organizational fragmentation inherent in U.S. health care (Cebul and others 2007). The more than twofold difference in risk- and price-adjusted costs across top-ranked U.S. academic medical centers (Fisher and others 2004) is not due to “what” is provided, since nearly all academic medical centers have access to the latest tech-nology. Rather, the difference is related to “how” care is provided or the organization of the health-care system—the frequency of follow-up visits, referrals to subspecialists, hospital days, and the intensity of diagnostic testing and imaging procedures.
To confront the challenge of inefficient delivery systems, some have embraced the idea of an integrated delivery system with capitated payments. Because such systems retain the savings from better prevention, lower readmission rates, and better medication adher-ence, they have better incentives to avoid therapies of question-able benefit. The 2010 U.S. Affordable Care Act (ACA) focused on “accountable care organizations” (ACOs), where shared-saving “bo-nuses” are provided to health-care organizations that are able to pro-vide high-quality care at lower costs. Examples include integrated systems such as Intermountain in Utah or the Geisenger Clinic in Pennsylvania, but also traditional hospital-physician networks (Fish-er and others, 2009). These may come closer to the ideal expressed by Weisbrod by providing incentives for cost-saving innovations, and gut the incentives that physicians currently have to engage in “financial entrepreneurship” of the type seen in McAllen, Texas; Elyria, Ohio; and Redding, Calif. (Gawande 2009). However, we do not know how well ACOs will sidestep cost-ineffective tech-nologies, particularly if the latest shiny innovation increases market
Aspirin, Angioplasty and Proton Beam Therapy: The Economics of Smarter Health-Care Spending 221
share. The viability of ACOs will depend on the receptiveness of physicians to capitated payments—some specialists will see their incomes fall and are unlikely to take these cuts quietly. While their concerns may not resonate with patients, they might if providers claim that valuable care is being withheld. Designers of ACOs are therefore keenly interested in measuring ACO performance and patient satisfaction, but current quality measures only capture truly negligent care.
If payment-system reform is particularly promising on the pub-lic side, what about the private side? As noted above, private insur-ance coverage is heavily influenced by the norms driven by Medicare coverage, so these reforms are likely to have systemwide spillover effects. It is natural to ask why private providers have not adopted ACOs or more bundled payments on their own. This remains a puzzle. One explanation is that it is a coordination problem—all insurers may want to adopt larger bundled payments, but no single insurer can make the transition. This is certainly consistent with the historical record on the adoption of prospective payment for hospital care. Once it was in-troduced in Medicare, private plans were quick to adopt it. Similarly, private hospitals were quick to use the federal government’s efforts to measure quality of care even though nothing stopped them from form-ing consortiums to measure quality before these federal efforts.
What might be the savings from these reforms? Some estimates would put the number at 20 percent to 30 percent of spending, but that assumes that low-cost regions are at the frontier. But even low-cost regions may not be producing efficiently. Medicare is expressly prohibited from selectively contracting with more efficient physi-cians. Growth in home-health care, outpatient visits, office visits and diagnostic testing—areas of care where reimbursements are based on volume and the “right rate” is not known—have exhibited very rapid growth in all areas. At least for home-health care, the additional spending appeared to have no impact on health outcomes (McKnight 2004). All of this suggests that we may save more than 30 percent if the right incentives are in place; Buntin and Cutler (2009) place the figure at more like 50 percent. It is worth reiterating, however, that
222 Katherine Baicker and Amitabh Chandra
some of the savings from lower quantities may be offset with higher prices as ACOs exert market power.
System reform such as ACOs may thus improve productive efficiency by reorganizing the delivery system. Capitated reimburse-ment can affect not just the level but the growth of spending through slowing the adoption (and innovation) of new medical technologies. But achieving allocative efficiency also requires carefully calibrated ACO payments and updates over time. Additional tools on the patient side can help promote allocative efficiency.
B. Patient-side incentives and insurance design
While insurance provides highly valuable protection against financial risk, it comes with traditional moral hazard: patients consume more health care when the cost is lower (Newhouse and The Insurance Experiment Group 1993). First-dollar private insur-ance is promoted by the tax code, as described above, and Medi-care’s inconsistent cost-sharing is undermined by the pervasiveness of wrap-around supplemental insurance. This promotes greater health-care consumption than allocatively efficient, and also interacts with provider-side incentives to undermine productive inefficiency by dampening the market discipline that price-sensitive consumers would provide.
Several policy proposals aim to increase the incentives for patients to consume only care that is sufficiently valuable to them, a key con-dition for allocative efficiency: it is necessary (but far from sufficient) that patients face the right price for the health care that they consume, balancing the increased health-care use from moral hazard with the financial protection that insurance provides. The tax exclusion for employer-sponsored health insurance pushes enrollees toward poli-cies with less cost-sharing than optimal. There is widespread support among economists for limiting this tax exclusion, even beyond the limited reform in the ACA (Gruber 2009). Other proposals include expanding the tax preference for high-deductible policies.
How might a demand-side approach affect the adoption or diffu-sion of new technology? There is some anecdotal evidence that higher out-of-pockets payments would dissuade high-income patients from
Aspirin, Angioplasty and Proton Beam Therapy: The Economics of Smarter Health-Care Spending 223
consuming cost-ineffective treatments, suggesting that cost-sharing could discourage some use of expensive and only marginally effec-tive technologies.7 More sophisticated approaches aim to impose dif-ferent cost-sharing for different patients and different procedures, based on the health value of the care. In most conventional models, cost-sharing should be based solely on the price elasticity of demand for health care (which governs the degree of moral hazard). For well-informed patients who are aware of marginal costs and benefits, this produces efficient use of care (Pauly and Blavin 2008). But mount-ing evidence from the behavioral economics literature suggests that patients may not always make optimal decisions about the use of ser-vices when faced with higher copayments and coinsurance.8 “Value-based” insurance plans aim to increase efficiency by imposing higher patient prices for lower-value care. Prices (or the degree of patient-cost sharing) could be set based on evidence from clinical trials, and could also vary based on patient characteristics. While this approach has been applied to lowering prices of high-value care with some suc-cess (for example, Chernew and others 2008), insurance plans that impose significant copayments for lower-value care are rare, perhaps because of the difficulty in determining the idiosyncratic benefit that a patient may attach to these services, and because of regulatory or legal barriers. Patient-side approaches thus have the potential to limit low-value spending, but require a more nuanced approach than seen thus far (Baicker and Goldman 2011).
Designing coordinated insurance plans such as ACOs may help pa-tients choose higher-value coverage and move toward allocative effi-ciency. ACOs could, for example, aim to attract patients with greater coverage of marginal medical technologies, higher quality, and broad-er provider networks, with patients responsible for the marginal cost of more generous policies (where the threshold is based on the value of alternative uses of funds). This is much broader than using cost-sharing to affect the choice of generic drugs versus formulary drugs, or a CT scan in a suburban shopping mall versus one in a hospital outpatient setting. Insights from the behavioral economics literature suggest that patients may be stymied by the cognitive demands of making many price comparisons, but choice may be facilitated by creating larger bundles for patients to choose among.
224 Katherine Baicker and Amitabh Chandra
C. Health-care and health-insurance markets
There are several features of the way health care and health in-surance are purchased that affect both providers and patients—and indeed the types of care and insurance products that are available—with implications for the efficiency of use of health resources. One popular explanation for inefficiency offered by physicians and pro-vider groups is that the medical malpractice environment provides massive disincentive for efficient use by fostering “defensive medicine,” with providers delivering more care than is socially optimal to avoid potential lawsuits. Such behaviors seem more likely in uncompetitive markets—otherwise if a given doctor provided more care without associated benefits, others could offer higher-value care that was more attractive to patients and insurers. The evidence on the magni-tude of defensive medicine, however, suggests that it is not a primary driver of higher health-care spending—accounting for less than 3 percent of health-care spending in the United States (Mello and oth-ers 2010). Nor is there a lot of evidence that areas with the great-est malpractice pressure provide the most care (Baicker, Fisher, and Chandra 2007). While malpractice reform is needed to ensure that the victims of negligence are compensated and that compensation is not paid to those who are not, more stringent damage caps or other reforms are not likely to result in first- or even second-order savings.
A more systemic issue is that provider and insurer market power can result in higher-than-competitive health insurance prices and pre-miums (Dafny, Duggan, and Ramanarayanan 2009; Dafny 2008). Market power does not affect productive efficiency per se, but could certainly affect allocative efficiency by increasing prices and reducing quantities relative to a competitive market. Enthusiasm for the poten-tial of ACOs to promote coordinated care must be moderated by their potential to increase market power, making antitrust enforcement even more important.
Perhaps the most important contribution that public policy could make to systemwide efficiency would be to generate more informa-tion—for both patients and providers—about what care is in fact
Aspirin, Angioplasty and Proton Beam Therapy: The Economics of Smarter Health-Care Spending 225
of high value (Weinstein and Skinner 2010). There is as yet little evidence on comparative effectiveness for a vast array of treatments: for example, we don’t know whether proton beam therapy offers any advantage over conventional approaches. Moreover, most drug stud-ies compare new drugs to placebos, rather than “head-to-head” with other drugs on the market, failing to generate evidence on which drug works best. One area where cost effectiveness analysis may prove to be particularly powerful is in evaluating the relative efficiency of different delivery systems and institutional organization (rather than the relative effectiveness of particular drugs or procedures)—such as drop-in clinics rather than emergency room care. Tiered networks, with greater cost-sharing for wider or less efficient networks, is one way to blend demand-side influences with supply-side reforms.
Because such information is a public good, it is underprovided by the market, and that suggests a role for government subsidization of trials. The trials required to ascertain effectiveness will be ex-pensive. At present, the NIH budget is just over $30 billion a year ($100 per person); we are devoting less than 1 percent of health-care resources to learning what works. Improving our knowledge of what works is a prerequisite for increasing productive efficiency and eliminating medical practices that are unsafe at any price or dominated by other treatments.
The challenge with effectiveness studies is not just how to under-take them, but also how to use the results to inform reimbursement or patient cost-sharing. Medicare is forbidden from using cost-ef-fectiveness analysis and, as long as this continues, simply providing more information on what works is unlikely to affect coverage and reimbursement decisions by private insurers. Effectiveness studies could still be used to design patient cost-sharing, but even with better demand-side incentives, government agencies must decide whether (and at what price) Medicaid and Medicare will cover new treat-ments, or how to adapt coverage and cost-sharing rules as the implic-it value of additional health benefits evolves over time. It is not clear how decisions about the size and growth of these large tax-financed government programs will be made. Tying their global budgets to
226 Katherine Baicker and Amitabh Chandra
GDP growth would restrain expenditures, but might not result in the optimal share of resources being devoted to public insurance ver-sus other responsibilities of government, such as education and de-fense versus private goods.
V. Conclusion
Technological advancement in medicine will continue to produce innovations that offer great benefit to some patients, but can easily be overused in others. It is imperative that health-care systems be designed to foster that innovation and promote its use in patients to whom high health benefits will accrue without incurring massive government debt to cover its use in patients with little or no benefit. “Solving” the fiscal imbalances in current public programs such as Medicare, by raising taxes or crudely cutting reimbursements, will not in and of itself improve the efficiency of the care that is delivered. The need for fundamental reforms is heightened by the demographic pressures of the aging baby boom generation, but arises more funda-mentally from the increasing cost of health benefits per person.
There is no single strategy that is likely to achieve efficient use of health resources. On the provider side, payments through public insurance programs can be bundled to encourage coordination, and providers can share in the financial gains of improving the efficiency with which they deliver care. On the patient side, more nuanced cost-sharing and leveling the playing field for higher-cost-sharing in-surance plans can encourage patient involvement in decision-making and the balancing of resources costs against health benefits, as well as fostering competition. Systemwide, better information is needed about which delivery systems—not just which drugs or procedures—are most effective.
The United States has yet to wrestle with the question of public policy priorities in a world of scarce resources: even with perfect pro-ductive efficiency, we cannot cover all services for all people. When public resources come at a cost of lower economic growth, there must be some explicit consideration of the value of redistribution, and the public priority placed on covering different levels of service for different parts of the population. By first ensuring that health-
Aspirin, Angioplasty and Proton Beam Therapy: The Economics of Smarter Health-Care Spending 227
care resources are used more productively, we will be in a much better position to move toward spending the “right” amount on health.
Katherine Baicker is a Professor at the Harvard School of Public Health. Amitabh Chandra is a Professor at the Harvard Kennedy School. Both are Research Associ-ates of the NBER. The authors thank Jonathan Skinner for invaluable collabora-tions and Jacob Robbins for expert research assistance. The work in this paper draws on Baicker and Chandra (2008), Baicker and Chandra (2010), Chandra, Jena and Skinner (2011) and Chandra and Skinner (2011).
228 Katherine Baicker and Amitabh Chandra
Endnotes1 David Cutler’s interpretation is somewhat different. He writes, “Money mat-
ters in health care as it does in few other industries. Where we have spent a lot, we have received a lot in return” (Cutler 2004).
2It is worth noting that much of the debate over health reform confused the concepts of health care and health insurance. Health insurance is of course fun-damentally about risk—it is valuable not just because health care is expensive, but because it is expensive and uncertain. Uninsured sick people do not need health insurance (once the illness is known it is no longer insurable), they need health care (Baicker and Chandra 2008). It is also important to acknowledge that many of the inputs into long-run health outcomes are independent of the health-care system —such as nutrition and exercise, smoking, and environmental hazards. The line between such inputs and preventive care is sometimes blurry (and of course not all care labeled preventive is, in fact, cost effective).
3In other countries, boards such England’s National Institute for Health and Clinical Excellence (NICE) explicitly use costs to determine coverage decisions. Typically, these rulings are limited to specific and discrete choices, for example whether specific drugs can be used for a specific disease. In practice, treatments with heterogeneous benefits are more difficult to classify under “cover/not cover” decision rules.
4Finkelstein and others (2011) use a novel experimental design to evaluate the effect of extending Medicaid coverage to previously uninsured adults. They find that expanding coverage increases the use of outpatient (including preventive) care, hospitalizations, and prescription drug use; reduces financial strain; and improves self-reported physical and mental health and well-being.
5Readers may be interested in the evolution of this number; our discussion is adapted from Jena, Chandra and Skinner (2011). The willingness to pay for a life year was initially based on a 1984 Canadian study of patients with end-stage kidney disease on dialysis. That study computed these costs at $50,000 per QALY (Winkelmayer, Weinstein, Mittleman, Glynn, and Pliskin 2002). Almost 30 years of inflation have increased it to $100,000 (Lee, Chertow, and Zenios 2009). Gar-ber and Phelps (2007) offer an alternative rationalization: an annual salary of $30,000 for a 40-hour workweek would lead to a value of a life-year of $100,000 if leisure time was priced at average market wages.
6Historically, the United States has not relied on quantity restrictions in health-care planning, except for sometimes ineffective certificate of need programs (Ho, Ku-Goto, and Jollis 2009). In theory, regional restrictions to discourage duplica-tion and overbuilding of surgical units, MRIs, and hospital or ICU beds could control unrestricted growth in procedures of questionable value. But this ap-proach to market-level quantity restrictions would require a tectonic shift in the U.S. regulatory and policy environment.
Aspirin, Angioplasty and Proton Beam Therapy: The Economics of Smarter Health-Care Spending 229
7One former corporate finance officer whose insurance covered the $93,000 pros-tate cancer drug Provenge was explicit about his willingness to pay: “ ‘I would not spend that money,’ because the benefit doesn’t seem worth it.” (Marchione 2010). Others have pointed out the difficulty of judging “true” demand for health care, particularly among those near the end of life (Becker, Murphy, and Philipson 2007).
8Most evidence suggests that health is not adversely affected by greater patient cost-sharing on average (Chandra, Gruber, and McKnight 2010; Newhouse and others 1993).
230 Katherine Baicker and Amitabh Chandra
References
Bach, Peter B. (2010). “A Map to Bad Policy—Hospital Efficiency Measures in the Dartmouth Atlas,” New England Journal of Medicine, 362:569-574.
Baicker, Katherine, and Amitabh Chandra (2004). “Medicare Spending, the Physician Workforce, and Beneficiaries’ Quality of Care,” Health Affairs, 23 (3):W4184-W4197.
________. (2008). “Myths and Misconceptions About U.S. Health Insurance,” Health Affairs, 27 (6):W533-W543.
________. (2010). “Uncomfortable Arithmetic—Whom to Cover Versus What to Cover,” New England Journal of Medicine, 362 (2):95-97.
Baicker, Katherine, E.S. Fisher, and Amitabh Chandra (2007). “Malpractice Li-ability Costs and the Practice of Medicine in the Medicare Program,” Health Affairs (Millwood), 26 (3):841-52.
Baicker, Katherine, and Amitabh Chandra (2006). “The Labor Market Effects of Rising Health Insurance Premiums,” Journal of Labor Economics, 24 (3):609-34.
Baicker, Katherine, and Dana Goldman (2011). “Patient Cost-Sharing and Healthcare Spending Growth,” Journal of Economic Perspectives, 25 (2):47-68.
Baicker, Katherine, and Helen Levy (2008). “Employer Health Insurance Man-dates and the Risk of Unemployment,” Risk Management and Insurance Review, 11 (1):109-132.
Baicker, Katherine, and Jonathan S. Skinner (2011). “Health Care Spending Growth and the Future of U.S. Tax Rates,” Tax Policy and the Economy.
Baker, L., and K. Corts (1996). “HMO Penetration and the Cost of Health Care: Market Discipline or Market Segmentation?” American Economic Review, 86 (2):389-394.
Baker, Laurence C. (1999). “Association of Managed Care Market Share and Health Expenditures for Fee-for-Service Medicare Patients,” Journal of the Amer-ican Medical Association, 281 (5):432-437.
Becker, Gary, Kevin Murphy, and Tomas Philipson (2007). “The Value of Life Near its End and Terminal Care,” NBER Working Paper.
Boards of Trustees of the Federal Hospital Insurance and Federal Supplemental Medical Insurance Trust Funds, The. (2011). Annual Report Of The Boards Of Trustees Of The Federal Hospital Insurance And Federal Supplementary Medical Insurance Trust Funds. Washington, D.C.: Government Printing Office.
Aspirin, Angioplasty and Proton Beam Therapy: The Economics of Smarter Health-Care Spending 231
Brenner, David J., and Eric J. Hall (2007). “Computed Tomography—An Increasing Source of Radiation Exposure,” New England Journal of Medicine, 357:2277-2284.
Buntin, Melinda, and David Cutler (2009). “The Two Trillion Dollar Solution: Saving Money by Modernizing the Health Care System,” Center for American Progress.
Cebul, Randall, James Rebitzer, Lowell Taylor, and Mark Votruba (2007). “Orga-nizational Fragmentation and Care Quality in the U.S. Health Care System,” Journal of Economic Perspectives, 22 (4):93-113.
Centers for Medicare and Medicaid Services (2010). “National Health Expendi-tures Accounts: Definitions, Sources, and Methods.”
Chandra, A., J. Gruber, and R. McKnight (2010). “Patient Cost-Sharing and Hos-pitalization Offsets in the Elderly,” American Economic Review, 100 (1):193-213.
Chandra, Amitabh, and Jonathan S. Skinner (2011). “Technology Growth and Expenditure Growth in Health Care,” NBER Working Paper, 16953.
Chandra, Amitabh, and Douglas O. Staiger (2007). “Productivity Spillovers in Health Care: Evidence from Treatments of Heart Attacks,” Journal of Political Economy, 115 (1):103-140.
Chernew, M.E., K. Baicker, and J. Hsu (2010). “The Specter of Financial Arma-geddon—Health Care and Federal Debt in the United States,” New England Journal of Medicine, 362 (13):1166-1168.
Congressional Budget Office (2007). “Financing Projected Spending in the Long Run: Letter to Senator Gregg from Peter Orszag.”
__________. (2011). “The Long-Term Budget Outlook.” Washington, D.C.
Currie, Janet, and Brigitte Madrian (2000). “Health, Health Insurance and the Labor Market,” In Handbook of Labor Economics, edited by O. Ashenfelter and D. Card. Amsterdam: Elsevier Science.
Cutler, D.M., A.B. Rosen, and S. Vijan (2006). “The Value of Medical Spending in the United States, 1960-2000,” New England Journal of Medicine, 355 (9):920-7.
Cutler, David (2010). “How Health Care Reform Must Bend the Cost Curve,” Health Affairs, 29 (6):1131-1135.
Cutler, David, Angus Deaton, and Adriana Lleras-Muney (2006). “The Determinants of Mortality,” Journal of Economic Perspectives, 20 (3):97-120.
Cutler, David, and Dan Ly (2011). “The (Paper)Work of Medicine: Understanding International Medical Costs,” Journal of Economic Perspectives, 25 (2):3-25.
232 Katherine Baicker and Amitabh Chandra
Cutler, David, and Brigitte Madrian (1998). “Labor Market Responses to Rising Health Insurance Costs: Evidence on Hours Worked,” RAND Journal of Economics, 29 (3):509-530.
Dafny, Leemore (2008). “Are Health Insurance Markets Competitive?” NBER Working Paper, 14572.
Dafny, Leemore, Mark Duggan, and Subramaniam Ramanarayanan (2009). “Pay-ing a Premium on Your Premium? Consolidation in the U.S. Health Insurance Industry,” NBER Working Paper, 15434.
DeNavas-Walt, Carmen, Bernadette D. Proctor, and Jessica C. Smith (2010). “In-come, Poverty, and Health Insurance Coverage in the United States: 2009,” edited by U.S. Census Bureau, Washington, D.C.: U.S. Government Printing Office.
Engen, Eric M., and Jonathan S. Skinner (1996). “Taxation and Economic Growth,” National Tax Journal :617-42.
Feldstein, Martin (1973). “The Welfare Loss of Excess Health Insurance,” Journal of Political Economy, 81 (2):251-80.
__________. (1999). “Tax Avoidance and the Deadweight Loss of the Income Tax,” Review of Economics and Statistics, 81 (4):674-680.
__________. (2006). “The Effect of Taxes on Efficiency and Growth. Disserta-tion/Thesis,” NBER Working Paper.
Ferguson, John H., Michael Dubinsky, and Peter Kirsch (1993). “Court-Ordered Re-imbursement for Unproven Medical Technology,” JAMA, 269 (16):2116-2121.
Finkelstein, A., S. Taubman, B. Wright, M. Bernstein, J. Gruber, J. Newhouse, H. Allen, and K. Baicker (2011). “The Oregon Health Insurance Experiment: Evidence from the First Year,” NBER Working Paper, 17190.
Finkelstein, Amy (2007). “The Aggregate Effects of Health Insurance: Evidence from the Introduction of Medicare,” Quarterly Journal of Economics, 122 (1):1-37.
Fisher, E.S., D.E. Wennberg, T.A. Stukel, and D.J. Gottlieb (2004). “Variations in the Longitudinal Efficiency of Academic Medical Centers,” Health Affairs (Millwood) Suppl Web Exclusive:VAR19-32.
Fisher, Elliott S., David E. Wennberg, Therese A. Stukel, Daniel J. Gottlieb, F. Lee Lucas, and E.L. Pinder (2003). “The Implications of Regional Variation in Medicare Spending. Part 1: the Content, Quality and Accessibility of Care,” Annals of Internal Medicine, 138 (4):273-87.
__________. (2003). “The Implications of Regional Variation in Medicare Spending. Part 2: Health Outcomes and Satisfaction with Care,” Annals of In-ternal Medicine, 138 (4):288-98.
Aspirin, Angioplasty and Proton Beam Therapy: The Economics of Smarter Health-Care Spending 233
Fogel, Robert (2008). “Forecasting the Cost of U.S. Health Care in 2040,” NBER Working Paper, 14361.
Ford, Earl S. , Umed A. Ajani, Janet B. Croft, Julia A. Critchley, Darwin R. Lab-arthe, Thomas E. Kottke, Wayne H. Giles, and Simon Capewell (2007). “Ex-plaining the Decrease in U.S. Deaths from Coronary Disease, 1980–2000,” New England Journal of Medicine, 356:2388-2398.
Frank, Richard G., and R.P. Zeckhauser (2007). “Custom Made Versus Ready to Wear Treatments: Behavioral Propensities in Physicians Choices,” Journal of Health Economics, 26:1101-1127.
Fuhrmans, Vanessa (2007). “Withdrawal Treatment: A Novel Plan Helps Hospital Wean Itself Off Pricey Tests,” The Wall Street Journal.
Fullerton, Don, and Yolanda Kodrzycki Henderson (1989). “The Marginal Excess Burden of Different Capital Tax Instruments,” Review of Economics and Statis-tics, 71 (3):435-442.
Gahvari, Firouz (2006). “On the Marginal Cost of Public Funds and the Optimal Provision of Public Goods,” Journal of Public Economics, 90 (6-7):1251-1262.
Garber, Alan M., and Jonathan S. Skinner (2008). “Is American Health Care Uniquely Inefficient?” Journal of Economic Perspectives, 22 (4):27-50.
Gawande, Atul (2009). “The Cost Conundrum,” The New Yorker.
Getzen, T.E. (1992). “Population Aging and the Growth of Health Expenditures,” Journal of Gerontology, 17:S98-104.
Glied, S., and J. Zivin (2002). “How Do Doctors Behave When Some (But Not All) of Their Patients Are In Managed Care?” Journal of Health Economics, 21:337-353.
Hall, Robert E., and Charles I. Jones (2007). “The Value of Life and the Rise in Health Spending,” Quarterly Journal of Economics, 122 (1):39-72.
Ho, Vivian, Meei-Hsiang Ku-Goto, and James G. Jollis (2009). “Certificate of Need (CON) for Cardiac Care: Controversy over the Contributions of CON,” Health Services Research, 44 (2):483-500.
Kaiser Family Foundation, and Health Research and Education Trust (2008). “Employer Health Benefits 2008 Survey,” Menlo Park, Calif.
Kogan, R., K. Cox, and J. Horney (2008). “The Long-Term Fiscal Outlook is Bleak: Restoring Fiscal Sustainability will Require Major Changes to Programs, Revenues, and the Nation’s Health Care System,” Center on Budget and Policy Priorities.
Madrian, Brigitte (1994). “Employment-Based Health Insurance and Job Mobility: Is There Evidence of Job-Lock?” Quarterly Journal of Economics, 109 (1):27-54.
234 Katherine Baicker and Amitabh Chandra
Marchione, Marilynn (2010). “$93,000 Cancer Drug: How Much is a Life Worth?” Available from http://www.cbsnews.com/stories/2010/09/27/health/main6905221.shtml.
McKnight, Robin Lynn (2004). “Home Care Reimbursement, Long-Term Care Utili-zation, and Health Outcomes,” Journal of Public Economics, 90 (1-2):293-323.
Mello, Michelle, Amitabh Chandra, Atul Gawande, and David Studdert (2010). “Na-tional Costs of the Medical Liability System,” Health Affairs, 29 (9):1569-1577.
Murphy, Kevin M., and Robert H. Topel (2006). “The Value of Health and Lon-gevity,” Journal of Political Economy, 114 (5):871-904.
Newhouse, Joseph P., Elizabeth M. Sloss, Willard Manning, and Emmett B. Keeler (1993). “Risk Adjustment for a Children’s Capitation Rate,” Health Care Financ-ing Review, 15 (1):39-54.
Newhouse, Joseph P., and The Insurance Experiment Group (1993). Free for all? Lessons from the RAND Health Insurance Experiment, A RAND Study, Cam-bridge and London: Harvard University Press.
Ong, M.K., C.M. Mangione, P.S. Romano, Q. Zhou, A. Auerbach, A. Chun, B.N. Davidson, T. Ganiats, S. Greenfield, M.A. Gropper, S. Malik, J. Rosenthal, and J.J. Escarce (2009). “Looking Forward, Looking Back: Assessing Variations in Hospital Resource Use and Outcomes for Elderly Patients with Heart Failure,” Circulation Cardiovascular Quality and Outcomes, 2:548-557.
Pauly, M.V., and F.E. Blavin (2008). “Moral Hazard in Insurance, Value-Based Cost Sharing, and the Benefits of Blissful Ignorance,” Journal of Health Econom-ics, 27 (6):1407-17.
Peterson, Chris L., and Rachel Burton (2007). “U.S. Health Care Spending: Com-parison with Other OECD Countries,” edited by C.R. Service, Washington, D.C.
Romley, John A., Anupam B. Jena, and Dana P. Goldman (2011). “Hospital Spending and Inpatient Mortality: Evidence From California,” Annals of Inter-nal Medicine, 154:160-167.
Silber, Jeffrey H., Robert Kaestner, Orit Even-Shoshan, Yanli Wang, and Laura J. Bressler (2010). “Agressive Treatment Style and Surgical Outcomes,” Health Services Research 25 (6):1872-1892.
Skinner, J.S., D.O. Staiger, and E.S. Fisher (2006). “Is Technological Change in Medicine Always Worth It? The Case of Acute Myocardial Infarction,” Health Affairs (Millwood), 25 (2):w34-47.
Skinner, Jonathan, and Douglas Staiger (2009). “Technology Diffusion and Pro-ductivity Growth in Health Care,” NBER Working Paper, 14865.
Aspirin, Angioplasty and Proton Beam Therapy: The Economics of Smarter Health-Care Spending 235
Summers, Lawrence (1989). “Some Simple Economics of Mandated Benefits,” American Economic Review, 79 (2):177-183.
U.S. Senate (2008). Senate Finance Committee. Chief of Staff, Joint Committee on Taxation. July 30, 2008.
Weinstein, Milton C., and Jonathan S. Skinner (2010). “Comparative Effectiveness and Health Care Spending—Implications for Reform,” New England Journal of Medicine, 362:460-465.
Weisbrod, Burton A. (1991). “The Health Care Quadrilemma: An Essay on Technological Change, Insurance, Quality of Care, and Cost Containment,” Journal of Economic Literature, 29 (2):523-552.
Wennberg, J.E., M.M. Cooper, and Dartmouth Atlas of Health Care Working Group (2011). The Dartmouth Atlas of Health Care 2011. Chicago: American Hospital Publishing.
Yasaitis, Laura, Elliott S. Fisher, Jonathan S. Skinner, and Amitabh Chandra (2009). “Hospital Quality and Intensity of Spending: Is There an Association?” Health Affairs, 28 (4):566-572.