Assessing Alternatives for Mitigating Net Greenhouse Gas Emissions and Increasing Yields from Rice Production in China Over the Next 20 Years Changsheng Li 1 , William Salas 2 , Benjamin DeAngelo 3 , and Steven Rose 3 1 Complex Systems Research Center, University of New Hampshire, - PowerPoint PPT Presentation
essing Alternatives for Mitigating Net Greenhouse G missions and Increasing Yields from Rice Production in China Over the Next 20 Years Changsheng Li 1 , William Salas 2 , Benjamin DeAngelo 3 , and Steven Rose 3 1 Complex Systems Research Center, University of New Hampshire, Durham, NH, 03824 2 Applied Geosolutions, LLC, Durham, NH 03824 3 Climate Change Division, Office of Atmospheric Programs, U.S. Environmental Protection Agency
Transcript
Assessing Alternatives for Mitigating Net Greenhouse Gas Emissions and Increasing Yields from Rice Production
in China Over the Next 20 Years
Changsheng Li1, William Salas2, Benjamin DeAngelo3, and Steven Rose3
1Complex Systems Research Center, University of New Hampshire, Durham, NH, 03824
Note: Any change in the two factors will also affect SOC dynamics and N2O emissions.
Observed and modeled CH4 and N2O fluxes from paddy with mid-season drainings, Jiangsu Province, China, 1997
(field data from Zheng et al. 1999)
0
0.5
1
1.5
2
2.5
3
160 180 200 220 240 260 280
field N2O
DNDC N2O
field CH4
DNDC CH4
kg C or N/ha/day
day of 1997
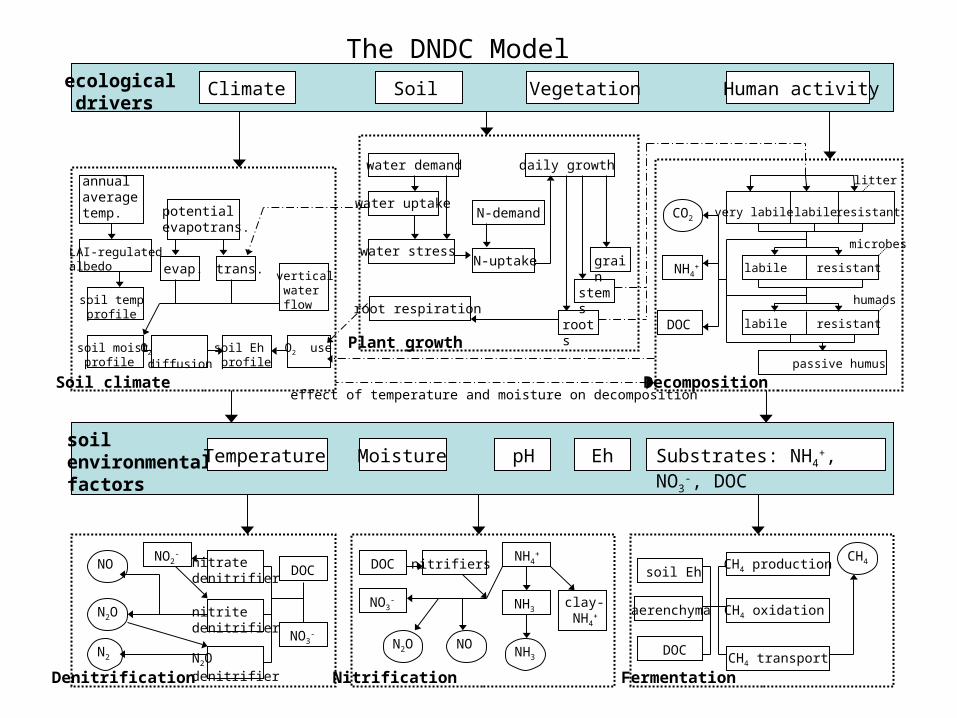
The DNDC Modelecological drivers
Climate Soil Vegetation Human activity
soil environmentalfactors
Temperature Moisture pH Substrates: NH4+, NO3
-, DOCEh
Denitrification Nitrification Fermentation
Decomposition
Plant growth
Soil climate
NH4+
clay- NH4
+NH3
DOC nitrifiers
NO3-
N2O NONH3
DOC
NO3-
NO
N2O
N2
NO2-
nitrate denitrifier
nitrite denitrifier
N2O denitrifier
CH4CH4 production
CH4 oxidation
CH4 transport
soil Eh
aerenchyma
DOC
soil temp profile
soil moist profile
soil Eh profile
O2
diffusionO2 use
vertical water flow
very labile labile resistant
litter
labile resistant
labile resistant
microbes
humads
passive humus
CO2
DOC
NH4+
roots
stems
grain
N-demand
N-uptake
water demand
water uptake
water stress
daily growth
root respiration
potentialevapotrans.
LAI-regulatedalbedo evap. trans.
effect of temperature and moisture on decomposition
annual averagetemp.
A regional prediction for China from 2000-2020:
Baseline management scenario:
-Crop yield increases at rate of 1% per year (matching IFPRI projections)
-Rice area remains fixed over time (IFPRI projects decline, with regional variation)
-Crop residue incorporation increases from 15% to 50% in 2000-2010; rice straw is amended at rate 1000 kg C/ha at early season; no animal manure is applied
-Urea and ammonium bicarbonate are used at rate 140 kg N/ha per crop season
-80% rice paddies are under midseason drainage
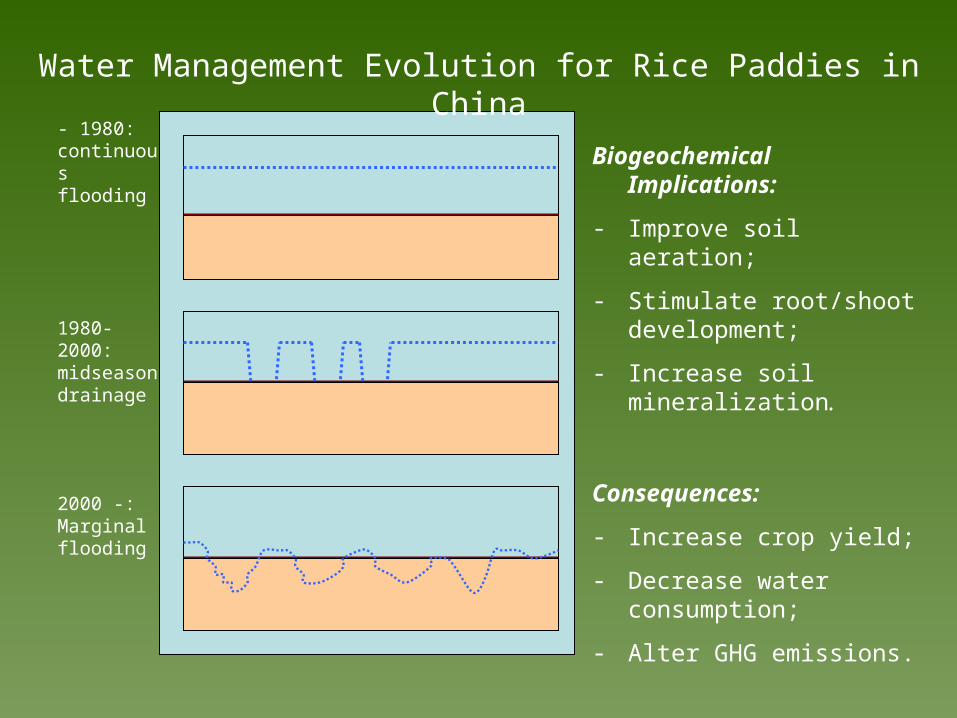
Biogeochemical Implications:
- Improve soil aeration;
- Stimulate root/shoot development;
- Increase soil mineralization.
Consequences:
- Increase crop yield;
- Decrease water consumption;
- Alter GHG emissions.
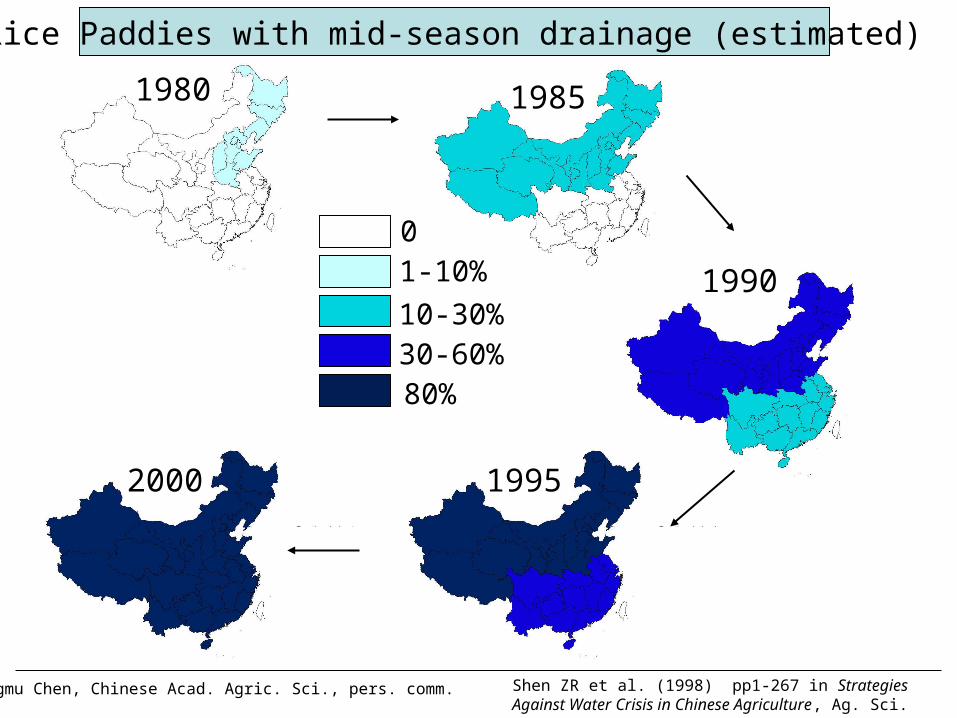
Water Management Evolution for Rice Paddies in China
- 1980: continuous flooding
1980-2000: midseason drainage
2000 -: Marginal flooding
A regional prediction for China from 2000-2020:
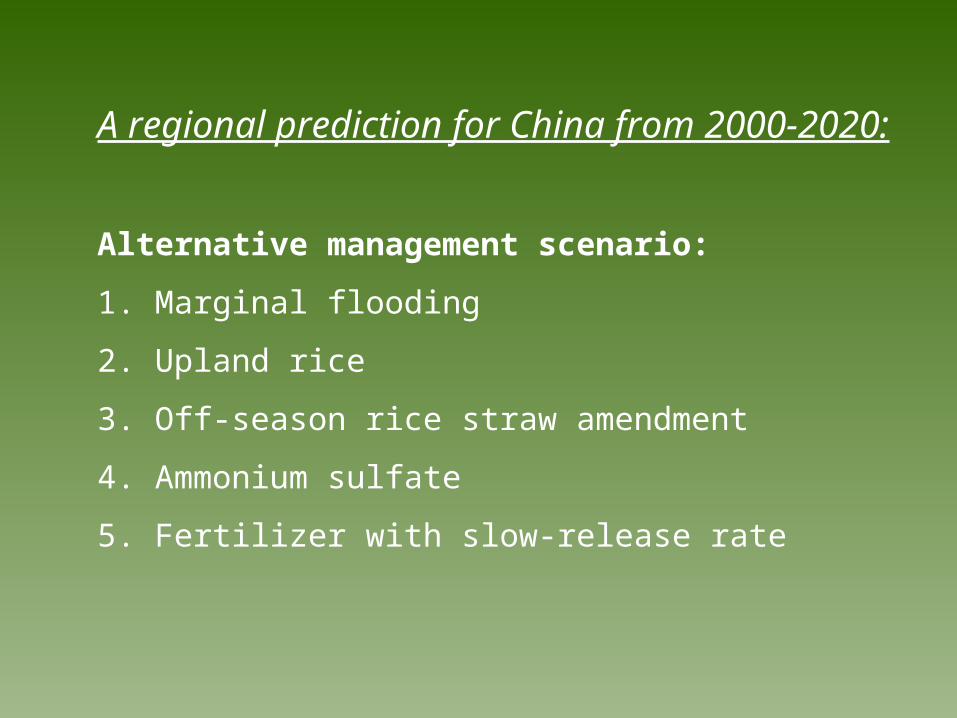
Alternative management scenario:
1. Marginal flooding
2. Upland rice
3. Off-season rice straw amendment
4. Ammonium sulfate
5. Fertilizer with slow-release rate
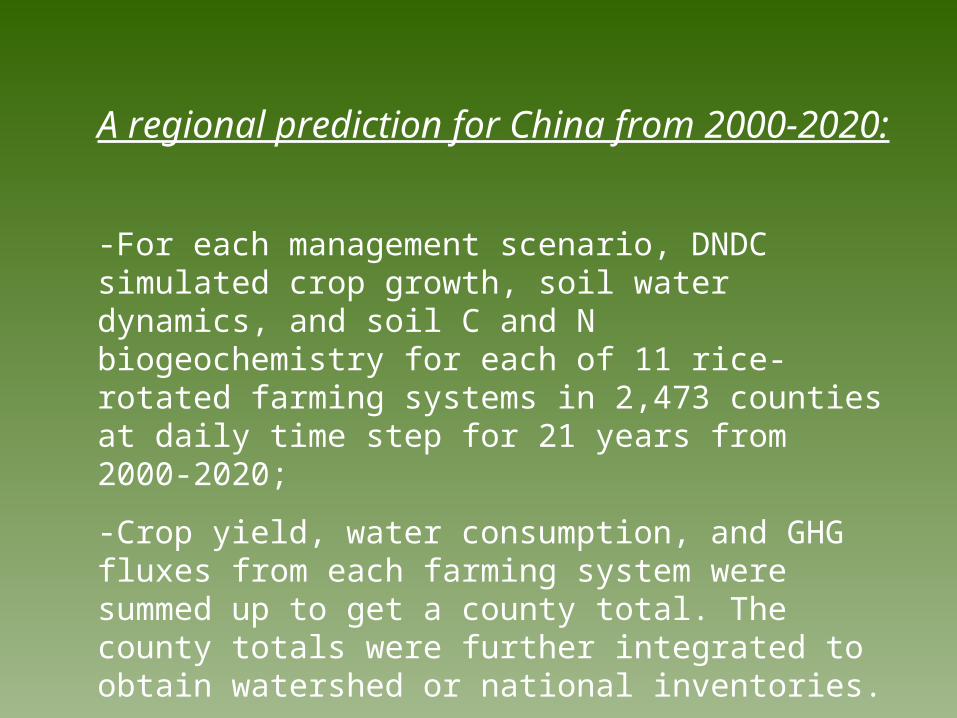
A regional prediction for China from 2000-2020:
-For each management scenario, DNDC simulated crop growth, soil water dynamics, and soil C and N biogeochemistry for each of 11 rice-rotated farming systems in 2,473 counties at daily time step for 21 years from 2000-2020;
-Crop yield, water consumption, and GHG fluxes from each farming system were summed up to get a county total. The county totals were further integrated to obtain watershed or national inventories.
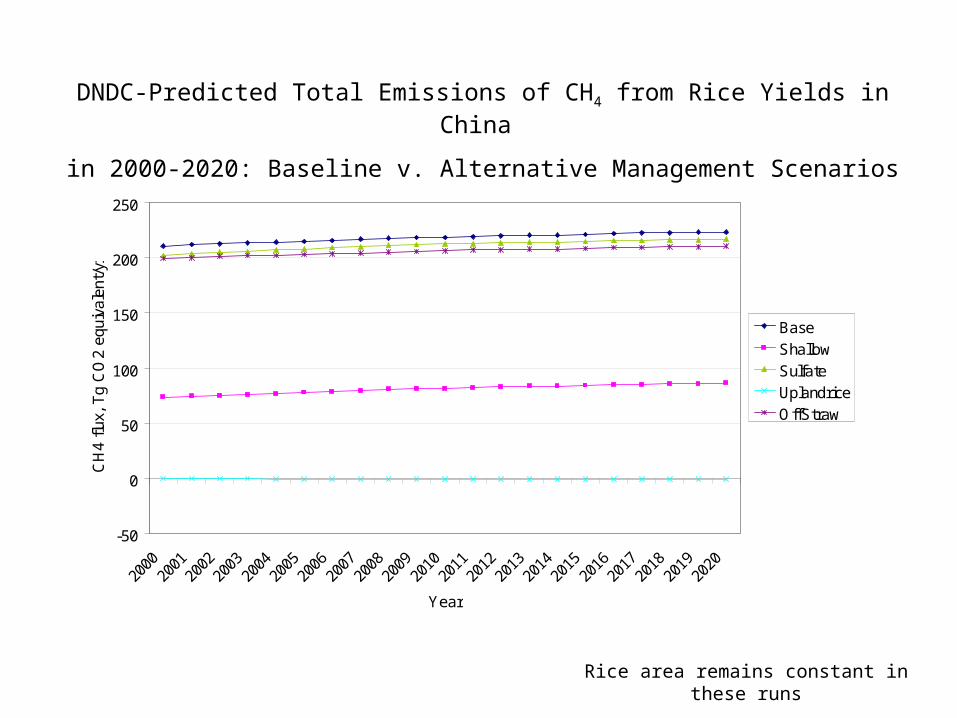
DNDC-Predicted Total Emissions of CH4 from Rice Yields in China
in 2000-2020: Baseline v. Alternative Management Scenarios
Rice area remains constant in these runs
-50
0
50
100
150
200
250
2000
2001
2002
2003
2004
2005
2006
2007
2008
2009
2010
2011
2012
2013
2014
2015
2016
2017
2018
2019
2020
Year
CH
4 flu
x, T
g C
O2
equi
vale
nt/y
r
Base
Shallow
Sulfate
Uplandrice
OffStraw
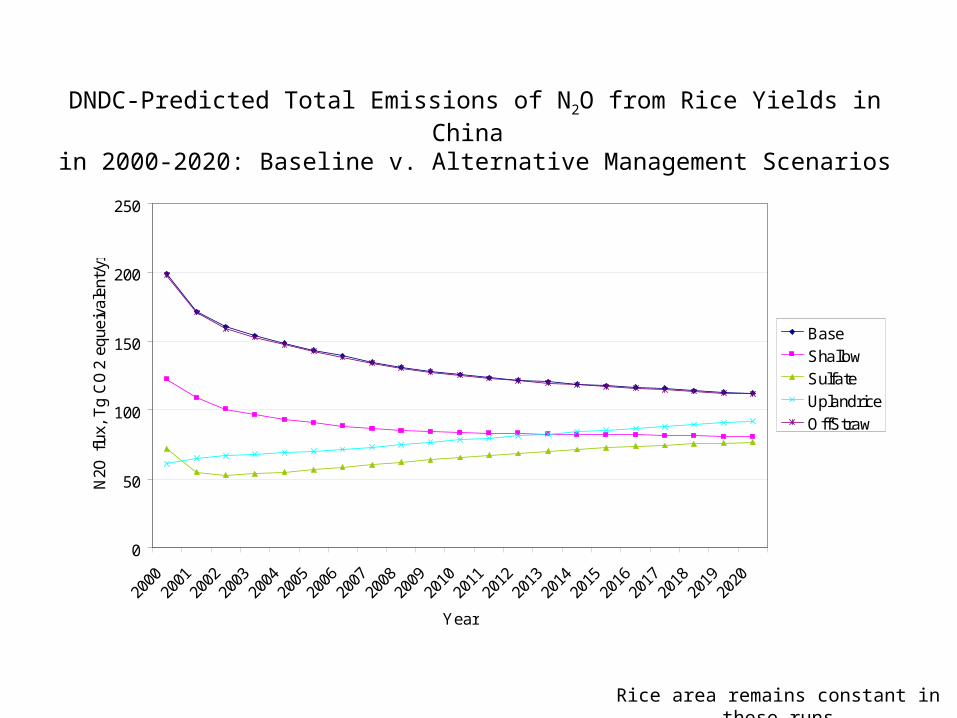
DNDC-Predicted Total Emissions of N2O from Rice Yields in China in 2000-2020: Baseline v. Alternative Management Scenarios
Rice area remains constant in these runs
0
50
100
150
200
250
2000
2001
2002
2003
2004
2005
2006
2007
2008
2009
2010
2011
2012
2013
2014
2015
2016
2017
2018
2019
2020
Year
N2O
flu
x, T
g C
O2
eque
ival
ent/
yr
Base
Shallow
Sulfate
Uplandrice
OffStraw
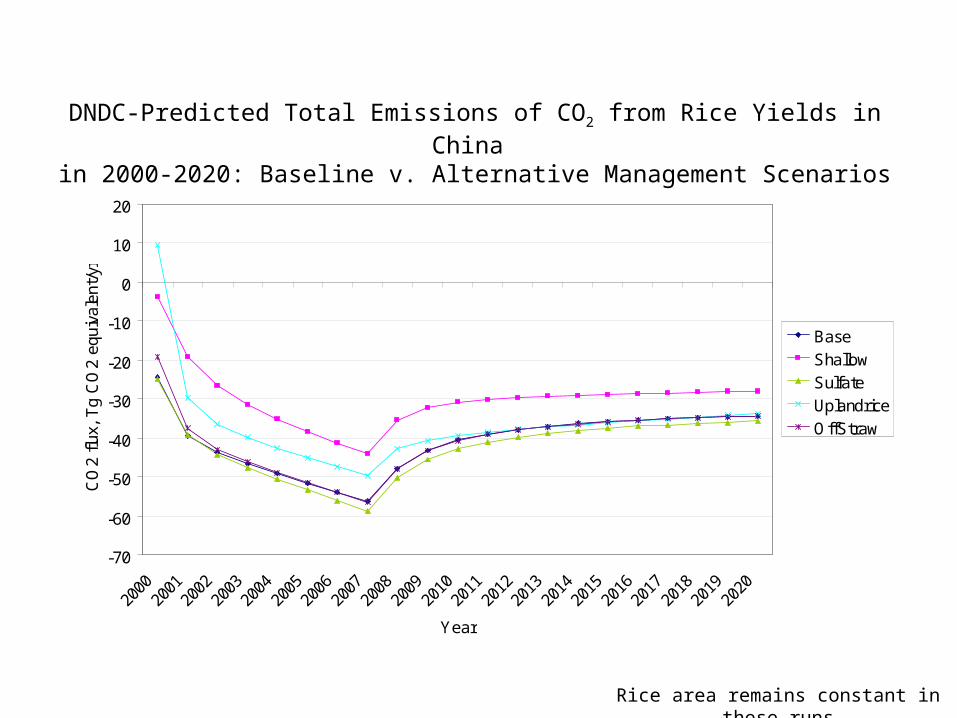
DNDC-Predicted Total Emissions of CO2 from Rice Yields in China in 2000-2020: Baseline v. Alternative Management Scenarios
Rice area remains constant in these runs
-70
-60
-50
-40
-30
-20
-10
0
10
20
2000
2001
2002
2003
2004
2005
2006
2007
2008
2009
2010
2011
2012
2013
2014
2015
2016
2017
2018
2019
2020
Year
CO
2 flu
x, T
g C
O2
equi
vale
nt/y
r
Base
Shallow
Sulfate
Uplandrice
OffStraw
DNDC-Predicted National GWP of Rice Yields in China in 2000-2020: Baseline v. Alternative Management Scenarios
Rice area remains constant in these runs
0
50
100
150
200
250
300
350
400
2000
2001
2002
2003
2004
2005
2006
2007
2008
2009
2010
2011
2012
2013
2014
2015
2016
2017
2018
2019
2020
Year
GW
P,
Tg
CO
2 eq
uiva
lent
/yr
Base
Shallow
Sulfate
Uplandrice
OffStraw
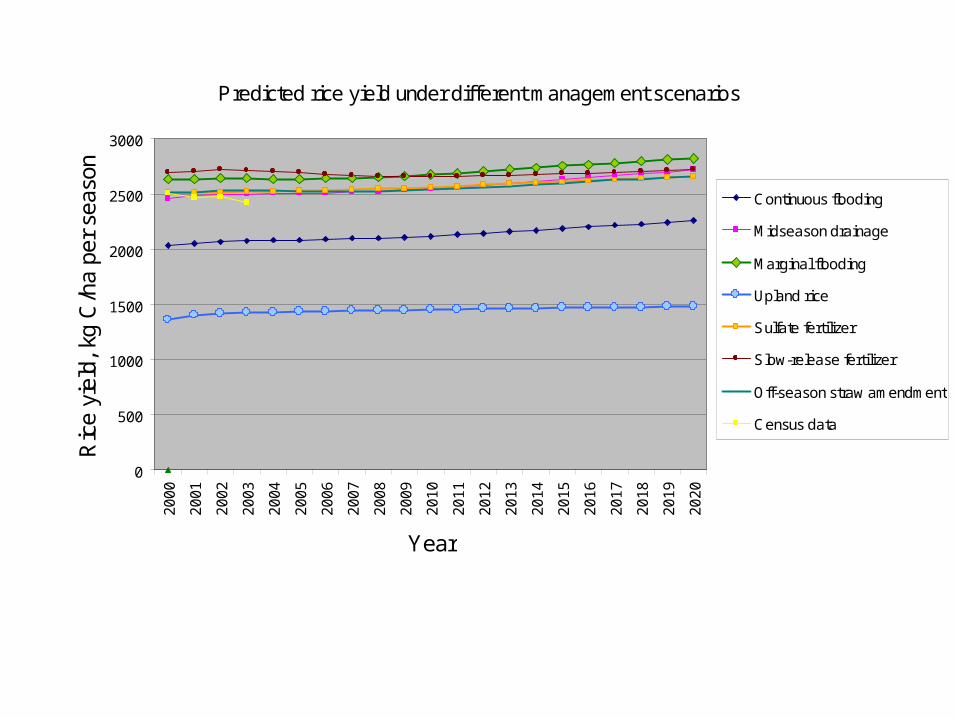
Predicted rice yield under different management scenarios
0
500
1000
1500
2000
2500
3000
20
00
20
01
20
02
20
03
20
04
20
05
20
06
20
07
20
08
20
09
20
10
20
11
20
12
20
13
20
14
20
15
20
16
20
17
20
18
20
19
20
20
Year
Ric
e yi
eld,
kg
C/h
a pe
r se
ason
Continuous flooding
Midseason drainage
Marginal flooding
Upland rice
Sulfate fertilizer
Slow-release fertilizer
Off-season straw amendment
Census data
Rice field water demand under different management conditions
0
200
400
600
800
1000
1200
Continuousflooding
Midseasondrainage
Shallowflooding
Upland rice 20% yieldincrease
Sulfatefertilizer
Wat
er d
eman
d, m
m w
ater
/yr
Transpiration
Evapotranspiration
Baseline
-5000
0
5000
10000
15000
20000
25000
Continuousflooding
Midseasondrainage
Shallowflooding
Upland rice Sulfate Offseasonstraw
Slowfertilizer
kg C
O2
equi
vale
nt o
r dr
y m
atte
r/ha
CO2
CH4
N2O
Yield
-5000
0
5000
10000
15000
20000
25000
kg C
O2 e
qu
ivale
nt
or
dry
matt
er/
ha
CO2
CH4
N2O
Yield
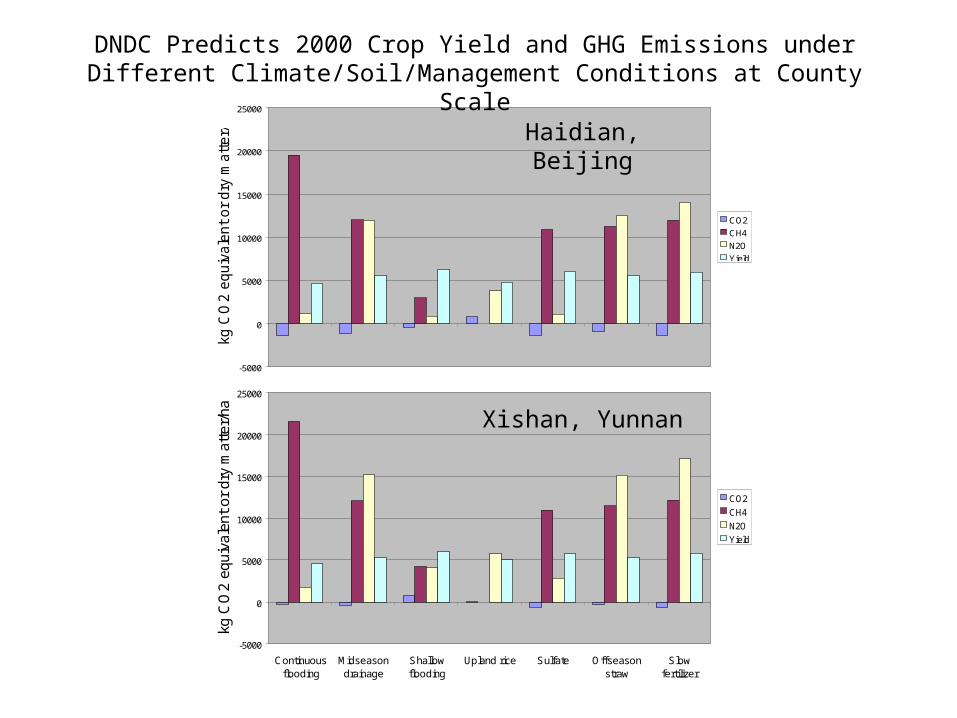
DNDC Predicts 2000 Crop Yield and GHG Emissions under Different Climate/Soil/Management Conditions at County Scale
Haidian, Beijing
Xishan, Yunnan
Discussion:
1. Results indicate 2000 net GHG level can be further reduced by 20-80%
2. Based on net GWP calculations, effectiveness order of alternatives:
• upland rice
• shallow flooding
• sulfate fertilizer
• off-season straw amendment
3. Change in water management showed to be most effective in reducing both CH4 and N2O.
4. Shallow flooding decreased CH4 by 1/2 and N2O by 1/3. Upland rice eliminated CH4 and reduced N2O by 1/3. The two options slightly decreased soil C sequestration rates by <20 Tg CO2 eq/yr.
• Shallow flooding & upland rice significantly reduced water consumption.
• Alternative water management practices mainly affected surface water and soil evaporation while plant physiological demand for water (i.e., transpiration) basically remained unchanged.
• This study adopted 1990 climate data for all simulated 21 years -- no significant inter-annual variations in water consumption observed. Effect of inter-annual yield increase on field water consumption was relatively small.