Master course on CCS, University of Zagreb 6-7 May, 2011 CO2 storage in subsurface reservoirs 1 Assessing Carbon Capture and Storage (CCS) value chains May 6 th , 2011 Chain units: subsurface storages Slide 2 6-7 May 2011, CCS master course University of Zagreb CO 2 value chain Slide 3 6-7 May 2011, CCS master course University of Zagreb Ref: www.sintef.no/ecco Slide 4 6-7 May 2011, CCS master course University of Zagreb Transport Pipeline Ship Source Industry Power Plant Storage / Sinks Buffer Geology Pipeline 1 Pipeline 4 Pipelin e 5 Pipeline 3 Define Network / Components / Contracts Power Plant w/ Capture EOR Field Pipeline 2 Steel Mill w/ Capture DGF 1-n The Network can build-out with time as components are added ECCO tool: integrated technical/economical CCS evaluation tool Contracts C 1-n TSO 1-n SO 1-n Tool output: Tech KPIs DCF-KPIs Planning charts EUA price Cost indices Govt matching funds req’d Initially LT contracts? Later, more ST? Slide 5 6-7 May 2011, CCS master course University of Zagreb Subsurface chain units (storage) Oil Fields - CO2-EOR: Enhanced Oil Recovery through CO2 injection - Potential incremental recovery 5-10 + % of STOIIP - EOR on top of / concurrent with primary recovery operations Depleted Gas Fields - Subsequent to gas production operations - DGF at abandonment pressure (10-50 bar) - CO2 injection to re-fill pore space up to original pressure Aquifers - Usually, little information (sealingness etc) - Undepleted pressure: high injection back pressure - Geochemical issues, brine displacement, storage capacity → EGR Slide 6 6-7 May 2011, CCS master course University of Zagreb Storage by means of CO2-EOR High pressure. Steady-state injection. Injectivity remains ≈ constant as reservoir is filled with CO 2 .
Transcript
Master course on CCS, University of Zagreb
6-7 May, 2011
CO2 storage in subsurface reservoirs 1
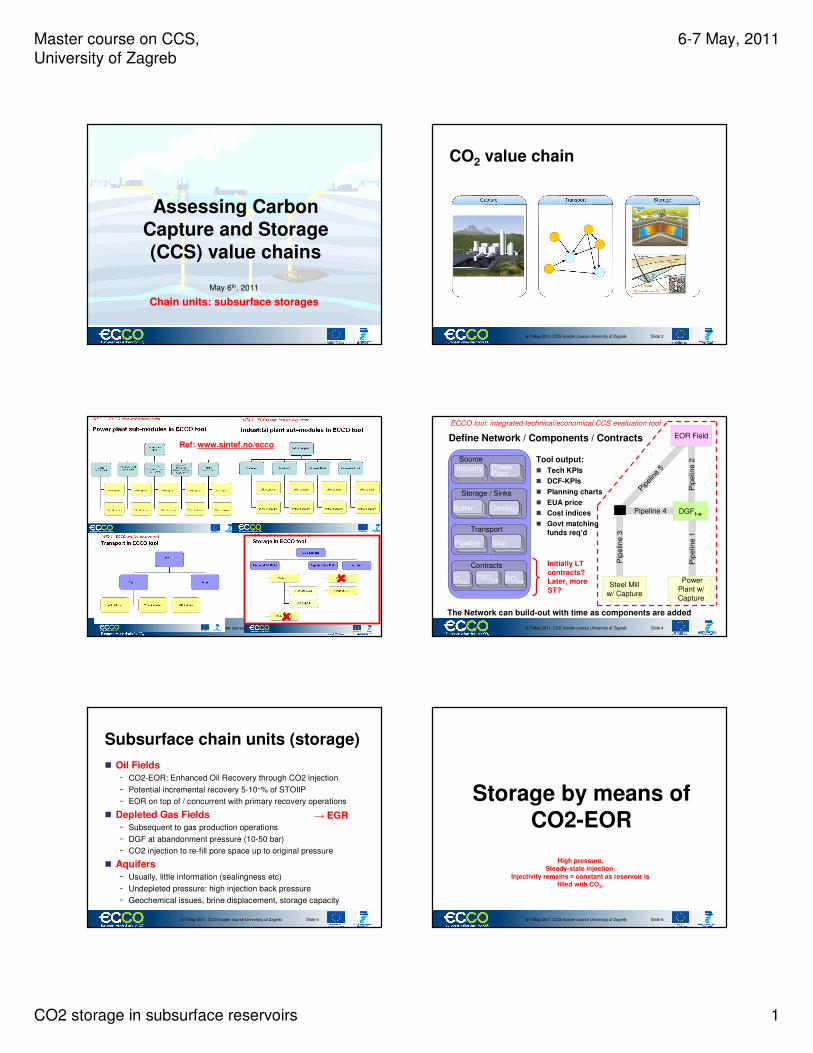
Assessing Carbon Capture and Storage (CCS) value chains
May 6th, 2011
Chain units: subsurface storages
Slide 26-7 May 2011, CCS master course University of Zagreb
CO2 value chain
Slide 36-7 May 2011, CCS master course University of Zagreb
Ref: www.sintef.no/ecco
����
����Slide 46-7 May 2011, CCS master course University of Zagreb
Transport
Pipeline Ship
Source
Industry Power Plant
Storage / Sinks
Buffer Geology
Pip
elin
e 1
Pipeline 4
Pip
elin
e 5
Pip
elin
e 3
Define Network / Components / Contracts
Power Plant w/ Capture
EOR Field
Pip
elin
e 2
Steel Mill w/ Capture
DGF1-n
The Network can build-out with time as components are added
Slide 66-7 May 2011, CCS master course University of Zagreb
Storage by means ofCO2-EOR
High pressure.Steady-state injection.
Injectivity remains ≈ constant as reservoir is filled with CO2.
Master course on CCS, University of Zagreb
6-7 May, 2011
CO2 storage in subsurface reservoirs 2
Slide 76-7 May 2011, CCS master course University of Zagreb
Typical production history oil field
Slide 86-7 May 2011, CCS master course University of Zagreb
Window of Opportunity
Typical field annual oil production curve as a percentage of maximum rate showing CO2-EOR window of opportunity
Slide 96-7 May 2011, CCS master course University of Zagreb
Principles CO2 enhanced oil recovery (1)
� Immiscible CO2 flooding
− Below minimum miscibility pressure (MMP)
− Partitioning CO2 in oil phase > swelling > lowering viscosity
Viscous oil :
− For pressures > 80 Bar (steam injection too expensive)
− CO2 net use: 0.15-0.26 ton/bbl.
� Miscible CO2 flooding
− Above the MMP, CO2 extracts/puts lighter components in the oil.
− Mixtures miscible with original oil: interfacial tension reduces to zero.
− CO2 net use 0.30-0.52 ton/bbl.
shallow
deeper
Slide 106-7 May 2011, CCS master course University of Zagreb
Physical principles of CO2-EOR (2)
� Dissolution of CO2 in oil, resulting in − Swelling of oil (expansion drive)− Reduced viscosity of oil (higher rates at given ∆P)
� Reduction of oil/water interfacial tension (IT)− Reduction of irreducible (residual) oil saturation Sor
− Microscopic displacement efficiency is enhanced� Less energy required for deformation of droplets through pore-throats
� Vaporising of light HC-components into CO2 phase + condensing into heavier oil
− This enhances overall miscibility
� Above effects are a function of Pr, Tr, oil composition, water salinity, rock properties, etc
Immiscible
Miscible
Miscible
Slide 116-7 May 2011, CCS master course University of Zagreb
∆∆∆∆IT results in higher krow end-point
� CO2 reduces IT between oil and water
� Rel perm end-point to oil becomes higher
Swc=0.2krw=0
Swc=0.65kro=0 Swc=0.75
kro=0
Slide 126-7 May 2011, CCS master course University of Zagreb
CO2-EOR technical feasibility (1)
� Primarily: miscibility of CO2 in oil. Transition point. − Depends on type of oil, on P and T of reservoir. See XL file
CO2-EOR Minimum Miscibility Pressure
as a function of the C5+ Molecular Weight of the crude oil
and of the reservoir temperature(ref Holtz et al. correlation)
ECCO; M =254
0
100
200
300
400
500
600
700
800
900
1000
0 50 100 150 200 250 300 350 400
Reservoir temperature (?C)
MM
P (b
ar)
MW C5+ = 340
MW C5+ = 300
MW C5+ = 280
MW C5+ = 260
MW C5+ = 220
MW C5+ = 200
MW C5+ = 180
MW C5+ = 160
ECCO; M =254
Reservoir MMP
Regional P vs T
Master course on CCS, University of Zagreb
6-7 May, 2011
CO2 storage in subsurface reservoirs 3
Slide 136-7 May 2011, CCS master course University of Zagreb
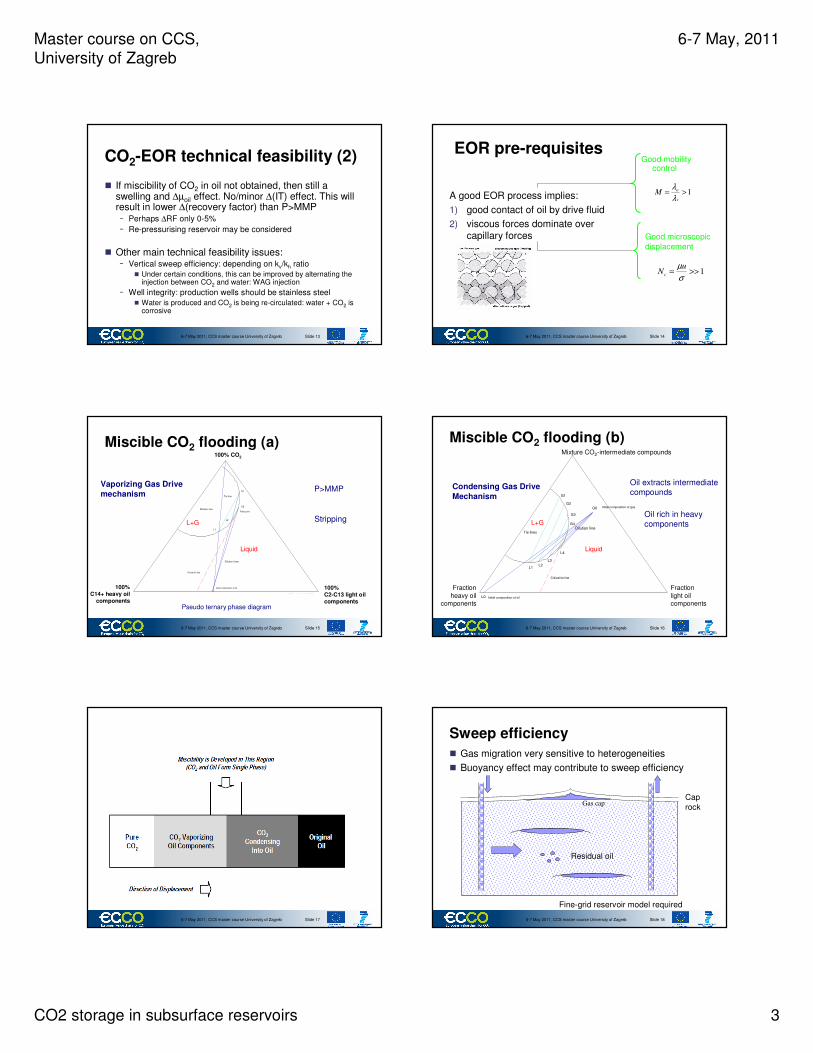
CO2-EOR technical feasibility (2)
� If miscibility of CO2 in oil not obtained, then still a swelling and ∆µoil effect. No/minor ∆(IT) effect. This will result in lower ∆(recovery factor) than P>MMP
− Perhaps ∆RF only 0-5%
− Re-pressurising reservoir may be considered
� Other main technical feasibility issues:− Vertical sweep efficiency: depending on kv/kh ratio
� Under certain conditions, this can be improved by alternating the injection between CO2 and water: WAG injection
− Well integrity: production wells should be stainless steel� Water is produced and CO2 is being re-circulated: water + CO2 is
corrosive
Slide 146-7 May 2011, CCS master course University of Zagreb
EOR pre-requisites
A good EOR process implies:
1) good contact of oil by drive fluid
2) viscous forces dominate over capillary forces
Good mobility control
1>=c
oM
λ
λ
1>>=σ
µuN
c
Good microscopicdisplacement
Slide 156-7 May 2011, CCS master course University of Zagreb
Pseudo ternary phase diagram
P>MMPVaporizing Gas Drive
mechanism
Stripping
U2
Plate point
100% mole CO2
100% mole light oil (C2-C13)100% mole heavy oil (C14+)
Initial composition of oil
Dilution lines
Tie line
Critical tie line
U1
L1
L2
Dilution line
Miscible CO2 flooding (a)
100%C14+ heavy oil
components
L+G
Liquid
100%C2-C13 light oilcomponents
100% CO2
Slide 166-7 May 2011, CCS master course University of Zagreb
G2
Intemediate
Heavy
Initial composition of oil
Tie lines
G1
L1L2
Light
Initial composition of gas
L0
G0
Dilution line
Critical tie line
L3
G3
L4
G4
Oil rich in heavy components
Condensing Gas Drive
Mechanism
Oil extracts intermediate compounds
Miscible CO2 flooding (b)
Fractionheavy oil
components
Fractionlight oilcomponents
Mixture CO2-intermediate compounds
L+G
Liquid
Slide 176-7 May 2011, CCS master course University of Zagreb Slide 186-7 May 2011, CCS master course University of Zagreb
Gas cap
Fine-grid reservoir model required
Residual oil
Cap rock
Sweep efficiency
� Gas migration very sensitive to heterogeneities
� Buoyancy effect may contribute to sweep efficiency
Master course on CCS, University of Zagreb
6-7 May, 2011
CO2 storage in subsurface reservoirs 4
Slide 196-7 May 2011, CCS master course University of Zagreb
Injection strategy
� Continuous injection
� WAG/WACO water-alternating CO2
− More stability for flood
− Less use of expensive CO2
� May not be relevant if CO2 storage provides income
3-fluid relpermsHysteresis
A lot of circulation of CO2, separation and re-injection
Typically, gross volume of CO2≈2* net volume (purchased CO2)
Slide 206-7 May 2011, CCS master course University of Zagreb
Continuous vs. WAG injection (1)
Slide 216-7 May 2011, CCS master course University of Zagreb
Continuous vs. WAG injection (2)
� Vertical sweep efficiency much improved due to WAG
∆recoveryWAG
∆CO2-injWAG
Slide 226-7 May 2011, CCS master course University of Zagreb
Continuous vs. WAG injection (3)
� WAG initially lower qoil, then sustained higher qoil
Onset of CO2
injection
Slide 236-7 May 2011, CCS master course University of Zagreb
Continuous vs. WAG injection (4)
� Note higher water production of WAG: ∆cost
Slide 246-7 May 2011, CCS master course University of Zagreb
Simplified CO2-EOR production
facility diagram (Austell, 2009)
Master course on CCS, University of Zagreb
6-7 May, 2011
CO2 storage in subsurface reservoirs 5
Slide 256-7 May 2011, CCS master course University of Zagreb
Gas / Oil / Water separator
Slide 266-7 May 2011, CCS master course University of Zagreb
Multi-stage separation
Slide 276-7 May 2011, CCS master course University of Zagreb
CO2 separation and injection at
Szank field, Hungary
Slide 286-7 May 2011, CCS master course University of Zagreb
SACROC, KMCO2 Snyder, Texas, USA
� CO2-recycling facility
− onshore solution
Slide 296-7 May 2011, CCS master course University of Zagreb
Pailin Field, Unocal Thailand
� CO2-recycling facility
� Offshore solution to meet contractual gas production requirements
Slide 306-7 May 2011, CCS master course University of Zagreb
CO2-EOR: geochemical
complications in reservoir
� Asphaltene precipitation in reservoir (pore clogging) and production wells
� Dissolution of rock (CaCO3) and subsequent re-precipitation in carbonate reservoirs → pore clogging
� Salt precipitation → pore clogging
Master course on CCS, University of Zagreb
6-7 May, 2011
CO2 storage in subsurface reservoirs 6
Slide 316-7 May 2011, CCS master course University of Zagreb
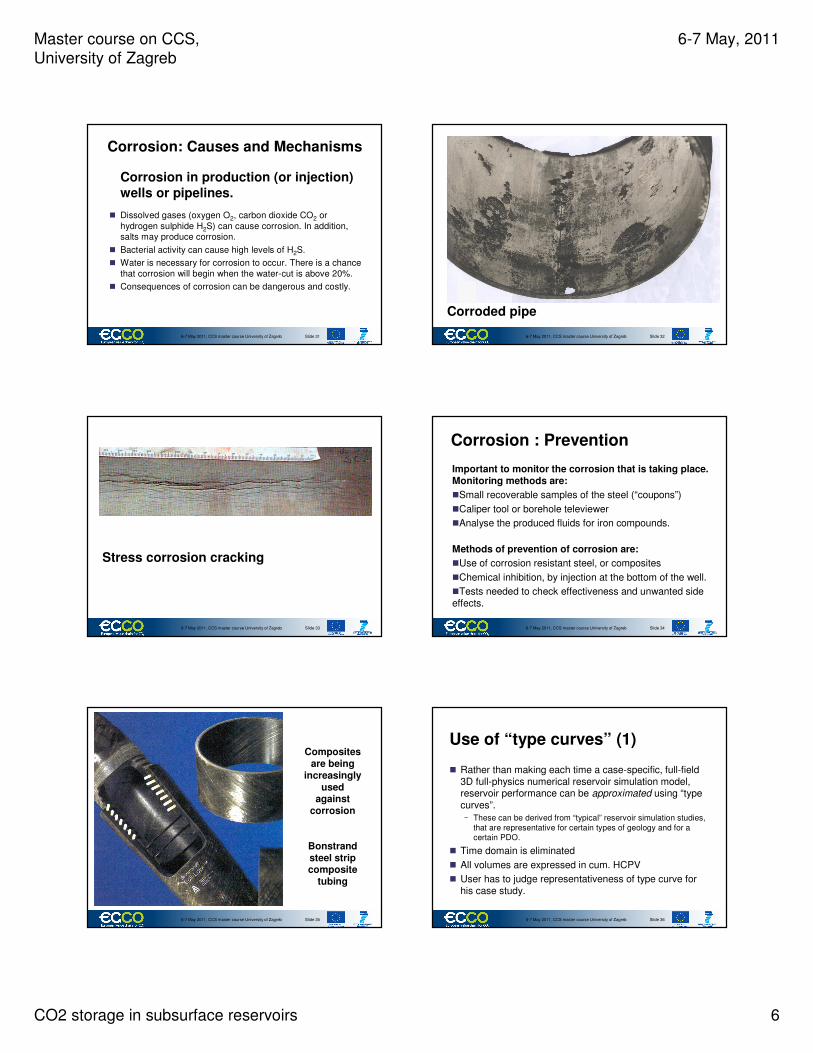
Corrosion: Causes and Mechanisms
Corrosion in production (or injection)
wells or pipelines.
� Dissolved gases (oxygen O2, carbon dioxide CO2 or hydrogen sulphide H2S) can cause corrosion. In addition, salts may produce corrosion.
� Bacterial activity can cause high levels of H2S.
� Water is necessary for corrosion to occur. There is a chance that corrosion will begin when the water-cut is above 20%.
� Consequences of corrosion can be dangerous and costly.
Slide 326-7 May 2011, CCS master course University of Zagreb
Corroded pipe
Slide 336-7 May 2011, CCS master course University of Zagreb
Stress corrosion cracking
Slide 346-7 May 2011, CCS master course University of Zagreb
Corrosion : Prevention
Important to monitor the corrosion that is taking place. Monitoring methods are:
�Small recoverable samples of the steel (“coupons”)
�Caliper tool or borehole televiewer
�Analyse the produced fluids for iron compounds.
Methods of prevention of corrosion are:
�Use of corrosion resistant steel, or composites
�Chemical inhibition, by injection at the bottom of the well.
�Tests needed to check effectiveness and unwanted side effects.
Slide 356-7 May 2011, CCS master course University of Zagreb
Composites are being
increasingly used
against corrosion
Bonstrandsteel strip composite
tubing
Slide 366-7 May 2011, CCS master course University of Zagreb
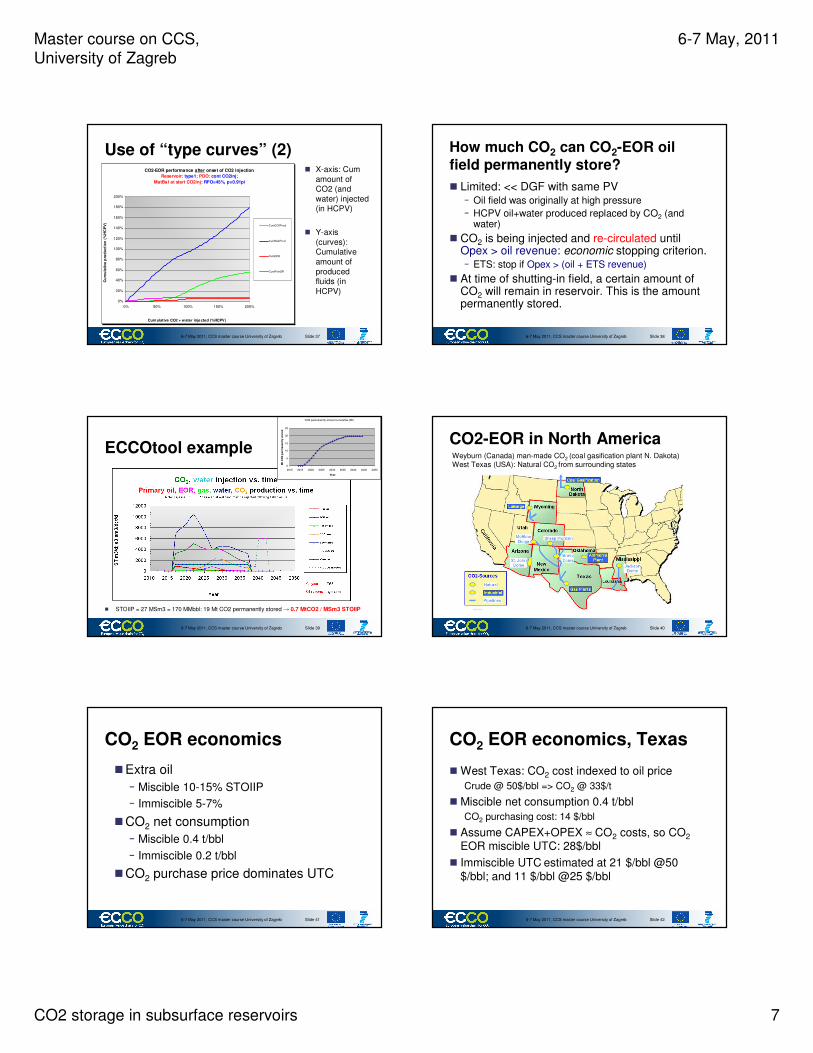
Use of “type curves” (1)
� Rather than making each time a case-specific, full-field 3D full-physics numerical reservoir simulation model, reservoir performance can be approximated using “type curves”.
− These can be derived from “typical” reservoir simulation studies, that are representative for certain types of geology and for a certain PDO.
� Time domain is eliminated
� All volumes are expressed in cum. HCPV
� User has to judge representativeness of type curve for his case study.
Master course on CCS, University of Zagreb
6-7 May, 2011
CO2 storage in subsurface reservoirs 7
Slide 376-7 May 2011, CCS master course University of Zagreb
Use of “type curves” (2)CO2-EOR performance after onset of CO2 injection
Reservoir: type1; PDO: cont CO2inj;
MatBal at start CO2inj: RFO=45%, p=0.91pi
0%
20%
40%
60%
80%
100%
120%
140%
160%
180%
200%
0% 50% 100% 150% 200%
Cumulative CO2 + w ater injected (%HCPV)
Cu
mu
lati
ve p
rod
ucti
on
(%
HC
PV
)
CumCO2Prod
CumWatProd
CumEOR
CumPrimOR
� X-axis: Cum amount of CO2 (and water) injected (in HCPV)
� Y-axis (curves): Cumulative amount of produced fluids (in HCPV)
Slide 386-7 May 2011, CCS master course University of Zagreb
How much CO2 can CO2-EOR oil
field permanently store?
� Limited: << DGF with same PV− Oil field was originally at high pressure
− HCPV oil+water produced replaced by CO2 (and water)
� CO2 is being injected and re-circulated until Opex > oil revenue: economic stopping criterion.− ETS: stop if Opex > (oil + ETS revenue)
� At time of shutting-in field, a certain amount of CO2 will remain in reservoir. This is the amount permanently stored.
Slide 396-7 May 2011, CCS master course University of Zagreb
Slide 516-7 May 2011, CCS master course University of Zagreb
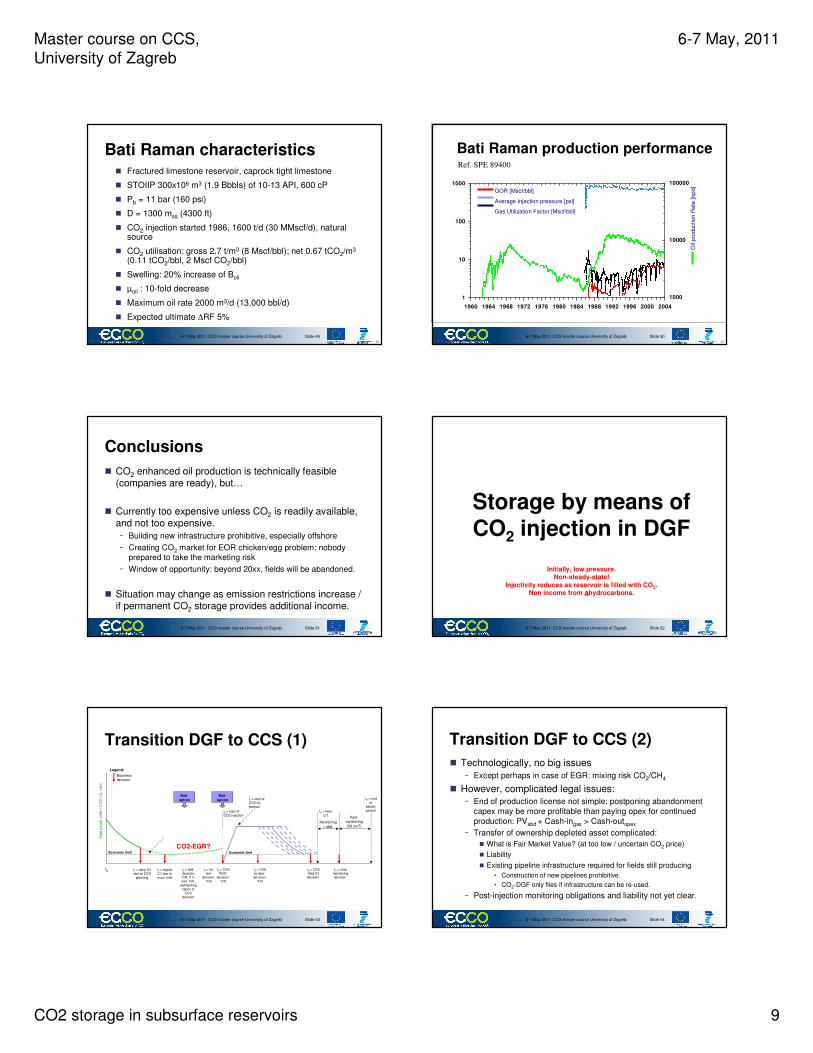
Conclusions
� CO2 enhanced oil production is technically feasible (companies are ready), but…
� Currently too expensive unless CO2 is readily available, and not too expensive.
− Building new infrastructure prohibitive, especially offshore
− Creating CO2 market for EOR chicken/egg problem: nobody prepared to take the marketing risk
− Window of opportunity: beyond 20xx, fields will be abandoned.
� Situation may change as emission restrictions increase / if permanent CO2 storage provides additional income.
Slide 526-7 May 2011, CCS master course University of Zagreb
Storage by means ofCO2 injection in DGF
Initially, low pressure.Non-steady-state!
Injectivity reduces as reservoir is filled with CO2. Non income from ∆∆∆∆hydrocarbons.
Slide 536-7 May 2011, CCS master course University of Zagreb
Economic limit
Gas
pro
d. ra
te/ C
O2
inj.
rate
t0 t1 = early C/Idue to CCS
planning
t2 = regular C/I due to econ. limit
t6 = start of CO2 injection
Legend:
Business decision
t3 = abd. decision Y/N. If Y, exit. If N,
mothballing capex or
CCS decision
Mothballing Y/N
t4 = inj. test
decision Y/N
Inj.
test
t5 = CCSPDO
decision Y/N
t8 = CCSre-devt. decision
Y/N
t7 = start of CO2 inj.plateau
Economic limit
∆NPV to be transferred as capex to
CCS operator
t9 = CCSfield C/I
decision
t10 = field C/I
Monitoring+ abd.
Post-monitoring(50 yrs?)
t11 = stopmonitoringdecision
t12 = end of
liability period
Exit option
Exit option
CO2-EGR?
Transition DGF to CCS (1)
Slide 546-7 May 2011, CCS master course University of Zagreb
Transition DGF to CCS (2)
� Technologically, no big issues− Except perhaps in case of EGR: mixing risk CO2/CH4
� However, complicated legal issues:− End of production license not simple: postponing abandonment
capex may be more profitable than paying opex for continued production: PVabd + Cash-ingas > Cash-outopex
− Transfer of ownership depleted asset complicated:
� What is Fair Market Value? (at too low / uncertain CO2 price)
� Liability
� Existing pipeline infrastructure required for fields still producing
• Construction of new pipelines prohibitive.
• CO2-DGF only flies if infrastructure can be re-used.
− Post-injection monitoring obligations and liability not yet clear.
Master course on CCS, University of Zagreb
6-7 May, 2011
CO2 storage in subsurface reservoirs 10
Slide 556-7 May 2011, CCS master course University of Zagreb
CO2-DGF physics
� Material balance equation− Normally, if field has history of linear P/Z vs. Gp
graph, then simple material balance can be used for calculating reservoir pressure as a function of cumulative CO2 injected
� Well outflow equation− Highly non-linear PVT: pseudo-pressure formulation
− Joule-Thompson effect around well: pot. problems
� Vertical Flow Performance− Calculation of ∆(FTHP-FBHP) as a function of
injection rate, ∆(FTHT-FBHT) and reservoir pressure
Slide 566-7 May 2011, CCS master course University of Zagreb
Material balance� Fundamental relationship between pressure and volume
produced
− If original volume and fluid properties are known, the depletionrate can be predicted (p as function of volume produced)
� This allows the evolution of well capacities to be estimated: q=f(p) !
− If produced volumes vs. time and pressures are known (monitoring), the original volume can be estimated
� Requirement: Calculated material balance volume = Volumetrically calculated volume
− Good cross-check in the face of many uncertainties
− Physics vs. geometry
− Compartmentalisation often not discernable on geological maps
Slide 576-7 May 2011, CCS master course University of Zagreb
Calculation of gas ultimate recovery
(simple tank model)Fig. 4- P/Z vs. Gp graph
0; 307,8
4,95; 47,4
5,8; 1,00
50
100
150
200
250
300
350
0 1 2 3 4 5 6 7
Cumulative gas produced (bcm)
P/Z
(b
ara
)
Pa/Za =
Pi/Zi + [(1-Pi/Zi)/GIIP] x UR
y = yo + (y1-y0)/(x1-x0) x
UR = (Pa/Za - Pi/Zi ) / [(1-Pi/Zi ) / GIIP]
Pa/Za - Pi/ZiUR = GIIP x
1-Pi/Zi
Pa/Za - Pi/ZiUR
1-Pi/ZiGIIP= RF = RF = 1 -
Pa/Za
Pi/Zi
= 1 -Ei
Ea
Slide 586-7 May 2011, CCS master course University of Zagreb
Deviations from straight lineWhat may cause …..
� Measured P to fall below straight line?
− Is matbal GIIP < vol. GIIP?
− Or can two still be = ?
� P to be fall above straight line?
− Is matbal GIIP > vol. GIIP?
− What if matbalGIIP = vol. GIIP?
Fig. 4- P/Z vs. Gp graph
0; 307,8
4,95; 47,4
5,8; 1,00
50
100
150
200
250
300
350
0 1 2 3 4 5 6 7
Cumulative gas produced (bcm)
P/Z
(b
ara
)
?
Slide 596-7 May 2011, CCS master course University of Zagreb
Material balance of CO2 in DGF
Z
0.0
0.2
0.4
0.6
0.8
1.0
1.2
1.4
0 100 200 300 400 500 600
p (bar)
Z
CO2
Gas
CO2 Injected
0
50
100
150
200
250
-10 0 10 20 30 40 50
CO2 Injected (Gm3)
p (
ba
r)
GRIP=CO2
GRIP=Gas
Gas Pabd
� Remaining CH4 in DGF; Z-factor of CO2 much more variable than for CH4
� Pres = weighted average of CH4-GIP and CO2-GIP
Tr = 60ºC
Slide 606-7 May 2011, CCS master course University of Zagreb
Pres = f(mixing) = f(dispersion, diffusion)
� Schematic P/Z graph for HC gas reservoir during depletion and analogous CO2reservoir during sequestration. Dashed lines represent possible transitions from depletion P/Z to CO2 P/Z based on diffusion & dispersion, and sustained production during CO2 injection (ref. McCollum, Ogden, 2006, SPE 90669)
Master course on CCS, University of Zagreb
6-7 May, 2011
CO2 storage in subsurface reservoirs 11
Slide 616-7 May 2011, CCS master course University of Zagreb
CO2 storage cap. vs. ultimate Pres
CO2 Storage Capacity versus reservoir pressure
0.0
10.0
20.0
30.0
40.0
50.0
60.0
70.0
80.0
0 50 100 150 200 250
Final Reservoir Pressure (bar)
CO
2 s
tora
ge
ca
paci
ty (
Mt) CO2 Ca pacity
Pa bandonment
Pres Init
Pres maxInj
64.4MtCO2 storage capacity @ P=Pmax=193.0
34.4GSm3CO2 storage capacity @ P=Pmax=193.0
193.0barP reservoir max with CO2 injection
41.0barP reservoir abandonment gas production
18.00GSm3Gas Initially In Place (GIIP)
Slide 626-7 May 2011, CCS master course University of Zagreb
Darcy’s law for flow through porous media
� Laminar flow assumed: not valid for turbulent flow
� Conventional units:− Darcy (D) or milliDarcy (mD)
Slide 636-7 May 2011, CCS master course University of Zagreb
Radial Diffusivity Equation - RDE (liquid flow)
� By assuming mass conservation, Darcy’s law and applying the definition of fluid compressibility, the basic DE for radial flow is
� This DE can be linearized assuming that
− µ is independent of pressure
− is small and therefore is negligible
− c is small & constant so that cp << 1
� This results in the radial diffusivity equation (RDE):
� This DE can be solved analytically, with solutions for
− Transient conditions: p = f (r,t); ∂p/∂t = g(r,t)
− Semi-steady, and steady state conditions
∂
∂r1r
kρρρρµµµµ r
∂p∂r =
∂p∂t
φφφφcρρρρ
∂p
∂r
∂p
∂r
2
∂
∂r1r r
∂p∂r =
∂p∂tk
φµφµφµφµc
Slide 646-7 May 2011, CCS master course University of Zagreb
pwf undamaged
prreservoir
pressure
pwf damaged
Pressure loss
due to skin
imp
air
ed
zon
e
wel
lbo
re
radial distance
from wellbore
imp
air
ed
zon
e
rw
Pressure distribution around well for given q
Slide 656-7 May 2011, CCS master course University of Zagreb
Inflow performance of gas wellsNever linear. The gas expands with decreasing pressure as it flows towards the well bore. Pseudo pressure function m(p) defined by
p
m(p) = 2 ∫ ( p/µ Z) dp, pb is the bubble point pressurepb
In terms of m, the inflow performance is usually assumed to take the form (Forcheimer)
m(pr) - m(pwf) = A q + Fq2 A, F constants
A is a term arising from Darcy flow, allowing for gas expansion.
F is the Forcheimer or non-Darcy coefficient, caused by turbulent flow in the formation at higher inflow rates.
Slide 666-7 May 2011, CCS master course University of Zagreb
Radial diffusivity equation for gas
� DE was linearized assuming that
− µ is independent of pressure
− is small and therefore is negligible
− c is small & constant so that p << 1
� But in case of gas:
− µ is not independent of pressure
− c is not small & not constant so that p << 1 is not fulfilled
� Using pseudo-pressure transform
� The radial diffusivity equation for gas becomes:
∂p
∂r
∂p
∂r
2
m(p) – m(pwf) = 2 ∫_
p_
pwf
pdp___
µµµµZ
∂
∂r1r r = k
φµφµφµφµc ∂m(p)∂t
∂m(p)
∂r
∂Z
∂p
1
Z
1
pc = - ≈
1
p
Master course on CCS, University of Zagreb
6-7 May, 2011
CO2 storage in subsurface reservoirs 12
Slide 676-7 May 2011, CCS master course University of Zagreb
Compare radial diffusivity eqn oil and gas
� Oil:
� Gas:
� The gas DE can now also be solved for transient and (semi-) steady state (SSS) conditions:
− Transient ( = [∂p/ ∂t]r ≠ const ) :
− SSS ( = [∂p/ ∂t]r = const ) :
∂
∂r1r
kρρρρµµµµ
r∂p∂r =
∂p∂t
φφφφcρρρρ
∂
∂r1r r = k
φµφµφµφµc ∂m(p)∂t
∂m(p)∂r
, with S’ = S + DQ
m(p) - m(pwf) =p×Q
Z×p×kh× [0,5×ln + S] + F×Q2
0,5772×CA×rw2
4A= B×Q + F×Q2
m(pi)- m(pwf) =qµµµµ
4ππππkh× [ln + 2S’]
γγγγφµφµφµφµcrw2
4kt2p
µµµµZ
Slide 686-7 May 2011, CCS master course University of Zagreb
Bottomhole Pressure vs. production rate
pwf
Production Rate
IPR curve
prreservoir pressure
drawdown
Slide 696-7 May 2011, CCS master course University of Zagreb
Inflow Performance Relationship
� Inflow is function of drawdown ∆P = Pr - Pwf
� Exercise: Plot Pwf on y-axis, Q on x-axis− Q2: How does shape of IPR curve evolve as Pr depletes?
Pri
Pwf
Q
?
Pr
1. Similarly non-linear to same Q
2. Less non-linear to same Q
3. Similarly non-linear to lower Q
4. Less non-linear to lower Q
1234
6-7 May 2011, CCS master course University of Zagreb
RESERVOIR
vertical
flow
pth
pwf pr
WELLHEAD
∆∆∆∆pDarcy + ∆∆∆∆pskin
∆∆∆∆ph
+
∆∆∆∆pfr
inflow
Pressure drops along flow path
Slide 716-7 May 2011, CCS master course University of Zagreb
VFP� Interaction between FTHP and FBHP
� All pressures are in equilibrium
� Normally, wells produce FTHP-constrained, i.e. the FTHP
is controlled at surface by setting the choke size. The FBHP (and production rates!) adapts itself accordingly.
� Therefore, to calculate the production rate, the FTHP should in principle be known.
− This requires the derivation of complex VFP “lift curves”
� Input: PVT, well geometry, steel properties, tubing diameters, etc.
Slide 726-7 May 2011, CCS master course University of Zagreb
Pressure traverse FTHP→FBHP
Master course on CCS, University of Zagreb
6-7 May, 2011
CO2 storage in subsurface reservoirs 13
Slide 736-7 May 2011, CCS master course University of Zagreb
CO2 injection: phase change in well
Wellhead
Bottomhole
∆Ps >>∆Pf
∆Ps ≈ ∆Pf
∆Ps >∆Pf
Slide 746-7 May 2011, CCS master course University of Zagreb
Slide 756-7 May 2011, CCS master course University of Zagreb
DGF module in ECCOtool
� CO2 injection in DGF is non-steady-state!− Conditions change during injection: ∂Pr / ∂t > 0.− Injectivity per well decreases as Pr builds up due to cum CO2 injected.− Isothermal: no Joule-Thompson effect in reservoir around well
� Automated decision-making to meet contractual obligations.− Well drilling, new platforms, compression, abandonment.
� Capex and opex are automatically updated for new investments.� Well drainage area & injectivity automatically updated for new wells.
XL modeldemo
Slide 766-7 May 2011, CCS master course University of Zagreb
Storage by means ofCO2 injection in AQF
High pressure.In between non-steady & steady-state.
Injectivity reduces slowly as aquifer is filled with CO2 until ≈ steady-state situation has
developed.
Slide 776-7 May 2011, CCS master course University of Zagreb
Storage in aquifers
� Usually, much less information than oil/gas fields− Information very costly
− Risk of limited storage potential
� Main concern is sealingness of formation− Risk of leakage
− But also brine displacement into overlying fresh water aquifers
� Expensive monitoring required
� Storage mechanisms:
− CO2 gas bubble, resulting in ∆paqf > 0. Leakage risk!
− Dissolution of CO2 in water
− Mineralisation of CO2 (FeCO3 etc.)
Slide 786-7 May 2011, CCS master course University of Zagreb
Sleipner
� CO2 injection in Utsira formation
� Extensive aquifer in Central North Sea
Master course on CCS, University of Zagreb
6-7 May, 2011
CO2 storage in subsurface reservoirs 14
Slide 796-7 May 2011, CCS master course University of Zagreb Slide 806-7 May 2011, CCS master course University of Zagreb
CO2 storage in Sleipner
� Extra equipment cost for CO2 compression and drilling of CO2 injection well ca $100 M.
� Until 2011 ca. 8Mt CO2 stored. � Spreading of CO2 underground mapped in various research projects.
Slide 816-7 May 2011, CCS master course University of Zagreb
CO2 storage aquifer simulation
� Ref. TNO
� 145 x 114 x 5
� 82,650 grid blocks
Slide 826-7 May 2011, CCS master course University of Zagreb
Evolution of pressure in aquifer
� CO2 injection in 2 crestal wells, 40 years− Continuous build-up of pressure
� Pressure dissipates after stopping injection− Pressure fully equalized after 10,000 years
Inj.
Post-inj.
When lines have become ≈ parallel,
≈ steady-state
Slide 836-7 May 2011, CCS master course University of Zagreb
Long-term evolution of gaseous CO2
� Spatiotemporal spread of 400 million tonnes of CO2 injected in the example structure after the 40-year injection phase.
� The initial injection of CO2 through ten injection wells positioned at the flank of the structure is followed by migration into the crest of the structure due to buoyancy.
� All the free CO2 has accumulated in the top of the structure after some 1000 years.
Slide 846-7 May 2011, CCS master course University of Zagreb
Long-term evolution of dissolved CO2
� Isosurface of the predicted CO2-saturated water distribution for the time intervals 40, 1000, 2000, 4000, 6000 and 10,000 years.
� Gaseous CO2
dissolves only very gradually, expanding the volume of CO2-saturated water
Master course on CCS, University of Zagreb
6-7 May, 2011
CO2 storage in subsurface reservoirs 15
Slide 856-7 May 2011, CCS master course University of Zagreb